Embed Size (px)
Citation preview
DRAFT for IDS Workshop, Version March 10, 2006
1
DORIS Analysis Strategies(draft presented at the IDS Workshop, Venice, Italy, March 13-15, 2006; to be finalized
after conclusion of the workshop with agreed upon recommendations)F.G. Lemoine, P. Willis, J.J. Valette, L. Soudarin
Abstract
Since the official start of the International DORIS Service in 2003, several keysteps were taken. New groups have upgraded their software packages toprocess the DORIS data for geodesy and some have submitted significantamount of results for test purposes. Several groups, including the IDS CentralBureau, have successfully combined such results to obtain combined productsfor station coordinates, geocenter motion or polar motion. However, DORISdata processing strategies are still different for each Analysis Centers,potentially creating inconsistencies and discontinuities in combined timeseries. Furthermore, only one individual solution (IGN/JPL) is currentlyavailable soon after the data are delivered and no combined products aregenerated on an operational basis. The goal of this paper is to present keyproblems that are facing Analysis Centers and Combination Centers whengenerating their products. Some recommendations will be made concerning theDORIS data analysis strategy. We will also show problems that need to beresolved in the future in order to produce accurate, reliable and timely IDSproducts, resulting from a combination of individual solutions.
Introduction
The International DORIS Service (IDS) was constituted as a service of the InternationalAssociation of Geodesy (IAG) in July 2003. The service was organized to manage datacollection, to perform intra-technique combination of geodetic products, to promote theadvancement of DORIS as a space geodetic technique, and to serve as a forum to studythe myriad technical issues that impact the quality of the geodetic products produced bythe IDS. The structure of the IDS is organized in parallel to the services of the othergeodetic techniques (SLR, VLBI, GPS). Consisting of a central bureau, distinct analysiscenters, and other users of DORIS data, the service delivers products outlined in Table 1.These include weekly and monthly time series of station positions, cumulative solutions(position and velocities), solutions for geocenter, Earth orientation parameters (EOP), andionosphere products. The main analysis centers that routinely analyze DORIS datainclude IGN/JPL, LCA, SSALTO, and INASAN. Other groups participate in analysiscampaigns or other aspects of DORIS data analysis (GRGS/CNES, Geoscience Australia,NASA GSFC, UT/CSR). The Pecny Observatory is developing the analysis of DORISdata through the use of the Bernese software. Other institutions are involved in DORISdata analysis, although not formal analysis centers, the use of DORIS data is central tothe fulfillment of their mission responsibilities. These include the CNES, NASA, andUT/CSR orbit teams who produce medium orbit precision ephemeredes (MOE’s) and
DRAFT for IDS Workshop, Version March 10, 2006
2
precise orbit ephemeredes (POE’s) for altimeter satellite missions (Topex, Jason-1, andEnvisat). Other groups (TU/Delft, Univ. Newcastle, NASA GSFC) have analyzed DORISdata in the context of different research projects. For example NASA GSFC and theGRGS have included DORIS data in the time-variable gravity solutions from satellitetracking data (pre-GRACE). It is important for the IDS to recognize that the DORIScommunity embraces more than just the current main analysis centers, and we must thinkhow we can broaden participation in the IDS, especially since we seem to be a smallercommunity than SLR or GPS.
Availability of DORIS Data and Products
It is useful to review the availability for the current set of IDS products (Table 1). WeeklySINEX files are available from six centers (Table 2), however only three groups(IGN/JPL, INASAN, and LCA) have made available a time series spanning the full 12+years over which DORIS data are available. These three long time series formed the basisfor the IDS contribution to the ITRF2005. These SINEX files include station coordinates,EOP, (and pole rates for IGN/JPL and INASAN). Monthly SINEX file solutions havebeen supplied by some groups, with the latest monthly solution from LEGOS/CLS datedMay 2005 (and Oct 2002 for IGN/JPL). Two groups supply derived geocenter timeseries: INASAN and IGN/JPL (Figure 1). Only one group supplies an EOP time series:IGN/JPL (Table 2).
DORIS ionospheric corrections are calculated routinely by the CNES during the POEprocess for each observation. The SOD now routinely delivers a supplementary data filethat contains the two frequency information as well as supplementary information such aselevation angle and local time. These files are available for Topex/Poseidon from January2001- November 2004; for Jason-1 from Aug. 2002; for Spot2/4 from January 2001, andfor Spot5 from May 2004. A comparison is shown in Figure 2 between the Total ElectronContent (TEC) for JASON in 2004 and the DORIS derived ionosphere correction. Wesee that the IGS derived solutions are all coherent with each other, and that all the GPSderived TEC values differ from the DORIS derived value by 0.2 to 0.5 TECU. At theJason altimeter frequency of 13.6 Ghz, 1 cm of range corresponds to 4.6 TECU. Thus theDORIS ionosphere product agrees with GPS to within 2 mm during the passage throughthe ionospheric equatorial anomaly for this particular comparison.
A station coordinate differences (STCD) file is available by station fromLEGOS/CLS,(monthly) IGN/JPL (weekly), and SSALTO. These files, derived from theSINEX, show the week-by-week (or month-by-month) change in the station coordinatesystems from an a priori value (Soudarin and Noll, 2006). Two of the analysis centersprovide plots which users may access (URL: http://ids.cls.fr/html/doris/ids-station-series.php3), and for collocated sites, comparisons are possible with velocities obtainedby other techniques. We illustrate the station coordinate differences from the IGN/JPLweekly series, and the LEGOS/CLS monthly series in Figure 3 for station PAQB (Tahiti).With these sorts of plots, we may make direct comparisons of the coordinate timehistories at a site and see how they differ for different time series. In this example we seethe difference in detail observable between the weekly and monthly solutions, but also
DRAFT for IDS Workshop, Version March 10, 2006
3
the difference in station coordinate RMS wrt the linear fits. The citations for these seriesare Cretaux et al. (2002), and Willis et al. (2004). If new references are available (e.g.,from J. Geodesy DORIS special issue), these should be placed on this web page.Currently, no attempt has been made to insure that the a priori coordinates are the samebetween ACS, nor that the a priori coordinates of successive stations in the same DORISsites are the compatible with the DORIS-DORIS geodetic local ties as provided by SIMB(and regularly updated).
The DORIS data centers do not archive any orbit products for any DORIS satellite. Theonly orbits available are for very few Jason orbits from LCA in sp1 format. The trueprecise orbits for the altimetric satellites (Jason-1, Topex/Poseidon, Envisat) are based onmultitechnique solutions (SLR+DORIS, or GPS+SLR, or GPS+SLR+DORIS) or GPSreduced-dynamic analyses and are available elsewhere (e.g. for those who are membersof the Ocean Surface Topography Mission (OSTM) or Envisat POD teams). No orbits areavailable at the IDS data centers for the Spot satellites. No comparison of SPOT orbitswas ever conducted between Analysis Centers.
It is instructive to review the availability of raw DORIS data at the CDDIS. Obviouslythe DORIS data cannot be analyzed by the analysis centers until the data are delivered tothe data centers by the CNES. This information is summarized in Figure 4. At the time ofthe last DORIS workshop (May 2004) typical delays were 30 days for Jason-1, Spot2,Spot4 and Spot5, and 50 days for Envisat. Presently, the DORIS data are deliveredtypically in under 30 days, with the delivery of raw data for Envisat showing a notableimprovement since mid-2004, following the recommendations in the previous IDSWorkshop.
The product delivery schedule for the period 2002.5 to 2006 is shown in Figure 5. Wecan see that with the exception of IGN/JPL, INASAN and LEGOS/CLS deliver their timeseries (all 12 years) all at once, rather than with regular deliveries. The mode ofoperation, partially at least is to recompute the series for special deliveries (analysiscampaigns, ITRF2005). An issue we must face as the IDS is how we transition to a moreoperational service (continuous and regular delivery of products on a routine basis), andhow many centers can participate on this activity (Do the centers have the manpower andscripts available for this regular effort? How long would it take them to achieve thisgoal?). A related issue is what standards we wish to define for this more regularprocessing by the analysis centers.
In Figure 6, we illustrate the DORIS data and product downloads by IP network source.The bulk of the product downloads come three countries: France, Germany and theRussian Federation. After the DORIS workshop we may ask the CDDIS to specify thequantity and source of product downloads by product type (2002campaign,2003campaign, eop, geoc, iono, orbits, sinex_global, sinex_series).
The DORIS system has undergone notable evolution and improvement since 1992. Wecan see this in the reprocessed RMS of fit for both Topex/Poseidon and Spot-2. In Figure7 we illustrate the DORIS RMS of fit using two processing standards at NASA GSFC:
DRAFT for IDS Workshop, Version March 10, 2006
4
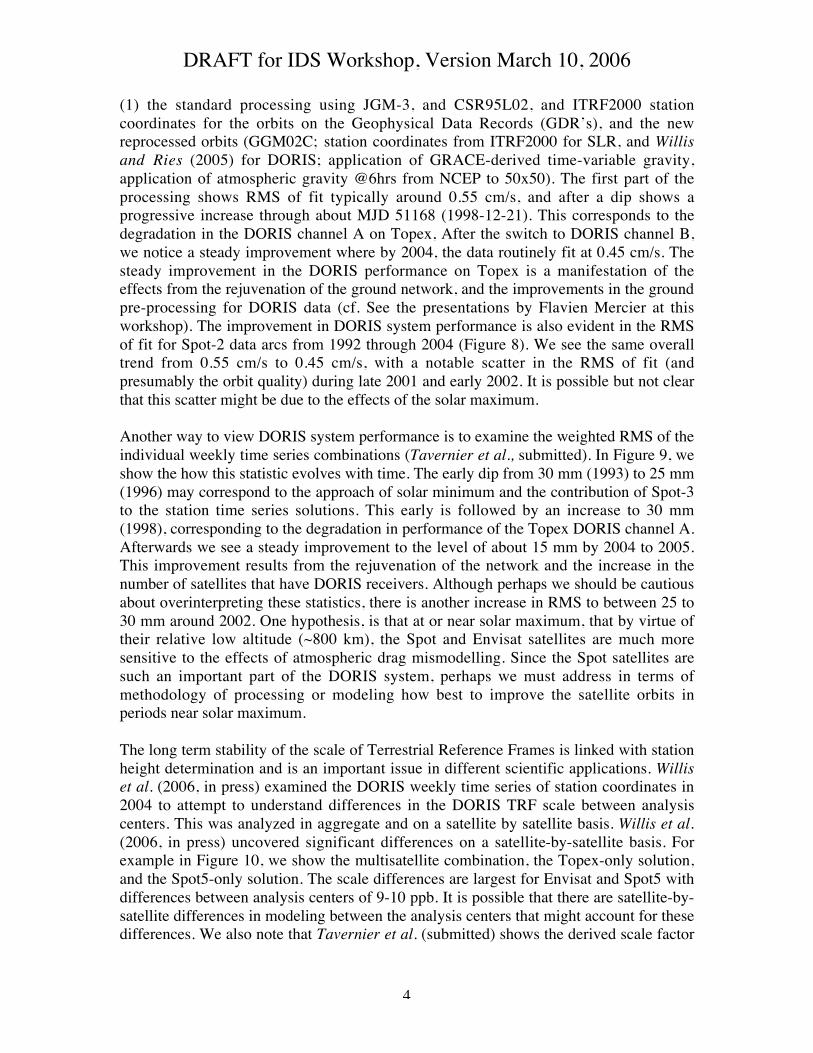
(1) the standard processing using JGM-3, and CSR95L02, and ITRF2000 stationcoordinates for the orbits on the Geophysical Data Records (GDR’s), and the newreprocessed orbits (GGM02C; station coordinates from ITRF2000 for SLR, and Willisand Ries (2005) for DORIS; application of GRACE-derived time-variable gravity,application of atmospheric gravity @6hrs from NCEP to 50x50). The first part of theprocessing shows RMS of fit typically around 0.55 cm/s, and after a dip shows aprogressive increase through about MJD 51168 (1998-12-21). This corresponds to thedegradation in the DORIS channel A on Topex, After the switch to DORIS channel B,we notice a steady improvement where by 2004, the data routinely fit at 0.45 cm/s. Thesteady improvement in the DORIS performance on Topex is a manifestation of theeffects from the rejuvenation of the ground network, and the improvements in the groundpre-processing for DORIS data (cf. See the presentations by Flavien Mercier at thisworkshop). The improvement in DORIS system performance is also evident in the RMSof fit for Spot-2 data arcs from 1992 through 2004 (Figure 8). We see the same overalltrend from 0.55 cm/s to 0.45 cm/s, with a notable scatter in the RMS of fit (andpresumably the orbit quality) during late 2001 and early 2002. It is possible but not clearthat this scatter might be due to the effects of the solar maximum.
Another way to view DORIS system performance is to examine the weighted RMS of theindividual weekly time series combinations (Tavernier et al., submitted). In Figure 9, weshow the how this statistic evolves with time. The early dip from 30 mm (1993) to 25 mm(1996) may correspond to the approach of solar minimum and the contribution of Spot-3to the station time series solutions. This early is followed by an increase to 30 mm(1998), corresponding to the degradation in performance of the Topex DORIS channel A.Afterwards we see a steady improvement to the level of about 15 mm by 2004 to 2005.This improvement results from the rejuvenation of the network and the increase in thenumber of satellites that have DORIS receivers. Although perhaps we should be cautiousabout overinterpreting these statistics, there is another increase in RMS to between 25 to30 mm around 2002. One hypothesis, is that at or near solar maximum, that by virtue oftheir relative low altitude (~800 km), the Spot and Envisat satellites are much moresensitive to the effects of atmospheric drag mismodelling. Since the Spot satellites aresuch an important part of the DORIS system, perhaps we must address in terms ofmethodology of processing or modeling how best to improve the satellite orbits inperiods near solar maximum.
The long term stability of the scale of Terrestrial Reference Frames is linked with stationheight determination and is an important issue in different scientific applications. Williset al. (2006, in press) examined the DORIS weekly time series of station coordinates in2004 to attempt to understand differences in the DORIS TRF scale between analysiscenters. This was analyzed in aggregate and on a satellite by satellite basis. Willis et al.(2006, in press) uncovered significant differences on a satellite-by-satellite basis. Forexample in Figure 10, we show the multisatellite combination, the Topex-only solution,and the Spot5-only solution. The scale differences are largest for Envisat and Spot5 withdifferences between analysis centers of 9-10 ppb. It is possible that there are satellite-by-satellite differences in modeling between the analysis centers that might account for thesedifferences. We also note that Tavernier et al. (submitted) shows the derived scale factor

DRAFT for IDS Workshop, Version March 10, 2006
5
of the individual weekly time series combinations from 1993 to 2005. IGN/JPLconsistently has scale factors of –15 to 25 mm, whereas LEGOS/CLS has scale factorsfrom 25 to 45 mm (Figure 11). One of the critical issues that the IDS will need to addressin the coming year is to understand the nature of the differences by performing asystematic inventory of the measurement and force modeling for all analysis centers, andto perform satellite-by-satellite comparisons over a specific time frame.
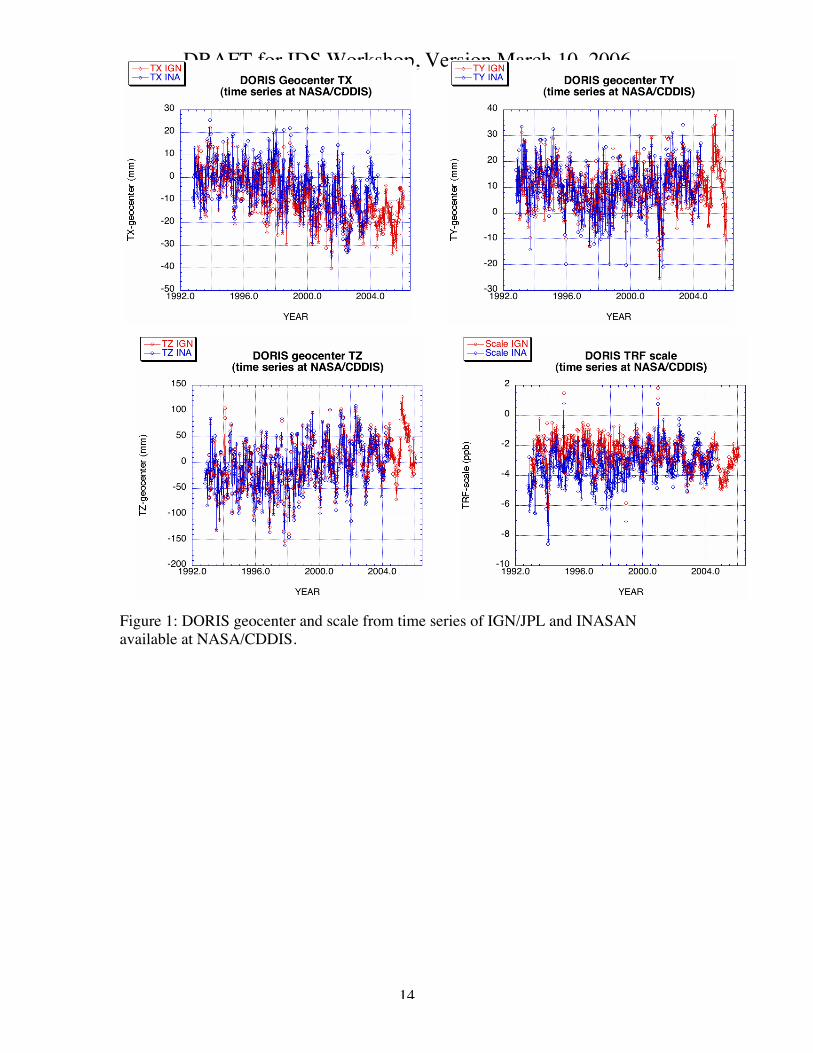
Another issue which may touch on this issue of scale discrepancies are the recovery ofthe DORIS estimates for geocenter. Geocenter comparisons are discussed in Feissel-Vernier et al. (submitted). (See example series in Figure 1). In the equatorial directionsthere is a reasonable agreement between the DORIS results and the expected geophysicalsignals. In the axial or north-south direction, the signal recovered by DORIS is large by afactor of ten over the expected geophysical signals with amplitudes of up to 10 cm. TheDORIS Z geocenter recoveries are much larger than what is obtained with SLR.
Action items from 2004 Position Paper: Review
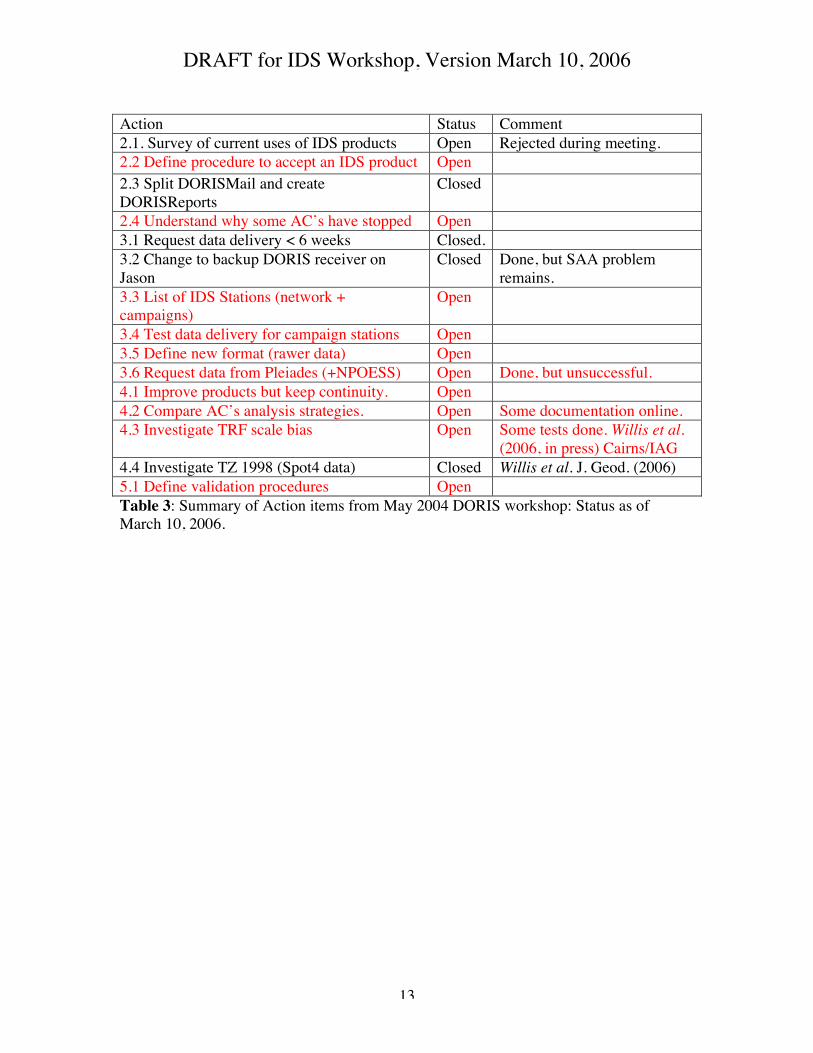
At the 2004 IDS workshop, May 3-4, 2004, Willis and Cretaux (2004) presented aposition paper on DORIS data analysis strategies. It is useful to review the action itemsand recommendations from this meeting, and discuss if they are still relevant, and howwe may close them. We summarize below the recommendations from the workshop thatremain open in Table 3, and list the full text of the recommendations below. In the courseof this 2006 workshop, we must decide which of these 2004 recommendations are stillrelevant and should be carried forward.
Recommendation 2.2: A procedure must be explicitly stated to formally accept a DORISproduct as such, including a technical feasibility study, and a validation component. Weshould presently start assuming that no such IDS product exists presently and to generatethem by a standard procedure.
A procedure could easily be defined to do routine weekly combinations easily fromIGN/JPL, INASAN, LEGOS/CLS, if all AC’s agreed to submit Sinex files within aspecified time frame. Could we ask INASAN to change some part of their analysisstrategy so as to differentiate the results from the two AC’s that use Gipsy?
Recommendation 2.4: It is important that more Analysis Centers participate in thegeneration of IDS products. Groups wanting to participate must receive some help froman existing AC. It is also important to understand why some groups stop deliveringresults and to encourage them to resubmit new results.
Recommendation 3.3: CNES in liaison of the IGN/SIMB and the chair of the stationselection group, should maintain a list of stations that participate in the IDS, through theDORIS permanent network or through DORIS campaigns as organized by the StationSelections Group.
DRAFT for IDS Workshop, Version March 10, 2006
6
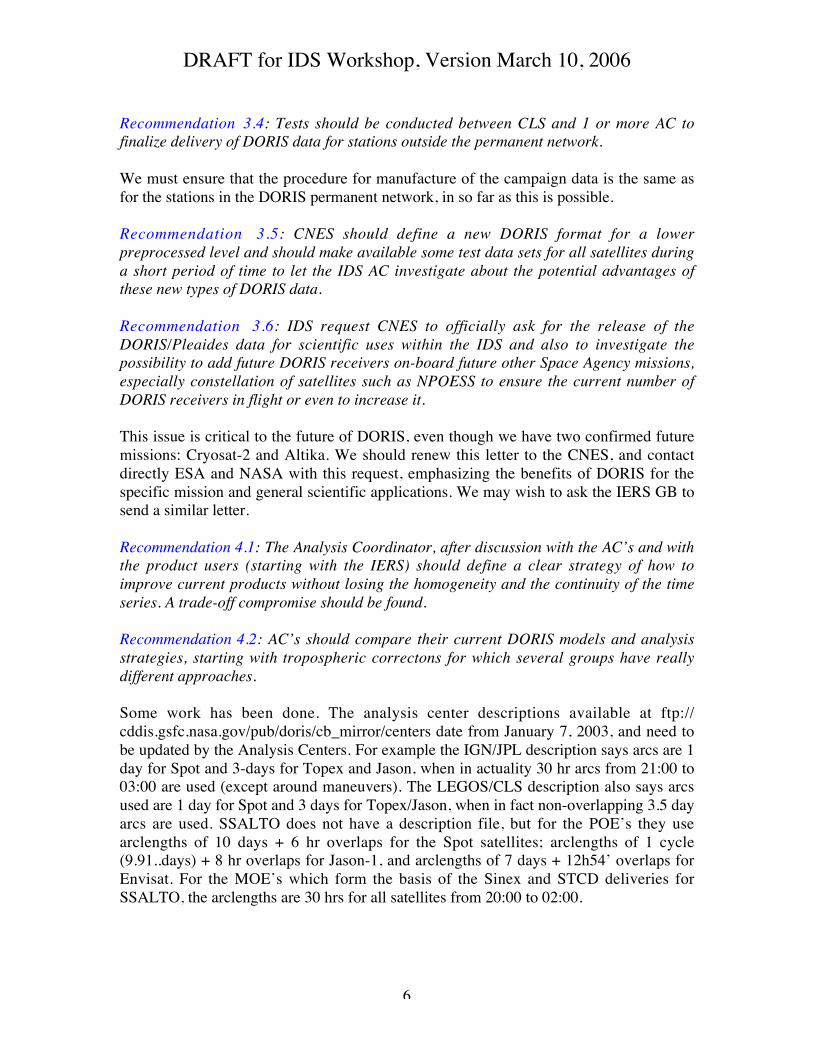
Recommendation 3.4: Tests should be conducted between CLS and 1 or more AC tofinalize delivery of DORIS data for stations outside the permanent network.
We must ensure that the procedure for manufacture of the campaign data is the same asfor the stations in the DORIS permanent network, in so far as this is possible.
Recommendation 3.5: CNES should define a new DORIS format for a lowerpreprocessed level and should make available some test data sets for all satellites duringa short period of time to let the IDS AC investigate about the potential advantages ofthese new types of DORIS data.
Recommendation 3.6: IDS request CNES to officially ask for the release of theDORIS/Pleaides data for scientific uses within the IDS and also to investigate thepossibility to add future DORIS receivers on-board future other Space Agency missions,especially constellation of satellites such as NPOESS to ensure the current number ofDORIS receivers in flight or even to increase it.
This issue is critical to the future of DORIS, even though we have two confirmed futuremissions: Cryosat-2 and Altika. We should renew this letter to the CNES, and contactdirectly ESA and NASA with this request, emphasizing the benefits of DORIS for thespecific mission and general scientific applications. We may wish to ask the IERS GB tosend a similar letter.
Recommendation 4.1: The Analysis Coordinator, after discussion with the AC’s and withthe product users (starting with the IERS) should define a clear strategy of how toimprove current products without losing the homogeneity and the continuity of the timeseries. A trade-off compromise should be found.
Recommendation 4.2: AC’s should compare their current DORIS models and analysisstrategies, starting with tropospheric correctons for which several groups have reallydifferent approaches.
Some work has been done. The analysis center descriptions available at ftp://cddis.gsfc.nasa.gov/pub/doris/cb_mirror/centers date from January 7, 2003, and need tobe updated by the Analysis Centers. For example the IGN/JPL description says arcs are 1day for Spot and 3-days for Topex and Jason, when in actuality 30 hr arcs from 21:00 to03:00 are used (except around maneuvers). The LEGOS/CLS description also says arcsused are 1 day for Spot and 3 days for Topex/Jason, when in fact non-overlapping 3.5 dayarcs are used. SSALTO does not have a description file, but for the POE’s they usearclengths of 10 days + 6 hr overlaps for the Spot satellites; arclengths of 1 cycle(9.91..days) + 8 hr overlaps for Jason-1, and arclengths of 7 days + 12h54’ overlaps forEnvisat. For the MOE’s which form the basis of the Sinex and STCD deliveries forSSALTO, the arclengths are 30 hrs for all satellites from 20:00 to 02:00.

DRAFT for IDS Workshop, Version March 10, 2006
7
Recommendation 4.3: The IDS in collaboration with the ITRF Product Center shouldinvestigate if the scale bias between DORIS solutions and the ITRF is inherent to theDORIS system or if its inherent to a specific DORIS software. It should investigatetechnical ways to compensate for such effects (by using a posteriori satellite or groundantenna offset).
Recommendation 5.1: The Analysis Coordinator should propose validation proceduresbefore accepting any IDS individual solutions and IDS product, either internal throughcombination, or external using any type of information. These validation proceduresshould be an important part of the IDS product definition.
Central issues, recommendations, and action items
Recommendation 2006.1.0:We have seen that it is the number of satellites that critically affects the quality of theDORIS results. The DORIS satellites currently on orbit are rapidly aging, and we mustface the possibility that a portion of the satellites currently on orbit may cease operationsin the near future (see Figure 12). We note that we have been extremely lucky with Spot-2, that has been operational since 1990 (for 16 years!). We should renew our request tothe CNES for the Pleiades data, and look for other flights of opportunity. At anappropriate stage, we should consider the intercession of the IERS GB.
Recommendation 2006.2.0: Conduct measurement and force model inventory. Weneed to conduct a detailed inventory of the measurement and force modelingimplemented at the analysis centers. A part of this effort will be to ascertain whether theAC’s follow the IERS2003 recommendations (eg., Earth tides, precession, nutation). Theinventory should also include whether the DORIS antenna corrections are applied fromthe data or calculated by the analysis package (GEODYN, ZOOM, GYPSY, GINS). Thisshould also include the macromodel values used for the different satellites, and what typeof opr’s are adjusted.
Recommendation 2006.2.1: Analysis centers should update their analysisdescription forms on file at the CDDIS and IDS central servers. The analysis centerforms should be updated reflect what the centers submitted in 2005 either for the IAG orfor the ITRF2005. We must be able to document exactly the models used for theITRF2005 submissions.
Recommendation 2006.3.0: New POD Standards for the IDS. A subcommittee shouldexamine the POD standards used presently for GRACE, Topex, Jason, and Envisat andrecommend what models the IDS should use. The key would be to update to improvedstandards, but allow sufficient flexibility. For example one recommendation might be touse a GRACE era gravity model, without specifying which one (GGM01C, GGM02C orthe GFZ/GRGS models). The Analysis Coordinator will compare these recommendationswith current processing at the centers and through contact with the AC’s assess the

DRAFT for IDS Workshop, Version March 10, 2006
8
feasibility of their implementation, and determine a schedule and mode ofimplementation taking into account Recommendation 4.1 above.
Recommendation 2006.4.0: Decide orbit format for analysis campaigns(Recommendation 2006.4.1) Decide standard for exchange of orbits between AC’s andCombination center: Sp1, Sp3, POE? The issue is for simple orbit differences, we mayrely on ECF formats (sp1, sp3). However if we wish to pass through external data (SLR,altimeter crossovers), we need to rotate the orbits to inertial coordinates in order to passthem through an orbit determination analysis package and obtain independent SLR andcrossover fits (Topex, Jason, Envisat).
Recommendation 2006.4.1: Conduct analysis campaign for TRF scale and geocentercomparisons. Conduct a focused analysis campaign (2003-2004? the period with themost satellites) available. We should set standards for the analysis campaign (whichmodels to use) in order to minimize the free variables in the analysis. We will ask theanalysis centers to submit orbits for all satellites, weekly sinex series, as well assummaries of orbit determination results (RMS of fit, internal overlaps if available, Nobsetc). We will have a better idea of the permutations to try after Recommendations2006.2.0 and 2006.3.0 are completed, but at a minimum, the centers should try solutionswith the data supplied corrections and calculating their own measurement offsetcorrections (if possible). If possible, perform external comparisons for Topex, Jason, andEnvisat with SLR and with altimeter crossovers. Single-satellite solutions or solutionsusing multi-techniques should also be part of the whole test.
Recommendation 2006.5.0: Conduct analysis campaign for Jason-1 SAA modelvalidation. In order to validate the SAA model (Lemoine and Capdeville, this workshop)for Jason-1, we must conduct a campaign to assess its impact on geodetic products(stations, EOP, scale). What is the minimum period necessary for this analysis? How willwe implement this model?
Recommendation 2006.6.0: Evolve IDS towards an operational service. Since dataare available within 30 days, ask analysis centers to deliver products to combinationcenter within another 30 days. Ask combination center to create combined product withina reasonable delay. Is this delivery schedule sensible given people’s resources? How doesit compare to ILRS and IGS? Should we wait to initiate this until after the POD standardsfor the centers have been updated?
Recommendation 2006.7.0: Request submission of ionosphere files for years prior to2000-2001. Is this feasible? How much work is involved? What delays should beexpected?
Recommendation 2006.7.1: Publicize availability of ionosphere data.
DRAFT for IDS Workshop, Version March 10, 2006
9
Recommendation 2006.8.0: Ask analysis centers to define arcs so that overlaps areavailable. Conduct orbit overlaps on a routine basis, and make overlap results available toIDS on routine basis in plot and tabular form.
Recommendation 2006.9.0: Harmonize a priori positions in all STCD files:Investigate how to harmonize a priori positions in all STCD files and possibleconsistency with geodetic local ties provided by SIMB
Recommendation 2006.9.1: Ensure that all AC’s can create STCD files andassociated plots. Provide scripts to all groups to create GIF files (plots) from STCD filesand update the Web to include all available results (plots from all solutions and from allACs).
Recommendation 2006.9. Publicize availability of STCD files and plots amongthe geophysics community (e.g., IGSMAIL, SLRMAIL, other means).

DRAFT for IDS Workshop, Version March 10, 2006
10
Other issues:
1. EOP and EOP-rates (proposal from P Willis).2. Analysis Campaign for time-variable gravity estimation from
satellites with DORIS data.3. International Polar Year.
Summary and conclusions
DORIS as a geodetic observing system is at a crossroads. It has achieved a level ofmaturity in the quality of the products that it produces. We must focus on the technicalissues (such as modeling differences with analysis centers) and operational issues in ordercontinue to improve the contributions that DORIS might make to satellite geodesy.
References
Feissel et al. submitted.Lemoine, J.M. and Capdeville, this workshop.Soudarin, L., and C. Noll, STCD (Station Coordinates Difference) format (version 1.0),February 16, 2006.Tavernier et al. submittedWillis and Cretaux, previous Position Paper, May 2004.Willis and Ries, J. Geodesy (2005)Willis et al. IAG, Cairns (in press, 2006)Willis J Geod TZ/SPOT4

DRAFT for IDS Workshop, Version March 10, 2006
11
Product Present AC Previous AC(no recentsolution)
Proposed AC CombinedProduct
Cumulativesolutions(positions/velocities)
IGN/JPLLEGOS/CLS*
INASANGeoscienceAustraliaIAA
No
Weekly series IGN/JPLINASANLEGOS/CLSSSALTO 
SODGSFC (1 yr)
GeoscienceAustraliaIAAPecny/CODE
No
Monthly series IGN/JPLINASANLEGOS/CLSSSALTO
GeoscienceAustraliaIAA
No
STCD (stationcoordinatedifferences)
IGN/JPLSSALTO
LEGOS/CLS
Geocenter IGN/JPLINASAN
No
EOP IGN/JPL LEGOS/CLS INASAN NoOrbits LEGOS/CLS NoIonosphere SSALTO No
Not available at NASA/CDDIS. ¶ Covariance information not in SINEX file sincepositions are derived from orbits that are held fixed.
Table 1: Current IDS Products (March 2006). The term “Present AC” includes thoseanalysis centers that regularly submit products; The term “Previous AC” includes thosecenters who have submitted products, but not recently; The term “Proposed AC” refers tothose centers who have expressed a willingness to participate in the IDS, but have not yetsubmitted solutions.

DRAFT for IDS Workshop, Version March 10, 2006
12
Group Software Solution Start End Files Geocenter EOP
GSC GEODYN WD02 JAN-2004 DEC-2004 104
IGN GIPSY/OASIS WD05
MD03
JAN-1993
JAN-1993
OCT-2005
OCT-2005
668
118
X X
INA GIPSY/OASIS WD05 JAN-2003 DEC-2005 1355
LCA GINS/DYNAMO WD13
MD02
JAN-1993
JAN-2003
SEP-2005
DEC-2002
664
120
SOD ZOOM WD01 JUN-2001 JUN-2001 3
SSA ZOOM WD01
MD01
JAN-2000
FEB-2001
JAN-2005
APR-2002
209
16
Table 2. SINEX time series available at the IDS Data Center. February 2006.
DRAFT for IDS Workshop, Version March 10, 2006
13
Action Status Comment2.1. Survey of current uses of IDS products Open Rejected during meeting.2.2 Define procedure to accept an IDS product Open2.3 Split DORISMail and createDORISReports
Closed
2.4 Understand why some AC’s have stopped Open3.1 Request data delivery < 6 weeks Closed.3.2 Change to backup DORIS receiver onJason
Closed Done, but SAA problemremains.
3.3 List of IDS Stations (network +campaigns)
Open
3.4 Test data delivery for campaign stations Open3.5 Define new format (rawer data) Open3.6 Request data from Pleiades (+NPOESS) Open Done, but unsuccessful.4.1 Improve products but keep continuity. Open4,2 Compare AC’s analysis strategies. Open Some documentation online.4.3 Investigate TRF scale bias Open Some tests done. Willis et al.
(2006, in press) Cairns/IAG4.4 Investigate TZ 1998 (Spot4 data) Closed Willis et al. J. Geod. (2006)5.1 Define validation procedures OpenTable 3: Summary of Action items from May 2004 DORIS workshop: Status as ofMarch 10, 2006.
DRAFT for IDS Workshop, Version March 10, 2006
14
Figure 1: DORIS geocenter and scale from time series of IGN/JPL and INASANavailable at NASA/CDDIS.

DRAFT for IDS Workshop, Version March 10, 2006
15
Figure 2: Comparison of DORIS derived vertical total electron content (VTEC) forJASON in 2004 with VTEC results from different IGS analysis centers. The displayindicates the RMS difference between each IGS center and DORIS for 2004. The unitsare TEC units (TECU). At the Jason altimeter frequency of 13.6 Ghz, 1 cm of rangecorresponds to 4.6 TECU. (from M. Pajares, April 2004-2005, IGS working group report)

DRAFT for IDS Workshop, Version March 10, 2006
16
Figure 3: Station coordinate differences (STCD) for the PAQB station from the weeklyIGN/JPL solution (available at ftp://cddis.gsfc.nasa.gov/pub/doris/products/STCD/ign03wd01/ign03wd01.STCD.paqb.gif ) and the monthly solution fromLEGOS/CLS (available at ftp://cddis.gsfc.nasa.gov/pub/doris/products/STCD/lca05md01/lca05md01.STCD.paqb.gif).

DRAFT for IDS Workshop, Version March 10, 2006
17
Figure 4: DORIS data delivery to the CDDIS.
Figure 5: SINEX file delivery delay at the CDDIS.

DRAFT for IDS Workshop, Version March 10, 2006
18
Figure 6: DORIS Data and Product Downloads at the CDDIS in 2005 by source.

DRAFT for IDS Workshop, Version March 10, 2006
19
Figure 7: Topex DORIS RMS of fit for cycles from 1992 through 1994 from processingat NASA GSFC. The first generation processing (JGM3, CSR95L02, ITRF2000) isshown in red; the new second generation processing (GGM02C, ITRF2000 + DORIScore, + time-variable gravity from GRACE) is shown in blue.
Figure 8: DORIS RMS of fit for Spot-2 from NASA GSFC processing using GGM01Sand ITRF2000.

DRAFT for IDS Workshop, Version March 10, 2006
20
Figure 9. Weighted RMS of the individual weekly time series combinations (Tavernier etal., 2006).
Figure 10: Weekly scale factor determination towards ITRF2000 using multi-satelliteSINEX solutions. GSFC (white circle), IGN/JPL (black squares), LEGOS/CLS (crosses).January – December 2004: Left (all satellites); Center (Topex); Right (Spot5) (Willis etal., 2006, in press).

DRAFT for IDS Workshop, Version March 10, 2006
21
Figure 11: Scale factor of the individual weekly time series combinations from Tavernieret al. (2006). IGN/JPL (diamonds); LEGOS/CLS (black dots); GSFC (crosses).
Figure 12: Evolution of the DORIS satellite constellation with predictions for 2006 orlater based on optimistic and pessimistic satellite survival scenarios.