Embed Size (px)
Citation preview

AuthorsAngat Sandhu
Anthony Bice
point of view
Financial Services
Don’t LeAve Me tHiS wAYtHe Seven MiSSinG inGReDientS in Life inSURAnCe CUStoMeR Retention pRoGRAMS
The Australian life insurance industry has recently experienced its highest lapse rates of the past 20 years.
This in itself would be a cause for alarm, but the impact of high lapse rates has been compounded by a spike in
claim rates, looming economic uncertainty and falling profitability (34.7% drop in industry profits in the year ended
March 20141). Moreover, these pressures come at a time when customer expectations are rapidly evolving and the
industry is grappling with enormous regulatory changes.
Even as insurers have been busy fire-fighting these changes, they have had to be selective in picking their battles.
As a result, customer retention programs have fallen victim to an over-reliance by insurers on the hope that
improving economic conditions and industry-initiated changes will address the issues.
We believe that an improved economic environment will only partly ameliorate the underlying issues and that
waiting for an industry-led solution may not leave players with much of a business to save. Sustained success will
only come by enacting a significant, proactive program that focuses on seven key ingredients. Together, these
can deliver a 3% to 5% improvement in lapse rates within three years, realising hundreds of millions of dollars in
value for insurers. Importantly, these ingredients can accelerate an insurer’s journey towards a customer-centric
organisation by helping it effectively engage with its customers and adapt to their changing needs.
In this report, we briefly explore the drivers behind the lapse problems and then outline what we believe are the
seven missing ingredients for institutions still struggling with retention issues.
WhAT ArE ThE drIvErS oF ThE rETEnTIon proBlEM?
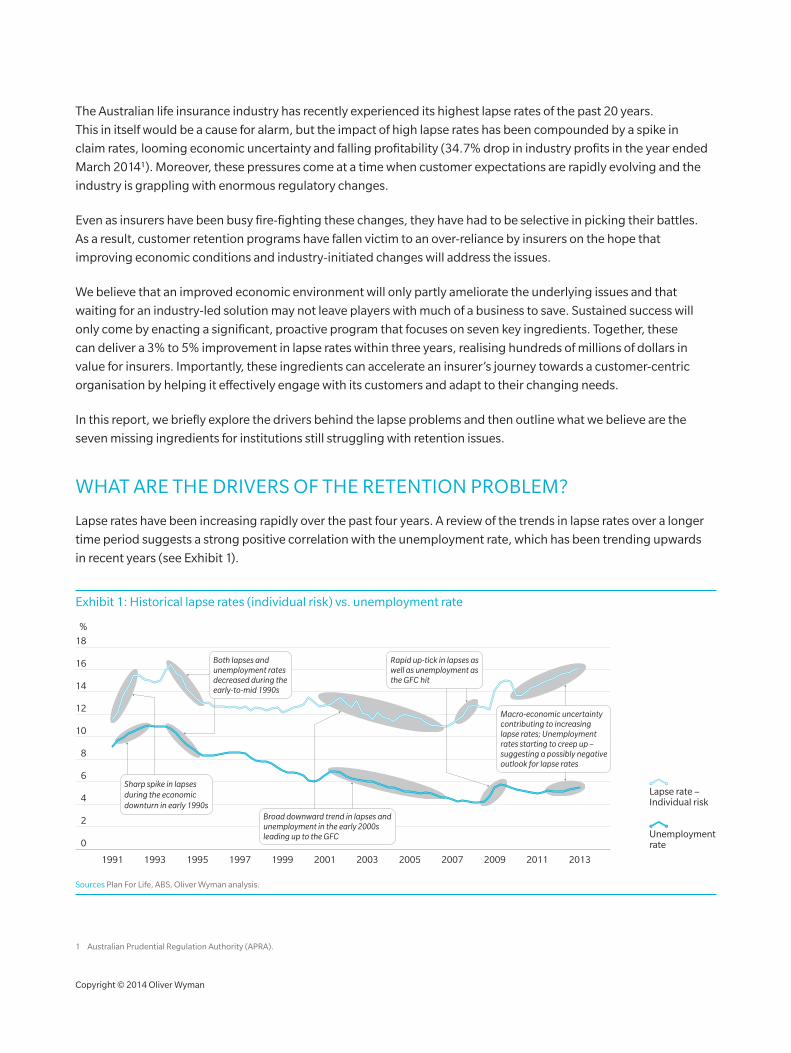
lapse rates have been increasing rapidly over the past four years. A review of the trends in lapse rates over a longer
time period suggests a strong positive correlation with the unemployment rate, which has been trending upwards
in recent years (see Exhibit 1).
Exhibit 1: historical lapse rates (individual risk) vs. unemployment rate
18
%
Unemployment rate
Lapse rate –Individual risk
1991 1993 1995 1997 1999 2001 2003 2005 2007 2009 2011 2013
16
14
12
10
8
6
4
2
0
Sharp spike in lapsesduring the economicdownturn in early 1990s
Rapid up-tick in lapses aswell as unemployment asthe GFC hit
Macro-economic uncertainty contributing to increasinglapse rates; Unemploymentrates starting to creep up – suggesting a possibly negativeoutlook for lapse rates
Broad downward trend in lapses andunemployment in the early 2000s leading up to the GFC
Both lapses and unemployment rates decreased during theearly-to-mid 1990s
Sources plan For life, ABS, oliver Wyman analysis.
1 Australian prudential regulation Authority (AprA).
Copyright © 2014 oliver Wyman
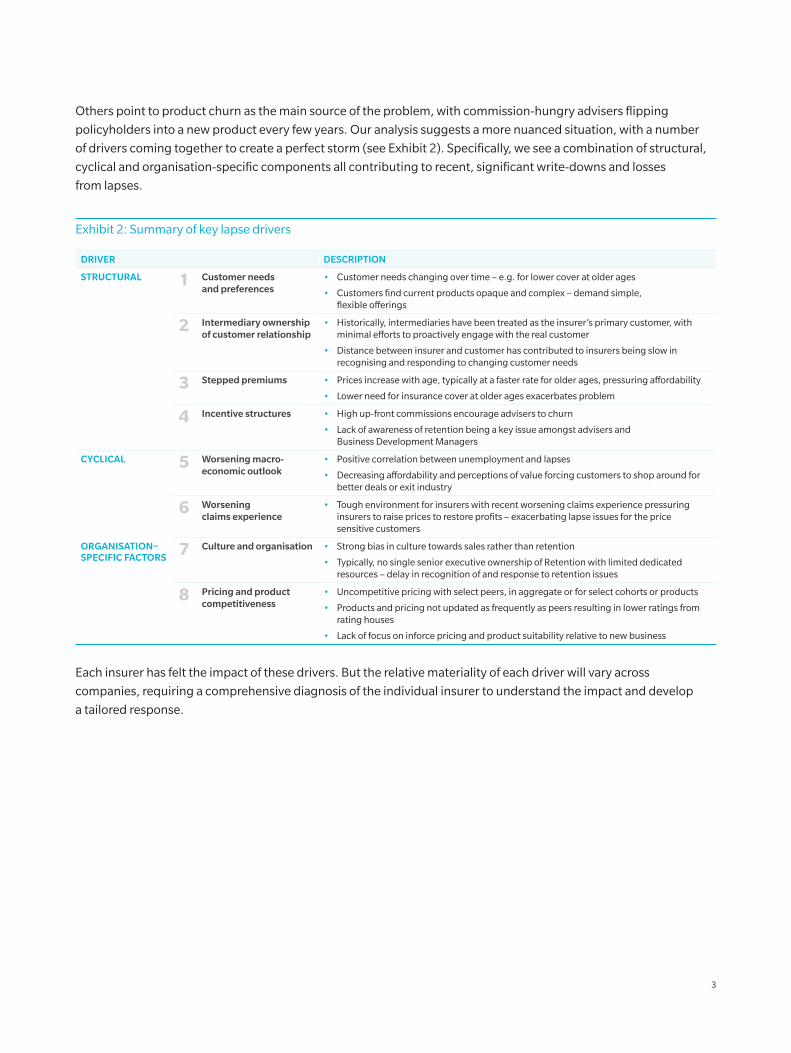
others point to product churn as the main source of the problem, with commission-hungry advisers flipping
policyholders into a new product every few years. our analysis suggests a more nuanced situation, with a number
of drivers coming together to create a perfect storm (see Exhibit 2). Specifically, we see a combination of structural,
cyclical and organisation-specific components all contributing to recent, significant write-downs and losses
from lapses.
Exhibit 2: Summary of key lapse drivers
DRIVER DESCRIPTION
STRUCTURAL 1 Customer needs and preferences
• Customer needs changing over time – e.g. for lower cover at older ages
• Customers find current products opaque and complex – demand simple, flexible offerings
2 Intermediary ownership of customer relationship
• historically, intermediaries have been treated as the insurer’s primary customer, with minimal efforts to proactively engage with the real customer
• distance between insurer and customer has contributed to insurers being slow in recognising and responding to changing customer needs
3 Stepped premiums • prices increase with age, typically at a faster rate for older ages, pressuring affordability
• lower need for insurance cover at older ages exacerbates problem
4 Incentive structures • high up-front commissions encourage advisers to churn
• lack of awareness of retention being a key issue amongst advisers and Business development Managers
CYCLICAL 5 Worsening macro-economic outlook
• positive correlation between unemployment and lapses
• decreasing affordability and perceptions of value forcing customers to shop around for better deals or exit industry
6 Worsening claims experience
• Tough environment for insurers with recent worsening claims experience pressuring insurers to raise prices to restore profits – exacerbating lapse issues for the price sensitive customers
ORgANISATION–SPECIfIC fACTORS
7 Culture and organisation • Strong bias in culture towards sales rather than retention
• Typically, no single senior executive ownership of retention with limited dedicated resources – delay in recognition of and response to retention issues
8 Pricing and product competitiveness
• Uncompetitive pricing with select peers, in aggregate or for select cohorts or products
• products and pricing not updated as frequently as peers resulting in lower ratings from rating houses
• lack of focus on inforce pricing and product suitability relative to new business
Each insurer has felt the impact of these drivers. But the relative materiality of each driver will vary across
companies, requiring a comprehensive diagnosis of the individual insurer to understand the impact and develop
a tailored response.
3
ThE SEvEn MISSIng IngrEdIEnTS
The complexity of the operating environment and diversity of views on the key drivers of lapses has resulted in a
range of responses from insurers. The more successful players detected the key issues early and now have relatively
mature programs providing material benefits; however, recent lapse performance across the industry suggests that
very few players fall into this category. We believe that most insurers have some form of customer retention program
in place but lack one or more of the seven key ingredients for a sustainable solution. Together, these ingredients can
help insurers migrate from tactical fire-fighting efforts that barely contain the damage to a sustainable operating
model that creates and preserves value.
1. InSIghTFUl rooT-CAUSE dIAgnoSIS rAThEr ThAn CoMplEx STATISTICAl AnAlySIS
Most insurers typically start with a detailed actuarial lapse experience investigation to understand the drivers and
causes of poor lapse experience. These investigations can be a valuable source of information and insights, but
too often are narrow in their focus and technical in their description. our experience suggests that a much broader
framework should be used for diagnosis and that the results and subsequent discussions should focus more on
the “why” and “so what”, rather than a description of the findings. In the framework below, we outline some key
questions to ask and dimensions to analyse (see Exhibit 3). The list is not exhaustive, but the categories are broad
enough to begin providing a holistic and richer set of insights. Furthermore, since these areas span the business,
they have the added advantage of increasing awareness and providing an enterprise-wide lens to retention issues.
Copyright © 2014 oliver Wyman
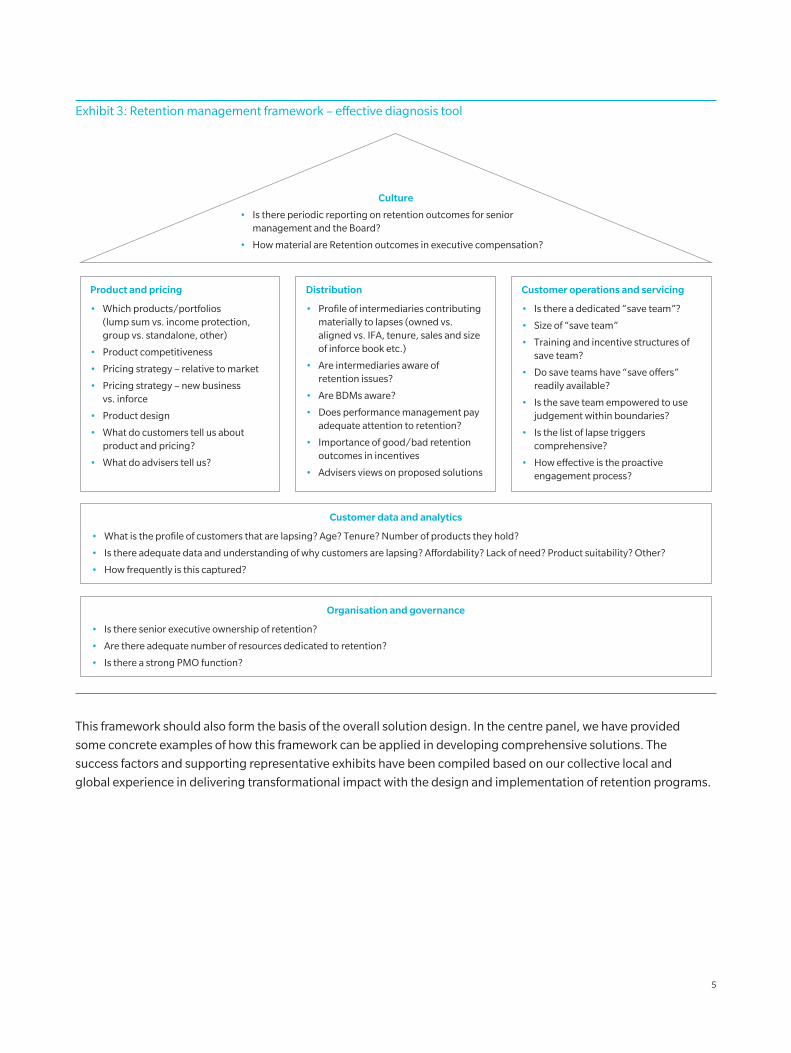
Exhibit 3: retention management framework – effective diagnosis tool
Culture
• Is there periodic reporting on retention outcomes for senior management and the Board?
• How material are Retention outcomes in executive compensation?
Product and pricing
• Which products/portfolios (lump sum vs. income protection, group vs. standalone, other)
• Product competitiveness
• Pricing strategy – relative to market
• Pricing strategy – new business vs. inforce
• Product design
• What do customers tell us about product and pricing?
• What do advisers tell us?
Distribution
• Profile of intermediaries contributing materially to lapses (owned vs. aligned vs. IFA, tenure, sales and size of inforce book etc.)
• Are intermediaries aware of retention issues?
• Are BDMs aware?
• Does performance management pay adequate attention to retention?
• Importance of good/bad retention outcomes in incentives
• Advisers views on proposed solutions
Customer operations and servicing
• Is there a dedicated “save team”?
• Size of “save team”
• Training and incentive structures of save team?
• Do save teams have “save o�ers” readily available?
• Is the save team empowered to use judgement within boundaries?
• Is the list of lapse triggers comprehensive?
• How e�ective is the proactive engagement process?
Customer data and analytics
• What is the profile of customers that are lapsing? Age? Tenure? Number of products they hold?
• Is there adequate data and understanding of why customers are lapsing? A�ordability? Lack of need? Product suitability? Other?
• How frequently is this captured?
Organisation and governance
• Is there senior executive ownership of retention?
• Are there adequate number of resources dedicated to retention?
• Is there a strong PMO function?
This framework should also form the basis of the overall solution design. In the centre panel, we have provided
some concrete examples of how this framework can be applied in developing comprehensive solutions. The
success factors and supporting representative exhibits have been compiled based on our collective local and
global experience in delivering transformational impact with the design and implementation of retention programs.
5
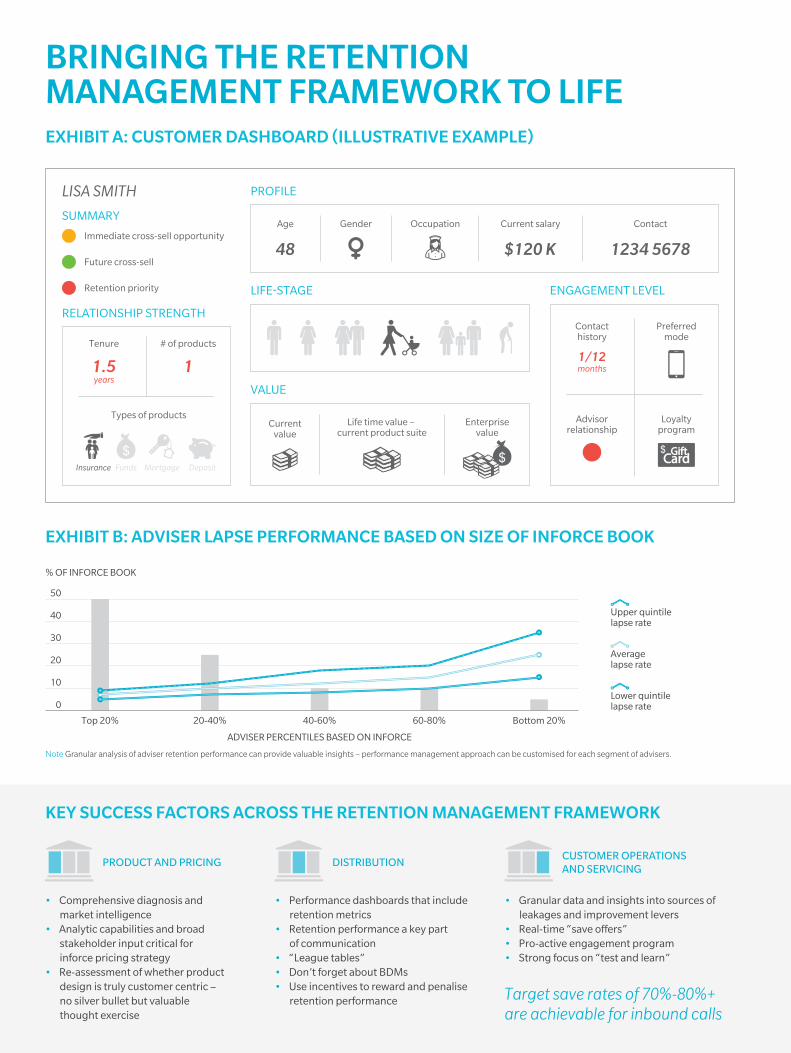
EXHIBIT A: CUSTOMER DASHBOARD (ILLUSTRATIVE EXAMPLE)
LISA SMITH
SUMMARY
Immediate cross-sell opportunity
Future cross-sell
Retention priority
RELATIONSHIP STRENGTH
1
# of productsTenure
1.5years
Types of products
Insurance MortgageFunds Deposit
Age
48 1234 5678
Contact
PROFILE
Gender Occupation
$120 K
Current salary
LIFE-STAGE
VALUE
Enterprisevalue
Life time value – current product suite
Currentvalue
ENGAGEMENT LEVEL
Advisorrelationship
Loyaltyprogram
Preferredmode
Contacthistory
1/12months
BRINGING THE RETENTIONMANAGEMENT FRAMEWORK TO LIFE
EXHIBIT C: APPROACH FOR DEVELOPING AN INFORCE PRICING STRATEGY
DIAGNOSIS AND FACT-FIND
External views• Customers• Advisers (Aligned and non-aligned)• Competitor research• Regulators…
Internal views• BDMs• Finance• Risk• Marketing…
STRATEGY HYPOTHESES
Strategic hypotheses long-list• Lower prices• Lower cover• Which customer segments?• Offer loyalty discount• Premium holidays• Level premiums• Other…
ANALYTICAL ENGINE
Cost-benefit analysis and testing• Quantify the impact of hypotheses• Test with advisers and refine• Test with selected customers and refine
TEST AND PILOT
Build propensity model• Start simple• Increase granularity, coverage and sophistication over time• Continue to back-test and improve
ROLL-OUT
Implementation• Translate actions into policy• Phase implementation over time, gradually increasing scope• Periodically refresh
EXHIBIT B: ADVISER LAPSE PERFORMANCE BASED ON SIZE OF INFORCE BOOK
% OF INFORCE BOOK
ADVISER PERCENTILES BASED ON INFORCE
Averagelapse rate
Lower quintilelapse rate
Upper quintilelapse rate
Top 20% 20-40% 40-60% 60-80% Bottom 20%
0
10
20
30
40
50
Note Granular analysis of adviser retention performance can provide valuable insights – performance management approach can be customised for each segment of advisers.
EXHIBIT D: DEEP UNDERSTANDING OF LAPSE DRIVERS AND LINK TO RETENTION PROGRAM RESPONSE LEVERS
3 MM AVG. RESPONSE LEVERLAPSE REASON 1 MM AVG.
Other 5% 0% • …
• Premium holidayA�ordability – cancelling cover 30% 35%
• DiscountCheaper price 30% 20%
• Save insuranceJob change 5% 5%
• Refer to retirement businessNo insurance need/life-stage 20% 30%
• Switch productBetter product 10% 10%
PRODUCT AND PRICING CULTURECUSTOMER DATA AND ANALYTICS
ORGANISATION AND GOVERNANCE
DISTRIBUTIONCUSTOMER OPERATIONSAND SERVICING
1%-3% of FTEs dedicatedto retention activities
Target save rates of 70%-80%+are achievable for inbound calls
• Strong awareness of retention at the senior executive level• Periodic internal communication campaign to reinforce importance of retention
• Performance dashboards that include retention metrics• Retention performance a key part of communication• “League tables”• Don’t forget about BDMs• Use incentives to reward and penalise retention performance
• Systematic capture of customer data, including reasons for lapsing• Structured process to feedback customer data to initiatives• Suitable value metric to distinguish between high-value and low-value customers• Dedicated resources focused on modelling and analytics
• Comprehensive diagnosis and market intelligence• Analytic capabilities and broad stakeholder input critical for inforce pricing strategy• Re-assessment of whether product design is truly customer centric – no silver bullet but valuable thought exercise
• Granular data and insights into sources of leakages and improvement levers• Real-time “save offers”• Pro-active engagement program• Strong focus on “test and learn”
• Senior executive ownership of retention• Clearly defined roles and responsibilities• Periodic reporting to senior management and Board on retention outcomes• Dedicated PMO
KEY SUCCESS FACTORS ACROSS THE RETENTION MANAGEMENT FRAMEWORK
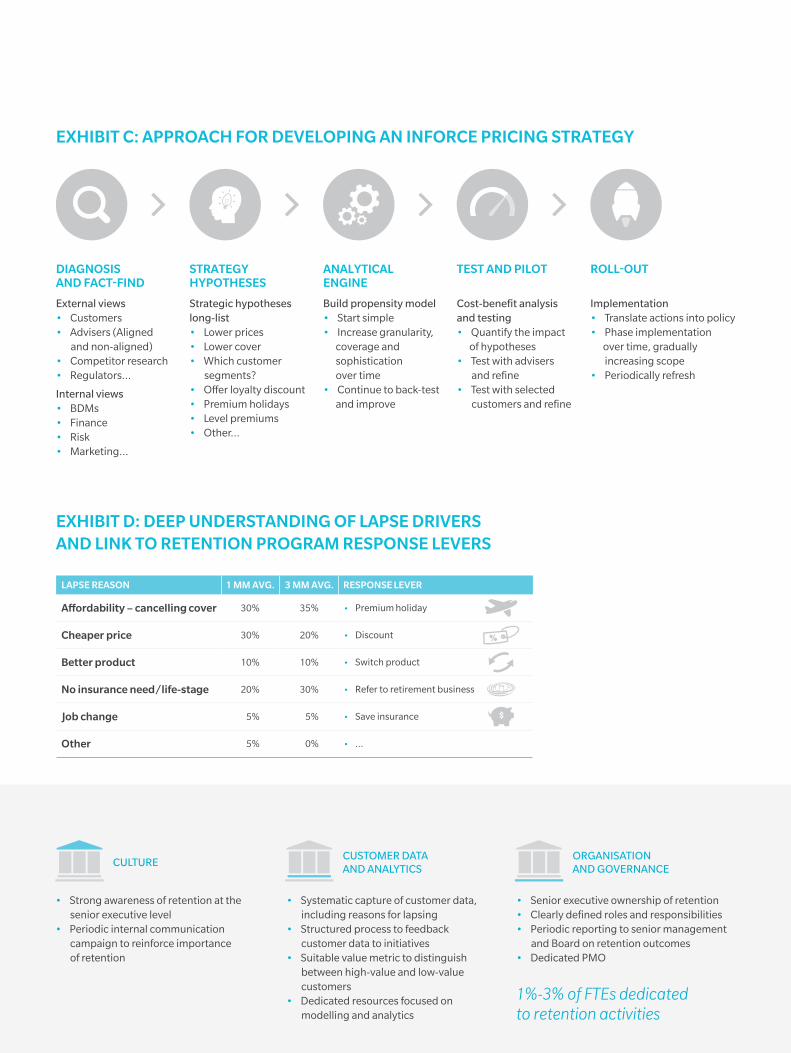
2. EMBEd “vAlUE” In dECISIonIng
Far too often, there is a disconnect between the findings from the diagnosis, the program in place and the
value drivers of the business. Effective retention programs bridge this gap and are designed to have initiatives
that illustrate a clear linkage to the core value drivers of the business, with the impact measured by a set of
agreed-upon value metrics. In practice, organisations need to find the balance between:
• Simple value metrics that are easy to understand and communicate (e.g. net cash-flows, dAC2-at-risk, etc.) vs.
• Complex value metrics that may better capture the long-term nature of the business and its value drivers (e.g. embedded value, customer lifetime value across lines of business, etc.), but may be challenging to calculate as well as to communicate
often, it is better to start with simple metrics that can be quickly calculated, easily communicated and that have
the benefit of increasing business awareness of retention. As capabilities progress, a migration to sophisticated
measures of value that better capture the business characteristics is recommended.
The sophistication of the value metric is important but secondary to ensuring that the retention activities that drive
value are clearly understood. For example, it is important for the call-centre staff to understand the impact on value
of alternative save-offers (e.g. premium holiday vs. discounting vs. lower cover). The more informed the staff, the
better it will be able to target offers and, hence, preserve value. This typically requires a strong focus on education
and staff training, and is critical to success.
2 dAC = deferred Acquisition Cost, an accounting measure that spreads the up-front cost of acquiring business (e.g. initial commissions) over the expected lifetime of the insurance policy. Increased lapses can lead to write-downs of dAC, which in turn reduces reported profits.
Copyright © 2014 oliver Wyman

3. CUlTUrE ThAT ApprECIATES ThE IMporTAnCE oF rETEnTIon
Most insurance companies have been guilty at some stage of placing a greater focus on new sales and implicitly
setting a lower priority on retention. over time, this has become ingrained in the culture of organisations and has
helped glorify sales, often at the expense of retention. The importance of retention in a culture is difficult to measure;
however, in our experience, a few simple indicators can provide a helpful health-check (see Exhibit 4).
Exhibit 4: retention culture health-check dashboard
Board agenda priority
• Frequency of retention board reporting
• For information, discussion or decision
• Consistency of reporting and messages
Compensation linkage
• Material part of executive compensation
• Linked to BDM and adviser compensation (reward levels and structures, clawbacks etc.)
Resources
• Experienced dedicated owner of retention
• Number of dedicated resources
• Strong PMO team for coordination
Corridor pulse
• Corridor disclosures of retention (posters, internal campaigns, intranet)
• Periodic random interviews to test
– Awareness of issue
– Implications for their work
Market disclosures
• Frequency of discussionin annual reports, results presentations
• Strategic priority vs. tactical initiative
• Depth of discussion
Watchlist Positive retention cultureImmediate action needed
Measurement can help enable change by highlighting the areas in need of improvement. however, in practice,
changing organisational culture is extremely challenging and should be phased in over time. We see three
sequential pillars in developing and embedding a retention-centric culture (see Exhibit 5).
9
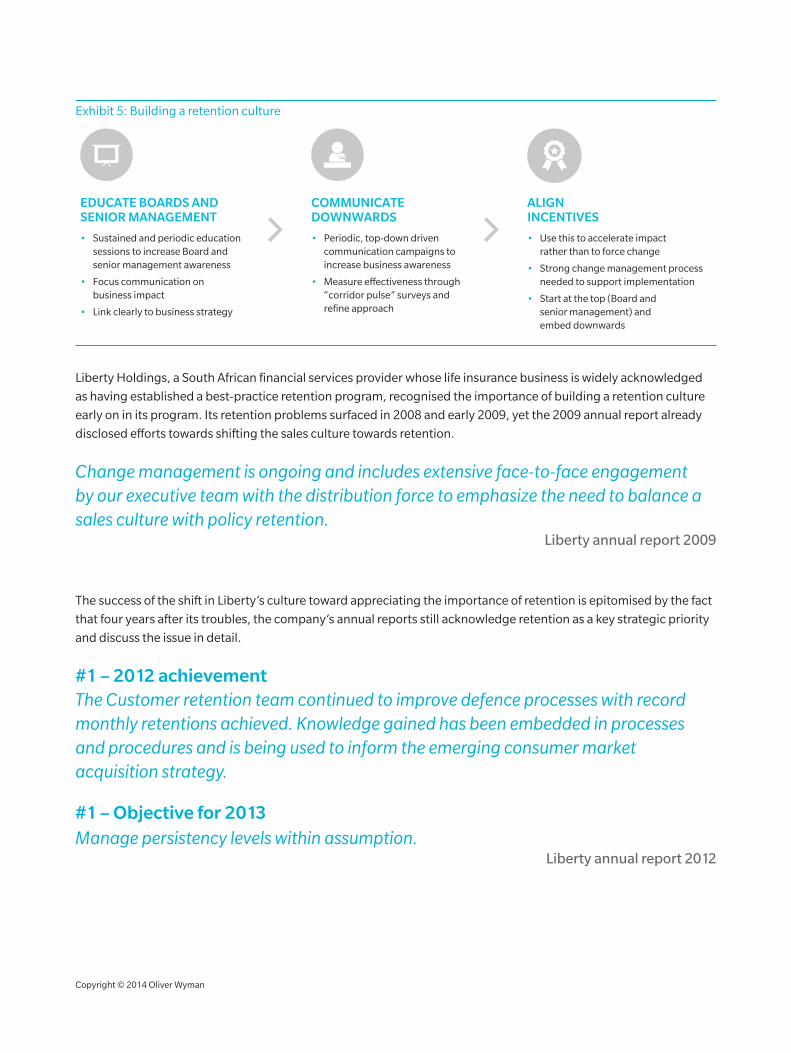
Exhibit 5: Building a retention culture
EDUCATE BOARDS AND SENIOR MANAGEMENT
• Sustained and periodic education sessions to increase Board and senior management awareness
• Focus communication on business impact
• Link clearly to business strategy
COMMUNICATE DOWNWARDS
• Periodic, top-down driven communication campaigns to increase business awareness
• Measure e�ectiveness through “corridor pulse” surveys and refine approach
ALIGN INCENTIVES
• Use this to accelerate impact rather than to force change
• Strong change management process needed to support implementation
• Start at the top (Board and senior management) and embed downwards
liberty holdings, a South African financial services provider whose life insurance business is widely acknowledged
as having established a best-practice retention program, recognised the importance of building a retention culture
early on in its program. Its retention problems surfaced in 2008 and early 2009, yet the 2009 annual report already
disclosed efforts towards shifting the sales culture towards retention.
Change management is ongoing and includes extensive face-to-face engagement by our executive team with the distribution force to emphasize the need to balance a sales culture with policy retention.
Liberty annual report 2009
The success of the shift in liberty’s culture toward appreciating the importance of retention is epitomised by the fact
that four years after its troubles, the company’s annual reports still acknowledge retention as a key strategic priority
and discuss the issue in detail.
#1 – 2012 achievement The Customer retention team continued to improve defence processes with record monthly retentions achieved. Knowledge gained has been embedded in processes and procedures and is being used to inform the emerging consumer market acquisition strategy.
#1 – Objective for 2013 Manage persistency levels within assumption.
Liberty annual report 2012
Copyright © 2014 oliver Wyman
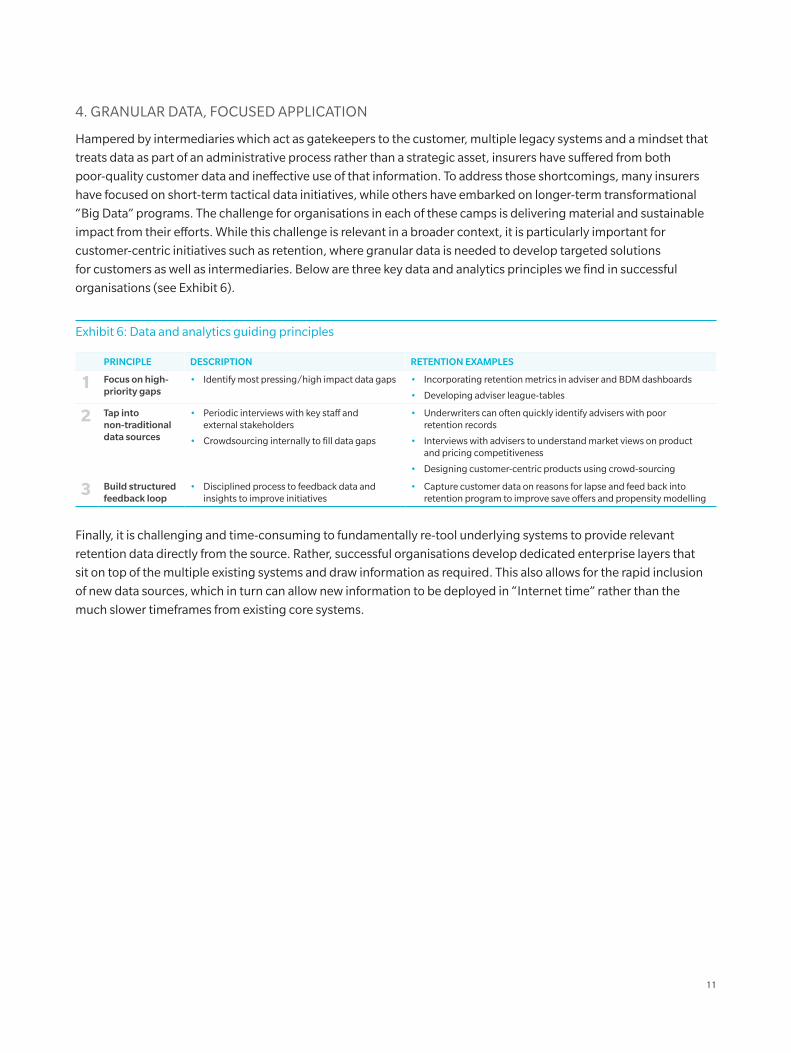
4. grAnUlAr dATA, FoCUSEd ApplICATIon
hampered by intermediaries which act as gatekeepers to the customer, multiple legacy systems and a mindset that
treats data as part of an administrative process rather than a strategic asset, insurers have suffered from both
poor-quality customer data and ineffective use of that information. To address those shortcomings, many insurers
have focused on short-term tactical data initiatives, while others have embarked on longer-term transformational
“Big data” programs. The challenge for organisations in each of these camps is delivering material and sustainable
impact from their efforts. While this challenge is relevant in a broader context, it is particularly important for
customer-centric initiatives such as retention, where granular data is needed to develop targeted solutions
for customers as well as intermediaries. Below are three key data and analytics principles we find in successful
organisations (see Exhibit 6).
Exhibit 6: data and analytics guiding principles
PRINCIPLE DESCRIPTION RETENTION EXAMPLES
1 focus on high-priority gaps
• Identify most pressing/high impact data gaps • Incorporating retention metrics in adviser and BdM dashboards
• developing adviser league-tables
2 Tap into non-traditional data sources
• periodic interviews with key staff and external stakeholders
• Crowdsourcing internally to fill data gaps
• Underwriters can often quickly identify advisers with poor retention records
• Interviews with advisers to understand market views on product and pricing competitiveness
• designing customer-centric products using crowd-sourcing
3 Build structured feedback loop
• disciplined process to feedback data and insights to improve initiatives
• Capture customer data on reasons for lapse and feed back into retention program to improve save offers and propensity modelling
Finally, it is challenging and time-consuming to fundamentally re-tool underlying systems to provide relevant
retention data directly from the source. rather, successful organisations develop dedicated enterprise layers that
sit on top of the multiple existing systems and draw information as required. This also allows for the rapid inclusion
of new data sources, which in turn can allow new information to be deployed in “Internet time” rather than the
much slower timeframes from existing core systems.
11

5. EngAgE EFFECTIvEly
For most insurers, engagement with the customer post sale is confined to renewal notices providing customers with
a triage of bad news:
Your risk of dying has increased
Inflation
Pay us moreor risk leaving
your dependentsunprotected
Moreover, when there is an issue with a payment, the engagement mode tends to be threatening (the consequences
of not paying) rather than engaging and helpful (what can we do to help?). While the messaging may be toned down
by some insurers, and some have fundamentally changed the way they interact with customers, the impact on the
customer is the same: a relatively unknown corporation wanting more money every year for a service, the benefits of
which are uncertain and intangible.
While to an extent this represents a structural impediment for the insurance industry, we believe it can be overcome
via an effective and periodic customer engagement process over the policy life cycle. Exhibit 7 provides an
illustrative example.
Copyright © 2014 oliver Wyman
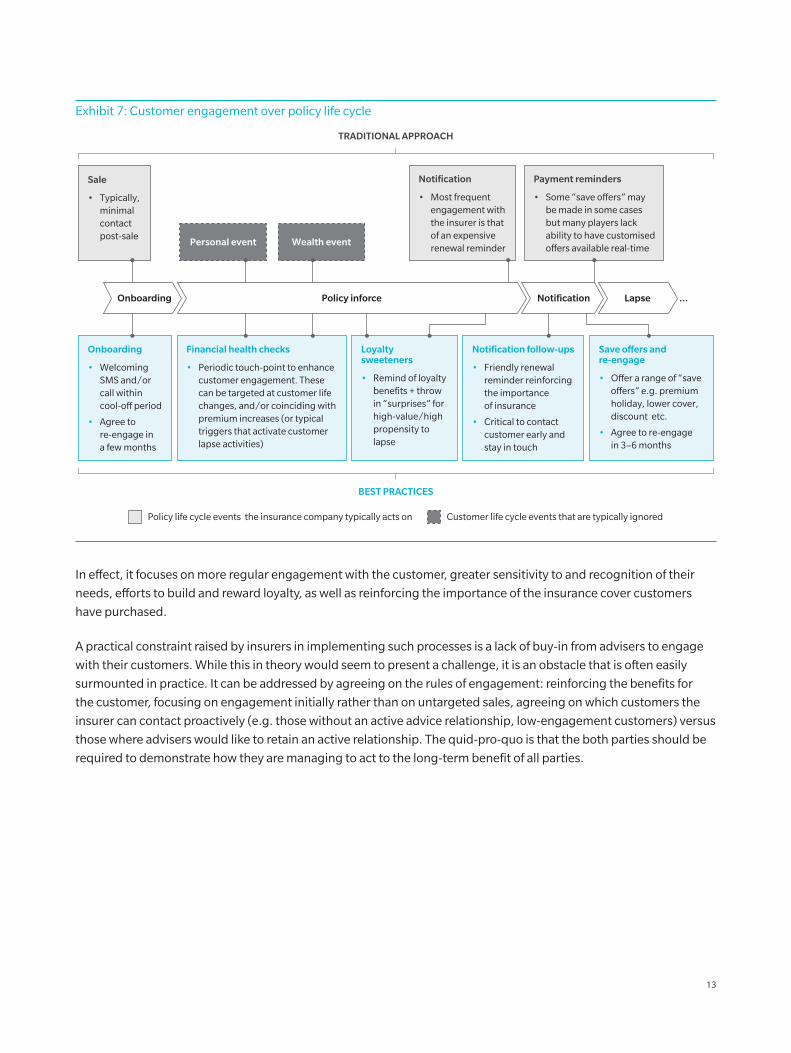
Exhibit 7: Customer engagement over policy life cycle
Notification
• Most frequent engagement with the insurer is that of an expensive renewal reminder
Onboarding
• Welcoming SMS and/or call within cool-o� period
• Agree to re-engage in a few months
Loyalty sweeteners
• Remind of loyalty benefits + throw in “surprises” for high-value/high propensity to lapse
Notification follow-ups
• Friendly renewal reminder reinforcing the importance of insurance
• Critical to contact customer early and stay in touch
Save offers and re-engage
• O�er a range of “save o�ers” e.g. premium holiday, lower cover, discount etc.
• Agree to re-engage in 3–6 months
Financial health checks
• Periodic touch-point to enhance customer engagement. These can be targeted at customer life changes, and/or coinciding with premium increases (or typical triggers that activate customer lapse activities)
Payment reminders
• Some “save o�ers” may be made in some cases but many players lack ability to have customised o�ers available real-time
Sale
• Typically, minimal contact post-sale
Personal event Wealth event
Policy inforce Notification Lapse …Onboarding
BEST PRACTICES
TRADITIONAL APPROACH
Customer life cycle events that are typically ignoredPolicy life cycle events the insurance company typically acts on
In effect, it focuses on more regular engagement with the customer, greater sensitivity to and recognition of their
needs, efforts to build and reward loyalty, as well as reinforcing the importance of the insurance cover customers
have purchased.
A practical constraint raised by insurers in implementing such processes is a lack of buy-in from advisers to engage
with their customers. While this in theory would seem to present a challenge, it is an obstacle that is often easily
surmounted in practice. It can be addressed by agreeing on the rules of engagement: reinforcing the benefits for
the customer, focusing on engagement initially rather than on untargeted sales, agreeing on which customers the
insurer can contact proactively (e.g. those without an active advice relationship, low-engagement customers) versus
those where advisers would like to retain an active relationship. The quid-pro-quo is that the both parties should be
required to demonstrate how they are managing to act to the long-term benefit of all parties.
13

6. Apply An EnTErprISE-WIdE lEnS
one of the key challenges of retention programs is that the activities involved span many functions (product, Sales &
distribution, operations, etc.). Initiatives are often developed in a siloed manner by each of the individual functions
to meet their specific goals, and can end up being narrow in focus and limited in impact.
An example that further illustrates this is the development of an in-force pricing strategy. Traditionally, this has
been developed by the pricing team within product with minimal input from other stakeholders. Better-performing
organisations proactively engage a broader set of stakeholders. For example, seeking the input from advisers
and BdMs on the perception of price in the market can be valuable, even if it doesn’t impact the outcome directly.
Similarly, having a structured process to capture customer feedback on pricing can be quite powerful.
Better-performing insurers apply an enterprise-wide lens, seeking input from a broad range of internal (functions,
lines of business) and external stakeholders (customers, competitors, regulators, etc.). Such a process leads to a
richer, more insightful and ultimately more sustainable solution. For this to be effective, the roles and responsibilities
of each function and key individual must be clearly defined. Furthermore, given the large, complex and diverse
nature of retention change programs, a dedicated pMo team with strong subject matter and cross-functional
expertise and experience is often a critical yet commonly underestimated enabler of success.
As an example, liberty holdings life Insurance business recognised the importance of a strong team with a diverse
skill set in effectively tackling retention issues.
Liberty’s retention team has been expanded and now consists of over 170 people, including a blend of actuarial and other professional skills.
Liberty annual report 2009
A dedicated team comprising of senior executives with a diverse range of technical skills was established to urgently address the persistency challenges through a dedicated customer management program.
Liberty annual report 2010
Copyright © 2014 oliver Wyman

7. BE Bold
There has been plenty of debate on the need to critically reassess the structural drivers of lapses (stepped premiums,
high up-front commissions, product design, etc.), but to date, we have seen minimal decisive action taken by any
individual insurer. Any change would likely draw criticism from the stakeholders that stand to lose out and potentially
also present a first-mover disadvantage, as other incumbents seek to exploit anyone breaking away from the pack.
As an example, an industry-wide shift towards level premiums has been proposed by many as a long-term solution,
having empirically exhibited better lapse performance than equivalent stepped premium products. For a number
of companies, some 10% to 20% of their books are already on level premium products, yet no major player has
announced a greater scale adoption of level premiums. For a select few, this may be because they are confident that
the current regime is sound and have granular value-volume analysis to support their stand. For most, there is major
concern about the perceived risks that such a move would entail: apparent price disadvantage, large drop in new
sales, adviser backlash, potential spike in lapses as advisers move business, BdM turnover, reinsurer concerns, as
well as reputational damage.
Similarly, changes to adviser-incentive structures are another talked about solution. our experience suggests that
very few players have engaged in rigorous analysis and internal dialogue to assess the impact of similar bold moves.
Most have not prioritised such an exercise or have lacked the decision framework to make a tough call. We believe
that conducting such analyses and comparing the outcomes against the status quo and potential adverse scenarios
can provide useful insights for management and better equip them to make difficult decisions.
There is no denying that making a bold move similar to those described above is challenging. given the
deteriorating profits of the industry and limited indication of a turnaround in the near term, there is a strong call
to action for insurers to revisit their customer-retention business strategy. For many that are disproportionately
impacted by lapses, the call for a bold move is growing stronger and may soon be a necessity.
ConClUdIng rEMArkS
high lapse rates remain a key issue for the life insurance industry. Most insurers have some form of a retention
program in place, but the upward trending nature of lapse rates suggests that these programs have had limited
effect, with most of the efforts focused on firefighting and containing the damage. We believe that effective
implementation of the seven missing ingredients not only will help repair profits in the short-term but will also guide
insurers towards a more sustainable business model over the medium-to-long term: one which effectively engages
customers and adapts to their changing needs, and ultimately provides a better outcome for all participants.
15

oliver Wyman is a global leader in management consulting that combines deep industry knowledge with specialized expertise in strategy, operations, risk management, and organization transformation.
For more information please contact the marketing department by email at [email protected] or by phone at one of the following locations:
AUSTrAlIA ASIA pACIFIC EMEA AMErICAS
+61 2 8864 6555 +65 6510 9700 +44 20 7333 8333 +1 212 541 8100
Copyright © 2014 oliver Wyman
All rights reserved. This report may not be reproduced or redistributed, in whole or in part, without the written permission of oliver Wyman and oliver Wyman accepts no liability whatsoever for the actions of third parties in this respect.
The information and opinions in this report were prepared by oliver Wyman. This report is not investment advice and should not be relied on for such advice or as a substitute for consultation with professional accountants, tax, legal or financial advisors. oliver Wyman has made every effort to use reliable, up-to-date and comprehensive information and analysis, but all information is provided without warranty of any kind, express or implied. oliver Wyman disclaims any responsibility to update the information or conclusions in this report. oliver Wyman accepts no liability for any loss arising from any action taken or refrained from as a result of information contained in this report or any reports or sources of information referred to herein, or for any consequential, special or similar damages even if advised of the possibility of such damages. The report is not an offer to buy or sell securities or a solicitation of an offer to buy or sell securities. This report may not be sold without the written consent of oliver Wyman.
www.oliverwyman.com
ABoUT ThE AUThorS
Anthony Bice is a partner in oliver Wyman’s Sydney office and leads the Australian insurance and wealth management practice.
Angat Sandhu is an Engagement Manager in oliver Wyman’s Sydney office and focuses on strategy and operations excellence in insurance and wealth management.
Anthony Bice partner
+61 2 8864 6555 [email protected]
Angat Sandhu Engagement Manager
+61 2 8864 6555 [email protected]
AUThorS' ConTACT InFo