Embed Size (px)
Citation preview

Revista Latina de Comunicación Social # 071 – Pages 272 to 286 Research Funded | DOI: 10.4185/RLCS-2016-1095en | ISSN 1138-5820 | Year 2016
http://www.revistalatinacs.org/071/paper/1095/15en.html Página 272
How to cite this article in bibliographies / References
J Gallardo-Camacho, E Lavín, P Fernández-García (2016): “Sports television
programmes and their relationship with the social audience on Twitter in Spain”.
Revista Latina de Comunicación Social, 71, pp. 272 to 286.
http://www.revistalatinacs.org/071/paper/1095/15en.html
DOI: 10.4185/RLCS-2016-1095en
Sports television programmes and their
relationship with the social audience on
Twitter in Spain
Jorge Gallardo-Camacho [CV] [ ORCID] [ GS] Associate Professor at the Department of
Audiovisual Communication of the Camilo José Cela University (Spain) [email protected]
Eva Lavín [CV] [ ORCID] [ GS] Associate Professor at the Department of Audiovisual
Communication of the Camilo José Cela University (Spain) [email protected]
Paula Fernández-García [CV] [ ORCID] [ GS] Full Professor at the Department of
Psychology of the University of Oviedo (Spain) [email protected]
Abstract Introduction: This study presents an analysis of the relationship between viewers of sports TV
programmes and Twitter users in Spain. Methods: The research is based on a quantitative method
that involves the analysis of a sample of 150 TV programmes that made it to the top five most-
discussed TV programmes of the day in Twitter (during a month). Together, these programmes
attracted a total of 1,838,056 Twitter users. The quantitative comparative analysis and the Pearson’s
correlation coefficient were used to test three research hypotheses. Results and conclusions: Sports
TV programmes are discussed by 34.8% of the sample of Twitter users: the sports TV programmes
that are the most popular on Twitter are not the most watched on traditional TV; the percentage of
interaction on Twitter around sports TV programmes is still very low in quantitative terms in
comparison to these programmes’ TV viewers.
Keywords Twitter; television; social audience; share; sports programmes; interactivity.
Contents 1. Introduction. 1.1. Research objectives and hypotheses. 2. Methods. 2.1. Sample. 3. Results. 3.1.
Twitter users who discuss sports TV programmes. 3.2. Relationship of success between Twitter and

Revista Latina de Comunicación Social # 071 – Pages 272 to 286 Research Funded | DOI: 10.4185/RLCS-2016-1095en | ISSN 1138-5820 | Year 2016
http://www.revistalatinacs.org/071/paper/1095/15en.html Página 273
the traditional TV audience. 3.3. Percentage of interaction between Twitter users and TV viewers. 4.
Discussion. 5. Conclusions. 6. References.
Translation by CA Martínez-Arcos (PhD in Communication from the University of London)
1. Introduction
This article discusses the relationship between sports content broadcast on television and the number
of comments generated around them on Twitter. Our main objective is to further develop a research
line proposed by other studies that link this social network with traditional television. In fact, there
are already research studies that examine the correlation between the television audience and the
comments on social networks among millennials (people born between 1981 and 1997), but they are
not focused on the field of sports. For example, Nielsen (2014) argues that if there is an increase of
8.4% in comments on Twitter, the rating of that television programme improves by 1% in this age
group. Another report points out that 88% of millennials uses second screens (phones and tablets)
while watching TV (CEA, 2016).
Therefore, we are dealing with a population that increasingly uses social networks to discuss what
happens in their daily lives and to share their TV experiences: 85% of active users in Twitter talk
about television during the primetime (Orban, Nagy, Kjarval and Sánchez, 2014). Marta, Martínez
and Sánchez (2013: 41) highlight the importance of this interaction for advertising given that “the
great participation of young people in this environment shows the profound changes taking place in
this scenario where users establish multiple interactions with brands”. In order to contextualise this
study, during the data collection, Twitter was the third most-used social network in Spain, with 56%
of Internet users, behind Facebook (96%) and YouTube (66%), according to the Interactive
Advertising Bureau (2015). Although there are authors who claim that it is still early to establish an accurate relationship
between Twitter and the TV audience (Bruns and Stieglitz, 2013), there is no doubt that the Twitter
phenomenon has created an ideal place where viewers can comment on what they watch on TV
without having to waiting until the next day to share their views with co-workers (Harrington,
Highfield and Bruns, 2013). Social networks have renewed the power of traditional television
channels since they provide added value to the viewing of linear, although delayed, broadcasting
(Highfield, Harrington and Bruns, 2013). Three of every four Twitter users in Spain publish comments while they watch TV and more than
half of them admit the messages posted by other users on Twitter motivate them to tune into a
particular programme (Salamanca, 2015). However, studies on Twitter and TV broadcasting in Spain
fail to show a precise correlation between audience share and the number of comments on Twitter.
For example, González-Neira and Quintas-Froufe (2014) have not found a correlation between the
top five trending topics on Twitter and the primetime TV programmes. In fact, they have found that
programmes with low ratings become trending topics on Twitter. Quintas-Froufe, González-Neira and Diaz-González (2015) point out that a leading TV show in
terms of ratings (the fake documentary “Operation Palace” in La Sexta), is also a leading

Revista Latina de Comunicación Social # 071 – Pages 272 to 286 Research Funded | DOI: 10.4185/RLCS-2016-1095en | ISSN 1138-5820 | Year 2016
http://www.revistalatinacs.org/071/paper/1095/15en.html Página 274
conversation topic on Twitter, although they explain that this is an exceptional case. Furthermore,
other authors have analysed Spanish television programmes that are most successful on Twitter. In
this sense, Aguilar, Paniagua and Farias (2015) carried out 1,201 telephone interviews and concluded
that most-commented television genres are entertainment (16.9%), sports (16.7%) and fiction
(15.4%). Tuitele (2013) provides data that also confirm the high interest in sports programmes in
Twitter conversations related to television: reality shows and docu-reality shows (14.7%), magazine
shows (14%), movies (9.3%), sporting events (22.4%), series (11%), talent shows (7.5%),
programmes about sports (4.3%), etc.
As this research will focus on sports programmes, we review the few studies related to our field of
study in Spain. It is important to note than for the purposes of this work sports television
programmes are understood as: broadcasts of football matches, Formula 1 races and motorcycle
racing; magazine programmes about football and Formula 1. Claes and Deltell (2014: 129) argue that
“the social audience is more active in sport and entertainment programmes with new formats,
especially those that are integrated in some way to the social networks” and that “Twitter seems to
become a place of belonging for these consumers”.
Other researchers affirm that sports TV broadcasts not only are easy to quantify in Twitter but also to
analyse from a qualitative point of view since the vocabulary used to express feelings in sports is
very reduced (Zhao, Wickramasuriya and Vasudevan, 2011).
There is one study that examines the relationship of social networks with Football League First
Division, and concludes that “times of the passive viewer have ended to give way to the individual
who speaks out and, above all, wants to be part of the conversation” (Sotelo, 2012: 225).
The relationship between radio and Twitter in sports must be highlighted too. Infact, “Spanish radio
programmes have seen on Twitter a new expansion platform that has allowed them, on the one hand,
to extend their influence in the Internet and, on the another, to create a universe of channels and
contents that leads listeners/users to improve their experience as radio listeners” (Piñeiro, 2014: 28;
Piñeiro, 2015). In this context, Herrero (2011) highlights the weight of Facebook in sports radio
programmes and concludes that the number of followers in this social network is not faithfully with
the number of listeners according to data of the General study of the media, while proposing more
research.
1.1. Research objectives and hypotheses
H1: Sports content broadcast on television are the most discussed genre on Twitter in comparison to
other programmes.
H2: Sports TV programmes that are successful on Twitter are not the most watched genre on
traditional television.
H3: The comments generated by sports programmes on Twitter are not significant in quantitative
terms with respect to their number of viewers.

Revista Latina de Comunicación Social # 071 – Pages 272 to 286 Research Funded | DOI: 10.4185/RLCS-2016-1095en | ISSN 1138-5820 | Year 2016
http://www.revistalatinacs.org/071/paper/1095/15en.html Página 275
However, the objective of the article is also to determine the type of sports content that are the most
commented, in order to establish whether there is a relationship between Twitter and the traditional
TV audience. As mentioned, we consider that this research study provides a new methodological
option to explore the relationship between television viewers and the users of other screens.
2. Methods
In order to examine the relationship between Twitter and traditional-TV programmes, we used a
quantitative method and extracted data from both areas: social networks and television. The study
lasted 30 consecutive days and was carried out in November (2014) because during this period the
television season is not affected by any prolonged holidays.
With regards to the collection of data from Twitter in Spain, we collected information from the 5
most discussed TV programmes of the day (according to Tuitele, a social audience measuring
Spanish company that was subsequently bought by Kantar Media). We decided to choose the TV
programmes based on the number of users, not comments, in order to quantify the real impact on the
audience (given that a same user can make more than one comment). Tuitele’s ranking takes into
account the comments made during a timeframe that ranges from 30 minutes before the programme
starts to 30 minutes after it ends.
In terms of the traditional audience, were obtained the following data from each content: network,
audience share, number of viewers, screening time and share-based position within the timeslot.
Infosys (2014, i+), owned by Kantar media (the company that measures social and traditional
audience in Spain), was used for the extraction of traditional audience data.
With respect to H1, we will examine the weight of sports programmes with respect to the rest of the
content with the largest number of Twitter followers and also with respect to the number of users
who tweet about the contents included in the entire sample. As for H2, we methodologically
considered how to measure the success of a programme on traditional television to confirm whether
there is relationship between the traditional share (the television audience) and the social share (the
Twitter audience). This aspect takes into account four parameters in the sample: network (whether it
is a mainstream channel that reaches large audiences), time slot (whether the sports programme is
broadcast in primetime), share and the share-based position within the time slot.
It must be noted that we used Kantar Media’s timeslot classification: morning (7 AM to 2:00 PM),
afternoon (2 PM to 5 PM), evening (5 PM to 8:30 PM), night 1 (8:30 PM to 12 AM), night 2 (12 AM
to 2:30 AM). The Pearson correlation was calculated between the Social Share (SS, number of
Tweeter followers) and the Traditional Share (TS, number of viewers) in order to identify the
programmes (N = 150) in which there was a significant correlation, i.e., to determine whether more
viewers means more Twitter followers. The IBM SPSS statistical package was used for this part of
the analysis (2014, V.22.0).
As for H3, we will compare the number of viewers of the sample of programme with the number of
users who made comments about these programmes on Twitter. In this way we calculated the so-
called percentage of interaction.

Revista Latina de Comunicación Social # 071 – Pages 272 to 286 Research Funded | DOI: 10.4185/RLCS-2016-1095en | ISSN 1138-5820 | Year 2016
http://www.revistalatinacs.org/071/paper/1095/15en.html Página 276
2.1. Sample
This article is the culmination of a research project on social networks and television, so it uses part
of the unpublished database extracted from the annexes of the study that analyses the generic
relationship between Twitter and the traditional audience (Gallardo-Camacho, Lavín and Fernández,
2016). This database provided a sample of N=150 programmes (5 for each day of the 30 days of
analysis) that represents the behaviour of 1,838,056 users. In our case, we will primarily focus on the
purely sports content included in the sample.
A methodological problem arose during the study. TV-related Twitter conversations are difficulty to
quantify because of “noise”. In other words, a sports TV broadcast is mentioned in tweets by people
who watches the programme live, but also by the public who is the football stadium and by people
who consumes this content through other media, such as radio (Claes and Deltell, 2014). In a
personal in-depth interview about the methodological approach of the study, the Head of customer
service of Kantar Media (Mariayun Martín de los Ríos Alarcón) explained that tweets about TV
programmes can be made by “people who are listening to it on the radio” and that “for that reason,
the data from sports programmes begun to be separated from the rest, in another section”. We believe
that, far from hindering the objectives of the research, this methodological choice will provide a new
perspective and solutions to the problem, which will be raised in the discussions section.
Another challenge is that the aforementioned database did not mention the share-based position of
television programmes within the timeslot below the 15th
position (as shown in table 1). Faced with
this situation, the value was established as if the programme were in the 15th
position.
3. Results
The sample (N = 150) contained 31 sports programmes that were in the top 5 programmes that were
commented by the largest number of Twitter users. Therefore, sports programmes occupy the second
position (20.6%) among all the television programmes included in the sample, only below the
magazine shows (21%), and above infotainment (18%), reality shows (14.4%), fiction series (10%),
talk shows (4%), films (2.7%) and award shows (2%). The 20.6% of sports programmes included: 17
broadcasts of football matches, 8 broadcasts of Formula 1 races, 1 broadcast of motorcycle racing, 4
magazine shows about football, and 1 docureality about the Formula 1.
3.1. Twitter users who discuss sports TV programmes
If we focus on our object of study, the percentages mentioned above refer to the number of
programmes that made it to the top 5 most discussed TV shows on Twitter (based on the number of
commenters) in any of the days of the study. However, we think it is relevant to break down those 31
sports programmes depending on the exact number of users and to compare them with the values
obtained by the rest of the sample. The sports programmes of the sample were commented by
640,418, while the total sample comprised 1,838,056 users. In other words, sports programmes were
commented by 34.8% of all the users who tweeted. Figure 1 breaks down the number of Twitter
users who commented about the different types of sports programme.
Football broadcasts accumulate 520,059 users in 17 matches broadcast over the 30 days of analysis,
which represent 28% of the Twitter users in the sample. Formula 1 broadcasts were commented by

Revista Latina de Comunicación Social # 071 – Pages 272 to 286 Research Funded | DOI: 10.4185/RLCS-2016-1095en | ISSN 1138-5820 | Year 2016
http://www.revistalatinacs.org/071/paper/1095/15en.html Página 277
4% of the Twitter users with 8 races broadcast live on television, while motorcycle racing broadcasts
only reached 28,731 users. The 5 sports magazine programmes reached 14,363 Twitter users (which
represent 2.25% of the sample).
Figure 1. Sports programmes according to the number of Twitter users who comment on them
Source: Authors’ own creation
3.2 Relationship of success between Twitter and the traditional TV audience
This section focuses on comparing data from traditional TV and Twitter. To this end, the following
table presents the main information of the sports TV programmes that were the most discussed on
Twitter: network, timeslot, position in timeslot and TV audience share.
Table 1. Main information of the most-discussed sports TV programmes on Twitter
Name of programme Network Timeslot
Position in
timeslot TV
share
Liga 2014-2015 (Granada-Real Madrid) Canal+ & Gol Evening >15 6.0%
Liga 2014-2015 (FC Barcelona-Celta de Vigo) Canal + Evening >15 4.8%
F1 Grand Prix qualifying sessions (United States GP) Antena 3 Evening 4 8.9%
F1 Grand Prix (United States GP) Antena 3, TV3 Evening 1 16.9%
UEFA Champions League (Real Madrid-Liverpool) La 1 Night 1 1 33.0%
UEFA Champions League (Ajax-Barcelona) Canal + Night 1 >15 4.4%
F1 Grand Prix free practice sessions (Brazilian GP) Neox Afternoon 13 1.6%

Revista Latina de Comunicación Social # 071 – Pages 272 to 286 Research Funded | DOI: 10.4185/RLCS-2016-1095en | ISSN 1138-5820 | Year 2016
http://www.revistalatinacs.org/071/paper/1095/15en.html Página 278
Liga 2014-2015 (Real Madrid-Rayo Vallecano) Canal+ & Gol tv Evening >15 5.5%
Liga 2014-2015 (Almería-FC Barcelona) Canal+ & Gol tv Evening >15 4.8%
F1 Grand Prix qualifying sessions (Brazilian GP) La Sexta, TV3 Afternoon 4 8.2%
Road Racing World Championship (Valencian GP) Telecinco Morning 1 22.5%
F1 Grand Prix (Brazilian GP) Antena 3 & TV3 Afternoon 1 17.6%
La goleada 13tv Night 2 14 1.5%
El chiringuito de jugones Neox Night 2 7 3.4%
UEFA EURO2016 qualifying sessions (Spain-Belorussia) La 1 Night 1 1 29.5%
Liga Adelante 2014-2015 (Osasuna-Poferradina) La Sexta Evening 6 5.3%
El chiringuito de jugones Neox Night 2 6 2.5%
Friendly match (Spain-Germany) Cuatro Night 1 1 26.7%
F1 Grand Prix free practice sessions (Abu Dhabi GP) Neox Morning 14 1.3%
Liga 2014 (FC Barcelona-Sevilla) Canal + Night 1 >15 4.6%
Liga 2014 (Eibar-Real Madrid) Canal+ & Gol Evening >15 6.1%
F1 Grand Prix qualifying sessions (GP Abu Dhabi) Antena 3 Morning 1 16.9%
F1 Grand Prix (Abu Dhabi GP) Antena 3 Morning 1 26.0%
UEFA Champions League (Apoel-Barcelona) La 1 Night 1 1 21.1%
UEFA Champions League (Basel-Real Madrid) Canal + Night 1 >15
El chiringuito de jugones Neox Night 2 8 3.5%
UEFA EURO2016 (Feyenoord-Sevilla FC) Cuatro Evening 4 8.8%
Liga 2014-2015 (Málaga CF - Real Madrid) Canal+ & Gol Night 1 >15
Liga Adelante 2014-2015 (Llagostera-Betis) La Sexta Evening 6 6.7%
Mi última carrera con Ferrari (“My last race with Ferrari”) La Sexta Morning 6 6.2%
Liga 2014-2015 (Valencia CF-FC Barcelona) Canal + Night 1 >15
AVERAGE Canal + (10)
Night 1 &
Night 2 (13
times) 8*
10.9%
*
Source: Authors’ own creation
**Share data were not available for three football matches (those percentages are therefore excluded from the average)

Revista Latina de Comunicación Social # 071 – Pages 272 to 286 Research Funded | DOI: 10.4185/RLCS-2016-1095en | ISSN 1138-5820 | Year 2016
http://www.revistalatinacs.org/071/paper/1095/15en.html Página 279
* Programmes whose average was below the 15th
position were averaged as 15
As Table 1 shows, the TV channel that broadcasts the sports programmes that are discussed the most
is Canal +, which is a pay TV channel. The timeslots in which more sports programmes are screened
is night 1 & night 2 (13 times together). However, the most discussed sports programmes (with a
frequency of 18) are shown in the other timeslots (morning, afternoon, and evening). With respect to
the share-based position of sports programmes in their timeslot, they occupy in average the eighth
position (we must take into account that the position would be lower for programmes below the 15th
position). Finally, the average share is 10.8%, with the highest share at 33% and the lowest at 1.3%.
In table 2 shows the Pearson correlation between the Social Share (SS, Twitter users) and the
Traditional Share (TS, TV viewers), according to the 150 television programmes included in the
sample.
Table 2. Correlation of TV programmes between Twitter users and TV viewers
Television programmes N ρ SS-TS p
Formula 1 and road racing broadcasts 9 .719(*) .029
Football broadcasts 17 .145 .630
Sports magazine programmes 5 -.470 .424
Entertainment magazine programmes 32 .014 .940
News magazine programmes 27 .592(*) .001
Reality shows 21 .568(*) .007
Talent shows 11 .694(*) .018
Talk shows 6 .789 .062
Award shows 3 .(a) --
Fiction films 4 .865 .135
Fiction series 15 .346 .206
Source: Authors’ own creation
** Correlation is significant at the level of 0.01 (bilateral) * Correlation is significant at the level of 0.05 (bilateral) (a) cannot be calculate because at least one variable is constant

Revista Latina de Comunicación Social # 071 – Pages 272 to 286 Research Funded | DOI: 10.4185/RLCS-2016-1095en | ISSN 1138-5820 | Year 2016
http://www.revistalatinacs.org/071/paper/1095/15en.html Página 280
As we can see in table 2, we checked whether the number of people who tweeted about a programme
(SS) increased as the number of TV viewers increased (TS). News programmes, reality shows and
talent shows have a statistically significant Pearson correlation.
Among sports programmes, there is only one high positive correlation between SS and TS: the
broadcasts of the F1 Grand Prix (this also includes the only motorcycle race of the sample).
The correlation is insignificant in football broadcasts, and negative and not statistically significant in
sports magazine programmes.
3.3. Percentage of interaction between Twitter users and TV viewers
The data collection also allowed us to compare the number of users who discussed the sports
programmes on Twitter with respect to the number of people who watch these programmes on TV.
In this way, we can determine the weight of viewers’ interaction while consuming a TV programme.
Table 3. Percentage relation between the number of Twitter users and the number of TV
viewers
Type of sports programme Number of
users (A)
Number of
viewers (B)
% of difference
(B-A)
Football broadcasts (14*) 520,959 27,819,000 1.9%
Formula 1 broadcasts (8) 76,365 13,531,000 0.6%
Road racing broadcasts (1) 28,731 2,497,000 1.1%
Football magazine programmes (4) 12,548 713,000 1.7%
Formula 1 magazine programmes (1) 1,815 396,000 0.4%
TOTAL / AVERAGE % 640,418 44,956,000 1.4%
Source: Authors’ own creation
* The data provided by Kantar Media did not include 3 of the 17 matches of the sample
As Table 3 shows, proportionally, football broadcasts generate the highest percentage of interaction
since the Twitter users that discuss it represent 1.9% of viewers. In general terms, the total sample of
users who have commented sports TV content (640,418) represent only 1.4% of the 44,956,000
million viewers.

Revista Latina de Comunicación Social # 071 – Pages 272 to 286 Research Funded | DOI: 10.4185/RLCS-2016-1095en | ISSN 1138-5820 | Year 2016
http://www.revistalatinacs.org/071/paper/1095/15en.html Página 281
The 150 programmes in the sample (including sports programmes) accumulate 295,837,000 viewers
while only 1,838,056 Twitter users commented about them. In other words, only 1% of Twitter users
generates conversations related to television with respect to the traditional audience (N=150). If we
focus on non-sports related programmes, the average interaction is of 0.5% (N=119; 150 - 31).
4. Discussion
After the presentation of results, we confirmed the three research hypotheses of this study. With
regards to H1, we cannot categorically affirm that sports programmes are the most commented on
Twitter, but we can assert that sports content on television are the second most frequently discussed
programmes (N=31; 20.6%), based on the number of Twitter users that comment on them. In
addition, these programmes are discussed by 34.8% of all users in the sample (Figure 1). While this
percentage does not constitute the majority of Twitter users, the importance of this type of content is
above the rest of programming (magazine shows, infotainment shows, reality shows, fiction series,
talk shows, movies and award shows).
With regards to H2, we confirmed that sports programmes that are successful on Twitter are not the
most watched on traditional TV. As Table 1 showed, the most discussed sports programmes on
Twitter during the period of analysis were broadcast in pay TV channels with low ratings, were not
the most-watched in their timeslot (on the 8th
position on average, bearing in mind that those below
the 15th
position were assessed as if they were in the 15th
position), and were not screened in prime
time (night 1 & 2 night). In other words, the most discussed sports TV programmes on Twitter were
are broadcast in low-audience timeslots: 18 in the morning, afternoon and evening timeslots.
This fact is most notable in the 6 sports magazine programmes that are broadcast in low-audience
networks (averaging 221,800 viewers). Nonetheless, they made it to the top 5 most discussed TV
programmes of the day on Twitter. Therefore, our results coincide with those of other authors that
found no correlation of success between Twitter and television (González-Neira and Quintas-Froufe,
2014). However, another study found out correlations of success between Twitter and television in
programmes with the largest traditional share and social share (Gallardo-Camacho, Lavín and
Fernández-García, 2016).
The study neither found a generalised correlation between Twitter users (SS) and TV viewers (TS).
In fact, the Pearson correlation is only significant in the Formula 1 broadcasts. In other words, the
more the broadcasts are watched, the more they are tweeted. But this relationship is barely
perceptible in football broadcasts, and is negative in the case of sports magazine programmes (Table
2).
In the testing of these two hypotheses (H1 and H2), we faced the challenge of the noise generated by
the conversations that occur between people who are not watching TV (either because they are
watching it in the place of the event or on the Internet, or are only listening to it through the radio).
However, we raised some points of view that discuss the possibility that the results can be influenced
to a lesser extent than we think. On the one hand, if we focus on the 5 sports TV magazine
programmes (which are generally not consumed through media or contexts other than television) we
can see that they have fewer viewers but still manage to generate a high number of conversations on
television due to their subject: sports. On the other hand, we have observed the behaviour of the
Revista Latina de Comunicación Social # 071 – Pages 272 to 286 Research Funded | DOI: 10.4185/RLCS-2016-1095en | ISSN 1138-5820 | Year 2016
http://www.revistalatinacs.org/071/paper/1095/15en.html Página 282
audiences of sports broadcasts that have taken place outside Spain and have become trending topic in
Twitter Spain. For example, the broadcasts of the eight Formula 1 races took place outside Spain but
became one of the 5 TV programmes of the day discussed by the largest number of Twitter users.
Those eight broadcasts only attracted the interest of 76,365 users, which is way below the number of
users who discussed the broadcasts of the 17 football matches in the sample (520,000). Despite there
were more matches than races, football matches proportionately got many more conversations per
broadcast. In this sense, Formula 1 races were broadcast in free-to-air channels during the study
period and still got much less comments than football broadcasts.
Interestingly, the football match that accumulated the highest number of Twitter users is the one held
outside of Spain: Apoel FC vs. FC Barcelona, which attracted 48,645 users on Twitter Spain and
4,003,000 TV viewers (in this case the noise generated by discussions from the place of the event
would be eliminated, but not the noise cause by consumption via radio). However, we also think that
the fact that the football matches were broadcast mostly through pay channels (with lower audience
levels) could be an element that corrected the increase in comments made by radio listeners, although
this is not measurable in any way. For all these reasons, the verification of the first hypothesis must
be relativised.
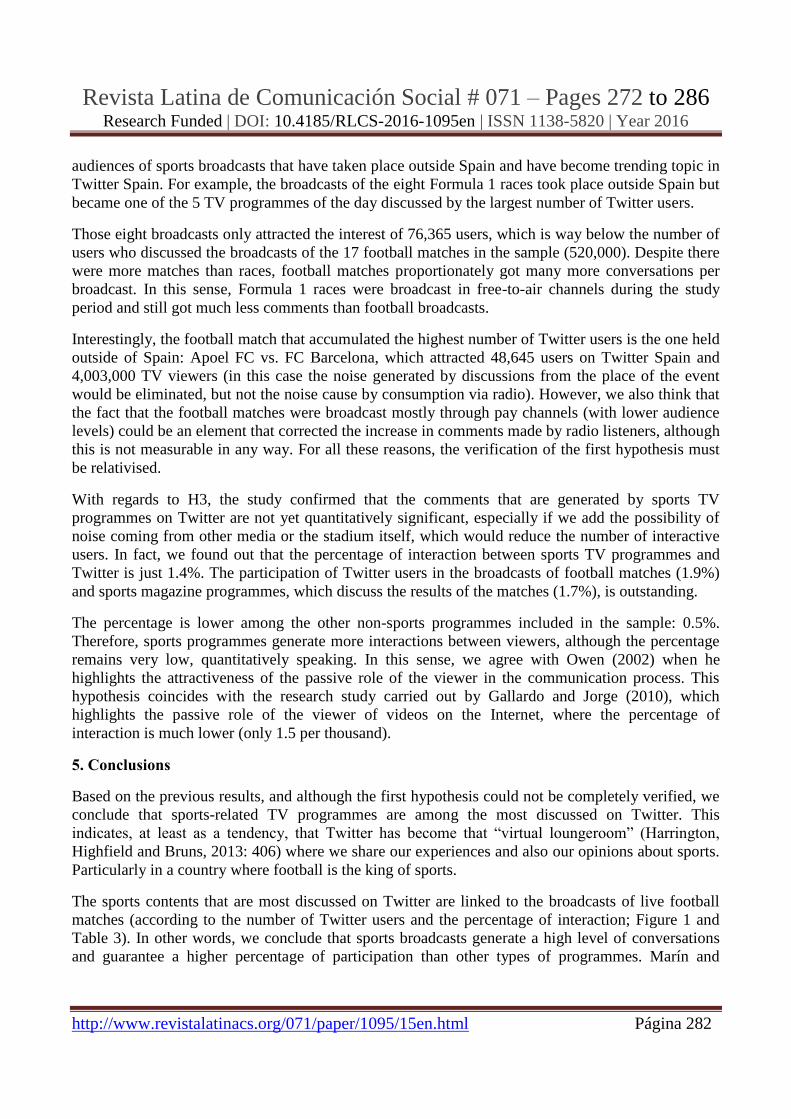
With regards to H3, the study confirmed that the comments that are generated by sports TV
programmes on Twitter are not yet quantitatively significant, especially if we add the possibility of
noise coming from other media or the stadium itself, which would reduce the number of interactive
users. In fact, we found out that the percentage of interaction between sports TV programmes and
Twitter is just 1.4%. The participation of Twitter users in the broadcasts of football matches (1.9%)
and sports magazine programmes, which discuss the results of the matches (1.7%), is outstanding.
The percentage is lower among the other non-sports programmes included in the sample: 0.5%.
Therefore, sports programmes generate more interactions between viewers, although the percentage
remains very low, quantitatively speaking. In this sense, we agree with Owen (2002) when he
highlights the attractiveness of the passive role of the viewer in the communication process. This
hypothesis coincides with the research study carried out by Gallardo and Jorge (2010), which
highlights the passive role of the viewer of videos on the Internet, where the percentage of
interaction is much lower (only 1.5 per thousand).
5. Conclusions
Based on the previous results, and although the first hypothesis could not be completely verified, we
conclude that sports-related TV programmes are among the most discussed on Twitter. This
indicates, at least as a tendency, that Twitter has become that “virtual loungeroom” (Harrington,
Highfield and Bruns, 2013: 406) where we share our experiences and also our opinions about sports.
Particularly in a country where football is the king of sports.
The sports contents that are most discussed on Twitter are linked to the broadcasts of live football
matches (according to the number of Twitter users and the percentage of interaction; Figure 1 and
Table 3). In other words, we conclude that sports broadcasts generate a high level of conversations
and guarantee a higher percentage of participation than other types of programmes. Marín and
Revista Latina de Comunicación Social # 071 – Pages 272 to 286 Research Funded | DOI: 10.4185/RLCS-2016-1095en | ISSN 1138-5820 | Year 2016
http://www.revistalatinacs.org/071/paper/1095/15en.html Página 283
Romero (2012: 9), although focused on the radio, conclude that the content of tweets “is closely
linked to football and, to a lesser extent, to other sports”.
On the other hand, we believe that a logical explanation to the confirmation of H2 could be that the
Twitter audience is different from the TV audience: the former being younger and much more
accustomed to participate through the second screens. That is why a television show (about sports or
not) with a good Social Share does not always stands out for its traditional audience (Traditional
Share).
We also conclude that we are not destined to interact when we consume audiovisual content. We
have no doubt that second screens provide added value and democratise the flow of conversations,
but also highlight the attractive role of the passive viewer.
That is why the percentage of participation and interaction of second screens is so low in relation to
the total number of viewers (1.4% in sports programmes). The same happens among YouTube users,
who are assumed to be more willing to interact (Gallardo and Jorge, 2010). However, it seems that
sports viewing prompts the need to verbalise feelings and that social networks allow people to do
that.
We agree with the ideas of Claes and Deltell (2014) to avoid the pollution and noise of conversations
on social networks: a) use the geo-location data of mobile devices to discard from the sample the
tweets written from the sports venues; and b) delete the tweets using the hashtags promoted by radio
programmes.
In short, we are facing a context where the social audience has a high interest because it implies that
its profile is younger than that of traditional television. Without a doubt, we are witnessing a phase of
media convergence in which continuous research in the area of communication is essential to
understand a rapidly changing phenomenon.
* Funded research. This article is the product of a wider research project titled:
“Analysis of the impact of social networks on the construction and credibility of the
narrative, informative and audiovisual discourse” (reference: INFO 3.0.), financed by
the Competitive Research Programme of the Vice-chancellor´s Office for Research
and Science of the Camilo José Cela University.
6. References
Aguilar, M., Paniagua, F. M. & Farias, P. (2015): “Comportamiento de la audiencia de televisión en
las redes sociales. Una aproximación al perfil y programas más comentados”. Revista Latina de
Comunicación Social, 70, pp. 539-551. Available at:
http://www.revistalatinacs.org/070/paper/1058/28es.html DOI: 10.4185/RLCS-2015-1058.
Bruns, A. & Stieglitz, S. (2013): Towards more systematic Twitter analysis: metrics for tweeting
activities. International Journal of Social Research Methodology, 16 (2), 91-108. Available at:
Revista Latina de Comunicación Social # 071 – Pages 272 to 286 Research Funded | DOI: 10.4185/RLCS-2016-1095en | ISSN 1138-5820 | Year 2016
http://www.revistalatinacs.org/071/paper/1095/15en.html Página 284
http://www.tandfonline.com/doi/abs/10.1080/13645579.2012.756095#.VrkJ-5PhDMI
DOI:10.1080/13645579.2012.756095.
CEA, Consume Technology Association (2016): Millennials Master the Second Screen: More than
Three-quarters use Second Screens When Watching Video. Available at:
https://www.cta.tech/News/News-Releases/Press-Releases/2016-Press-Releases/Millennials-Master-
the-Second-Screen-More-than-Thr.aspx.
Claes, F. & Deltell, L. (2014): “Audiencia social en Twitter: hacia un nuevo modelo de consumo
televisivo”. Trípodos, n 36, pp. 111-132. Available at:
http://www.tripodos.org/index.php/Facultat_Comunicacio_Blanquerna/article/view/245/100.
Gallardo-Camacho, J., Lavín, E. & Fernández-García, P. (2016): “Análisis de los programas de
televisión más comentados en Twitter y su relación con la audiencia tradicional en España”. Palabra
Clave, 19, nº 1. Available at: http://palabraclave.unisabana.edu.co/index.php/palabraclave DOI:
10.5294/pacla.2016.19.1.8 (Pending publication).
Gallardo, J., & Jorge, A. (2010): “La baja interacción del espectador de vídeos en Internet: caso
Youtube España”. Revista Latina de Comunicación Social, 65, pp. 421-435. Available at:
http://www.revistalatinacs.org/10/art3/910_Malaga/32_Gallardo.html DOI: 10.4185/RLCS-65-2010-
910-421-435-EN.
González-Neira, A. & Quintas-Froufe, N. (2014): “Audiencia tradicional frente a audiencia social:
un análisis comparativo en el prime-time televisivo”. Mediterranean Journal of Communication, 5
(1), pp. 105-121. Available at: http://www.mediterranea-
comunicacion.org/Mediterranea/article/view/103 DOI:10.14198/MEDCOM2014.5.1.02.
Harrington, S., Highfield, T. & Bruns, A. (2013): “More than a backchannel: Twitter and television”.
Participations. Journal of Audience & Reception Studies, 10 (1), pp. 405-408. Available at:
http://www.participations.org/Volume%2010/Issue%201/30%20Harrington%20et%20al%2010.1.pdf
Herrero, J. (2011): “Los programas deportivos de la radio española en la red social facebook: espacio
de promoción, lugar de encuentro… ¿medidos de audiencia?”. Área Abierta, 28, pp. 1-20. Available
at: http://revistas.ucm.es/index.php/ARAB/article/view/ARAB1111130003A.
Highfield, T., Harrington, S. & Bruns, A. (2013): “Twitter as a Technology for Audiencing and
Fandom”. Information, Communication & Society, 16 (3), pp. 315-339. Available at:
http://www.tandfonline.com/doi/abs/10.1080/1369118X.2012.756053
DOI:10.1080/1369118X.2012.756053.
IBM SPSS. (2014, V.22.0). [Programa de ordenador]. SPSS Statistics Desktop 22.0. Available at:
http://www14.software.ibm.com/download/data/web/en_US/trialprograms/W110742E06714B29.htm
l
Revista Latina de Comunicación Social # 071 – Pages 272 to 286 Research Funded | DOI: 10.4185/RLCS-2016-1095en | ISSN 1138-5820 | Year 2016
http://www.revistalatinacs.org/071/paper/1095/15en.html Página 285
InfoSys. (2014, i+). InfoSys, (version i+). [computer software]. Available at:
http://www.kantarmedia1.es/files/docs/folleto_kantarmedia.pdf
Interactive Advertising Bureau. (2015): VI Estudio de Redes Sociales de IAB Spain, Enero de 2015.
Available at: http://www.iabspain.net/wp-
content/uploads/downloads/2015/01/Estudio_Anual_Redes_Sociales_2015.pdf.
Marín, J. & omero, H. J. (2012): “La red social Twitter en los contenidos deportivos: nuevas
perspectivas e interacciones en el actual panorama radiofónico”. In: –
– IV CILCS – Universidad de La Laguna, diciembre
2012. Available at: https://idus.us.es/xmlui/handle/11441/28830.
Marta, C., Martínez, E., Sánchez, L. (2013): “La i-generación y su interacción en las redes sociales:
Análisis de Coca-Cola en Tuenti”. Comunicar: Revista científica iberoamericana de comunicación y
educación, 40, pp. 41-48. Available at:
http://www.revistacomunicar.com/index.php?contenido=detalles&numero=40&articulo=40-2013-06
DOI: http://dx.doi.org/10.3916/C40-2013-02-04.
Orban, P., Nagy, J., Kjarval, N., & Sanchez, X. (2014): Discovering the Value of Earned Audiences -
How Twitter Expressions Activate Consumers. Available at: http://thearf-org-aux-
assets.s3.amazonaws.com/events/rethink/social-media-one-pager.pdf.
Owen, B. M. (2000): The Internet challenge to television. Massachusetts: Harvard.
Piñeiro, T. (2014): “La utilización de la bio por los programas de la radio española en Twitter. De la
presentación del perfil a la radio transmedia”. Fonseca Journal of Communication, n.8, pp. 9-34.
Available at: http://rca.usal.es/~revistas_trabajo/index.php/2172-9077/article/view/11810.
Piñeiro, T. (2015): “De las ondas a los 140 caracteres. El uso de Twitter por los principales
programas de la radio española”. Palabra Clave, 18(3), pp. 815-841. Available at:
http://www.scielo.org.co/scielo.php?pid=S0122-82852015000300008&script=sci_arttext&tlng=es
DOI: 10.5294/pacla.2015.18.3.8.
Quintas-Froufe, N., González-Neira, A. & Díaz-González, M. J. (2015): “La construcción de la
estrategia comunicativa en Twitter de un falso documental: Operación Palace”. Revista Latina de
Comunicacion Social, 70, 28-48. Available at: http://www.revistalatinacs.org/070/paper/1033-
UC/03es.html DOI:10.4185/RLCS-2015-1033en.
Salamanca, A. (2015): “Tres de cada cuatro usuarios de Twitter comentan mientras ven la
televisión”. In: El Mundo. Available at:
http://www.elmundo.es/television/2015/04/27/553e1a7c268e3e72498b456b.html.
Sotelo, J. (2012): “Deporte y social media: el caso de la Primera División del fútbol español”.
, Vol. 17, pp. 217-230. Available at:

Revista Latina de Comunicación Social # 071 – Pages 272 to 286 Research Funded | DOI: 10.4185/RLCS-2016-1095en | ISSN 1138-5820 | Year 2016
http://www.revistalatinacs.org/071/paper/1095/15en.html Página 286
http://revistas.ucm.es/index.php/HICS/article/view/40607
DOI: http://dx.doi.org/10.5209/rev_HICS.2012.v17.40607.
Tuitele. (2013): Un año de television social en España, Septiembre 2012 – Agosto 2013. Available
at: http://informes.tuitele.tv/emailing/Tuitele_1_a%C3%B1o_tv_social_en_Espa%C3%B1a.pdf.
Zhao, L., Wickramasuriya, J. & Vasudevan, V. (2011): Analyzing Twitter for social TV: Sentiment
extraction for sports. En: Proceedings of the 2nd International Workshop on Future of Television.
Available at: http://ceur-ws.org/Vol-720/Zhao.pdf.
____________________________________________________________
How to cite this article in bibliographies / References
J Gallardo-Camacho, E Lavín, P Fernández-García (2016): “Sports television programmes and their
relationship with the social audience on Twitter in Spain”. Revista Latina de Comunicación Social,
71, pp. 272 to 286.
http://www.revistalatinacs.org/071/paper/1095/15en.html
DOI: 10.4185/RLCS-2016-1095en
Article received on 18 January 2016. Accepted on 3 March.
Published on 22 March 2016.