Embed Size (px)
Citation preview

Georgia State University Georgia State University
ScholarWorks @ Georgia State University ScholarWorks @ Georgia State University
UWRG Working Papers Usery Workplace Research Group
2-1-2012
Does Shortening the School Week Impact Student Performance? Does Shortening the School Week Impact Student Performance?
Evidence from the Four-Day School Week Evidence from the Four-Day School Week
D. Mark Anderson Montana State University, [email protected]
Mary Beth Walker Georgia State University, [email protected]
Follow this and additional works at: https://scholarworks.gsu.edu/uwrg_workingpapers
Recommended Citation Recommended Citation Anderson, D. Mark and Walker, Mary Beth, "Does Shortening the School Week Impact Student Performance? Evidence from the Four-Day School Week" (2012). UWRG Working Papers. 46. https://scholarworks.gsu.edu/uwrg_workingpapers/46
This Article is brought to you for free and open access by the Usery Workplace Research Group at ScholarWorks @ Georgia State University. It has been accepted for inclusion in UWRG Working Papers by an authorized administrator of ScholarWorks @ Georgia State University. For more information, please contact [email protected].

ANDREW YOUNG SCHOOL O F P O L I C Y S T U D I E S
W.J. Usery Workplace Research Group Paper Series

1
Does Shortening the School Week Impact Student Performance?
Evidence from the Four-Day School Week
D. Mark Anderson
Department of Agricultural Economics and Economics
Montana State University
Mary Beth Walker
Andrew Young School of Policy Studies
Georgia State University
February 2012
Abstract
Public schools face difficult decisions on how to pare budgets. In the current financial
environment, school districts employ a variety of policies to close budget gaps and stave off
teacher layoffs and furloughs. An increasing number of schools are implementing four-day
school weeks hoping to reduce overhead and transportation costs. The four-day-week policy
requires substantial schedule changes as schools must increase the length of their school day to
meet state-mandated minimum instructional hour requirements. Although some schools have
indicated that this policy eases financial pressures, it is unknown whether the restructured
schedule has an impact on student outcomes. In this study, we use school-level longitudinal
data from the state of Colorado to investigate the relationship between the four-day school week
and academic performance among elementary school students. We exploit the temporal and
spatial variation in the four-day school week using a difference-in-differences empirical strategy.
Our results suggest that student academic achievement has not been hurt by the change in
schedule. Instead, the evidence indicates that the adoption a four-day school week shares a
positive and often statistically significant relationship with performance in both reading and
mathematics; the math results in particular are generally robust to a range of specification
checks. These findings have policy relevance to the current U.S. education system, where many
school districts must cut costs. The four-day school week is a strategy currently under debate.

2
“There’s no way a switch like that wouldn’t negatively affect teaching and learning.”
-Tim Callahan, spokesman for the Professional
Association of Georgia Educators (Wall Street Journal)
“We took our budget savings and plowed it right back into instructional content.”
-Riley Ramsey, Webster County, Kentucky school district
director of personnel and technology (TIME Magazine)
1. Introduction
A surprising number of schools have changed from the traditional Monday through
Friday school week to a four-day-week schedule. This policy has been in place for many years
in rural school districts in western states such as Colorado and Wyoming and it appears to be
spreading, with school districts from Oregon to Missouri to Florida currently considering it.1
Although there are alternative ways to implement the policy, typically the four school days are
lengthened in order to meet state-mandated minimum instructional hour requirements.2
The motivation for the schedule change is most often stated as financial, with savings
related to transportation and overhead costs. For example, Kentucky’s Webster County school
district reported substantial savings on transportation, utility, and insurance costs after adopting a
Tuesday through Friday schedule (Kingsbury 2008). The shortened week has helped the Peach
County, Georgia school district decrease spending on custodial and cafeteria workers in addition
to transportation expenditures and utilities (Herring 2010).3
This policy change yields a number of implications that should be evaluated to
understand the cost/benefit impact of the four-day week. For example, how much does a four-
1 Newspaper articles from the Tampa Bay Times (December 18, 2011), the NewsPress NOW in St. Joseph, Missouri
(December 25, 2011), and the Seattle Times (December 27, 2011) describe the current public discussion of a
proposed schedule change. 2 Generally, no classes are held on Friday; however, a small minority of schools operating on the four-day week take
Monday as their day off.
3 For additional evidence on financial savings, see Blankenship (1984) and Grau and Shaghnessy (1987).

3
day week actually affect school expenditures? If school buildings and gymnasiums are opened
on Fridays to accommodate extra activities (e.g. athletic events), cost savings could be modest.4
How do teachers react to a four-day schedule, is there less turnover, increased teacher
satisfaction? Spillover effects on communities could also be present; teens out of school on
Friday might engage more in crime or other risky behaviors.
Finally, and perhaps more critical than the aforementioned issues is the question of the
effect on student achievement. How do students fare under the altered schedule? Anecdotally,
results and opinions are mixed. Some educators and parent groups complain the shorter week
harms students academically (Herring 2010), while others have reported higher grade-point
averages and test scores after switching to the shortened week (Toppo 2002; Turner 2010).
Some accounts indicate that savings on transportation and utilities costs have been redirected to
instructional uses (Kingsbury 2008). Interestingly, the empirical research on the four-day week
generally supports the notion that student achievement is not adversely affected by the
alternative schedule.5 This research is entirely descriptive in nature, however, and often consists
of case studies focusing on only one or a few school districts. There has been no research on the
relationship between the four-day school week and academic performance that incorporates more
rigorous controls for potentially confounding factors.
This study estimates the impact of the four-day school week on student achievement
using 4th
grade reading and 5th
grade mathematics test scores from the Colorado Student
Assessment Program (CSAP). Over a third of school districts in Colorado have adopted the
4 If buildings are closed and placed on a weekend cycle, then savings equivalent to a three-day weekend are
possible. However, it is often the case that buildings are kept open for extra activities and for staff use (Dam 2006).
5 Daly and Richburg (1984), Sagness and Salzman (1993), Feaster (2002), Lefly and Penn (2009), and Hewitt and
Deny (2011) found little evidence that the four-day week had an impact on test performance. On the other hand,
McCoy (1983), Grau and Shaughnessy (1987), and Yarborough and Gilman (2006) found some evidence of higher
test scores.

4
four-day schedule. Our primary empirical strategy is a difference-in-differences estimation that
exploits the temporal and spatial variation in the adoption of four-day-week schedules. Our
results suggest that student academic achievement has not been compromised by the change in
schedule. Instead, the evidence indicates that the adoption of a four-day school week shares a
positive and often statistically significant relationship with performance in both reading and
mathematics; the math results in particular are generally robust to a range of specification
checks.
These findings have clear policy relevance to the current situation in the U.S. education
system, where many school districts must find ways to cut costs but, of course, do not want to
hamper student achievement. An important caveat is that our results speak only to impacts for
smaller and more rural districts; a wider adoption of the policy across more densely populated
areas would be required to allow a broader understanding of the effects.
The remainder of this paper is organized as follows: Section 2 provides background
information, including a description of the adoption of the four-day week in Colorado, a review
of the relevant academic literature, and a brief discussion on the possible advantages and
disadvantages of the policy; Section 3 describes the data; Section 4 lays out the empirical
strategy; Section 5 discusses the results; Section 6 concludes.
2. Background
2.1 Background of the Four-Day Week
It is reported that school districts in South Dakota in the 1930s were the first to use a
four-day-week schedule (Donis-Keller and Silvernail 2009). It was not until the energy crisis of
the early 1970s, however, that the shortened school week gained popularity (Ryan 2009). As
5
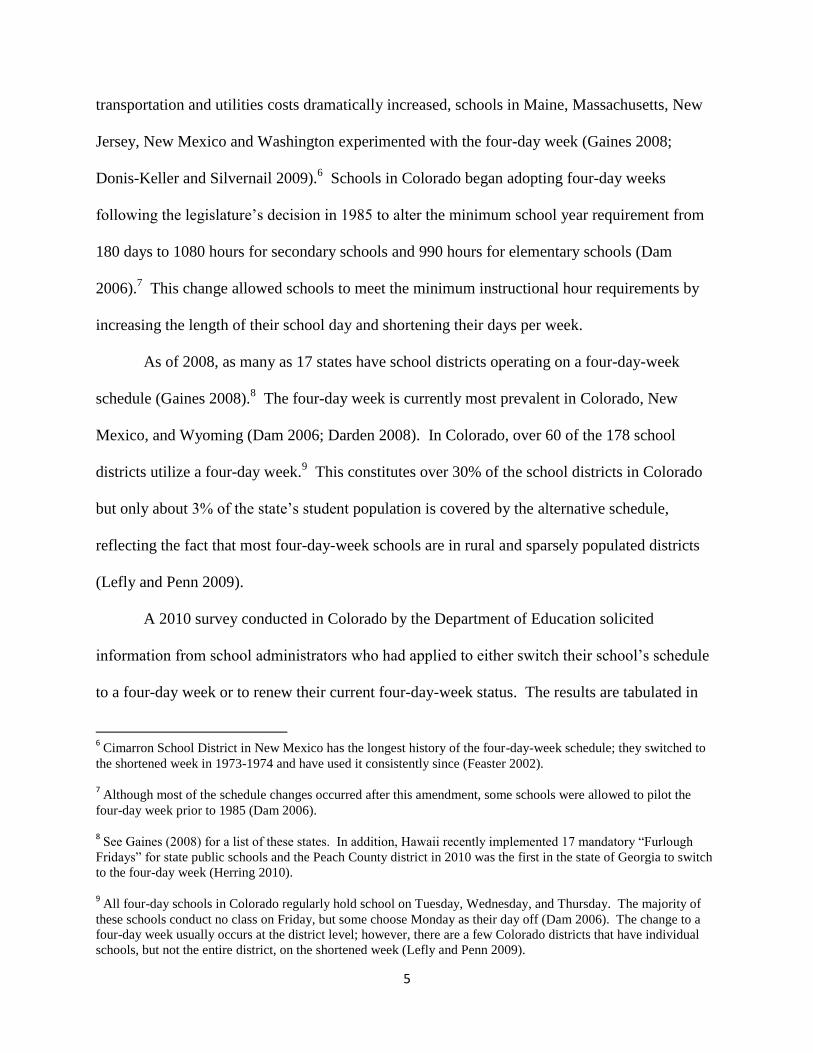
transportation and utilities costs dramatically increased, schools in Maine, Massachusetts, New
Jersey, New Mexico and Washington experimented with the four-day week (Gaines 2008;
Donis-Keller and Silvernail 2009).6 Schools in Colorado began adopting four-day weeks
following the legislature’s decision in 1985 to alter the minimum school year requirement from
180 days to 1080 hours for secondary schools and 990 hours for elementary schools (Dam
2006).7 This change allowed schools to meet the minimum instructional hour requirements by
increasing the length of their school day and shortening their days per week.
As of 2008, as many as 17 states have school districts operating on a four-day-week
schedule (Gaines 2008).8 The four-day week is currently most prevalent in Colorado, New
Mexico, and Wyoming (Dam 2006; Darden 2008). In Colorado, over 60 of the 178 school
districts utilize a four-day week.9 This constitutes over 30% of the school districts in Colorado
but only about 3% of the state’s student population is covered by the alternative schedule,
reflecting the fact that most four-day-week schools are in rural and sparsely populated districts
(Lefly and Penn 2009).
A 2010 survey conducted in Colorado by the Department of Education solicited
information from school administrators who had applied to either switch their school’s schedule
to a four-day week or to renew their current four-day-week status. The results are tabulated in
6 Cimarron School District in New Mexico has the longest history of the four-day-week schedule; they switched to
the shortened week in 1973-1974 and have used it consistently since (Feaster 2002).
7 Although most of the schedule changes occurred after this amendment, some schools were allowed to pilot the
four-day week prior to 1985 (Dam 2006).
8 See Gaines (2008) for a list of these states. In addition, Hawaii recently implemented 17 mandatory “Furlough
Fridays” for state public schools and the Peach County district in 2010 was the first in the state of Georgia to switch
to the four-day week (Herring 2010).
9 All four-day schools in Colorado regularly hold school on Tuesday, Wednesday, and Thursday. The majority of
these schools conduct no class on Friday, but some choose Monday as their day off (Dam 2006). The change to a
four-day week usually occurs at the district level; however, there are a few Colorado districts that have individual
schools, but not the entire district, on the shortened week (Lefly and Penn 2009).

6
Table A1; more than two thirds of the respondents stated that financial savings were a motivation
for the altered schedule, with another third citing community support.
2.2 Advantages and Disadvantages of the Four-Day Week
There are a host of possibilities that could allow for a changed weekly schedule to affect
student achievement. First, consider how teachers might respond to the changed schedule. It has
been conjectured that longer class periods give teachers flexibility to organize particular lessons
more effectively and incorporate more varied teaching methodologies (Rice et al. 2002).
Yarbrough and Gilman (2006) reported that teachers claimed the four-day week cut out wasted
time and forced them to focus their instruction more successfully. Durr (2003) found that
teachers actually reported covering more content under the shortened school week. In some
districts, the day off is devoted to teacher planning and enhances faculty collaboration
(Yarbrough and Gilman 2006). An additional teacher effect could be reduced turnover and
absenteeism; teacher turnover has been shown to have an impact on student achievement gains
(Ronfeldt et al. 2011). While it is unclear whether the four-day week has reduced turnover,
many school districts have reported fewer teacher absences after switching to the alternative
schedule (Chamberlain and Plucker 2003). Lastly, a different effect could be that teachers are
happy with the four-day weeks, and this leads to higher productivity while on the job. This
would be in accordance with the literature from psychology on the relationship between the four-
day workweek and employee satisfaction (Baltes et al. 1999).10
Although the four-day school week might lead to teacher effects that improve student
achievement, potential drawbacks exist. Critics note that teachers could initially face difficulties
10
It has also been shown that the compressed workweek can lead to decreased employee absenteeism (Pierce et al.
1989).

7
adapting their lesson plans to the change of schedule (Chamberlain and Plucker 2003). A survey
from an Idaho school district indicated that 24% of teachers reported greater stress and fatigue
due to the longer school days under the shortened week (Sagness and Salzman 1993).
From the standpoint of the students, a four-day week might lead to better attendance and
anecdotal evidence suggests this is the case (Toppo 2002; Kingsbury 2008; Turner 2010). Not
surprisingly, higher student attendance has been associated with better performance on
standardized tests (Ehrenberg et al. 1991). It has also been reported that students are less
distracted, exhibit improved morale, and behave better on the shortened weekly schedule (Koki
1992; Shoemaker 2002; Dam 2006; Donis-Keller and Silvernail 2009). All of these factors have
the potential to improve academic performance.11
In addition, students with long commutes
might fare better on a schedule with fewer trips (Ryan 2009).
On the other hand, the four-day school week has potential disadvantages from a student
perspective. For example, some worry that it is more difficult for students to retain subject
matter when given an extra day off (Gaines 2008). Perhaps the biggest concern is that the longer
school day requires extended focus and attention, and this could be especially relevant for
younger students (Dam 2006; Gaines 2008; Ryan 2009).12
Aside from the possible advantages and disadvantages listed above, there are several
reasons why the alternative schedule might actually increase the total amount of instructional
time students receive. First, the shortened school week gives parents the opportunity to schedule
medical and other necessary appointments on their school’s day off instead of on a regular
11
Sixty-three percent of 4th
through 7th
graders from the Shelley School District in Idaho reported that they felt they
“learned more in school” after their district switched to the four-day school week (Sagness and Salzman 1993).
12
Some schools have helped elementary students adjust to the longer school days by providing breakfast and serving
lunch later in the day (Hazard 1986).

8
school day (Grau and Shaughnessy 1987). This has the potential to reduce student absenteeism
and is particularly important for those who live in rural communities where long travel distances
for appointments are common (Richberg and Sjogren 1983; Dam 2006).13
Second, travel for
sporting events results in missed school time for student athletes. The four-day school week
alleviates absenteeism in this regard as many schools schedule athletics and other extra-
curricular activities on their day off (Dam 2006).14
This is less relevant for our study, however,
because we focus on the academic performance of elementary school students. Lastly, the four-
day schedule permits flexibility in the event of weather-related school cancellations; schools can
reschedule missed days without increasing the length of the school year (Donis-Keller and
Silvernail 2009). This is important for our research because the CSAP tests are administered
during the spring. As a result, if school is cancelled due to winter weather, then students will
generally make up lost time before taking the standardized tests rather than after.15
Although the data used in this study do not allow us to identify the mechanisms through
which the changed schedule may affect academic performance, it is useful to delineate the
possibilities in the hopes that future research can confirm or reject these hypotheses.
2.3 Relevant Literature on School Schedule Changes
While none of the schedule changes that have been rigorously empirically scrutinized
match precisely with the schedule change created by the four-day school week, there are at least
three relevant areas of inquiry. First, some research deals with block-scheduling, the reallocation
13
The same argument applies to teacher absenteeism. Decreases in teacher absenteeism have been reported as a
source of financial savings in terms of substitute teacher costs (Grau and Shaughnessy 1987).
14
This is especially relevant for rural areas because students at these schools are more likely to participate in school-
sponsored sports activities than students who attend urban schools (Lippman et al. 1996).
15
One school district estimated that students were in school approximately one week more per year after switching
to the four-day school week (Richburg and Sjogren 1983).

9
of fixed amounts of classroom time into longer blocks for some subjects. Implemented at the
high school level, the block schedule is designed to allow for more variety in instructional
formats, encourage more active teaching strategies, decrease disruptions during the school day,
and ultimately better prepare students for college work (Rice et al. 2002; Hughes Jr. 2004). This
educational policy change is appealing because overall class hours are not increased, so that no
new resources are required. However, the evidence is mixed regarding the ability of block
scheduling to enhance student performance (Rice et al. 2002; Hughes Jr. 2004).
Second, other research has examined the impacts of year-round schooling.16
Similar to
students on the four-day school week, students at year-round schools are typically expected to
receive the same amount of instructional time as students on traditional schedules. This
alternative school calendar simply consists of a set number of instructional hours spread over the
entire year. While past reviews of the research on year-round schooling are inconclusive
(Merino 1983; Cooper et al. 2003), recent work by Graves (2010, 2011) indicates the year-round
calendar may have detrimental effects on academic performance.17
Lastly, a number of studies have investigated the effects of an overall increase in
instructional time (see, e.g., Brown and Saks 1986, 1987; Link and Mulligan 1986; Coates 2003;
Marcotte 2007; Marcotte and Hemelt 2008; Bellei 2009).18
Generally, this research suggests that
16
Related to research on year-round schooling, others have examined the effects of mandatory summer schooling on
subsequent achievement. For example, Matsudaira (2008) uses a regression discontinuity design based on cutoff
scores on year-end exams to show small improvements in academic performance for those attending summer
classes.
17
Graves (2010, 2011) specifically focuses on multi-track year-round school calendars. These calendars have the
potential to mitigate school overcrowding by serving more students within the same facility than is possible under
traditional or single-track year-round calendars.
18
Along these lines, research has also considered the effects of full-day as opposed to half-day kindergarten
(DeCicca 2007; Cannon et al. 2011).

10
a positive relationship exists between instructional time and academic achievement, and that
instructional time is subject to diminishing returns.
3. Data
3.1 Data on Test Scores
We use test score data from the Colorado Student Assessment Program (CSAP) to
measure student performance.19
The CSAP tests are administered each spring and every public
school student within specified grades is required to take the exams.20
The tests are graded based
on one of four possible achievement levels: unsatisfactory, partially proficient, proficient, and
advanced. Our measures of interest are the percentage of students scoring proficient or advanced
in reading and the percentage of students scoring proficient or advanced in mathematics.21
These
measures represent some of the achievement benchmarks used to evaluate school performance
under No Child Left Behind (NCLB).
In particular, we focus on 4th
grade reading and 5th
grade mathematics scores. These data
are reported consistently over time and represent the longest time-series of available test scores
for Colorado public schools. Currently, students in grades 3 through 10 are required to complete
the reading and math assessments; but this was not always the case. In 1997, the reading exam
was only taken by students in the 4th
grade. For math, the exams were first administered in
elementary schools in 2001 to 5th
grade students. In addition, because there are many more
19
These data are publicly available from the Colorado Department of Education.
20
Schools are required to administer the tests during the period beginning on the second Monday in March and
ending on the third Monday in April. Additional details on the test schedules are available at
http://www.cde.state.co.us/cdeassess/co_law.html#Bullet3.
21
Although not our primary focus, we also consider results for all four possible test outcomes (see Table 6).

11
elementary schools than middle or high schools, these data are perhaps the most appropriate for
examining the causal effects of the four-day week on student achievement. Our final data set
consists of a school-level panel for the periods 2000-2010 and 2001-2010 for reading and
mathematics, respectively.22
Table 1 provides descriptive statistics for the test scores. A comparison of sample
averages for schools on four-day-week schedules to those for schools on traditional schedules
indicates that schools on the four-day week have lower percentages of 5th
graders scoring
proficient or advanced in mathematics. The mean percentage of 4th
graders scoring proficient or
advanced in reading is also slightly lower for schools on the four-day schedule, but this
difference is not statistically significant.
Table 2 illustrates test score results for the schools that changed their schedules to the
four-day week during our sample period. For the 5th
grade math and 4th
grade reading samples
we observe 14 and 17 schedule changers, respectively. We report means for the percentage of
students scoring proficient or advanced for the two years prior to the schedule change, the year in
which the schedule change took place, and the two years after the schedule change. Figures 1
and 2 plot the means from Table 2. In addition, these figures also plot means for the schools in
our control group (i.e. schools on traditional schedules). We randomly assigned a year of a
schedule change to these schools.23
For both math and reading, test scores appear stable for the
control group for the pre- and post-schedule change periods. However, for schools that switched
to a four-day week, there is a discrete increase in the percentage of students scoring proficient or
22
We do not present reading results for the period 1997-2010 because some of the covariates were not available for
the late 1990s. However, it should be noted that results from models with school and year fixed effects for the
period 1997-2010 are similar to those presented below.
23
In each figure, a vertical line distinguishes the years before the schedule change from the year of the schedule
change and the years after the schedule change.

12
advanced in math during the year in which the schedule change took place. For reading scores,
there also appears to be a discontinuous increase in performance for the four-day-week schools,
but this occurs one year after switching schedules.
3.2 Covariates
Table 1 also shows descriptive statistics for the remaining variables used in this paper.
The independent variable of interest is the Four-Day Week indicator. The Colorado Department
of Education provided the majority of information on school schedules and the timing of
schedule changes. For the few cases where schedule information was incomplete, we contacted
school districts individually to fill in the missing data.
At the county level, we control for the percent living in poverty and population density.24
Given that four-day-week schedules are implemented primarily for financial reasons in rural
areas, these variables are of particular importance.
We also control for several variables measured at the school district level. Instructional
expenditures per student are included as a standard input to the education production function.25
Other district-level controls include the percentage of teachers who are male, the percentage who
are white, and the percentage who are Hispanic.26
These demographic characteristics vary across
districts and are likely to be correlated with unobservables that influence academic outcomes.27
24
More specifically, the poverty measure represents the percentage of people aged 0 to 17 in families living in
poverty. This variable was imputed for 2010. The poverty and population density data are from the U.S. Census
Bureau.
25
The literature on the relationship between expenditures and student performance is extensive. For examples, see
Hanushek (1986), Dolan and Schmidt (1987), Lopus (1990), and Papke (2005).
26
All district-level data are from the Colorado Department of Education.
27
Some research suggests that teacher demographic characteristics such as gender and race directly influence
student achievement (Dee 2005; Hoffman and Oreopolous 2009).

13
Lastly, we control for the following school-level variables: total enrollment, pupil-to-
teacher ratio, percentage of students who receive free lunch, percentage of students who are
white, and percentage of students who are Hispanic.28
While the county- and district-level
variables control for important time-varying characteristics, the school-level variables perhaps
better capture environmental factors that impact test scores and are associated with four-day-
week status.
Because the four-day-week schedule is implemented in rural areas and sparsely populated
school districts, we base our estimation sample on restrictions to the Population density and
Total students variables. Our control group includes only schools with Population density and
Total students values that are less than the maximum values for these variables for the four-day-
week schools. Specifically, we restrict our focus to schools with enrollments not exceeding
1,100 students and that are in counties with less than 300 persons per square mile.29
We evaluate
the sensitivity of our results to alternative sample selection criteria in the robustness checks
below.
Table 1 indicates that, despite the sample selection criterion, differences across schools
persist. For example, schools on the four-day-week schedule are generally smaller and in poorer
areas. The four-day-week schools also have slightly lower student-teacher ratios and somewhat
lower percentages of Hispanic students than the traditional schedule schools. Again, because of
these differences, we examine the robustness of our results to alternative control group
specifications.
28
The school-level data are from the National Center for Education Statistics’ Common Core of Data.
29
Frontier Academy is the largest four-day-week school with 1,108 students in 2010. Ellicott Elementary is the
four-day-week school in the most densely populated county with over 290 persons per square mile in 2010. We also
drop observations from schools that have fewer than 5 years of available test score data.

14
4. Empirical Strategy
A standard difference-in-differences (DD) approach is used to estimate the effect of the
four-day school week on student performance. This method allows us to exploit the panel nature
of our data by estimating a model that includes school fixed effects and year effects. The
baseline estimating equation is:
(1) % Proficient/Advancedst = β0 + β1Four-Day Weekst + Xsdctβ2 + νs + ωt + εst,
where % Proficient/Advanced is the percentage of students in a specific grade at school s and
year t who score proficient or advanced in a particular test subject (math or reading).30
The
variable Four-Day Week indicates whether a four-day-week schedule was in place in school s
and year t. The coefficient of interest, β1, represents the marginal effect of switching to a four-
day week. Standard errors are adjusted for correlation at the district level (Bertrand et al.
2004).31
The vector X is comprised of the time-varying school (s), district (d), and county (c)
characteristics described above. The school fixed effects and year effects are represented by νs
and ωt, respectively. The school fixed effects control for differences across schools that are
time-invariant, while the year effects control for differences across time that are common to all
schools.
30
Marcotte (2007), Marcotte and Hemelt (2008), and Papke (2005) use a similar dependent variable to evaluate
student performance at the school level.
31
Inference is similar when standard errors are adjusted for correlation at the school level.

15
A potential source of selection bias comes from the possibility that certain types of
parents might opt to enroll their child in a four-day-week school. For example, a shortened
school week could increase the expense of childcare arrangements, so that this schedule could
appeal more to parents who are relatively less burdened by childcare costs.32
If children from
these families perform systematically better (or worse) in school than others, then estimates of
the effect of the four-day week on test scores will be biased. The chances of parents moving
their children to schools on the four-day week, however, are limited due to the rural location of
most four-day-week schools.33
School selection is also limited by restrictions on within-district
transfers. School fixed effects would account for this type of bias for schools that used the four-
day-week schedule throughout the sample period.
A second selection bias could result from the fact that school districts choose their
schedule. If only schools with financial issues change to a four-day-week schedule, then an
observed relationship between the four-day week and test scores might simply reflect the
financial situation of the school. School fixed effects would purge our estimates of this type of
bias.
School fixed effects cannot account for unobserved time-varying factors that
simultaneously influence student performance and the school’s choice of schedule. In addition,
it is possible a school could switch to a four-day week in response to a downward trend in test
scores. To address these issues, we include district-specific time trends in a sensitivity analysis
below.
32
Higher income households, families with a stay-at-home parent, or farm and ranch households may find the four-
day-week schedule appealing.
33
Within our data, we found little evidence that student enrollments increased after schools switched schedules.

16
5. Results
5.1 Primary Results
Table 3 presents our baseline OLS estimates of the relationship between the four-day
school week and the percentage of students scoring proficient or advanced on 5th
grade math
tests. Each column illustrates results from a separate regression and all models include school-
level fixed effects.
These results are striking; even when controlling for county-, district- and school-level
differences in socio-economic characteristics, the four-day school week is associated with an
increase of over 7 percentage points in the percentage of students scoring proficient or advanced
on the math achievement tests, and this result is estimated with precision. This represents
roughly a 12 percent increase from the mean test scores for schools on traditional schedules
(7.43/63.2 = 0.12).
Table 4 contains the results of similar models estimated using the percentage of students
scoring proficient or advanced on 4th
grade reading tests. The estimated impact of the four-day
week is generally smaller and less precisely estimated, but even when all covariates are included,
we still find a positive point estimate of over three percentage points.34
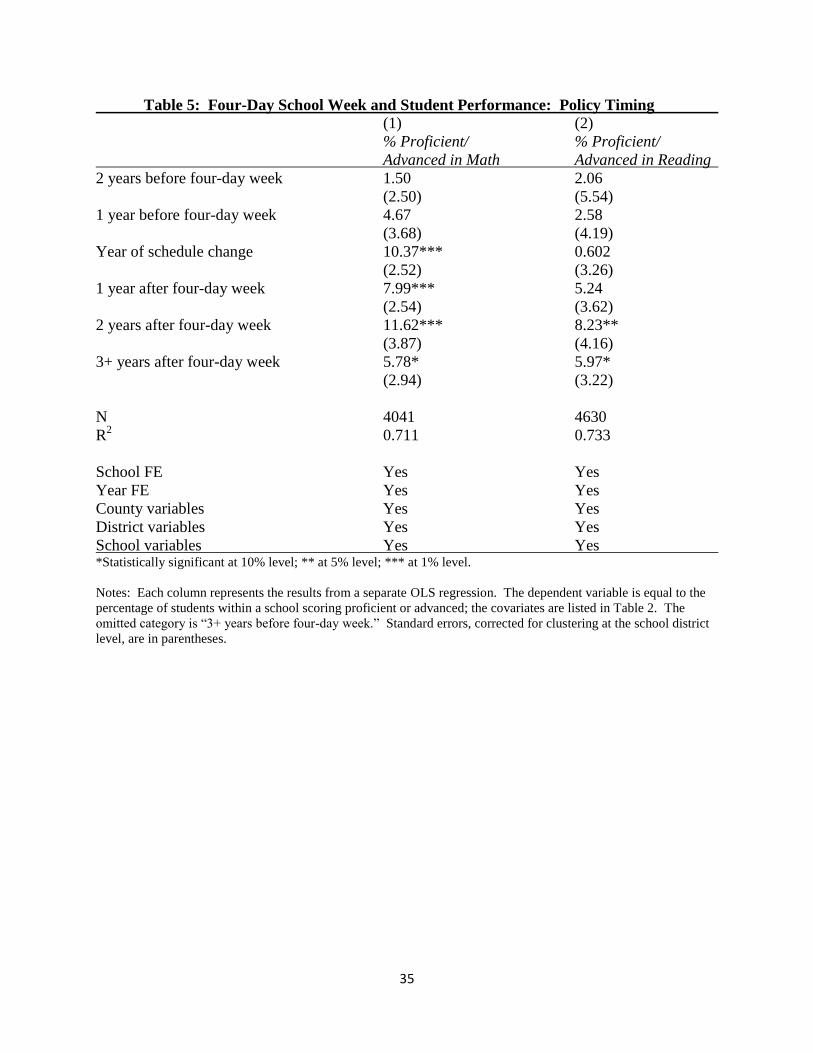
In Table 5, we present regression results designed to provide some insight into the
dynamic pattern of test scores prior to and following the change to a four-day school week.
Specifically, we replace the Four-Day Week variable with two lead indicators, an indicator for
the year of the schedule change, and three lag indicators. The omitted category is 3+ years
before a schedule change occurred. Column (1) shows results for the math scores. The
estimated coefficients prior to the policy change are positive, though not statistically significant,
34
It is fairly common to find stronger effects on math scores than on reading scores; see, for example, Dee and
Jacob (2011).

17
whereas the point estimates post-change are much larger and estimated with precision. These
results, to an extent, quell concerns that academic adjustments were made in anticipation of
schedule changes. Further analysis of the sensitivity of our baseline results to pre-existing trends
is included in the robustness checks below. The results in column (2) provide some evidence
that performance in reading goes up after schools switch to a four-day week; although, only the
estimates for the final two lags are individually statistically significant at conventional levels.
The indicator for the year of the schedule change and the three lag indicators are weakly jointly
significant.
Because our results indicate that the percentage of students achieving proficient or
advanced scores increases when schedules are changed, it is interesting to consider which group
of students accounts for the improvement. As mentioned above, the Colorado Department of
Education tabulates student scores according to four possible achievement levels: unsatisfactory,
partially proficient, proficient, and advanced. Table 6 shows results of regressions where each
achievement level is considered as a separate outcome and is regressed against the policy
indicator and the full set of covariates. These results tell an interesting story. For math, we find
that the biggest share of the improvement comes from the students formerly classified as
partially proficient, this group falls by an estimated 4.6 percentage points following the schedule
change. As a result, we see a large and statistically significant increase in the percentage of
students scoring at the proficient level. For reading, the only statistically significant results occur
in the lowest and the highest categories. The results show that the percentage of students rated
unsatisfactory fell by nearly 2.5 percentage points after the schedule change whereas the
percentage of students in the advanced category rose by over two percentage points. Of course,
this does not necessarily imply that formerly unsatisfactory students are now scoring at the

18
advanced level. It may simply be that the four-day week resulted in a relatively uniform shift
upward in test scores across all achievement levels.
5.2 Robustness Checks
We first perform a robustness check based on Luallen (2006). Specifically, we create a
placebo Four-Day Week indicator using a random number generator based on the uniform
distribution. Because 14 schools switched to a four-day week during our sample period for math
scores, we assign 14 placebo policies for each trial run. For the reading sample, we assign 17
placebo policies.35
We run 25 trials for each test score outcome.
Table 7 illustrates the average coefficient estimates for the placebo Four-Day Week on
the percentage of 5th
graders scoring proficient or advanced in mathematics and the percentage of
4th
graders scoring proficient or advanced in reading. In both regressions, the average estimate is
very small in magnitude. Furthermore, in 25 trials, only one estimate was positive and
statistically significant at the 5 percent level for math performance and only two estimates were
positive and statistically significant at the 5 percent level for reading performance.36
These
results provide evidence that random assignment of the four-day-week schedule cannot generate
our results.
As discussed above, the schools on the four-day-week schedule are different than schools
on traditional schedules along several margins. In reality, the four-day week is not a randomly
assigned policy. While the inclusion of school fixed effects controls for time-invariant
35
A year for a schedule change was randomly selected between 2000 and 2010 for the reading test regressions and
2001 and 2010 for the math test regressions.
36
For math performance, one estimate was negative and statistically significant at the 5 percent level. For reading
performance, two estimates were negative and statistically significant at the 5 percent level.

19
heterogeneity across schools, it is useful to consider a propensity score matching technique used
in conjunction with our difference-in-differences estimator.37
This method essentially amounts
to re-estimating equation (1) on a matched sample, a subset of the original sample.38
The goal for matching is to find a group among the comparison population (i.e. the
schools that remained on the traditional schedule) that looks as similar as possible to the schools
that changed schedules.39
Thus, we predict whether a school switches to a four-day week during
our sample period based on observable characteristics from 2001. Table A3 presents the probit
results. Consistent with anecdotal evidence, schools with higher transportation expenditures are
more likely to switch to a four-day week.
Table 8 illustrates results from the estimation of equation (1) on propensity score
matched samples.40
For math, the estimates are smaller than those shown in Table 3; however,
they are still relatively large in magnitude and two of the three estimates are statistically
significant at the 5 percent level even though the sample has shrunk by a factor of four. While
the estimate for the case where k = 5 is positive and substantial in size, it is not statistically
significant at conventional levels (p-value = 0.101). For reading, the magnitudes of the estimates
are on par with those from Table 4 and two of the three estimates are weakly statistically
significant.
37
For a practical discussion on propensity score matching, see Becker and Ichino (2002).
38
For research employing similar methods, see Heckman et al. (1997), Sabia (2006), Gilligan and Hoddinott (2007),
and Debaere et al. (2010).
39
Table A2 presents descriptive statistics for the propensity score matching analysis.
40
Specifically, we use the k-nearest neighbor matching algorithm, an approach where each four-day-week school is
matched to multiple schools from the comparison group.40
We consider values of k = 25, k = 10, and k = 5; the
choice of k involves a trade-off between reduced variance and increased bias. That is, variance is reduced when a
higher value of k is chosen because more information is used to construct the counterfactual for each treated unit;
but, increased bias results from poorer matches on average (Caliendo and Kopeinig 2005).

20
For completeness, we perform the following additional robustness checks. The
sensitivity analyses for the math results are reported in Table 9. In column (1), the baseline
estimate of the fully specified model (see column (5) of Table 3) is reported for comparison.
Column (2) of Table 9 reports results from a model where the school fixed effects are replaced
with district fixed effects. Not surprisingly, the coefficient estimate on the Four-Day Week
indicator is larger in magnitude and highly statistically significant.41
Column (3) illustrates results where school district-specific linear time trends are added
to the right-hand-side of equation (1). The district-specific trends are intended to control for the
influence of difficult-to-measure factors at the district level that evolve smoothly over time.
Although the coefficient size remains relatively large, it is measured with less precision and is no
longer statistically significant at conventional levels.42
Of course, because this model uses up
degrees of freedom, less precision is to be expected.
The results in column (4) come from a regression weighted by the school-level student
population.43
Here, the coefficient estimate remains relatively large in magnitude and is
statistically significant at the 5 percent level.
For the results in column (5), we restrict the sample to only schools that were on
traditional schedules at the beginning of our sample period. Identification in our difference-in-
differences framework comes from the schools that we observe switching schedules.
41
As expected, the model with district fixed effects explains less variation in the percentage of students scoring
proficient or advanced. This implies that school-level time-invariant unobserved characteristics explain much of the
variation in test scores across schools.
42
Results based on district-specific trends are presented as opposed to results based on school-specific trends
because the policy change almost always occurs at the district level. As a result, it is conceivable that unobserved
time-varying characteristics that drive the decision to switch to the four-day week are more likely to be district-level
factors. However, it is important to note that results are similar when controlling for school-specific linear time
trends (coefficient estimate on Four-Day Week = 5.95; standard error = 4.33).
43
Weighted least squares helps to deal with heteroskedasticity that may arise because smaller schools are more
likely to see greater swings in their percentage of students scoring proficient of advanced.

21
Consequently, our results should change little from baseline when excluding schools that enter
our sample already on the four-day week. The estimate in column (5) confirms that this is the
case.
Finally, we restrict our sample based on the U.S. Census’s definition of “rural.” While
this selection criterion increases our sample size by over 80 percent, the results change little from
baseline.44
The results from the sensitivity analyses for the reading scores are provided in Table 10.
While the reading results are more sensitive than the math results to model specification and
sample selection, all coefficient estimates remain positive in sign. With the exception of the
column (3) result, the magnitudes of the coefficient estimates remain large. When district-
specific trends are added, the estimate becomes much smaller and is not measured precisely.
6. Conclusion
In a time of tough budget situations for most public school systems, a variety of cost-
saving measures have been adopted. To relieve financial pressures, a growing number of smaller
and more rural school districts are switching from the traditional Monday through Friday school
week to a four-day-week schedule. One concern, however, is that student academic performance
may be compromised by such a switch. The results presented in this paper illustrate that
academic outcomes are not sacrificed under the four-day week; in fact, we provide some
evidence that math and reading achievement scores in elementary schools actually improve
following the schedule change. The math results in particular are robust to a number of
alternative specifications and checks.
44
According to the Census, a “rural” county has a population density of less than 1,000 persons per square mile
(Ricketts et al. 1998). Though not reported for the sake of brevity, it is important to note that results based on
specifications with no sample restrictions are similar to the baseline estimates.

22
Specifically, using data from the Colorado Department of Education, we find that scores
on math achievement tests increase by roughly 12 percent after the switch to a four-day-week
schedule. The estimated impact of the four-day week on reading achievement is always positive
in sign but is generally smaller in magnitude and estimated with less precision. Policy-makers
and school administrators will want to take these potential gains in academic performance into
consideration when weighing the costs and benefits associated with the four-day school week.
Although we discussed a variety of channels through which the four-day week may
impact student performance, our school-level data leaves us silent as to which mechanisms are
most important. It will be valuable for future work to determine whether factors such as teaching
methods, teacher satisfaction, or student attendance account for improving student achievement.
There are a number of other possible implications of this schedule change that merit
examination. In particular, this study looked only at 4th
and 5th
grade math and reading scores.
One might conjecture that this policy change could have an even greater influence on older
students. For high school students, four-day school weeks may make it easier to handle part-
time jobs. An interesting line of inquiry would be the impact of this alternative schedule on
drop-out rates.
Lastly, a key issue for consideration is whether our results generalize to larger and less
rural districts. There has been some discussion that the four-day school week would not work as
well in more urban areas due to issues concerning the increased demand for child care, special
needs students, and delinquency (Fager 1997).

23
Acknowledgements
We would like to thank Tim Sass and seminar participants at Montana State University
and the University of Washington for comments and suggestions. We also owe a special thanks
to the Colorado Department of Education for providing data used in this paper.
References
Baltes, Borris; Briggs, Thomas; Huff, Joseph; Wright, Julie and George Neuman. 1999.
“Flexible and Compressed Workweek Schedules: A Meta-Analysis of Their Effects on
Work-Related Criteria.” Journal of Applied Psychology 84: 496-513.
Becker, Sascha and Andrea Ichino. 2002. “Estimation of Average Treatment Effects Based
on Propensity Scores.” Stata Journal 2: 358-377.
Bellei, Cristian. 2009. “Does Lengthening the School Day Increase Students’ Academic
Achievement? Results from a Natural Experiment in Chile.” Economics of Education
Review 28: 629-640.
Bertrand, Marianne; Duflo, Esther and Sendhil Mullainathan. 2004. “How Much Should we
Trust Differences-in-Differences Estimates? Quarterly Journal of Economics 119: 249-
276.
Blankenship, Ted. 1984. “Update: These School Systems Swear by the Four-Day School Week
Because Students Work Harder and Face Fewer Distractions.” American School Board
Journal 171: 32-33.
Brown, Byron and Daniel Saks. 1986. “Measuring the Effects of Instructional Time on Student
Learning: Evidence from the Beginning Teacher Evaluation Study.” American Journal
of Education 94: 480-500.
Brown, Byron and Daniel Saks. 1987. “The Microeconomics of the Allocation of Teachers’
Time and Student Learning.” Economics of Education Review 6: 319-337.
Caliendo, Marco and Sabine Kopeinig. 2005. “Some Practical Guidance for the Implementation
of Propensity Score Matching.” IZA Discussion Paper No. 1588.
Cannon, Jill; Jacknowitz, Alison and Gary Painter. 2011. “The Effect of Attending Full-Day
Kindergarten on English Learner Students.” Journal of Policy Analysis and Management
30: 287-309.
Chamberlin, Molly and Jonathan Plucker. 2003. “The Four-Day School Week.” Education

24
Policy Briefs 1: 1-3.
Coates, Dennis. 2003. “Education Production Functions Using Instructional Time as an Input.”
Education Economics 11: 273-292.
Cooper, Harris; Valentine, Jeffrey; Charlton, Kelly and April Melson. 2003. “The Effects of
Modified School Calendars on Student Achievement and on School and Community
Attitudes.” Review of Educational Research 73: 1-52.
Daly, Joseph and Robert Richburg. 1984. “Student Achievement in the Four-Day School
Week.” Office for Rural Education, Colorado State University. Available at:
http://www.eric.ed.gov/ERICWebPortal/search/detailmini.jsp?_nfpb=true&_&ERICExtS
earch_SearchValue_0=ED252346&ERICExtSearch_SearchType_0=no&accno=ED2523
46.
Dam, Ai. 2006. “The 4 Day School Week.” Colorado Department of Education. Available at:
http://www.cde.state.co.us/cdeedserv/download/pdf/4dayweek06.pdf.
Darden, Edwin. 2008. “The Four-Day School Week: A Fuel’s Paradise?” Forecast 6: 1-4.
Debaere, Peter; Lee, Hongshik and Joonhyung Lee. 2010. “It Matters Where You Go:
Outward Foreign Direct Investment and Multinational Employment Growth at Home.”
Journal of Development Economics 91: 301-309.
DeCicca, Philip. 2007. “Does Full-Day Kindergarten Matter? Evidence from the First Two
Years of Schooling.” Economics of Education Review 26: 67-82.
Dee, Thomas. 2005. “A Teacher like Me: Does Race, Ethnicity, or Gender Matter?” American
Economic Review Papers and Proceedings 95: 158-165.
Dee, Thomas and Brian Jacob. 2011. “The Impact of No Child Left Behind on Student
Achievement.” Journal of Policy Analysis and Management 30: 418-446.
Dolan, Robert and Robert Schmidt. 1987. “Assessing the Impact of Expenditure on
Achievement: Some Methodological and Policy Considerations.” Economics of
Education Review 6: 285-299.
Donis-Keller, Christine and David Silvernail. 2009. “A Review of the Evidence on the Four-
Day School Week.” Center for Education Policy, Applied Research and Evaluation,
University of Southern Maine. Available at:
http://www2.umaine.edu/mepri/sites/default/files/CEPARE%20Brief%20on%20the%204
-day%20school%20week%202.10.pdf.
Durr, Greta. 2003. “Four-Day School Week?” State Legislatures 29: 21.
Ehrenberg, Ronald; Ehrenberg, Randy; Rees, Daniel and Eric Ehrenberg. 1991. “School District

25
Leave Policies, Teacher Absenteeism, and Student Achievement.” Journal of Human
Resources 26: 72-105.
Fager, Jennifer. 1997. “Scheduling Alternatives: Options for Student Success.” Northwest
Regional Education Laboratory.
Feaster, Rebecca. 2002. “The Effects of the Four-Day School Week in Custer, South Dakota.”
Doctoral dissertation, University of South Dakota.
Gaines, Gale. 2008. “Focus on the School Calendar: The Four-Day School Week.” Southern
Regional Education Board. Available at:
http://publications.sreb.org/2008/08S06_Focus_sch_calendar.pdf.
Gilligan, Daniel and John Hoddinott. 2007. “Is There Persistence in the Impact of Emergency
Food Aid? Evidence on Consumption, Food Security, and Assets in Rural Ethiopia.”
American Journal of Agricultural Economics 89: 225-242.
Grau, Elnabeth and Michael Shaughnessy. 1987. “The Four Day School Week: An
Investigation and Analysis.” Eastern New Mexico University. Available at:
http://www.eric.ed.gov/ERICWebPortal/search/detailmini.jsp?_nfpb=true&_&ERICExtS
earch_SearchValue_0=ED317337&ERICExtSearch_SearchType_0=no&accno=ED3173
37.
Graves, Jennifer. 2010. “The Academic Impact of Multi-Track Year-Round School Calendars:
A Response to School Overcrowding.” Journal of Urban Economics 67: 378-391.
Graves, Jennifer. 2011. “Effects of Year-Round Schooling on Disadvantaged Students and the
Distribution of Standardized Test Performance.” Economics of Education Review 30:
1281-1305.
Hanushek, Eric. 1986. “The Economics of Schooling.” Journal of Economic Literature 24:
1141-1177.
Hazard, Louise. 1986. “What About the Four-Day School Week?” Delta Kappa Gamma
Bulletin 52: 56-57.
Heckman, James; Ichimura, Hidehiko and Petra Todd. 1997. “Matching As An Econometric
Evaluation Estimator: Evidence from Evaluating a Job Training Programme.” Review
of Economic Studies 64: 605-654.
Herring, Chris. 2010. “Schools’ New Math: The Four-Day Week.” Wall Street Journal. 8
March. Available at:
http://online.wsj.com/article/SB20001424052748704869304575104124088312524.html.
Hewitt, Paul and George Denny. 2011. “The Four-Day School Week: Impact on Student
Performance.” Rural Educator 32: 23-31.

26
Hoffman, Florian and Philip Oreopoulos. 2009. “A Professor Like Me: The Influence of
Instructor Gender on College Achievement.” Journal of Human Resources 44: 479-494.
Hughes Jr., Woodrow. 2004. “Blocking Student Performance in High School?” Economics of
Education Review 23: 663-667.
Kingsbury, Kathleen. 2008. “Four-Day School Weeks.” TIME. 14 August. Available at:
http://www.time.com/time/magazine/article/0,9171,1832864,00.html.
Koki, Stan. 1992. “Modified School Schedules: A Look at the Research and the Pacific.”
Pacific Region Educational Lab. Available at:
http://www.eric.ed.gov/ERICWebPortal/search/detailmini.jsp?_nfpb=true&_&ERICExtS
earch_SearchValue_0=ED354630&ERICExtSearch_SearchType_0=no&accno=ED3546
30.
Lefly, Dianne and Jhon Penn. 2009. “A Comparison of Colorado School Districts Operating
on Four-Day and Five-Day Calendars.” Colorado Department of Education. Available
at:
http://www.cde.state.co.us/cdeassess/documents/res_eval/2009_Colorado_districts_4day
_school_week.pdf.
Link, Charles and James Mulligan. 1986. “The Merits of a Longer School Day.” Economics of
Education Review 5: 373-381.
Lippman, Laura; Burns, Shelley and Edith McArthur. 1996. “Urban Schools: The Challenge of
Location and Poverty.” U.S. Department of Education. National Center for Education
Statistics, NCES 96-184.
Lopus, Jane. 1990. “Do Additional Expenditures Increase Achievement in the High School
Economics Class?” Journal of Economic Education 21: 277-286.
Luallen, Jeremy. 2006. “School’s Out…Forever: A Study on Juvenile Crime, At-Risk Youths
and Teacher Strikes.” Journal of Urban Economics 59: 75-103.
Marcotte, Dave. 2007. “Schooling and Test Scores: A Mother-Natural Experiment.”
Economics of Education Review 26: 629-640.
Marcotte, Dave and Steven Hemelt. 2008. “Unscheduled School Closings and Student
Performance.” Education Finance and Policy 3: 316-338.
Matsudaira, Jordan. 2008. “Mandatory Summer School and Student Achievement.” Journal of
Econometrics 142: 829-850.
McCoy, Jack. 1983. “A Summary Report on the Four-Day School Week in New Mexico.”
New Mexico State Department of Education, Evaluation, Testing, and Data Management.

27
Merino, Barbara. 1983. “The Impact of Year-Round Schooling: A Review.” Urban Education
18: 298-316.
Papke, Leslie. 2005. “The Effects of Spending on Test Pass Rates: Evidence from Michigan.”
Journal of Public Economics 89: 821-839.
Pierce, Jon; Newstrom, John; Dunham, Randall and Alison Barber. 1989. Alternative Work
Schedules. Needham Heights, MA: Allyn and Bacon.
Rice, Jennifer; Croninger, Robert and Christopher Roellke. 2002. “The Effect of Block
Scheduling High School Mathematics Courses on Student Achievement and Teachers’
Use of Time: Implications for Educational Productivity.” Economics of Education
Review 21: 599-607.
Richberg, Robert and Douglas Sjogren. 1983. “The Four-Day Week – What Are the
Advantages for Schools?” NASSP Bulletin 67: 60-63.
Ricketts, Thomas; Johnson-Webb, Karen and Patricia Taylor. 1998. “Definitions of Rural:
A Handbook for Health Policy Makers and Researchers.” Federal Office of Rural Health
Policy. Available at:
http://www.shepscenter.unc.edu/rural/pubs/report/ruralit.pdf.
Ronfeldt, Matthew; Lankford, Hamilton; Loeb, Susanna and James Wyckoff. 2011. “How
Teacher Turnover Harms Student Achievement.” NBER Working Paper No. 17176.
Ryan, Molly. 2009. “Four-Day School Week.” Education Commission of the States.
Available at:
http://www.ecs.org/clearinghouse/82/94/8294.pdf.
Sabia, Joseph. 2006. “Does Sex Education Affect Adolescent Sexual Behaviors and Health?”
Journal of Policy Analysis and Management 25: 783-802.
Sagness, Richard and Stephanie Salzman. 1993. “Evaluation of the Four-Day School Week in
Idaho Suburban Schools.” Paper presented at the Annual Meeting of the Northern Rocky
Mountain Education Research Association. Available at:
http://www.eric.ed.gov/ERICWebPortal/search/detailmini.jsp?_nfpb=true&_&ERICExtS
earch_SearchValue_0=ED362995&ERICExtSearch_SearchType_0=no&accno=ED3629
95.
Shoemaker, Michael (ed.). 2002. “Effects of Four-Day School Schedule Undecided.” Journal
of Physical Education, Recreation & Dance 73: 8-9.
Toppo, Greg. 2002. “In Rural Areas, the Four-Day School Week is Growing in Popularity.”
Christian Science Monitor. 20 August. Available at:
http://www.csmonitor.com/2002/0820/p14s02-lecs.html.

28
Turner, Dorie. 2010. “No Class: 4-Day School Weeks Gain Popularity Nationwide.” USA
Today. 4 June. Available at:
http://www.usatoday.com/news/education/2010-06-04-shorter-school-week_N.htm.
Yarborough, Rachel and David Gilman. 2006. “From Five Days to Four.” Educational
Leadership 64: 80-85.

29
50
55
60
65
70
75
-2 -1 Year ofschedulechange
1 2
% P
rofi
cien
t/A
dva
nce
d
On the horizontal axis, "year of schedule change" represents the year in which schools changed to a four-day week. It was randomly assigned to schools that remained on traditional schedules during the period under study.
Figure 1. Percent Scoring Proficient or Advanced in Math
Four-Day WeekSchools
Traditional ScheduleSchools

30
50
55
60
65
70
75
-2 -1 Year ofschedulechange
1 2
% P
rofi
cien
t/A
dva
nce
d
On the horizontal axis, "year of schedule change" represents the year in which schools changed to a four-day week. It was randomly assigned to schools that remained on traditional schedules during the period under study.
Figure 2. Percent Scoring Proficient or Advanced in Reading
Four-Day WeekSchools
Traditional ScheduleSchools

31
Table 1: Descriptive Statistics (1) (2) (3) (4)
Four-day week: Traditional schedule: Four-day week: Traditional schedule:
5th grade math sample 5
th grade math sample 4
th grade reading sample 4
th grade reading sample
Mean Std. Dev. Mean Std. Dev. Mean Std. Dev. Mean Std. Dev.
Test scores
Percent scoring proficient 60.3 16.8 63.2 17.0 66.1 15.6 66.9 15.5
or advanceda
County-level variables
Percent poverty a, b
18.7 9.81 14.4 6.17 18.5 9.71 14.4 6.11
Population density (per sq. mile)a, b
51.2 92.1 122 108 50.1 91.6 120 108
School district-level variables
Instructional expenditures 4566 630 4135 501 4575 661 4110 511
per studenta, b
Percent of male teachersa, b
29.7 9.95 26.4 5.20 29.2 9.21 26.4 5.10
Percent of Hispanic teachersa 7.55 15.8 6.46 6.54 7.15 15.2 6.35 6.54
Percent of white teachersb 91.4 16.1 90.3 10.7 91.9 15.5 90.5 10.7
School-level variables Total students
a, b 228 156 399 150 225 152 399 149
Pupil-teacher ratioa, b
14.2 2.91 16.2 10.2 14.1 2.86 16.3 10.7
Percent free lunch 39.9 21.9 37.3 23.9 39.8 21.0 37.2 23.8
Percent of Hispanic studentsa, b
21.2 22.3 24.8 21.1 20.3 21.3 24.8 21.2
Percent of white studentsa, b
75.4 222 67.7 22.0 76.4 21.2 67.9 22.0
N 282 3759 326 4304 Notes:
a Means are statistically different at 5% level for 5
th grade math sample.
b Means are statistically different at 5% level for 4
th grade reading sample.
Unweighted means for the 5th
grade math sample are based on data from 2001-2010. Unweighted means for the 4th
grade reading sample are based on data from
2000-2010.

32
Table 2: Descriptive Statistics for Schedule Changers: Mean Percentages of Students Scoring Proficient or Advanced
(1) (2) (3) (4) (5)
2 years before 1 year before Year of 1 year after 2 years after
change to a change to a change to a change to a change to a
four-day week four-day week four-day week four-day week four-day week
Mean Std. Dev. Mean Std. Dev. Mean Std. Dev. Mean Std. Dev. Mean Std. Dev.
5th
grade math 53.2 17.4 55.5 19.2 63.1 16.2 62.3 16.8 67.6 14.2
4th
grade reading 60.8 15.7 61.5 14.5 58.9 17.4 66.5 16.3 68.6 15.0 Notes: Unweighted means for the 5
th grade math sample are based on data from 2001-2010; fourteen schools changed their schedule to a four-day week during
this period. Unweighted means for the 4th
grade reading sample are based on data from 2000-2010; seventeen schools changed their schedule to a four-day week
during this period.

33
Table 3: Four-Day School Week and Student Performance: Baseline 5th
Grade Math Results
(1) (2) (3) (4) (5)
% Proficient/ %Proficient/ % Proficient/ % Proficient/ % Proficient/
Advanced in Math Advanced in Math Advanced in Math Advanced in Math Advanced in Math
Four-Day Week 13.15*** 7.44*** 7.43*** 7.22*** 7.43***
(1.48) (1.68) (1.77) (1.70) (1.72)
N 4041 4041 4041 4041 4041
R2 0.659 0.707 0.707 0.708 0.711
School FE Yes Yes Yes Yes Yes
Year FE No Yes Yes Yes Yes
County variables No No Yes Yes Yes
District variables No No No Yes Yes
School variables No No No No Yes * Statistically significant at 10% level; ** at 5% level; *** at 1% level.
Notes: Each column represents the results from a separate OLS regression. The dependent variable is equal to the percentage of students within a school scoring
proficient or advanced; the covariates are listed in Table 2. Standard errors, corrected for clustering at the school district level, are in parentheses.

34
Table 4: Four-Day School Week and Student Performance: Baseline 4th
Grade Reading Results
(1) (2) (3) (4) (5)
% Proficient/ %Proficient/ % Proficient/ % Proficient/ % Proficient/
Advanced in Reading Advanced in Reading Advanced in Reading Advanced in Reading Advanced in Reading
Four-Day Week 5.96** 3.32 3.64 3.68 3.76*
(2.54) (2.49) (2.47) (2.42) (2.24)
N 4630 4630 4630 4630 4630
R2 0.709 0.726 0.726 0.727 0.733
School FE Yes Yes Yes Yes Yes
Year FE No Yes Yes Yes Yes
County variables No No Yes Yes Yes
District variables No No No Yes Yes
School variables No No No No Yes * Statistically significant at 10% level; ** at 5% level; *** at 1% level.
Notes: Each column represents the results from a separate OLS regression. The dependent variable is equal to the percentage of students within a school scoring
proficient or advanced; the covariates are listed in Table 2. Standard errors, corrected for clustering at the school district level, are in parentheses.
35
Table 5: Four-Day School Week and Student Performance: Policy Timing
(1) (2)
% Proficient/ % Proficient/
Advanced in Math Advanced in Reading
2 years before four-day week 1.50 2.06
(2.50) (5.54)
1 year before four-day week 4.67 2.58
(3.68) (4.19)
Year of schedule change 10.37*** 0.602
(2.52) (3.26)
1 year after four-day week 7.99*** 5.24
(2.54) (3.62)
2 years after four-day week 11.62*** 8.23**
(3.87) (4.16)
3+ years after four-day week 5.78* 5.97*
(2.94) (3.22)
N 4041 4630
R2 0.711 0.733
School FE Yes Yes
Year FE Yes Yes
County variables Yes Yes
District variables Yes Yes
School variables Yes Yes *Statistically significant at 10% level; ** at 5% level; *** at 1% level.
Notes: Each column represents the results from a separate OLS regression. The dependent variable is equal to the
percentage of students within a school scoring proficient or advanced; the covariates are listed in Table 2. The
omitted category is “3+ years before four-day week.” Standard errors, corrected for clustering at the school district
level, are in parentheses.

36
Table 6: Four-Day School Week and Student Performance: All Test Score Categories
(1) (2) (3) (4)
% Unsatisfactory % Partially Proficient % Proficient % Advanced
in Math in Math in Math in Math
Math
Four-Day Week -2.48* -4.61*** 3.80** 3.63
(1.49) (1.12) (1.87) (2.38)
N 4041 4041 4041 4041
R2 0.593 0.549 0.332 0.693
(1) (2) (3) (4)
% Unsatisfactory % Partially Proficient % Proficient % Advanced
In Reading in Reading in Reading in Reading
Reading
Four-Day Week -2.43* -0.666 1.63 2.14***
(1.39) (1.69) (1.99) (0.799)
N 4630 4630 4630 4630
R2 0.638 0.580 0.651 0.554
School FE Yes Yes Yes Yes
Year FE Yes Yes Yes Yes
County variables Yes Yes Yes Yes
District variables Yes Yes Yes Yes
School variables Yes Yes Yes Yes * Statistically significant at 10% level; ** at 5% level; *** at 1% level.
Notes: Each cell represents the results from a separate OLS regression. The dependent variable is equal to the percentage of students within a school scoring in
one of the following four indicated categories: unsatisfactory, partially proficient, proficient, advanced. The covariates are listed in Table 2. Standard errors,
corrected for clustering at the school district level, are in parentheses.

37
Table 7: Random Four-Day Week Assignment
(1) (2)
% Proficient/ % Proficient/
Advanced in Math Advanced in Reading
Average Four-Day Week -0.908 0.514
coefficient estimate
Number of trials 25 25
Number of Four-Day Week 1 2
estimates that were positive
and significant at 5% level
School FE Yes Yes
Year FE Yes Yes
County variables Yes Yes
District variables Yes Yes
School variables Yes Yes *Statistically significant at 10% level; ** at 5% level; *** at 1% level.
Notes: Each column represents the results from a series of OLS regressions. The dependent variable is equal to the
percentage of students within a school scoring proficient or advanced; the covariates are listed in Table 2.

38
Table 8: Four-Day School Week and Student Performance: Matched Samples (1) (2) (3)
% Proficient/ % Proficient/ % Proficient/
Advanced in Math Advanced in Math Advanced in Math
Math
Four-Day Week 5.32** 5.44** 4.32
(2.35) (2.48) (2.57)
k-nearest neighbors k = 25 k = 10 k = 5
N 1042 822 569
R2 0.711 0.713 0.687
(1) (2) (3)
% Proficient/ % Proficient/ % Proficient/
Advanced in Reading Advanced in Reading Advanced in Reading
Reading
Four-Day Week 4.02* 3.60* 2.75
(2.22) (2.01) (1.84)
k-nearest neighbors k = 25 k = 10 k = 5
N 1129 777 607
R2 0.704 0.720 0.731
School FE Yes Yes Yes
Year FE Yes Yes Yes
County variables Yes Yes Yes
District variables Yes Yes Yes
School variables Yes Yes Yes * Statistically significant at 10% level; ** at 5% level; *** at 1% level.
Notes: Each cell represents the results from a separate OLS regression. The dependent variable is equal to the
percentage of students within a school scoring proficient or advanced; the covariates are listed in Table 2. Standard
errors, corrected for clustering at the school district level, are in parentheses.

39
Table 9: Four-Day School Week and Student Performance: Sensitivity of Math Results
(1) (2) (3) (4) (5) (6) Restrict sample Restrict sample
Replace school to schools on based on the
Baseline results fixed effects with Weight regression traditional schedule Census definition
for comparison district fixed effects Add district trends by school size at baseline (2001) of “rural”
Four-Day Week 7.43*** 8.19*** 5.10 5.58** 7.33*** 7.91***
(1.72) (1.38) (3.77) (2.27) (1.79) (1.78)
N 4041 4041 4041 4041 3807 7335
R2 0.711 0.586 0.742 0.746 0.720 0.787
School FE Yes No Yes Yes Yes Yes
District FE No Yes No No No No
Year FE Yes Yes Yes Yes Yes Yes
County variables Yes Yes Yes Yes Yes Yes
District variables Yes Yes Yes Yes Yes Yes
School variables Yes Yes Yes Yes Yes Yes * Statistically significant at 10% level; ** at 5% level; *** at 1% level.
Notes: Each column represents the results from a separate OLS regression. The dependent variable is equal to the percentage of students within a school scoring
proficient or advanced; the covariates are listed in Table 2. Standard errors, corrected for clustering at the school district level, are in parentheses.

40
Table 10: Four-Day School Week and Student Performance: Sensitivity of Reading Results
(1) (2) (3) (4) (5) (6)
Restrict sample Restrict sample
Replace school to schools on based on the
Baseline results fixed effects with Weight regression traditional schedule Census definition
for comparison district fixed effects Add district trends by school size at baseline (2000) of “rural”
Four-Day Week 3.76* 6.18** 1.45 5.84*** 3.85* 3.72
(2.24) (2.74) (2.90) (2.14) (2.22) (2.27)
N 4630 4630 4630 4630 4377 8169
R2 0.733 0.640 0.759 0.773 0.746 0.807
School FE Yes No Yes Yes Yes Yes
District FE No Yes No No No No
Year FE Yes Yes Yes Yes Yes Yes
County variables Yes Yes Yes Yes Yes Yes
District variables Yes Yes Yes Yes Yes Yes
School variables Yes Yes Yes Yes Yes Yes * Statistically significant at 10% level; ** at 5% level; *** at 1% level.
Notes: Each column represents the results from a separate OLS regression. The dependent variable is equal to the percentage of students within a school scoring
proficient or advanced; the covariates are listed in Table 2. Standard errors, corrected for clustering at the school district level, are in parentheses.

41
Table A1: Reasons for Four-Day School Week Application/Renewal in Colorado
(1) (2) (3) (4)
Community support, Increased
Financial savings parent support, or Improved academic
of some form tradition attendance performance
Number of school 51 26 17 6
administrator reports
Notes: These data are based on 76 school administrator responses from a Colorado Department of Education survey
that was conducted in 2010. Of the responses, 10 districts were applying to switch their schedule to a four-day
school week and 66 districts were applying to renew their current four-day-week status. The total number of
responses sum to greater than 76 because respondents were allowed to list multiple reasons. These data were
supplied through correspondence with the Colorado Department of Education.

42
Table A2: Descriptive Statistics for Propensity Score Analysis
(1) (2)
5th
Grade 4th
Grade
Math Sample Reading Sample
Mean Std. Dev. Mean Std. Dev.
Dependent variable
Eventual Four-Day Week 0.050 0.217 0.050 0.217
Independent variables
Percent poverty (County-level) 13.1 5.39 13.1 5.43
Instructional expenditures per student (District-level) 3911 522 3898 481
Transportation expenditures per student (District-level) 190 86.8 191 97.7
Operational expenditures per student (District-level) 616 142 613 128
Total students (School-level) 337 112 339 109
Pupil-teacher ratio (School-level) 16.1 2.79 16.0 2.61
Percent free lunch (School-level) 36.5 22.2 36.9 22.3
N 303 303 Notes: Means of the independent variables are based on data from 2001.

43
Table A3: Probit Models for Propensity Score Analysis
(1) (2)
Eventual Eventual
Four-Day Week Four-Day Week
(Math Sample) (Reading Sample)
Total students (100s) 0.179 0.123
(0.177) (0.172)
Pupil-teacher ratio 0.033 0.057
(0.068) (0.076)
Percent free lunch 0.003 0.007
(0.010) (0.010)
Instructional expenditures per student (100s) 0.054* 0.064**
(0.029) (0.029)
Transportation expenditures per student (100s) 0.400** 0.343**
(0.202) (0.183)
Operational expenditures per student (100s) 0.000 0.040
(0.099) (0.102)
Percent poverty 0.100*** 0.085**
(0.036) (0.034)
N 303 303 * Statistically significant at 10% level; ** at 5% level; *** at 1% level.
Notes: Each column represents the results from a separate probit regression. The variables are listed in Table A1.
Standard errors are in parentheses.


