Embed Size (px)
Citation preview

NCES 2014-343 U.S. DEPARTMENT OF EDUCATION
Documentation for the NCES Common Core of Data National Public Education Financial Survey (NPEFS), School Year 2010–11 (Fiscal Year 2011) Preliminary File Version 1a

Documentation for the NCES Common Core of Data National Public Education Financial Survey (NPEFS), School Year 2010–11 (Fiscal Year 2011) Preliminary File Version 1a December 2013
Stephen Q. Cornman National Center for Education Statistics
NCES 2014-343
U.S. DEPARTMENT OF EDUCATION

U.S. Department of Education
Arne Duncan
Secretary
Institute of Education Sciences
John Q. Easton
Director
National Center for Education Statistics
John Q. Easton
Acting Commissioner
Administrative Data Division
Ross Santy
Associate Commissioner
The National Center for Education Statistics (NCES) is the primary federal entity for collecting,
analyzing, and reporting data related to education in the United States and other nations. It
fulfills a congressional mandate to collect, collate, analyze, and report full and complete
statistics on the condition of education in the United States; conduct and publish reports and
specialized analyses of the meaning and significance of such statistics; assist state and local
education agencies in improving their statistical systems; and review and report on education
activities in foreign countries.
NCES activities are designed to address high-priority education data needs; provide consistent,
reliable, complete, and accurate indicators of education status and trends; and report timely,
useful, and high-quality data to the U.S. Department of Education, the Congress, the states,
other education policymakers, practitioners, data users, and the general public. Unless
specifically noted, all information contained herein is in the public domain.
We strive to make our products available in a variety of formats and in language that is
appropriate to a variety of audiences. You, as our customer, are the best judge of our success in
communicating information effectively. If you have any comments or suggestions about this or
any other NCES product or report, we would like to hear from you. Please direct your comments
to
NCES, IES, U.S. Department of Education
1990 K Street NW
Washington, DC 20006-5651
December 2013
The NCES Home Page address is http://nces.ed.gov. The NCES Publications and Products
address is http://nces.ed.gov/pubsearch.
This publication is only available online. To download, view, and print the report as a PDF file, go
to the NCES World Wide Web Publications and Products address shown above.
This documentation was prepared in part under Intra-Agency Agreement (IAA) No. ED-IES-11-1-J-
0007 with the United States Census Bureau. Mention of trade names, commercial products, or
organizations does not imply endorsement by the U.S. Government.
Suggested Citation
Cornman, S.Q. (2013). Documentation for the NCES Common Core of Data National Public
Education Financial Survey (NPEFS), School Year 2010-11 (Fiscal Year 2011) (NCES 2014-343).
National Center for Education Statistics, Institute of Education Sciences, U.S. Department of
Education. Washington, DC. Retrieved [date] from http://nces.ed.gov/pubsearch.
Content Contact
Stephen Q. Cornman (202)502-7338

Acknowledgments
The operations and product development for the National Public Education Finance Survey
(NPEFS) are supported through an interagency agreement with the U.S. Census Bureau.
Specifically a team of skilled analysts, statisticians, and information technology specialists
from the Governments Division of the Census Bureau work closely with the National Center
for Education Statistics (NCES) to conduct the NPEFS. Additionally, a network of state
education agency fiscal coordinators take responsibility for compiling and reporting finance
data for public education activities within their respective states. While their names are too
numerous to mention here, NCES and the Common Core of Data (CCD) team greatly
appreciate their time, effort, and commitment toward providing timely and accurate school
finance data. NCES would like to thank these talented individuals who have each contributed
to the success of the CCD program.

iv
Contents
Page
Acknowledgments ......................................................................................................................... iii
List of Tables ................................................................................................................................. v
List of Exhibits ............................................................................................................................... v
I. Introduction to the NCES Common Core of Data National Public Education Financial
Survey (NPEFS), School Year 2010–11 (Fiscal Year 2011), Preliminary Version 1a File ..... 1
II. User’s Guide ............................................................................................................................. 2
A. Survey Methodology ........................................................................................................... 3
B. Imputations .......................................................................................................................... 7
C. Variations in the Survey Over Time .................................................................................. 10
D. Fiscal Data Plan ................................................................................................................ 11
E. State Notes ........................................................................................................................ 11
References .................................................................................................................................... 12
Appendixes
Appendix A—Record Layout and Description of Data Elements ............................................. A-1
Appendix B—Glossary ...............................................................................................................B-1
Appendix C—State Abbreviations and American National Standards Institute (ANSI)
State Codes...........................................................................................................C-1
Appendix D—Imputations and Edits List .................................................................................. D-1
Appendix E—Fiscal Data Plan Questions .................................................................................. E-1
Appendix F—Fiscal Data Plan Responses ................................................................................. F-1
Appendix G—Value Distribution and Field Frequencies .......................................................... G-1
Appendix H—State Notes .......................................................................................................... H-1
v
Appendix I—Survey Form .......................................................................................................... I-1
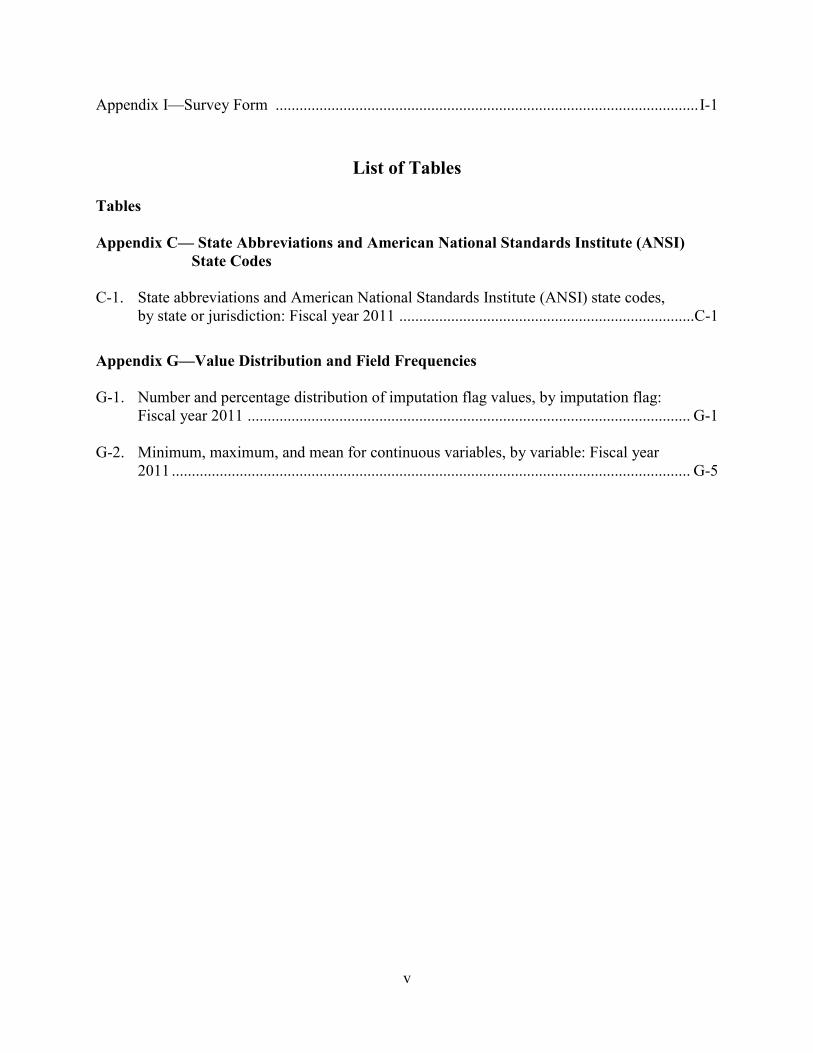
List of Tables
Tables
Appendix C— State Abbreviations and American National Standards Institute (ANSI)
State Codes
C-1. State abbreviations and American National Standards Institute (ANSI) state codes,
by state or jurisdiction: Fiscal year 2011 ..........................................................................C-1
Appendix G—Value Distribution and Field Frequencies
G-1. Number and percentage distribution of imputation flag values, by imputation flag:
Fiscal year 2011 ............................................................................................................... G-1
G-2. Minimum, maximum, and mean for continuous variables, by variable: Fiscal year
2011 .................................................................................................................................. G-5

vi
List of Exhibits
Exhibits Page
Appendix F—Fiscal Data Plan Reponses
F-1 Fiscal data plan responses to questions 1 through 3, by state or jurisdiction: Fiscal year
2011 .................................................................................................................................. F-2
F-2 Fiscal data plan responses to questions 4.a.1 through 4.c.1, by state or jurisdiction: Fiscal
year 2011 .......................................................................................................................... F-4
F-3 Fiscal data plan responses to questions 4.d.1 through 4.d.2, by state or jurisdiction: Fiscal
year 2011 .......................................................................................................................... F-6
F-4 Fiscal data plan responses to questions 4.e through 4.f, by state or jurisdiction: Fiscal
year 2011 ........................................................................................................................ F-10
F-5 Fiscal data plan responses to question 5 through 5.a, by state or jurisdiction: Fiscal
year 2011 ......................................................................................................................... F-12
F-6 Fiscal data plan responses to questions 6 through 7.a, by state or jurisdiction: Fiscal
Year 2011 ........................................................................................................................ F-14
F-7 Fiscal data plan responses to questions 8 through 9.a, by state or jurisdiction: Fiscal
year 2011 ......................................................................................................................... F-16
F-8 Fiscal data plan responses to question 10, by state or jurisdiction: Fiscal
year 2011 ......................................................................................................................... F-18

1
I. Introduction to the NCES Common Core of Data National Public Education Financial
Survey (NPEFS), School Year 2010–11 (Fiscal Year 2011), Preliminary Version 1a File
This documentation is for the preliminary version 1a file of the National Center for Education
Statistics’ (NCES) Common Core of Data (CCD) National Public Education Financial Survey
(NPEFS) for school year (SY) 2010–11, fiscal year 2011 (FY 11). It contains a brief description
of the data collection, along with information required to understand and access the data file.
The CCD is a national statistical program that collects and compiles administrative data from
state education agencies (SEAs) covering the universe of all public elementary and secondary
schools and school districts in the United States. NPEFS is one of six annual surveys that
comprise the CCD. The other five surveys are the Public Elementary/Secondary School
Universe Survey, the Local Education Agency Universe Survey, the State Nonfiscal Survey of
Public Elementary/Secondary Education, the School District Finance Survey (F-33), and the
Teacher Compensation Survey. The principal users of CCD fiscal data are the federal
government, the education research community, state and local government officials (including
school boards and LEA administrators), and the general public.
Congress authorizes NCES to collect these data through the Education Sciences Reform Act of
2002 (20 U.S.C. § 9543). NCES and the Governments Division of the U.S. Census Bureau
collaborate to collect public education finance data, with the Census Bureau acting as the primary
collection agent for both NPEFS and F-33.
NPEFS provides state-level aggregate finance data for revenues and expenditures for public
elementary and secondary education. NPEFS data are useful to (1) chief officers of state
education agencies (SEAs), (2) policymakers in the executive and legislative branches of federal
and state governments, (3) education policy and public policy researchers, (4) the press, and (5)
citizens interested in information about education finance.
SEAs in the 50 states, the District of Columbia, and five U.S. Island Areas (American Samoa,
Guam, the Commonwealth of the Northern Mariana Islands, Puerto Rico, and the U.S. Virgin
Islands) report aggregated state-level finance data to the NPEFS program. The data file is
organized by state or jurisdiction and contains revenue data by funding source, expenditure data
by function and object,1 and average daily attendance (ADA) data. The file also includes total
student membership data from the SY 2010–11 CCD State Nonfiscal Survey of Public
Elementary/Secondary Education version 1a file.2
1Function is defined as a category of expenditure defining the activity supported by the service or commodity
bought, while object is defined as a category of expenditure defining the service or commodity bought. For more
definitions of terms used in this report, please see Appendix B–Glossary. 2Documentation to the Common Core of Data State Nonfiscal Survey of Public Elementary/Secondary Education:
School Year 2010–11 (Keaton and Noel 2012-336).

2
II. User’s Guide
The FY 11 NPEFS data file contains 56 records (one for each state or jurisdiction). Each record
contains 314 fields (4 record identification fields, 155 data fields, and 155 imputation flag
fields).
The appendixes of this document provide the following information:
Appendix A—record layout for the data file;
Appendix B—glossary with definitions of key variables;
Appendix C—state abbreviations and American National Standards Institute (ANSI)3
state codes;
Appendix D—state-by-state list of imputations and edits;
Appendix E—fiscal data plan questions;
Appendix F—state-by-state responses to the fiscal data plan questions;
Appendix G—frequencies of imputation flags and minimum, maximum, and mean of
numeric variables;
Appendix H—fiscal year definitions and specific state notes; and
Appendix I—the survey form.
File Versions
NCES maintains strict version control of CCD files. The versions are identified by one numeric
character and one alphabetic character. The number corresponds with the release version (e.g.,
“1” is the first release, “2” is the second release, etc.). The letter “a” also corresponds to a public
release.4
For school year 2010-11 (FY 11), the “1a” file is the first preliminary file release.
NCES releases a preliminary file (Version 1a) after a publication using the data has been
released (IES policy requires that an NCES publication using the data be released before data
files may be released). In this case the report associated with this file release is the First Look
report entitled Revenues and Expenditures for Public Elementary and Secondary Education:
School Year 2010-11 (Fiscal Year 2011).
The release of preliminary data will be followed by a release of provisional data. The
provisional data will be an update to the previously released preliminary data, and subject to a
more extensive review and editing process. Revisions submitted after the provisional data file
has been finalized will be incorporated in the final file for each fiscal year. Final data files will
be released at the time of the release of preliminary data for the following year.
3 ANSI state codes replace the Federal Information Processing Standards (FIPS) state codes previously issued by the
National Institute of Standards and Technology (NIST) for the 50 states, the District of Columbia, and the U.S.
Island Areas. ANSI state code values map directly to the retired FIPS state code values.
4 Letters “b” through “z” are used for internal version control.

3
File names
The names of the FY 11 releases are as follows:
Stfis111a.txt (tab-delimited text file)
Stfis11_1a.xls (Microsoft Excel file)
The first seven characters indicate the file contents and year, and the last two characters indicate
the file version. “Stfis” stands for state fiscal, “11” stands for FY 11, “1” indicates that the file is
ready for initial release by NCES.
A. Survey Methodology
SEAs in the 50 states, the District of Columbia, and five U.S. Island Areas (American Samoa,
Guam, the Commonwealth of the Northern Mariana Islands, Puerto Rico, and the U.S. Virgin
Islands) participate in the NPEFS collection.
SEAs appoint state fiscal coordinators to work with NCES and the Census Bureau to provide
accurate and comparable data across states and jurisdictions. NCES and the Census Bureau
provide annual training workshops for state fiscal coordinators that are designed to improve the
efficiency and efficacy of reporting NPEFS data. The annual workshops include an overview of
the NPEFS survey, survey reporting and editing processes, detailed information about the data
items that comprise the survey and discussion of how to coordinate the NPEFS survey with state
data systems. State fiscal coordinators also provide valuable feedback in these workshops that
allows NCES to identify and address current issues related to school finance reporting so that the
data continue to be relevant and timely.
Prior to reporting NPEFS data, SEAs must compile fiscal data from the local education agencies
(LEAs) that operate or support public elementary and secondary schools. SEAs may review and
edit data from their LEAs to ensure data quality. SEAs also include revenues and expenditures
for any state-run schools, such as schools with special education programs or juvenile justice
facilities that provide education services. NCES and SEAs work cooperatively to ensure
comparability between the data items requested and reported.
In addition to the state fiscal coordinator, each SEA assigns a certifying official5 who certifies
that the data constitutes a true and full report of revenues, expenditures, and student attendance
during the regular school year and for summer school for the public elementary and secondary
schools.
The FY 11 NPEFS data collection opened on January 30, 2012 and closed on August 15, 2012.
Upon receipt of a state’s submission, Census Bureau and NCES analysts review the data for
5 NCES requires that each Chief State School Officer designate in writing a certifying official to be responsible for
authenticating the submission for their state. The certifying official must be a fiscal official at the highest level in
the SEA (U.S. Department of Education 2012).

4
possible errors or anomalies. Between August 16, 2012 and March 13, 2013, some SEAs
reported revisions to correct or resolve errors in their original submission.6
Missing and non-applicable data
Missing data are reported as “-1” in the data file and non-applicable data are reported as “-2.”7
The NCES National Public Education Financial Survey FY 11 Instruction Manual requests that
states report “0” for data items for which no activity has occurred and “-1” for items for which
activity has occurred, but for which data are missing. In some instances, a “-1” may have been
reported when there was no activity. Conversely, a “0” may have been reported when, in fact,
there was some activity. When producing the final file, NCES edits some “-1” and “0” responses
(e.g., teacher salaries reported as “0” were edited to “-1.”). Beginning with FY 10, CCD identifies
submitted NPEFS data that do not meet NCES data quality standards by reporting the data item as "-
9" and data item flag as "A." This suppression would only occur with numeric data items.
Average daily attendance data and student membership counts
The report from SEAs includes average daily attendance, revenue, and expenditure data from
which NCES determines the average State Per Pupil Expenditure (SPPE) for elementary and
secondary education, as defined in section 9101(2) of the Elementary and Secondary Education
Act of 1965, as amended (ESEA) (20 U.S.C. 7801(2)). In addition to utilizing SPPE as general
information on the financing of elementary and secondary education, the Secretary uses these
data directly in calculating allocations for certain formula grant programs, including, but not
limited to, Title I, Part A of the ESEA, Impact Aid, and Indian Education programs.8 SPPE is
calculated by dividing net current expenditures by average daily attendance (ADA).
NPEFS has two different types of pupil or student count data. Title I of the Elementary and
Secondary Education Act of 1965 (as amended by Title I of the Improving America’s Schools
Act of 1994) requires SEAs to collect and report ADA data. ADA is the average daily attendance
for the school year. Pursuant to Title I of the Elementary and Secondary Education Act, SEAs
report ADA data in accordance with state law. Average daily attendance is defined by state law
or regulations. ADA data in the NPEFS data file are not comparable across states because some
states use their own ADA definitions and others use the NCES definition.
In the absence of state law or regulations, NCES provides an alternative method to submit ADA.
NCES calculates ADA by summing the counts of resident students attending public school each
day of the school year and then dividing by the total number of days that school is in session
during the school year. The NCES definition requires every school or school district in a state to
collect attendance every day it is in session, and to record the number of days it is in session.
6 Massachusetts reported revisions of FY11 NPEFS data in November 2012.
7 For example, in states where none of the school districts have independent tax-raising authority, the variables
Local Revenue Property Tax (R1A) and Local Revenue Nonproperty Tax (R1B) are reported as “-2.” 8 “Department of Education, Notice of Submission of Data by State Education Agencies: Submission Dates for State
Revenue and Expenditure Reports for Fiscal Year (FY) 2011, Revisions to Those Reports, and Revisions to Prior
Fiscal Year Reports” 77 Federal Register, (10 January 2012) pp. 1472-73.

5
The NPEFS file also includes membership from the CCD State Nonfiscal Survey of Public
Elementary/Secondary Education. Membership is defined as the count of students on the current
roll taken on the school day closest to October 1, by using either the sum of original entries and
re-entries minus total withdrawals or the sum of the total present and the total absent. Student
membership data from the 201011 CCD State Nonfiscal Survey of Public
Elementary/Secondary Education are included in the 1a data file as a more comparable student
count. The variable Student Membership (MEMBR10) is the count of students enrolled on or
about October 1, 2010. Because membership is collected using a consistent definition for every
state, NCES uses membership, rather than average daily attendance, in the calculation of
expenditures per pupil in NPEFS reports.
American Recovery and Reinvestment Act (ARRA) Data
In February of 2009, Congress passed the American Recovery and Reinvestment Act of 2009
(ARRA). The ARRA legislation allocated education funds directly to the states.9 As a result of
the ARRA, NCES added seven data items to NPEFS in order to collect and analyze data
pertaining to Title I, Impact Aid, and other ED funds. The seven additional data items provide
the necessary detail to report total ARRA expenditures and their functional allocations, such as
for classroom instruction or school construction10
(Office of the Federal Register 2009). NCES
collected ARRA data for FY 09, FY 10, and FY 11 in the NPEFS collection. NCES will
continue to collect seven data items on NPEFS, pursuant to the American Recovery and
Reinvestment Act11
up and until FY 14 if necessary. The ARRA data items will be completely
removed from NPEFS when SEAs expend all ARRA funds, either through formula or
competitive grants.12
Employee Benefits Data
NPEFS collects employee benefits for the functions of instruction, support services, and
operation of noninstructional services. NPEFS respondents are currently reporting employee
benefits, which are defined as the “Amounts paid by the school district on behalf of employees
(amounts not included in gross salary but in addition to that amount). Such payments are fringe
benefits payments and although not directly paid to employees, nevertheless are part of the cost
of personal services.” 13
The definition of employee benefits is derived from the NCES school
finance accounting handbook, Financial Accounting for Local and State School Systems: 2009
Edition (Allison, Honegger, and Johnson 2009). NPEFS does not collect actuarially determined
9http://www.recovery.gov/About/Pages/The_Act.aspx; retrieved December 15, 2011.
10 “Department of Education, Notice of Proposed Information Collection Requests” 74 Federal Register 154 (12
August 2009) pp. 40573-40574; “Department of Education, Submission for OMB Review; Comment Request” 74
Federal Register 197 (14 October 2009) p. 52752. 11
As a result of the ARRA, NCES added seven data items to NPEFS in order to collect and analyze data pertaining
to Title I, Impact Aid, and other ED funds. 12
The Education Department General Administrative Regulations (EDGAR) allows grantees to carry over 1
additional year any Federal Education funds that were not obligated in the period for which they were appropriated.
For grants that are forward-funded, grantees can have up to 27 months to obligate appropriated funds beginning as
early as July 1of the federal fiscal year. 13
The NPEFS instruction manual provides that employee benefits “include amounts paid by, or on behalf of, an
LEA for fringe benefits such as group insurance (including health benefits for current and retired employees), social
security contributions, retirement contributions, tuition reimbursements, unemployment compensation, worker's
compensation, and other benefits such as unused sick leave (NCES, 2012).

6
annual required contributions; 14
accrued annual requirement contribution liability;15
or the
actuarial value of pension plan assets.16
Use of Crosswalk Software
Since the FY 89 data collection, the Census Bureau has been utilizing “crosswalk” software to
assist states in their reporting and to improve the comparability of data across states. This
software converts a state’s existing accounting reports to uniform federal standards, as described
in the NCES accounting handbook, Financial Accounting for Local and State School Systems:
2009 Edition (Allison, Honegger, and Johnson 2009). NCES reviews and validates the protocols
of states that do not use this crosswalk software to convert their state reports to federal standards.
The following states used crosswalk software provided by NCES in the FY 11 collection:
Alabama, California, Illinois, Mississippi, Montana, New Jersey, New Mexico, New York, North
Carolina, North Dakota, Oregon, South Carolina, South Dakota, and Wisconsin.
NCES edit checks
Pursuant to NCES statistical standards, CCD survey staff engages in data editing, which is an
iterative and interactive process that includes procedures for detecting and correcting errors in
the data.
After an SEA submits NPEFS data, CCD survey staff conducts a comprehensive review
of the data and edit checks. These checks include but are not limited to:
trend analysis for multiple years;
large value and percentage fluctuations;
zero dollar values;
appropriate usage of data flags;
sum checks;
comparison of record layouts to record layouts the SEA submitted in the previous fiscal
year;
comparisons of membership between the state non-fiscal files and the NPEFS file;
comparison of min/max/mean of all numeric data items to ensure the percentage changes
of the means between the previous and current year’s data are in a reasonable range;
and adequate comments from respondents explaining any data anomalies.
Pursuant to NCES Standard Statistical Standard 4-1, the data are “checked for credibility based
on range tolerances to determine if responses fall within a pre specified reasonable range,” and
are properly documented. The data are also checked “for consistency based on checks across
variables within individual records for non contradictory responses.”
14
Actuarially determined annual required contributions are the annual required contribution (ARC) that incorporates
both the cost of benefits in the current year and the amortization of the plan’s unfunded actuarial accrued liability. 15 The accrued annual requirement contribution liability is the difference between actuarially determined
contributions and actual payments made to the pension fund. 16
Actuarial value of pension plan assets is the value of cash, investments, and other property belonging to a pension
plan as used by an actuary for the purpose of an actuarial valuation.

7
The staff prepares an edit report that includes the results from these tests. Notification of any
arithmetic errors and comments containing NCES’ understanding of specific missing data items
are also included in the edit report.
States are asked to correct arithmetic errors, verify or correct data that fail edit checks, complete
missing items, and explain any extraordinary changes from the previous year’s data. NCES or
the Census Bureau may make requests for clarification, reconciliation, or other inquiries
pertaining to the data. SEAs can respond directly to these requests for clarification and/or
reconciliation or resubmit data to resolve data issues on their own initiative.17
Data that remain
missing or uncorrected are imputed based on values derived from other “fully reporting”18
states
or other related data elements from within the state.
Student membership edits
Every school year, SEAs report student membership counts by grade on the CCD State Nonfiscal
Survey of Public Elementary/Secondary Education. The NPEFS data file includes total student
membership reported on the State Nonfiscal Survey that includes grades prekindergarten through
grade 12 (plus ungraded). If the reported fiscal data excludes prekindergarten programs, total
membership should also exclude prekindergarten membership. As part of the collection process,
NCES asks SEAs to review student membership data from the State Nonfiscal Survey and verify
that the membership data are consistent with the programs covered in the revenues and
expenditures data reported in NPEFS. Two states (Nebraska and Wyoming) indicated that the
state fiscal data reported in NPEFS excluded prekindergarten programs. In these two states, the
NPEFS student membership variable excludes prekindergarten membership.
Illinois and Wisconsin did not report finance data for charter schools in the FY 11 NPEFS
survey. NCES edited student membership for Illinois and Wisconsin by excluding charter school
students from NPEFS student membership.
B. Imputations
Imputation is a procedure that uses available information and some plausible assumptions to
derive substitute values for missing values in a data file (NCES 2003). Currently, the Herriot
imputation methodology (Monaco and Wang 1995) is used to impute for missing items. For an
allocation, the Herriot method calculates the average proportion of the total from the states for
each of the detailed variables. This average is divided by the sum of the averages from each of
the detailed variables and is rescaled to one by dividing by the sum of the detail averages. The
purpose of imputations is to provide a complete data file that allows for both cross-sectional and
longitudinal analysis, as well as comparability of data across states.
Imputations modify values for cases or records where data are not reported (missing) or are
incorrectly reported. In some cases, a state may not be able to track funds for a certain program
or purpose. If these data elements are imputed, the appropriate totals and subtotals are either
17
“Department of Education, Submission of Data by State Educational Agencies; submission Dates for State
Revenue and Expenditures Reports for Fiscal Year (FY) 2011, Revisions to Those Reports, and Revisions to Prior
Fiscal Year Reports.” 77 Federal Register 6 (10 January 2012) pp. 1472-1473. 18
Fully reporting states must have positive values for all fields.

8
increased or decreased to include the imputed data elements. In other cases, states are able to
provide a subtotal but are unable to provide details that are more specific. The imputed allocation
of these subtotals does not affect the totals or subtotals.
SEAs inform the Census Bureau where data are included so that funds are deducted and
distributed appropriately. SEAs review the results of the imputations imposed and certify the
imputed value’s reasonableness to the best of their knowledge based on their available data.
After the imputation process is complete, the Census Bureau creates data files for the current and
prior fiscal years. The Census Bureau uploads these files to the NCES secure data transfer site
for review. The NCES members site allows the Census Bureau to transfer data to NCES in a
secure environment.
If SEAs have reason to believe the initial imputation is not a reasonable representation of their
data, the state may choose to make changes to the data. If states make changes to data or fill in
missing items that were previously imputed, the Census Bureau will run a second round of
imputations. The certified data from the first round are not re imputed even if the uncertified
first-round imputations resulted in the updating of some relevant data. In the second round
version of the file, imputations are only applied to missing data for states that update their data
submission for that fiscal year. Empirical testing has shown that a re-imputation of the entire file
did not substantially change the imputed data enough to justify the additional burden of asking
states to recertify the revised imputation. The data flags in the NPEFS data file identify data
items that were imputed.
“Contains,” “Combined with,” and “Totals” imputations based on the “Herriot Imputation
Method”
The Herriot Imputation Method is used to distribute a reported subtotal across two or more
unreported categories using the ratio of each subcategory to the grand total as the basis of the
final distribution. This is used when the ratio of a data item to the grand total has less variance
across states than the ratio of that item to the subtotal. The computation of this method involves
using the average ratio of each item to be imputed to the grand total across all “fully reporting”
states to calculate the unreported subcategories and then raking the imputed items to the reported
subtotal. These imputations do not affect any totals or subtotals.
Imputations identified in Appendix D as being “Combined with,” “Contains,” or “Supplemented
by” use the Herriot Imputation Method. These are cases where a state is unable to report
explicitly into the NCES CCD category sets but are able to report a subtotal. For example, the
statement “A contains B, C, and D by T” in Appendix D indicates that the reported value of A is
actually the subtotal of A, B, C, and D where T is the grand total. The “Herriot Imputation
Method” is then applied to impute the final values of A, B, C, and D.
“Impute/Import” imputations
The Herriot Method is not necessary when the variance of the item to the subtotal across
reporting states is sufficiently low. In this case, the imputation method can be simplified by
comparing the missing components to the subtotal rather than the grand total. If the subtotal is
reported but the distribution of that subtotal across items is unknown, then the “Impute/Import”

9
function uses the ratio of one or more elements to the subtotal, averaged across “fully reporting”
states to distribute the reported subtotal into one or more item components. In Appendix D, the
syntax for “Impute/Import” imputations is “A Impute/Import T” where A is a single item or
array of items that are components of the total T.
“Impute based on” imputations
Statements with “impute based on” indicate that the first item was reported as missing and the
missing value was assigned based on information from the variables following “based on.” In
some cases, the subtotal may have been incomplete. When a component of the subtotal is not
reported, and it is known that the subtotal does not include the unreported item, the ratio used in
the “impute/import” procedure must be modified. The average subtotal is calculated across “fully
reporting” states and the missing item is compared to that modified subtotal. For example, “A
imputed based on (T-A)” implies that A, in the target state, is not included in T. Therefore, the
average ratio of A to the total excluding A across the “fully reporting” states is applied to T in
the target state to estimate A in the target state. Totals must then be recalculated after the
imputation, as the imputed value can now be included in the grand total.
“Distribute by” imputations
In some cases, the state may have reported a positive value for an item that should actually be
zero. In these cases, the value of the misreported item is redistributed into several other reported
items based on the known distribution of the target items. For example, the statement “A
distributed by destination/salary B, C, D, E, F” can be interpreted as, the value reported as “A”
has been prorated into B, C, D, E, and F based on the reported distribution of B, C, D, E, and F.
“A” is then set to zero. In these cases, since B, C, D, E, and F were all reported, data from any
other states are not necessary to perform the calculation.
Data flags
For each variable, a companion flag indicates whether the value was reported by the state or was
placed there by NCES using one of several imputation or edit methodologies. The flags are as
follows:
R – As reported by the state
A – Edited by the analyst (formerly labeled “Adjusted”)
I – Imputed based on a method other than prior year’s data19
T – Total based on sum of internal or external detail
The companion cell in each case is identified by the name of the data cell preceded by an “I.”
Appendix D explains any action taken by NCES with regard to each variable.
19
For some NCES surveys, imputations of missing data items are performed by applying a growth factor to data
reported in a prior year. This type of growth-rate imputation is not performed for the NPEFS. “I” is assigned the
value of “Imputed based on a method other than prior year’s data” to maintain consistency in the meaning of
imputation flags across NCES surveys.

10
C. Variations in the Survey Over Time
NPEFS underwent a major revision in FY 89, acquiring its present name in that year and greatly
increasing the number of data items collected. Since that year, items have been added to and
deleted from the survey, as follows:
Beginning with the FY 92 survey:
– Food Services expenditures were broken out by object, adding the data items Food
Services – Salaries (E3A11), Food Services – Employee Benefits (E3A12), Food
Services – Purchased Services (E3A13), Food Services – Supplies (E3A14), and Food
Services – Other (E3A16).
– Enterprise Operations expenditures were broken out by object, adding the data items
Enterprise – Salaries (E3B11), Enterprise – Employee Benefits (E3B12), Enterprise –
Purchased Services (E3B13), Enterprise – Supplies (E3B14), and Enterprise – Other
(E3B16).
– Facilities Acquisition and Construction Services - Nonproperty expenditures were
broken out into Buildings Built and Alterations Performed by LEA’s Own Staff (E611)
and Buildings Built and Alterations Performed by Contractors (E612). In addition,
Facilities Acquisition and Construction Services – Property expenditures were broken
out into Land (E62A) and Buildings (E62B). STE6, the sum of all of the Facilities
Acquisitions and Construction Services items, was added.
Beginning with FY 98 survey:
– The Facilities Acquisition and Construction Services breakouts listed above (items
E611, E612, E62A, and E62B) were discontinued.
Beginning with FY 04 survey:
– Teacher salaries expenditures were broken out by program, adding the data items
Teacher Salaries – Regular Programs (E11A), Teacher Salaries – Special Education
Programs (E11B), Teacher Salaries – Vocational Education Programs (E11C), and
Teacher Salaries – Other Education Programs (E11D).
–A data item for textbooks expenditures (E2) was added.
Beginning with FY 09 survey:
– Seven items for expenditures from the ARRA funds were added:
Instructional Expenditures From ARRA Funds (ARRASTE1), Total Current
Expenditures From ARRA Funds (ARRATE5), Community Service Nonproperty and
Direct Cost Programs From ARRA Funds (ARRAE81Z), Property Expenditures From
ARRA Funds (ARRATE10), School Construction Expenditures From ARRA Funds

11
(ARRASTE6), Expenditures From Title I Received Under ARRA (ARRATLEIZ), and
Direct Program Support Expenditures From ARRA Funds (ARRASTE4).
D. Fiscal Data Plan
In addition to the finance data requested on NPEFS, NCES also collects information from each
state to help process the data and to gain a better understanding of what programs and/or policies
are connected with the data items and definitions. The FY 11 data plan questionnaire appears in
Appendix E, and the responses for each state or jurisdiction appear in Appendix F. The fiscal
data plan responses are presented as reported by SEAs with minimal editing by NCES. The
responses to the data plan are not included on the data file.
E. State Notes
The state notes contain information from state data providers regarding any significant changes
in the data they are reporting. These comments are reported in this documentation as stated by
the respondents with minimal editing by NCES. The beginning and end dates of the fiscal year
are also reported for each state.

12
References
Allison, G.S., Honegger, S.D., and Johnson, F. (2009). Financial Accounting for Local and
State School Systems: 2009 Edition (NCES 2009-325). National Center for Education
Statistics, Institute of Education Sciences, U.S. Department of Education. Washington, DC.
Retrieved December 15, 2011 from
http://nces.ed.gov/pubsearch/pubsinfo.asp?pubid=2009325
Education Sciences Reform Act of 2002 (20 U.S.C. § 9543), Title I of Public Law 107-279,
November 5, 2002,§151, accessed June 10, 2013
http://www2.ed.gov/policy/rschstat/leg/PL107-279.pdf
Monaco, D., and Wang, S. (1995). Evaluation of the Common Core of Data (CCD) Finance
Data Imputations. Technical Report, National Center for Education Statistics, U.S.
Department of Education. Washington, DC.
National Center for Education Statistics, The National Public Education Financial Survey
FY 2012 Instruction Booklet, accessed June 10, 2013
https://surveys.nces.ed.gov/ccdnpefs/pdf/NPEFSManual.pdf.
Office of the Federal Register, National Archives and Records Administration. (2009).
Federal Register Vol. 74, No. 154. Vol. 74, No. 197. Washington, DC. Retrieved December
15, 2011 from
http://www.gpo.gov/fdsys/browse/collection.action?collectionCode=FR&browsePath=2009
Office of the Federal Register, National Archives and Records Administration. (2012).
Federal Register Vol. 77, No. 6. Washington, DC. Retrieved September 15, 2012 from
http://www.access.gpo.gov/su_docs/fedreg/frcont12.html .
Keaton, P. and Noel, A.M. (2012). Documentation to the Common Core of Data State
Nonfiscal Survey of Public Elementary/Secondary Education: School Year 2010–11 (NCES
2012-336). National Center for Education Statistics, Institute of Education Sciences, U.S.
Department of Education. Washington, DC.. Retrieved July 11, 2013 from
http://nces.ed.gov/pubsearch/.
U.S. Department of Education, National Center for Education Statistics. (2003). NCES
Statistical Standards, NCES 2003-601. Washington, DC: U.S. Government Printing Office.
Retrieved May 10, 2013 from http://nces.ed.gov/pubs2003/2003601.pdf

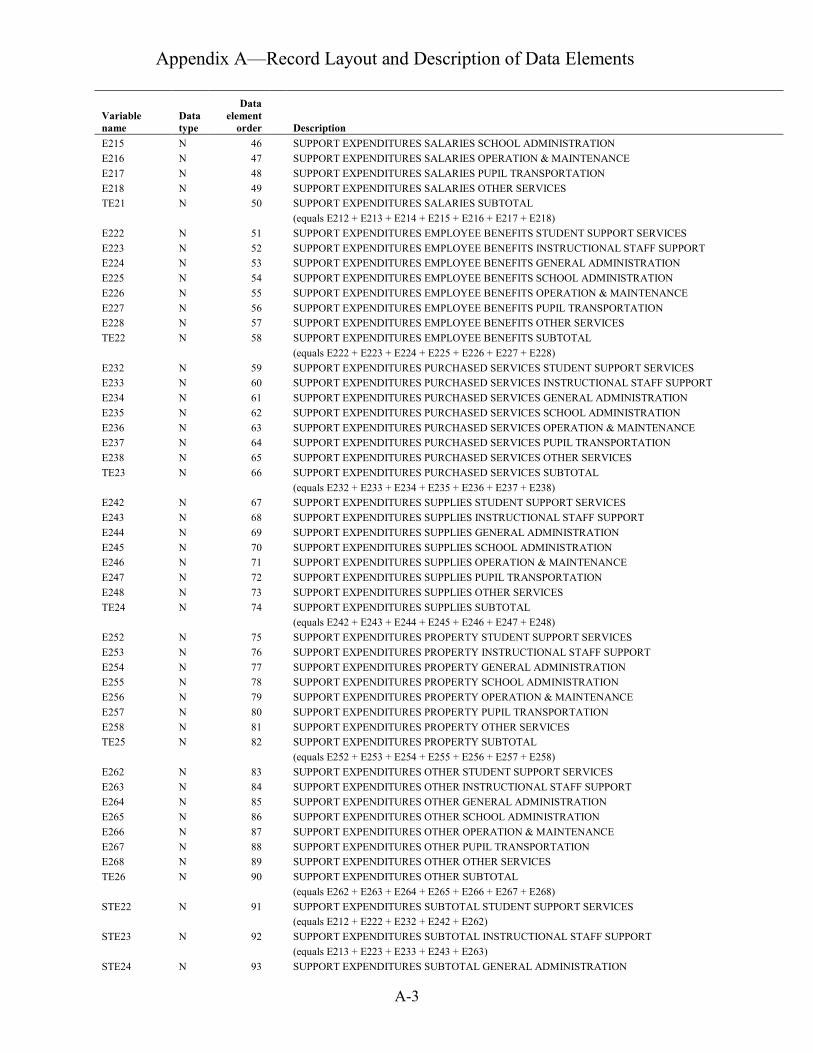
Appendix A—Record Layout and Description of Data Elements
A-1

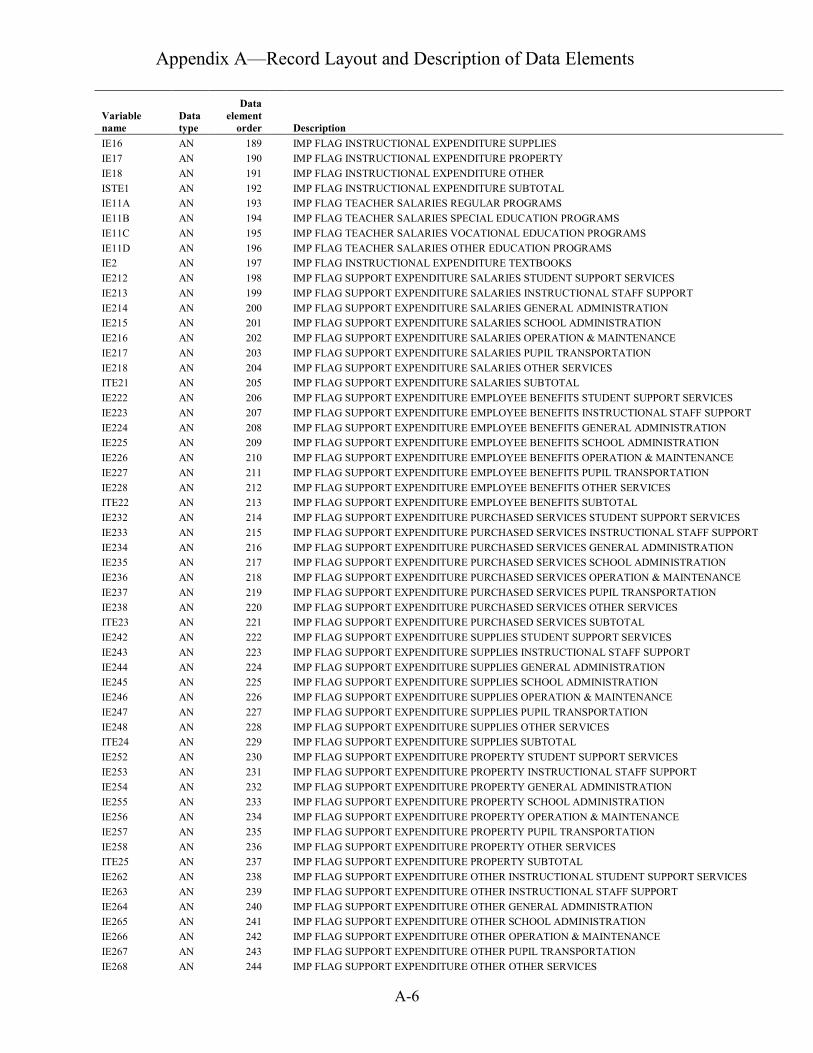
Appendix A—Record Layout and Description of Data Elements
A-2
The tab-delimited file (Stfis111a.txt) has the following layout and description:
56 physical records, 1 per observation – 314 fields in the file.
Missing data are reported as “-1” in the data file, nonapplicable data are reported as “-2,” and
suppressed data are reported as “-9.”
For data type, N = numeric and AN = alphanumeric.
Variable
name
Data
type
Data
element
order Description
SURVYEAR N 1 FISCAL YEAR OF SURVEY (2011)
FIPS AN 2 AMERICAN NATIONAL STANDARDS INSTITUTE (ANSI) STATE CODE
STABR AN 3 POSTAL STATE ABBREVIATION CODE
STNAME AN 4 NAME OF THE STATE OR TERRITORY
R1A N 5 LOCAL REVENUES PROPERTY TAX
R1B N 6 LOCAL REVENUES NONPROPERTY TAX
R1C N 7 LOCAL REVENUES LOCAL GOVERNMENT PROPERTY TAX
R1D N 8 LOCAL REVENUES LOCAL GOVERNMENT NONPROPERTY TAX
R1E N 9 LOCAL REVENUES INDIVIDUAL TUITION
R1F N 10 LOCAL REVENUES TUITION FROM LEAS
R1G N 11 LOCAL REVENUES TRANSPORTATION FEES FROM INDIVIDUAL
R1H N 12 LOCAL REVENUES TRANSPORTATION FEES FROM LEAS
R1I N 13 LOCAL REVENUES EARNINGS ON INVESTMENTS
R1J N 14 LOCAL REVENUES FOOD SERVICE
R1K N 15 LOCAL REVENUES STUDENT ACTIVITIES
R1L N 16 LOCAL REVENUES OTHER REVENUES
R1M N 17 LOCAL REVENUES TEXTBOOK REVENUES
R1N N 18 LOCAL REVENUES SUMMER SCHOOL
STR1 N 19 LOCAL REVENUES SUBTOTAL
(equals R1A + R1B + R1C + R1D + R1E + R1G + R1I + R1J + R1K + R1L + R1M + R1N)
R2 N 20 INTERMEDIATE REVENUES
R3 N 21 STATE REVENUES
R4A N 22 FEDERAL REVENUES DIRECT GRANTS
R4B N 23 FEDERAL REVENUES THRU STATE
R4C N 24 FEDERAL REVENUES THRU INTERMEDIATE AGENCIES
R4D N 25 FEDERAL REVENUES OTHER SOURCES
STR4 N 26 FEDERAL REVENUES SUBTOTAL
(equals R4A + R4B + R4C + R4D)
R5 N 27 REVENUES FROM OTHER SOURCES
TR N 28 TOTAL REVENUES FROM ALL SOURCES
(equals STR1 + R2 + R3 + STR4)
E11 N 29 INSTRUCTIONAL EXPENDITURES SALARIES
E12 N 30 INSTRUCTIONAL EXPENDITURES EMPLOYEE BENEFITS
E13 N 31 INSTRUCTIONAL EXPENDITURES PURCHASED SERVICES
E14 N 32 INSTRUCTIONAL EXPENDITURES TUITION TO PRIVATE AND OUT-OF-STATE SCHOOLS
E15 N 33 INSTRUCTIONAL EXPENDITURES TUITION TO OTHER LEAS IN-STATE
E16 N 34 INSTRUCTIONAL EXPENDITURES SUPPLIES
E17 N 35 INSTRUCTIONAL EXPENDITURES PROPERTY
E18 N 36 INSTRUCTIONAL EXPENDITURES OTHER
STE1 N 37 INSTRUCTIONAL EXPENDITURES SUBTOTAL
(equals E11 + E12 + E13 + E14 + E16 + E18)
E11A N 38 TEACHER SALARIES REGULAR PROGRAMS
E11B N 39 TEACHER SALARIES SPECIAL EDUCATION PROGRAMS
E11C N 40 TEACHER SALARIES VOCATIONAL EDUCATION PROGRAMS
E11D N 41 TEACHER SALARIES OTHER EDUCATION PROGRAMS
E2 N 42 INSTRUCTIONAL EXPENDITURES TEXTBOOKS
E212 N 43 SUPPORT EXPENDITURES SALARIES STUDENT SUPPORT SERVICES
E213 N 44 SUPPORT EXPENDITURES SALARIES INSTRUCTIONAL STAFF SUPPORT
E214 N 45 SUPPORT EXPENDITURES SALARIES GENERAL ADMINISTRATION
Appendix A—Record Layout and Description of Data Elements
A-3
Variable
name
Data
type
Data
element
order Description
E215 N 46 SUPPORT EXPENDITURES SALARIES SCHOOL ADMINISTRATION
E216 N 47 SUPPORT EXPENDITURES SALARIES OPERATION & MAINTENANCE
E217 N 48 SUPPORT EXPENDITURES SALARIES PUPIL TRANSPORTATION
E218 N 49 SUPPORT EXPENDITURES SALARIES OTHER SERVICES
TE21 N 50 SUPPORT EXPENDITURES SALARIES SUBTOTAL
(equals E212 + E213 + E214 + E215 + E216 + E217 + E218)
E222 N 51 SUPPORT EXPENDITURES EMPLOYEE BENEFITS STUDENT SUPPORT SERVICES
E223 N 52 SUPPORT EXPENDITURES EMPLOYEE BENEFITS INSTRUCTIONAL STAFF SUPPORT
E224 N 53 SUPPORT EXPENDITURES EMPLOYEE BENEFITS GENERAL ADMINISTRATION
E225 N 54 SUPPORT EXPENDITURES EMPLOYEE BENEFITS SCHOOL ADMINISTRATION
E226 N 55 SUPPORT EXPENDITURES EMPLOYEE BENEFITS OPERATION & MAINTENANCE
E227 N 56 SUPPORT EXPENDITURES EMPLOYEE BENEFITS PUPIL TRANSPORTATION
E228 N 57 SUPPORT EXPENDITURES EMPLOYEE BENEFITS OTHER SERVICES
TE22 N 58 SUPPORT EXPENDITURES EMPLOYEE BENEFITS SUBTOTAL
(equals E222 + E223 + E224 + E225 + E226 + E227 + E228)
E232 N 59 SUPPORT EXPENDITURES PURCHASED SERVICES STUDENT SUPPORT SERVICES
E233 N 60 SUPPORT EXPENDITURES PURCHASED SERVICES INSTRUCTIONAL STAFF SUPPORT
E234 N 61 SUPPORT EXPENDITURES PURCHASED SERVICES GENERAL ADMINISTRATION
E235 N 62 SUPPORT EXPENDITURES PURCHASED SERVICES SCHOOL ADMINISTRATION
E236 N 63 SUPPORT EXPENDITURES PURCHASED SERVICES OPERATION & MAINTENANCE
E237 N 64 SUPPORT EXPENDITURES PURCHASED SERVICES PUPIL TRANSPORTATION
E238 N 65 SUPPORT EXPENDITURES PURCHASED SERVICES OTHER SERVICES
TE23 N 66 SUPPORT EXPENDITURES PURCHASED SERVICES SUBTOTAL
(equals E232 + E233 + E234 + E235 + E236 + E237 + E238)
E242 N 67 SUPPORT EXPENDITURES SUPPLIES STUDENT SUPPORT SERVICES
E243 N 68 SUPPORT EXPENDITURES SUPPLIES INSTRUCTIONAL STAFF SUPPORT
E244 N 69 SUPPORT EXPENDITURES SUPPLIES GENERAL ADMINISTRATION
E245 N 70 SUPPORT EXPENDITURES SUPPLIES SCHOOL ADMINISTRATION
E246 N 71 SUPPORT EXPENDITURES SUPPLIES OPERATION & MAINTENANCE
E247 N 72 SUPPORT EXPENDITURES SUPPLIES PUPIL TRANSPORTATION
E248 N 73 SUPPORT EXPENDITURES SUPPLIES OTHER SERVICES
TE24 N 74 SUPPORT EXPENDITURES SUPPLIES SUBTOTAL
(equals E242 + E243 + E244 + E245 + E246 + E247 + E248)
E252 N 75 SUPPORT EXPENDITURES PROPERTY STUDENT SUPPORT SERVICES
E253 N 76 SUPPORT EXPENDITURES PROPERTY INSTRUCTIONAL STAFF SUPPORT
E254 N 77 SUPPORT EXPENDITURES PROPERTY GENERAL ADMINISTRATION
E255 N 78 SUPPORT EXPENDITURES PROPERTY SCHOOL ADMINISTRATION
E256 N 79 SUPPORT EXPENDITURES PROPERTY OPERATION & MAINTENANCE
E257 N 80 SUPPORT EXPENDITURES PROPERTY PUPIL TRANSPORTATION
E258 N 81 SUPPORT EXPENDITURES PROPERTY OTHER SERVICES
TE25 N 82 SUPPORT EXPENDITURES PROPERTY SUBTOTAL
(equals E252 + E253 + E254 + E255 + E256 + E257 + E258)
E262 N 83 SUPPORT EXPENDITURES OTHER STUDENT SUPPORT SERVICES
E263 N 84 SUPPORT EXPENDITURES OTHER INSTRUCTIONAL STAFF SUPPORT
E264 N 85 SUPPORT EXPENDITURES OTHER GENERAL ADMINISTRATION
E265 N 86 SUPPORT EXPENDITURES OTHER SCHOOL ADMINISTRATION
E266 N 87 SUPPORT EXPENDITURES OTHER OPERATION & MAINTENANCE
E267 N 88 SUPPORT EXPENDITURES OTHER PUPIL TRANSPORTATION
E268 N 89 SUPPORT EXPENDITURES OTHER OTHER SERVICES
TE26 N 90 SUPPORT EXPENDITURES OTHER SUBTOTAL
(equals E262 + E263 + E264 + E265 + E266 + E267 + E268)
STE22 N 91 SUPPORT EXPENDITURES SUBTOTAL STUDENT SUPPORT SERVICES
(equals E212 + E222 + E232 + E242 + E262)
STE23 N 92 SUPPORT EXPENDITURES SUBTOTAL INSTRUCTIONAL STAFF SUPPORT
(equals E213 + E223 + E233 + E243 + E263)
STE24 N 93 SUPPORT EXPENDITURES SUBTOTAL GENERAL ADMINISTRATION

Appendix A—Record Layout and Description of Data Elements
A-4
Variable
name
Data
type
Data
element
order Description
(equals E214 + E224 + E234 + E244 + E264)
STE25 N 94 SUPPORT EXPENDITURES SUBTOTAL SCHOOL ADMINISTRATION
(equals E215 + E225 + E235 + E245 + E265)
STE26 N 95 SUPPORT EXPENDITURES SUBTOTAL OPERATION & MAINTENANCE
(equals E216 + E226 + E236 + E246 + E266)
STE27 N 96 SUPPORT EXPENDITURES SUBTOTAL PUPIL TRANSPORTATION
(equals E217 + E227 + E237 + E247 + E267)
STE28 N 97 SUPPORT EXPENDITURES SUBTOTAL OTHER SERVICES
(equals E218 + E228 + E238 + E248 + E268)
STE2T N 98 SUPPORT EXPENDITURES TOTAL SUPPORT SERVICES
(equals TE21 + TE22 + TE23 + TE24 + TE26)
E3A11 N 99 NONINSTRUCTIONAL SERVICES FOOD SERVICES SALARIES
E3A12 N 100 NONINSTRUCTIONAL SERVICES FOOD SERVICES EMPLOYEE BENEFITS
E3A13 N 101 NONINSTRUCTIONAL SERVICES FOOD SERVICES PURCHASED SERVICES
E3A14 N 102 NONINSTRUCTIONAL SERVICES FOOD SERVICES SUPPLIES
E3A2 N 103 NONINSTRUCTIONAL SERVICES FOOD SERVICES PROPERTY
E3A16 N 104 NONINSTRUCTIONAL SERVICES FOOD SERVICES OTHER
E3A1 N 105 NONINSTRUCTIONAL SERVICES FOOD SERVICES SUBTOTAL
(equals E3A11 + E3A12 + E3A13 + E3A14 + E3A16)
E3B11 N 106 NONINSTRUCTIONAL SERVICES ENTERPRISE SALARIES
E3B12 N 107 NONINSTRUCTIONAL SERVICES ENTERPRISE EMPLOYEE BENEFITS
E3B13 N 108 NONINSTRUCTIONAL SERVICES ENTERPRISE PURCHASED SERVICES
E3B14 N 109 NONINSTRUCTIONAL SERVICES ENTERPRISE SUPPLIES
E3B2 N 110 NONINSTRUCTIONAL SERVICES ENTERPRISE PROPERTY
E3B16 N 111 NONINSTRUCTIONAL SERVICES ENTERPRISE OTHER
E3B1 N 112 NONINSTRUCTIONAL SERVICES ENTERPRISE SUBTOTAL
(equals E3B11 + E3B12 + E3B13 + E3B14 + E3B16)
STE3 N 113 NONINSTRUCTIONAL SERVICES TOTAL
(equals E3A1 + E3B1)
E4A1 N 114 DIRECT PROGRAM SUPPORT TEXTBOOKS
E4A2 N 115 DIRECT PROGRAM SUPPORT TEXTBOOKS (PROPERTY)
E4B1 N 116 DIRECT PROGRAM SUPPORT TRANSPORT
E4B2 N 117 DIRECT PROGRAM SUPPORT TRANSPORT (PROPERTY)
E4C1 N 118 DIRECT PROGRAM SUPPORT EMPLOYEE BENEFITS
E4C2 N 119 DIRECT PROGRAM SUPPORT EMPLOYEE BENEFITS (PROPERTY)
E4D N 120 DIRECT PROGRAM SUPPORT PRIVATE SCHOOL STUDENT
E4E1 N 121 DIRECT PROGRAM SUPPORT OTHER
E4E2 N 122 DIRECT PROGRAM SUPPORT OTHER (PROPERTY)
STE4 N 123 DIRECT PROGRAM SUPPORT SUBTOTAL
(equals E4A1 + E4B1 + E4C1 + E4E1)
TE5 N 124 CURRENT EXPENDITURES
E61 N 125 FACILITIES ACQUISITION NONPROPERTY
E62 N 126 FACILITIES ACQUISITION PROPERTY (LAND & BUILDINGS)
E63 N 127 FACILITIES ACQUISITION PROPERTY (EQUIPMENT)
STE6 N 128 FACILITIES ACQUISITION NONPROPERTY & PROPERTY TOTAL
(equals E61 + E62 + E63)
E7A1 N 129 OTHER USE DEBT SERVICE INTEREST
E7A2 N 130 OTHER USE DEBT SERVICE REDEMPTION
STE7 N 131 OTHER USE DEBT SERVICE SUBTOTAL
(equals E7A1 + E7A2)
E81 N 132 COMMUNITY SERVICE NONPROPERTY
E82 N 133 COMMUNITY SERVICE PROPERTY
E9A N 134 DIRECT COST PROGRAM NONPUBLIC SCHOOL
E9B N 135 DIRECT COST PROGRAM ADULT EDUCATION
E9C N 136 DIRECT COST PROGRAM COMMUNITY COLLEGE
E9D N 137 DIRECT COST PROGRAM OTHER

Appendix A—Record Layout and Description of Data Elements
A-5
Variable
name
Data
type
Data
element
order Description
E91 N 138 DIRECT COST PROGRAM PROPERTY
STE9 N 139 DIRECT COST PROGRAM SUBTOTAL
(equals E9A + E9B + E9C + E9D)
TE10 N 140 PROPERTY TOTAL
(equals E17 + TE25 + E3A2 + E3B2 + E62 + E63 + E82 + E91)
TE11 N 141 TOTAL EXPENDITURES FOR EDUCATION
(equals TE5 + E61 + E81 + STE9 + TE10)
X12C N 142 EXCLUSION FOR PL 100 297 TITLE I
X12D N 143 EXCLUSION FOR PL 100 297 TITLE I CARRYOVER
X12E N 144 EXCLUSION FOR PL 100 297 TITLE V, PART A
X12F N 145 EXCLUSION FOR PL 100 297 TITLE V, PART A CARRYOVER
TX12 N 146 TOTAL EXCLUSION FOR PL 100 297
(equals R1E + R1G + R1J + R1K + R1M + R1N + X12C + X12D + X12E + X12F )
NCE13 N 147 NET CURRENT EXPENDITURES
(equals TE5 – TX12)
ADA N 148 ADA (STATE AND NCES DEFINITION)
A14A N 149 ADA (STATE DEFINITION)
A14B N 150 ADA (NCES DEFINITION)
PPE15 N 151 PER PUPIL EXPENDITURES
MEMBR10 N 152 TOTAL STUDENT MEMBERSHIP
ARRASTE1 N 153 INSTRUCTIONAL EXPENDITURES FROM ARRA FUNDS
ARRATE5 N 154 TOTAL CURRENT EXPENDITURES FROM ARRA FUNDS
ARRAE81Z N 155 COMMUNITY SERVICE NONPROPERTY AND DIRECT COST PROGRAMS FROM ARRA FUNDS
ARRATE10 N 156 PROPERTY EXPENDITURES FROM ARRA FUNDS
ARRASTE6 N 157 SCHOOL CONSTRUCTION EXPENDITURES FROM ARRA FUNDS
ARRATLEIZ N 158 EXPENDITURES FROM TITLE I RECEIVED UNDER ARRA
ARRASTE4 N 159 DIRECT PROGRAM SUPPORT EXPENDITURES FROM ARRA FUNDS
IR1A AN 160 IMP FLAG LOCAL REVENUES PROPERTY TAX
IR1B AN 161 IMP FLAG LOCAL REVENUES NONPROPERTY TAX
IR1C AN 162 IMP FLAG LOCAL REVENUES LOCAL GOVERNMENT PROPERTY TAX
IR1D AN 163 IMP FLAG LOCAL REVENUES LOCAL GOVERNMENT NONPROPERTY TAX
IR1E AN 164 IMP FLAG LOCAL REVENUES INDIVIDUAL TUITION
IR1F AN 165 IMP FLAG LOCAL REVENUES TUITION FROM LEAS
IR1G AN 166 IMP FLAG LOCAL REVENUES TRANSPORT FEES FROM INDIVIDUAL
IR1H AN 167 IMP FLAG LOCAL REVENUES TRANSPORT FEES FROM LEAS
IR1I AN 168 IMP FLAG LOCAL REVENUES EARNINGS ON INVESTMENT
IR1J AN 169 IMP FLAG LOCAL REVENUES FOOD SERVICE
IR1K AN 170 IMP FLAG LOCAL REVENUES STUDENT ACTIVITIES
IR1L AN 171 IMP FLAG LOCAL REVENUES OTHER REVS
IR1M AN 172 IMP FLAG LOCAL REVENUES TEXTBOOK REVS
IR1N AN 173 IMP FLAG LOCAL REVENUES SUMMER SCHOOL
ISTR1 AN 174 IMP FLAG LOCAL REVENUES SUBTOTAL
IR2 AN 175 IMP FLAG INTERMEDIATE REVENUES
IR3 AN 176 IMP FLAG STATE REVENUES
IR4A AN 177 IMP FLAG RED REV DIRECT GRANTS
IR4B AN 178 IMP FLAG FEDERAL REVENUES THRU STATE
IR4C AN 179 IMP FLAG FEDERAL REVENUES THRU INTERMEDIATE AGENCIES
IR4D AN 180 IMP FLAG FEDERAL REVENUES OTHER SOURCES
ISTR4 AN 181 IMP FLAG FEDERAL REVENUES SUBTOTAL
IR5 AN 182 IMP FLAG OTHER SOURCES OF REVENUES
ITR AN 183 IMP FLAG TOTAL REVENUES FROM ALL SOURCES
IE11 AN 184 IMP FLAG INSTRUCTIONAL EXPENDITURE SALARIES
IE12 AN 185 IMP FLAG INSTRUCTIONAL EMPLOYEE BENEFITS
IE13 AN 186 IMP FLAG INSTRUCTIONAL EXPENDITURE PURCHASED SERVICES
IE14 AN 187 IMP FLAG INSTRUCTIONAL EXPENDITURE TUITION TO PRIVATE AND OUT-OF-STATE SCHOOLS
IE15 AN 188 IMP FLAG INSTRUCTIONAL EXPENDITURE TUITION TO OTHER LEAS IN-STATE
Appendix A—Record Layout and Description of Data Elements
A-6
Variable
name
Data
type
Data
element
order Description
IE16 AN 189 IMP FLAG INSTRUCTIONAL EXPENDITURE SUPPLIES
IE17 AN 190 IMP FLAG INSTRUCTIONAL EXPENDITURE PROPERTY
IE18 AN 191 IMP FLAG INSTRUCTIONAL EXPENDITURE OTHER
ISTE1 AN 192 IMP FLAG INSTRUCTIONAL EXPENDITURE SUBTOTAL
IE11A AN 193 IMP FLAG TEACHER SALARIES REGULAR PROGRAMS
IE11B AN 194 IMP FLAG TEACHER SALARIES SPECIAL EDUCATION PROGRAMS
IE11C AN 195 IMP FLAG TEACHER SALARIES VOCATIONAL EDUCATION PROGRAMS
IE11D AN 196 IMP FLAG TEACHER SALARIES OTHER EDUCATION PROGRAMS
IE2 AN 197 IMP FLAG INSTRUCTIONAL EXPENDITURE TEXTBOOKS
IE212 AN 198 IMP FLAG SUPPORT EXPENDITURE SALARIES STUDENT SUPPORT SERVICES
IE213 AN 199 IMP FLAG SUPPORT EXPENDITURE SALARIES INSTRUCTIONAL STAFF SUPPORT
IE214 AN 200 IMP FLAG SUPPORT EXPENDITURE SALARIES GENERAL ADMINISTRATION
IE215 AN 201 IMP FLAG SUPPORT EXPENDITURE SALARIES SCHOOL ADMINISTRATION
IE216 AN 202 IMP FLAG SUPPORT EXPENDITURE SALARIES OPERATION & MAINTENANCE
IE217 AN 203 IMP FLAG SUPPORT EXPENDITURE SALARIES PUPIL TRANSPORTATION
IE218 AN 204 IMP FLAG SUPPORT EXPENDITURE SALARIES OTHER SERVICES
ITE21 AN 205 IMP FLAG SUPPORT EXPENDITURE SALARIES SUBTOTAL
IE222 AN 206 IMP FLAG SUPPORT EXPENDITURE EMPLOYEE BENEFITS STUDENT SUPPORT SERVICES
IE223 AN 207 IMP FLAG SUPPORT EXPENDITURE EMPLOYEE BENEFITS INSTRUCTIONAL STAFF SUPPORT
IE224 AN 208 IMP FLAG SUPPORT EXPENDITURE EMPLOYEE BENEFITS GENERAL ADMINISTRATION
IE225 AN 209 IMP FLAG SUPPORT EXPENDITURE EMPLOYEE BENEFITS SCHOOL ADMINISTRATION
IE226 AN 210 IMP FLAG SUPPORT EXPENDITURE EMPLOYEE BENEFITS OPERATION & MAINTENANCE
IE227 AN 211 IMP FLAG SUPPORT EXPENDITURE EMPLOYEE BENEFITS PUPIL TRANSPORTATION
IE228 AN 212 IMP FLAG SUPPORT EXPENDITURE EMPLOYEE BENEFITS OTHER SERVICES
ITE22 AN 213 IMP FLAG SUPPORT EXPENDITURE EMPLOYEE BENEFITS SUBTOTAL
IE232 AN 214 IMP FLAG SUPPORT EXPENDITURE PURCHASED SERVICES STUDENT SUPPORT SERVICES
IE233 AN 215 IMP FLAG SUPPORT EXPENDITURE PURCHASED SERVICES INSTRUCTIONAL STAFF SUPPORT
IE234 AN 216 IMP FLAG SUPPORT EXPENDITURE PURCHASED SERVICES GENERAL ADMINISTRATION
IE235 AN 217 IMP FLAG SUPPORT EXPENDITURE PURCHASED SERVICES SCHOOL ADMINISTRATION
IE236 AN 218 IMP FLAG SUPPORT EXPENDITURE PURCHASED SERVICES OPERATION & MAINTENANCE
IE237 AN 219 IMP FLAG SUPPORT EXPENDITURE PURCHASED SERVICES PUPIL TRANSPORTATION
IE238 AN 220 IMP FLAG SUPPORT EXPENDITURE PURCHASED SERVICES OTHER SERVICES
ITE23 AN 221 IMP FLAG SUPPORT EXPENDITURE PURCHASED SERVICES SUBTOTAL
IE242 AN 222 IMP FLAG SUPPORT EXPENDITURE SUPPLIES STUDENT SUPPORT SERVICES
IE243 AN 223 IMP FLAG SUPPORT EXPENDITURE SUPPLIES INSTRUCTIONAL STAFF SUPPORT
IE244 AN 224 IMP FLAG SUPPORT EXPENDITURE SUPPLIES GENERAL ADMINISTRATION
IE245 AN 225 IMP FLAG SUPPORT EXPENDITURE SUPPLIES SCHOOL ADMINISTRATION
IE246 AN 226 IMP FLAG SUPPORT EXPENDITURE SUPPLIES OPERATION & MAINTENANCE
IE247 AN 227 IMP FLAG SUPPORT EXPENDITURE SUPPLIES PUPIL TRANSPORTATION
IE248 AN 228 IMP FLAG SUPPORT EXPENDITURE SUPPLIES OTHER SERVICES
ITE24 AN 229 IMP FLAG SUPPORT EXPENDITURE SUPPLIES SUBTOTAL
IE252 AN 230 IMP FLAG SUPPORT EXPENDITURE PROPERTY STUDENT SUPPORT SERVICES
IE253 AN 231 IMP FLAG SUPPORT EXPENDITURE PROPERTY INSTRUCTIONAL STAFF SUPPORT
IE254 AN 232 IMP FLAG SUPPORT EXPENDITURE PROPERTY GENERAL ADMINISTRATION
IE255 AN 233 IMP FLAG SUPPORT EXPENDITURE PROPERTY SCHOOL ADMINISTRATION
IE256 AN 234 IMP FLAG SUPPORT EXPENDITURE PROPERTY OPERATION & MAINTENANCE
IE257 AN 235 IMP FLAG SUPPORT EXPENDITURE PROPERTY PUPIL TRANSPORTATION
IE258 AN 236 IMP FLAG SUPPORT EXPENDITURE PROPERTY OTHER SERVICES
ITE25 AN 237 IMP FLAG SUPPORT EXPENDITURE PROPERTY SUBTOTAL
IE262 AN 238 IMP FLAG SUPPORT EXPENDITURE OTHER INSTRUCTIONAL STUDENT SUPPORT SERVICES
IE263 AN 239 IMP FLAG SUPPORT EXPENDITURE OTHER INSTRUCTIONAL STAFF SUPPORT
IE264 AN 240 IMP FLAG SUPPORT EXPENDITURE OTHER GENERAL ADMINISTRATION
IE265 AN 241 IMP FLAG SUPPORT EXPENDITURE OTHER SCHOOL ADMINISTRATION
IE266 AN 242 IMP FLAG SUPPORT EXPENDITURE OTHER OPERATION & MAINTENANCE
IE267 AN 243 IMP FLAG SUPPORT EXPENDITURE OTHER PUPIL TRANSPORTATION
IE268 AN 244 IMP FLAG SUPPORT EXPENDITURE OTHER OTHER SERVICES

Appendix A—Record Layout and Description of Data Elements
A-7
Variable
name
Data
type
Data
element
order Description
ITE26 AN 245 IMP FLAG SUPPORT EXPENDITURE OTHER SUBTOTAL
ISTE22 AN 246 IMP FLAG SUPPORT EXPENDITURE SUBTOTAL STUDENT SUPPORT SERVICES
ISTE23 AN 247 IMP FLAG SUPPORT EXPENDITURE SUBTOTAL INSTRUCTIONAL STAFF SUPPORT
ISTE24 AN 248 IMP FLAG SUPPORT EXPENDITURE SUBTOTAL GENERAL ADMINISTRATION
ISTE25 AN 249 IMP FLAG SUPPORT EXPENDITURE SUBTOTAL SCHOOL ADMINISTRATION
ISTE26 AN 250 IMP FLAG SUPPORT EXPENDITURE SUBTOTAL OPERATION & MAINTENANCE
ISTE27 AN 251 IMP FLAG SUPPORT EXPENDITURE SUBTOTAL PUPIL TRANSPORTATION
ISTE28 AN 252 IMP FLAG SUPPORT EXPENDITURE SUBTOTAL OTHER SERVICES
ISTE2T AN 253 IMP FLAG SUPPORT EXPENDITURE TOTAL SUPPORT SERVICES
IE3A11 AN 254 IMP FLAG NONINSTRUCTIONAL SERVICES FOOD SERVICES SALARIES
IE3A12 AN 255 IMP FLAG NONINSTRUCTIONAL SERVICES FOOD SERVICES EMPLOYEE BENEFITS
IE3A13 AN 256 IMP FLAG NONINSTRUCTIONAL SERVICES FOOD SERVICES PURCHASED SERVICES
IE3A14 AN 257 IMP FLAG NONINSTRUCTIONAL SERVICES FOOD SERVICES SUPPLIES
IE3A2 AN 258 IMP FLAG NONINSTRUCTIONAL SERVICES FOOD SERVICES PROPERTY
IE3A16 AN 259 IMP FLAG NONINSTRUCTIONAL SERVICES FOOD SERVICES OTHER
IE3A1 AN 260 IMP FLAG NONINSTRUCTIONAL SERVICES FOOD SERVICES SUBTOTAL
IE3B11 AN 261 IMP FLAG NONINSTRUCTIONAL SERVICES ENTERPRISE SALARIES
IE3B12 AN 262 IMP FLAG NONINSTRUCTIONAL SERVICES ENTERPRISE EMPLOYEE BENEFITS
IE3B13 AN 263 IMP FLAG NONINSTRUCTIONAL SERVICES ENTERPRISE PURCHASED SERVICES
IE3B14 AN 264 IMP FLAG NONINSTRUCTIONAL SERVICES ENTERPRISE SUPPLIES
IE3B2 AN 265 IMP FLAG NONINSTRUCTIONAL SERVICES ENTERPRISE PROPERTY
IE3B16 AN 266 IMP FLAG NONINSTRUCTIONAL SERVICES ENTERPRISE OTHER
IE3B1 AN 267 IMP FLAG NONINSTRUCTIONAL SERVICES ENTERPRISE SUBTOTAL
ISTE3 AN 268 IMP FLAG NONINSTRUCTIONAL SERVICES TOTAL
IE4A1 AN 269 IMP FLAG DIRECT PROGRAM SUPPORT TEXTBOOKS
IE4A2 AN 270 IMP FLAG DIRECT PROGRAM SUPPORT TEXTBOOKS (PROP)
IE4B1 AN 271 IMP FLAG DIRECT PROGRAM SUPPORT TRANSPORTATION
IE4B2 AN 272 IMP FLAG DIRECT PROGRAM SUPPORT TRANSPORTATION (PROP)
IE4C1 AN 273 IMP FLAG DIRECT PROGRAM SUPPORT EMPLOYEE BENEFITS
IE4C2 AN 274 IMP FLAG DIRECT PROGRAM SUPPORT EMPLOYEE BENEFITS (PROP)
IE4D AN 275 IMP FLAG DIRECT PROGRAM SUPPORT PRIVATE SCHOOL STUDENT
IE4E1 AN 276 IMP FLAG DIRECT PROGRAM SUPPORT OTHER
IE4E2 AN 277 IMP FLAG DIRECT PROGRAM SUPPORT OTHER (PROPERTY)
ISTE4 AN 278 IMP FLAG DIRECT PROGRAM SUPPORT SUBTOTAL
ITE5 AN 279 IMP FLAG CURRENT EXPENDITURES
IE61 AN 280 IMP FLAG FACILITIES ACQUISITIONS NON PROPERTY
IE62 AN 281 IMP FLAG FACILITIES ACQUISITIONS PROPERTY(LAND/BUILDINGS)
IE63 AN 282 IMP FLAG FACILITIES ACQUISITIONS EQUIPMENT
ISTE6 AN 283 IMP FLAG FACILITIES ACQUISITIONS TOTAL
IE7A1 AN 284 IMP FLAG OTHER USE DEBT SERVICE INTEREST
IE7A2 AN 285 IMP FLAG OTHER USE REDEMPTION
ISTE7 AN 286 IMP FLAG OTHER USE DEBT SERVICE SUBTOTAL
IE81 AN 287 IMP FLAG COMMUNITY SERVICE NONPROPERTY
IE82 AN 288 IMP FLAG COMMUNITY SERVICE PROPERTY
IE9A AN 289 IMP FLAG DIRECT COST PROGRAM NONPUBLIC SCHOOL
IE9B AN 290 IMP FLAG DIRECT COST PROGRAM ADULT EDUCATION
IE9C AN 291 IMP FLAG DIRECT COST PROGRAM COMMUNITY COLLEGE
IE9D AN 292 IMP FLAG DIRECT COST PROGRAM OTHER
IE91 AN 293 IMP FLAG DIRECT COST PROGRAM PROPERTY
ISTE9 AN 294 IMP FLAG DIRECT COST PROGRAM SUBTOTAL
ITE10 AN 295 IMP FLAG PROPERTY TOTAL
ITE11 AN 296 IMP FLAG TOTAL EXPENDITURES FOR EDUCATION
IX12C AN 297 IMP FLAG EXCLUSIVE FOR PL 100 297 TITLE I
IX12D AN 298 IMP FLAG EXCLUSIVE FOR PL 100 297 TITLE I CARRYOVER
IX12E AN 299 IMP FLAG EXCLUSIVE FOR PL 100 297 TITLE V, PART A
IX12F AN 300 IMP FLAG EXCLUSIVE FOR PL 100 297 TITLE V, PART A CARRYOVER

Appendix A—Record Layout and Description of Data Elements
A-8
Variable
name
Data
type
Data
element
order Description
ITX12 AN 301 IMP FLAG TOTAL EXCLUSION FOR PL 100 297
INCE13 AN 302 IMP FLAG NET CURRENT EXPENDITURES
IADA AN 303 IMP FLAG ADA (STATE AND NCES DEFINITION)
IA14A AN 304 IMP FLAG ADA (STATE DEFINITION)
IA14B AN 305 IMP FLAG ADA (NCES DEFINITION)
IPPE15 AN 306 IMP FLAG PER PUPIL EXPENDITURES
IMEMBR10 AN 307 IMP FLAG TOTAL STUDENT MEMBERSHIP
IARRASTE1 AN 308 IMP FLAG INSTRUCTIONAL EXPENDITURES FROM ARRA FUNDS
IARRATE5 AN 309 IMP FLAG TOTAL CURRENT EXPENDITURES FROM ARRA FUNDS
IARRAE81Z AN 310
IMP FLAG COMMUNITY SERVICE NONPROPERTY AND DIRECT COST PROGRAMS FROM ARRA
FUNDS
IARRATE10 AN 311 IMP FLAG PROPERTY EXPENDITURES FROM ARRA FUNDS
IARRASTE6 AN 312 IMP FLAG SCHOOL CONSTRUCTION EXPENDITURES FROM ARRA FUNDS
IARRATLEIZ AN 313 IMP FLAG EXPENDITURES FROM TITLE I RECEIVED UNDER ARRA
IARRASTE4 AN 314 IMP FLAG DIRECT PROGRAM SUPPORT EXPENDITURES FROM ARRA FUNDS

Appendix B—Glossary
B-1

Appendix B—Glossary
This glossary applies to the Common Core of Data National Public Education Financial Survey (NPEFS). For additional detail, it is suggested that the data user consult the NCES accounting handbook, Financial Accounting for Local and State School Systems: 2009 Edition (Allison, Honegger, and Johnson 2009). When applicable, line numbers corresponding to the handbook are listed in parentheses, and corresponding NPEFS variable names are listed in brackets.
average daily attendance: Average daily attendance (ADA) is defined by state law or regulations. In their absence, ADA should be calculated by summing the counts of resident students attending public school each day of the school year and then dividing by the total number of days that school is in session during the school year. Students who reside in one state and attend public school in another state should be counted in the state where they reside. [ADA, A14A, and A14B.]
CCD: Common Core of Data. A group of public elementary/secondary education surveys of NCES. CCD data are collected from the administrative records systems of each state’s department of education.
community services: A functional category of expenditures (3300) for such services as swimming pools, day care centers, and programs for the elderly. [E81 and E82.]
current expenditures: Current expenditures are comprised of expenditures for the day-to-day operation of schools and school districts for public elementary and secondary education, including expenditures for staff salaries and benefits, supplies, and purchased services. Expenditures associated with repaying debts and capital outlays (e.g., purchases of land, school construction and repair, and equipment) are excluded from current expenditures. Programs outside the scope of public preschool through grade 12 education, such as community services and adult education, are not included in current expenditures. Payments to private schools, and payments to public charter schools are also excluded. [TE5 is the total of STE1, STE2T, and STE3.]
debt services: A subfunction (5100) within the expenditure function “other uses” (5000). It includes only long-term debt service with obligations exceeding 1 year. [E7A1 and E7A2.]
direct cost programs: A category of expenditures for programs not part of public elementary and secondary education. These programs include community colleges, adult education, and nonpublic school support. [E9A, E9B, E9C, E9D, E91, and subtotal STE9. NOTE: STE9 does not include E91.]
direct program support: Expenditures made by state education agencies (SEAs) for, or on behalf of, local education agencies (LEAs). The majority of these expenditures are for teacher’s retirement funds. The remainder are for textbooks, busing, and special programs, such as education for disabled students. Although states often report these expenditures in the appropriate function, they are sometimes lumped together under the heading “direct program support,” in which case NCES distributes them by function and
B-2

Appendix B—Glossary
object after consultation with state officials. Direct program support for public elementary and secondary education is reported in the data file as zero. [E4A1, E4A2, E4B1, E4B2, E4C1, E4C2, E4D, E4E1, E4E2, and subtotal STE4. NOTE: STE4 does not include E4A2, E4B2, E4C2, E4D, and E4E2.]
employee benefits: Expenditures (200) made in addition to gross salary that are not paid directly to employees. Employee benefits include amounts paid by, or on behalf of, an LEA for retirement contributions, health insurance, social security contributions, unemployment compensation, worker’s compensation, tuition reimbursements, and other employee benefits. [E12, E222, E223, E224, E225, E226, E227, E228, E3A12, and E3B12. Variables E222, E223, E224, E225, E226, E227, and E228 sum to TE22.]
enterprise operations: A subfunction (3200) of noninstructional services (3000). Activities that are financed, at least in part, by user charges, similar to a private business. Enterprise operations include operations that are operated as a business and receipts from the operation are expected to fund the enterprise (e.g., school bookstores and certain after school activities). These operations are sometimes subsidized by LEAs. Food services expenditures are reported under food services, even if they are run as an enterprise. [E3B11, E3B12, E3B13, E3B14, E3B2, E3B16, and subtotal E3B1. NOTE: E3B1 does not include E3B2.]
equipment: An object subcategory (730) within facilities acquisition and construction services (4000). It includes the initial purchase of property items such as books for a newly constructed school or addition. Replacement equipment is labeled property and is reported by function. [E63]
expenditures: All amounts of money paid out by a school system, net of recoveries and other correcting transactions, other than for retirement of debt, purchase of securities, extension of loans, and agency transactions. Expenditures include only external transactions of a school system and exclude noncash transactions such as the provision of perquisites or other in-kind payments.
expenditures from the American Recovery and Reinvestment Act (ARRA) funds: The Recovery and Reinvestment Act of 2009 (ARRA, PL 111-5) provided states with additional federal funds to support public education. These funds are allocated through existing programs such as Title I, Impact Aid, and Individuals with Disabilities Education Act (IDEA), and also directly through the State Fiscal Stabilization Fund. The following seven items for expenditures from ARRA funds are collected in NPEFS:
instruction expenditures from ARRA funds: Total current expenditures for instruction from ARRA funds, including current expenditures for activities directly associated with the interaction between teachers and students, including teacher salaries and benefits, supplies (such as textbooks), and purchased instructional services. [ARRASTE1]
total current expenditures for public elementary-secondary education from ARRA funds: Include expenditures for instruction, support services, and
B-3

Appendix B—Glossary
noninstruction, functions 1000 through 3200, that are made from ARRA funds. [ARRATE5]
total current expenditures for community services, adult education, and other programs outside of public elementary-secondary education from ARRA funds: Expenditures from ARRA funds for the community services nonproperty item and direct cost programs subtotal, including Non-Public School Programs (500), Adult/Continuing Education Programs (600), and Community Services Programs (800). [ARRAE81Z]
property expenditures from ARRA funds: Include all property expenditures from ARRA funds for Instruction (1000), Support Services (2000), Food Services (3100), and Enterprise Operations (3200). [ARRATE10]
school construction expenditures from ARRA funds: Include all school construction expenditures from ARRA funds reported under Facilities Acquisition and Construction Services. [ARRASTE6]
expenditures from the Title I funds received under ARRA: Expenditures from the Title I program received under ARRA. [ARRATLEIZ]
direct program support from ARRA funds: Expenditures from ARRA funds that are made by state governments for and on behalf of school districts. [ARRASTE4]
facilities acquisition and construction services: An expenditure function (4000) that includes the acquisition of land and buildings; building construction, remodeling, and additions; the initial installation or extension of service systems and other built-in equipment; and site improvement. [E61, E62, E63, and subtotal STE6.]
federal revenues: Include direct grants-in-aid to schools or agencies, funds distributed through a state or intermediate agency, and revenues in lieu of taxes to compensate a school district for nontaxable federal institutions within a district’s boundary. [R4A, R4B, R4C, R4D, and subtotal STR4.]
food services: A subfunction (3100) of noninstructional services (3000). Food services are activities that provide food to students and staff in a school or LEA. These services include preparing and serving regular and incidental meals or snacks in connection with school activities as well as delivery of food to schools. [E3A11, E3A12, E3A13, E3A14, E3A2, E3A16, and subtotal E3A1. NOTE: E3A1 does not include E3A2.]
function: A category of expenditure defining the activity supported by the service or commodity bought.
general administration: One of nine subfunctions (2300) within the expenditure function support services (2000). Expenditures for the board of education and superintendent’s office for the administration of LEAs, including salaries and benefits for
B-4

Appendix B—Glossary
superintendent, the school board, and their staff. [E214, E224, E234, E244, E254, E264, and subtotal STE24. NOTE: STE24 does not include E254.]
instruction and instruction-related expenditures—Include expenditures for instruction and instructional staff support services. These are expenditures that are directly related to providing instruction and for activities that assist with classroom instruction. Instruction
and instruction-related expenditures are more expansive than instruction expenditures in that all instruction related expenditures are accounted for, including salaries and benefits
for teachers, teaching assistants, librarians and library aides, in-service teacher trainers, curriculum development, student assessment, technology (for students but outside the c classroom), and supplies and purchased services related to these activities.
instruction expenditures—Expenditures for activities related to the interaction between teachers and students. Current instruction expenditures include expenditures for activities related to the interaction between teachers and students, including salaries and benefits for teachers and teacher aides, textbooks, supplies, and purchased services. These expenditures also include expenditures relating to extracurricular and co-curricularactivities. [E11, E12, E13, E14, E15, E16, E17, E18, and subtotal STE1. Variables E15 and E17 are not included in STE1.]
instructional staff support services: One of nine subfunctions (2200) within the expenditure function support services (2000). It includes instructional staff training, educational media (library and audiovisual), and other instructional staff support services. [E213, E223, E233, E243, E253, E263, and subtotal STE23. NOTE: STE23 does not include E253.]
intermediate sources of revenue: Education agencies with fundraising capabilities that operate between the state and local government levels. One example is New York’s Board of Cooperative Educational Services (BOCES). Intermediate revenues are included in local revenue totals. [R2]
local education agency (LEA): The government agency at the local level whose primary responsibility is to operate public schools or to contract for public school services.
local revenues: Include revenues from such sources as local property and nonproperty taxes, investments, and student activities such as textbook sales, transportation and tuition fees, and food service revenues. [R1A, R1B, R1C, R1D, R1E, R1F, R1G, R1H, R1I, R1J, R1K, R1L, R1M, R1N, and subtotal STR1. R1F and R1H are not included in STR1.]
NPEFS: National Public Education Financial Survey, a component of the Common Core of Data (CCD).
object: A category of expenditure defining the service or commodity bought.
operations and maintenance: One of nine subfunctions (2600) within the expenditure function support services (2000). It includes expenditures for the supervision of
B-5
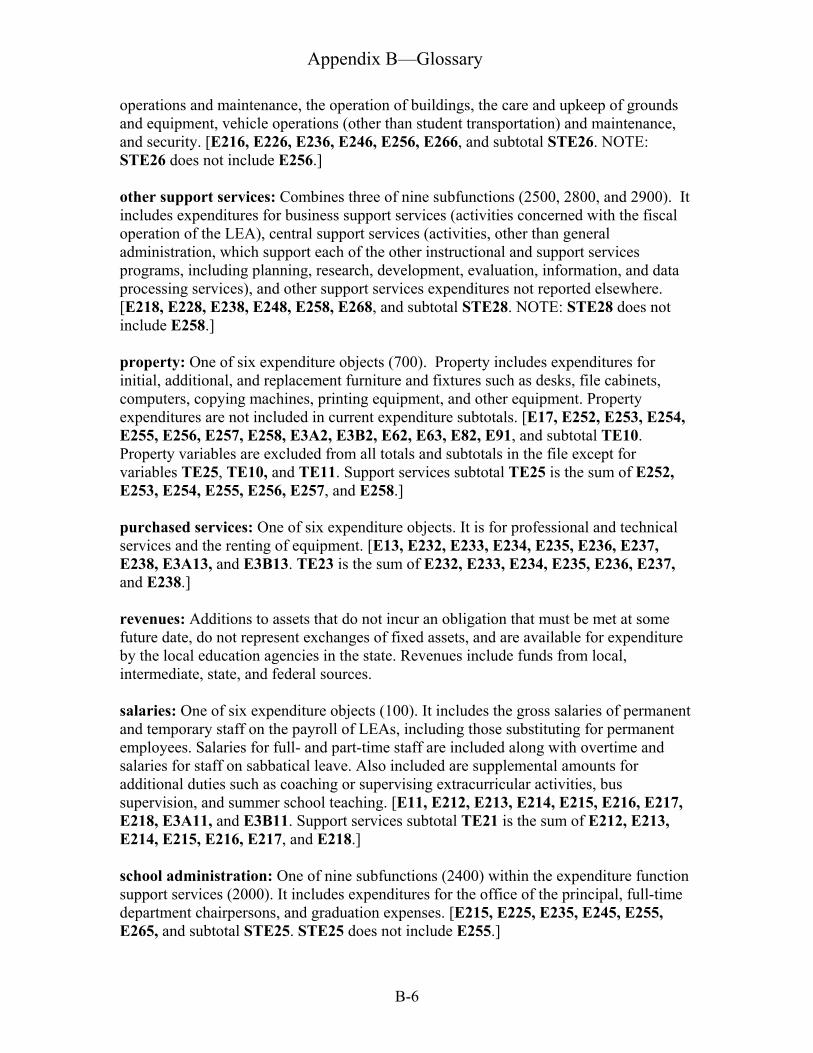
Appendix B—Glossary
operations and maintenance, the operation of buildings, the care and upkeep of grounds and equipment, vehicle operations (other than student transportation) and maintenance, and security. [E216, E226, E236, E246, E256, E266, and subtotal STE26. NOTE: STE26 does not include E256.]
other support services: Combines three of nine subfunctions (2500, 2800, and 2900). It includes expenditures for business support services (activities concerned with the fiscal operation of the LEA), central support services (activities, other than general administration, which support each of the other instructional and support services programs, including planning, research, development, evaluation, information, and data processing services), and other support services expenditures not reported elsewhere. [E218, E228, E238, E248, E258, E268, and subtotal STE28. NOTE: STE28 does not include E258.]
property: One of six expenditure objects (700). Property includes expenditures for initial, additional, and replacement furniture and fixtures such as desks, file cabinets, computers, copying machines, printing equipment, and other equipment. Property expenditures are not included in current expenditure subtotals. [E17, E252, E253, E254, E255, E256, E257, E258, E3A2, E3B2, E62, E63, E82, E91, and subtotal TE10. Property variables are excluded from all totals and subtotals in the file except for variables TE25, TE10, and TE11. Support services subtotal TE25 is the sum of E252, E253, E254, E255, E256, E257, and E258.]
purchased services: One of six expenditure objects. It is for professional and technical services and the renting of equipment. [E13, E232, E233, E234, E235, E236, E237, E238, E3A13, and E3B13. TE23 is the sum of E232, E233, E234, E235, E236, E237, and E238.]
revenues: Additions to assets that do not incur an obligation that must be met at some future date, do not represent exchanges of fixed assets, and are available for expenditure by the local education agencies in the state. Revenues include funds from local, intermediate, state, and federal sources.
salaries: One of six expenditure objects (100). It includes the gross salaries of permanent and temporary staff on the payroll of LEAs, including those substituting for permanent employees. Salaries for full- and part-time staff are included along with overtime and salaries for staff on sabbatical leave. Also included are supplemental amounts for additional duties such as coaching or supervising extracurricular activities, bus supervision, and summer school teaching. [E11, E212, E213, E214, E215, E216, E217, E218, E3A11, and E3B11. Support services subtotal TE21 is the sum of E212, E213, E214, E215, E216, E217, and E218.]
school administration: One of nine subfunctions (2400) within the expenditure function support services (2000). It includes expenditures for the office of the principal, full-time department chairpersons, and graduation expenses. [E215, E225, E235, E245, E255, E265, and subtotal STE25. STE25 does not include E255.]
B-6

Appendix B—Glossary
state revenues: Include both direct funds from state governments and funds in lieu of taxation. Revenues in lieu of taxes are paid to compensate a school district for nontaxable state institutions or facilities within the district’s boundary. [R3]
student membership: Annual headcount of students enrolled in school on October 1 or the school day closest to that date. In any given year, some small schools will not have any students.
student support services: One of nine subfunctions (2100) within the expenditure function support services (2000). It includes attendance and social work, guidance, health, psychological services, speech pathology, audiology, and other student support services. [E212, E222, E232, E242, E252, E262, and subtotal STE22. NOTE: STE22 does not include E252.]
student transportation: One of nine subfunctions (2700) within the expenditure function support services (2000). It includes expenses for the supervision, vehicle operation, monitoring, and vehicle servicing and maintenance associated with student transportation services. [E217, E227, E237, E247, E257, E267, and subtotal STE27. NOTE: STE27 does not include E257.]
supplies: One of six expenditure objects (line item 600). Supplies are items that are consumed, wear out, or deteriorate through use, or items that lose their identity through fabrication or incorporation into different or more complex units or substances. These include expenditures for general supplies; paper and other materials required for printing and copying; and books, periodicals, and reference materials. [E16, E242, E243, E244, E245, E246, E247, E248, E3A14, and E3B14. Support services subtotal TE24 is the sum of E242, E243, E244, E245, E246, E247, and E248.]
support services: An expenditure function (2000) divided into nine subfunctions: student support services (2100), instructional staff support (2200), general administration (2300), school administration (2400), operations and maintenance (2600), student transportation (2700), and other support services (2500, 2800, 2900). [Support services subtotal STE2T is the sum of subtotals STE22, STE23, STE24, STE25, STE26, STE27, and STE28. STE2T is also the sum of subtotals TE21, TE22, TE23, TE24 and TE26.]
teacher salaries - other programs: Salaries for teachers in programs other than regular education, special education or vocational education. Include salaries in alternative education programs. [E11D]
teacher salaries - regular education: Salaries for teachers in regular education programs, grades: Prekindergarten, Kindergarten, Ungraded and Grades 1 through 12. Missing data are included in the amount reported for Instruction Salaries. Include salaries in alternative education programs. [E11A]
teacher salaries - special education: Salaries for teachers in special education programs, relating to intellectual disability, orthopedic impairment, emotional disturbance,
B-7

Appendix B—Glossary
developmental delay, specific learning disabilities, multiple disabilities, hearing impairment, other health impairments, visual impairments including blindness, autism, deaf-blindness, traumatic brain injury, and speech or language impairments. Include salaries in alternative education programs. [E11B]
teacher salaries - vocational education: Salaries for teachers in vocational and technical programs. Include salaries in alternative education programs. [E11C]
textbook expenditures: Expenditures for textbooks used in instructing students. Missing data are included in the amount reported Instruction Supplies. [E2]
B-8

Appendix C—State Abbreviations and American National Standards Institute (ANSI) State Codes
C-1

05
10
15
20
25
30
Appendix C—State Abbreviations and American National Standards Institute (ANSI) State Codes
Table C-1. State abbreviations and American National Standards Institute (ANSI) state codes, by state or jurisdiction: Fiscal year 2011
State or State ANSI State or State ANSI jurisdiction abbreviation1 state code2 jurisdiction abbreviation1 state code2
Alabama AL 01 New Jersey NJ 34 Alaska AK 02 New Mexico NM 35 Arizona AZ 04 New York NY 36 Arkansas AR North Carolina NC 37 California CA 06 North Dakota ND 38
Colorado CO 08 Ohio OH 39 Connecticut CT 09 Oklahoma OK 40 Delaware DE Oregon OR 41 District of Columbia DC 11 Pennsylvania PA 42 Florida FL 12 Rhode Island RI 44
Georgia GA 13 South Carolina SC 45 Hawaii HI South Dakota SD 46 Idaho ID 16 Tennessee TN 47 Illinois IL 17 Texas TX 48 Indiana IN 18 Utah UT 49
Iowa IA 19 Vermont VT 50 Kansas KS Virginia VA 51 Kentucky KY 21 Washington WA 53 Louisiana LA 22 West Virginia WV 54 Maine ME 23 Wisconsin WI 55
Wyoming WY 56 Maryland MD 24 Massachusetts MA American Samoa AS 60 Michigan MI 26 Minnesota MN 27 Guam GU 66 Mississippi MS 28
Commonwealth of the Missouri MO 29 Northern Mariana Islands MP 69 Montana MT Nebraska NE 31 Puerto Rico PR 72 Nevada NV 32 New Hampshire NH 33 U.S. Virgin Islands VI 78
1 U.S. Postal Service state abbreviation codes. 2 American National Standards Institute state codes (01–78). SOURCE: U.S. Census Bureau, Geography Division, Geographic Standards and Criteria Branch. (2011) “Codes for the Identification of the States, the District of Columbia, Puerto Rico, and the Insular Areas of the United States” (INCITS 38:2009).
C-2

Appendix D—Imputations and Edits List
D-1

Appendix D—Imputations and Edits List
D-2
The following is a state-by-state list of the imputations and edits in the fiscal year 2011
111a NPEFS data file. Data elements are denoted by the variable names in the data file.
For more information, see section II.B. “Imputations” in the User’s Guide and Appendix
A—Record Layout and Description of Data Elements in the documentation.
ALASKA
R1D contains R1C using TR
ARIZONA
E4B1 distribute by destination E217, E227, E237, E247, E267
E4E1 distribute by destination E11, E12, E13, E16, E18, E212, E213, E214, E215,
E216, E217, E218, E222, E223, E224, E225, E226, E227, E228, E232, E233, E234,
E235, E236, E237, E238, E242, E243, E244, E245, E246, E247, E248, E262, E263,
E264, E265, E266, E267, E268
E81 impute based on (TE11-E81)
R1L contains R1N using TR
TE25 totals E252, E253, E254, E255, E256, E257, E258 using TE11
ARKANSAS
E4C1 distribute by salary E12, E222, E223, E224, E225, E226, E227, E228, E3A12
using E11, E212, E213, E214, E215, E216, E217, E218, E3A11
E4E1 distribute by destination E11, E12, E13, E16, E18, E212, E213, E214, E215,
E216, E217, E218, E222, E223, E224, E225, E226, E227, E228, E232, E233, E234,
E235, E236, E237, E238, E242, E243, E244, E245, E246, E247, E248, E262, E263,
E264, E265, E266, E267, E268
CALIFORNIA E4E1 distribute by destination E11, E12, E13, E16, E18, E212, E213, E214, E215,
E216, E217, E218, E222, E223, E224, E225, E226, E227, E228, E232, E233, E234,
E235, E236, E237, E238, E242, E243, E244, E245, E246, E247, E248, E262, E263,
E264, E265, E266, E267, E268
E4E2 distribute by destination E17, E252, E253, E254, E255, E256, E257, E258, E3A2
CONNECTICUT
E4C1 distribute by salary E12, E222, E223, E224, E225, E226, E227, E228, E3A12
using E11, E212, E213, E214, E215, E216, E217, E218, E3A11
E4E1 distribute by destination E11, E12, E13, E16, E18, E212, E213, E214, E215,
E216, E217, E218, E222, E223, E224, E225, E226, E227, E228, E232, E233, E234,
E235, E236, E237, E238, E242, E243, E244, E245, E246, E247, E248, E262, E263,
E264, E265, E266, E267, E268
E4E2 distribute by destination E17, E252, E253, E254, E255, E256, E257, E258, E3A2
E62 contains E61, E63 using TE11
E81 impute based on (TE11-E81)
E82 impute based on (TE11-E82)
R5 impute/import TR
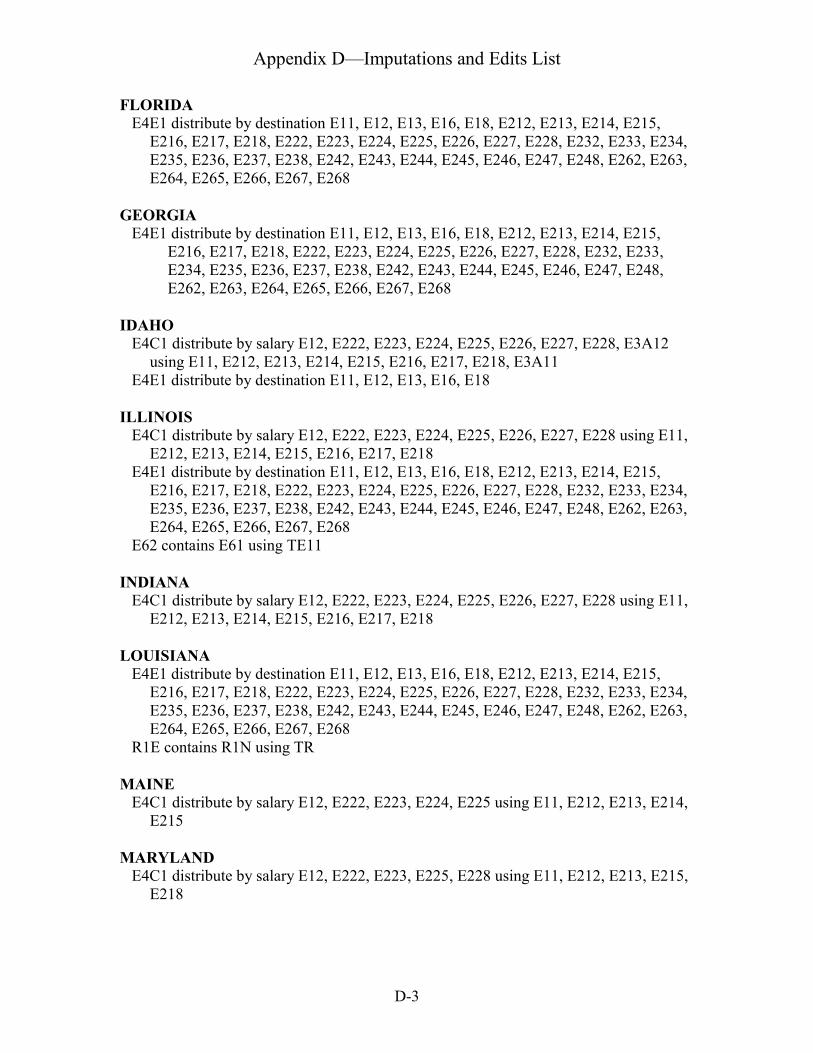
Appendix D—Imputations and Edits List
D-3
FLORIDA E4E1 distribute by destination E11, E12, E13, E16, E18, E212, E213, E214, E215,
E216, E217, E218, E222, E223, E224, E225, E226, E227, E228, E232, E233, E234,
E235, E236, E237, E238, E242, E243, E244, E245, E246, E247, E248, E262, E263,
E264, E265, E266, E267, E268
GEORGIA
E4E1 distribute by destination E11, E12, E13, E16, E18, E212, E213, E214, E215,
E216, E217, E218, E222, E223, E224, E225, E226, E227, E228, E232, E233,
E234, E235, E236, E237, E238, E242, E243, E244, E245, E246, E247, E248,
E262, E263, E264, E265, E266, E267, E268
IDAHO
E4C1 distribute by salary E12, E222, E223, E224, E225, E226, E227, E228, E3A12
using E11, E212, E213, E214, E215, E216, E217, E218, E3A11
E4E1 distribute by destination E11, E12, E13, E16, E18
ILLINOIS
E4C1 distribute by salary E12, E222, E223, E224, E225, E226, E227, E228 using E11,
E212, E213, E214, E215, E216, E217, E218
E4E1 distribute by destination E11, E12, E13, E16, E18, E212, E213, E214, E215,
E216, E217, E218, E222, E223, E224, E225, E226, E227, E228, E232, E233, E234,
E235, E236, E237, E238, E242, E243, E244, E245, E246, E247, E248, E262, E263,
E264, E265, E266, E267, E268
E62 contains E61 using TE11
INDIANA
E4C1 distribute by salary E12, E222, E223, E224, E225, E226, E227, E228 using E11,
E212, E213, E214, E215, E216, E217, E218
LOUISIANA E4E1 distribute by destination E11, E12, E13, E16, E18, E212, E213, E214, E215,
E216, E217, E218, E222, E223, E224, E225, E226, E227, E228, E232, E233, E234,
E235, E236, E237, E238, E242, E243, E244, E245, E246, E247, E248, E262, E263,
E264, E265, E266, E267, E268
R1E contains R1N using TR
MAINE
E4C1 distribute by salary E12, E222, E223, E224, E225 using E11, E212, E213, E214,
E215
MARYLAND
E4C1 distribute by salary E12, E222, E223, E225, E228 using E11, E212, E213, E215,
E218

Appendix D—Imputations and Edits List
D-4
MASSACHUSETTS
E4C1 distribute by salary E12, E222, E223 using E11, E212, E213
MICHIGAN
E62 contains E61 using TE11
MINNESOTA E4E1 distribute by destination E11, E12, E13, E16, E18, E212, E213, E214, E215,
E216, E217, E218, E222, E223, E224, E225, E226, E227, E228, E232, E233, E234,
E235, E236, E237, E238, E242, E243, E244, E245, E246, E247, E248, E262, E263,
E264, E265, E266, E267, E268
E62 contains E61 using TE11
MISSISSIPPI
E4E1 distribute by destination E11, E12, E13, E16, E18, E212, E213, E214, E215,
E216, E217, E218, E222, E223, E224, E225, E226, E227, E228, E232, E233, E234,
E235, E236, E237, E238, E242, E243, E244, E245, E246, E247, E248, E262, E263,
E264, E265, E266, E267, E268
E4E2 distribute by destination E17, E252, E253, E254, E255, E256, E257, E258, E3A2
E62 contains E63 using TE11
MISSOURI
E13 contains E18 using TE11
E61 contains E63 using TE11
NEBRASKA
E62 contains E61 using TE11
E81 contains E82 using TE11
R4B contains R4C using TR
NEW HAMPSHIRE
E62 contains E63 using TE11
NEW JERSEY R4A contains R4D using TR
NEW YORK
E4E1 distribute by destination E11, E12, E13, E16, E18, E212, E213, E214, E215,
E216, E217, E218, E222, E223, E224, E225, E226, E227, E228, E232, E233, E234,
E235, E236, E237, E238, E242, E243, E244, E245, E246, E247, E248, E262, E263,
E264, E265, E266, E267, E268
RHODE ISLAND
E4C1 distribute by salary E12, E222, E223, E224, E225, E226, E227, E228, E3A12
using E11, E212, E213, E214, E215, E216, E217, E218, E3A11
E4E1 distribute by destination E11, E12, E13, E16, E18, E212, E213, E214, E215,

Appendix D—Imputations and Edits List
D-5
E216, E217, E218, E222, E223, E224, E225, E226, E227, E228, E232, E233, E234,
E235, E236, E237, E238, E242, E243, E244, E245, E246, E247, E248, E262, E263,
E264, E265, E266, E267, E268
SOUTH DAKOTA
E62 contains E61 using TE11
VIRGINIA
E62 contains E63 using TE11
R1D contains R1C using TR
WASHINGTON
E15 contains E14 using TE11
WEST VIRGINIA
E4E1 distribute by destination E11, E12, E13, E16, E18, E212, E213, E214, E215,
E216, E217, E218, E222, E223, E224, E225, E226, E227, E228, E232, E233, E234,
E235, E236, E237, E238, E242, E243, E244, E245, E246, E247, E248, E262, E263,
E264, E265, E266, E267, E268
WISCONSIN
E4E1 distribute by destination E11, E12, E13, E16, E18, E212, E213, E214, E215,
E216, E217, E218, E222, E223, E224, E225, E226, E227, E228, E232, E233, E234,
E235, E236, E237, E238, E242, E243, E244, E245, E246, E247, E248, E262, E263,
E264, E265, E266, E267, E268
AMERICAN SAMOA
E268 contains E238, E248 using TE11
DISTRICT OF COLUMBIA
E61 contains E63 using TE11
U.S. VIRGIN ISLANDS
E4B1 distribute by destination E217, E227, E237
TE25 totals E252, E253, E254, E255, E256, E257, E258 using TE11

Appendix E—Fiscal Data Plan Questions
E-1

Appendix E—Fiscal Data Plan Questions
National Public Education Financial Survey FY 2011 Fiscal Data Plan
01/05/2012
Direct Program Support / State Payments on Behalf
Note: Both the NPEFS and School District Finance (F-33) surveys use the responses to questions 1-4 below to analyze and process the Direct Program Support/State Payments on Behalf sections of the surveys. It is critical that these questions be completed as accurately as possible so that state expenditures on behalf of local education agencies are reflected correctly on the NPEFS and F-33 surveys.
In some instances the amounts requested in question 4 are missing in the Fiscal Data Plan, yet are included within the Direct Program Support section of NPEFS. If applicable to the state, the amounts reported in question 4 below should match the amounts reported within the Direct Program Support section of NPEFS unless the Direct Program Support amounts have been functionalized within the survey. If the amounts have been functionalized, then Direct Program Support payments will still need to be broken out and reported separately under question 4.
1. In your state, do local education agencies receive Direct Program Support/State Payments on Behalf monies from the state?
Yes (Please go to question 2.)
No (Please go to question 5.)
2. Are these amounts reported in NPEFS?
Yes (Please go to question 2a.)
No (Please go to question 3.)
2a. If yes, where are these amounts reported in NPEFS? (Check all that apply.)
Revenues Expenditures
3. How are these amounts reported in F-33?
Provided as district-by-district data
Provided as state totals data
Provided only on data plan
Amounts are not reported in F-33
E-2

Appendix E—Fiscal Data Plan Questions
4. Please provide the TOTAL Direct Program Support/State Payments on Behalf amounts in your state (include all amounts, even those reported under their appropriate functions).
4a. Textbooks for Public School Students 1. Non-Property $ ___________
2. Property Only $ ___________
4b. Transportation for Public School Students 1. Non-Property $ ___________
2. Property Only $ ___________
4c. Direct Program Support for Private School Students 1. Non-Property $ ___________
4d. Other Direct Program Support for Public School Students 1.Non-Property $ ___________
If applicable, please specify program name(s) ______________
2. Property $ ___________
If applicable, please specify program name(s) ______________
4e. Employee Benefits for Public School Employees 1. Non-Property $ ___________
2. Property $ ___________
4f. If you are reporting Direct Program Support expenditures for Employee Benefits, please indicate the general categories of benefits these expenditures support: (Check all that apply.)
Retirement Health Insurance Other (please specify) _______________________________________
E-3
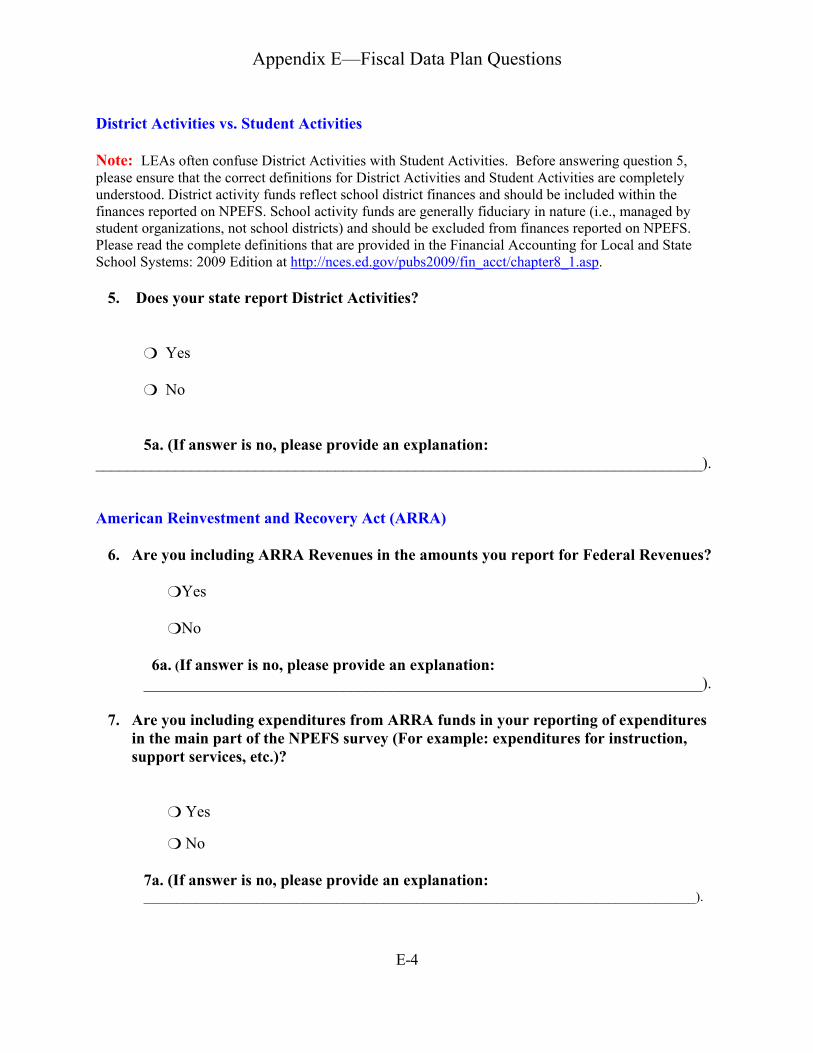
Appendix E—Fiscal Data Plan Questions
District Activities vs. Student Activities
Note: LEAs often confuse District Activities with Student Activities. Before answering question 5, please ensure that the correct definitions for District Activities and Student Activities are completely understood. District activity funds reflect school district finances and should be included within the finances reported on NPEFS. School activity funds are generally fiduciary in nature (i.e., managed by student organizations, not school districts) and should be excluded from finances reported on NPEFS. Please read the complete definitions that are provided in the Financial Accounting for Local and State School Systems: 2009 Edition at http://nces.ed.gov/pubs2009/fin_acct/chapter8_1.asp.
5. Does your state report District Activities?
Yes
No
5a. (If answer is no, please provide an explanation: ____________________________________________________________________________).
American Reinvestment and Recovery Act (ARRA)
6. Are you including ARRA Revenues in the amounts you report for Federal Revenues?
Yes
No
6a. (If answer is no, please provide an explanation: ______________________________________________________________________).
7. Are you including expenditures from ARRA funds in your reporting of expenditures in the main part of the NPEFS survey (For example: expenditures for instruction, support services, etc.)?
Yes
No
7a. (If answer is no, please provide an explanation: ___________________________________________________________________________________).
E-4

Appendix E—Fiscal Data Plan Questions
ARRA Expenditure Exhibit Section
Note: Before answering questions 8-9 below, please note that ARRA expenditure amounts are requested in section 7 of the NPEFS web form. It has been determined that there is some confusion on how to respond to the first two categories in the ARRA exhibit section. The first category requests the amount of ARRA funds that was expended for instruction-related current expenditures, while the second category requests the amount of ARRA funds that was expended for all current expenditures (which should include the instruction expenditures from the first category).
8. Do you have ARRA expenditures for Instruction?
Yes
No
8a.If no, please explain ____________________________________
9. Do you have Total Current Expenditures for ARRA?
Yes
No
9a. If no, please explain ____________________________________
Flag Fields
Note: The NPEFS web form has flag fields containing M (missing) and N (non-applicable) flag values for each category. NCES and the Census Bureau are striving to ensure respondents are assigning flag values correctly so that “reported,” “missing,” and “non-applicable” zeroes can be properly distinguished.
10. Please indicate that you understand the proper usage of flag fields and that you will be using them when reporting throughout the web form.
Yes
No
E-5

Appendix F—Fiscal Data Plan Responses
F-1

Appendix F—Fiscal Data Plan Responses
Exhibit F-1. Fiscal data plan responses to questions 1 through 3, by state or jurisdiction: Fiscal year 2011 Do local education agencies in your state receive Direct
State or jurisdiction Alabama
Program Support/State Payments on Behalf monies from the state? Q. 1 No
Are these amounts reported in NPEFS? Q. 2 †
If yes, where are these amounts reported in NPEFS?
Q. 2.a Revenues Expenditures † †
How are these amounts reported in F-33? Q. 3 †
Alaska Arizona
Yes No
Yes †
Yes †
Yes †
District-by-district †
Arkansas California
Yes Yes
Yes Yes
Yes Yes
Yes Yes
Amounts not reported in F-33 Data plan only
Colorado No † † † † Connecticut Delaware
Yes No
Yes †
Yes †
Yes †
Amounts not reported in F-33 †
District of Columbia No † † † † Florida Yes Yes † Yes Amounts not reported in F-33
Georgia Hawaii
Yes No
Yes †
Yes †
Yes †
District-by-district †
Idaho Illinois Indiana
Yes Yes Yes
Yes Yes Yes
Yes Yes †
Yes Yes Yes
District-by-district Amounts not reported in F-33 State totals
Iowa No † † † † Kansas Kentucky Louisiana Maine
Yes Yes Yes Yes
Yes Yes Yes Yes
Yes Yes Yes Yes
Yes Yes Yes Yes
District-by-district District-by-district Amounts not reported in F-33 State totals
Maryland Massachusetts MichiganMinnesota Mississippi
Yes Yes No Yes Yes
Yes Yes † Yes Yes
Yes Yes † † Yes
Yes Yes † Yes Yes
District-by-district Amounts not reported in F-33 † Amounts not reported in F-33 District-by-district
Missouri No † † † † Montana No † † † † Nebraska No † † † † Nevada No † † † † New Hampshire Yes Yes Yes Yes State totals
New Jersey New Mexico
Yes No
Yes †
Yes †
Yes †
District-by-district †
New York North Carolina
Yes No
Yes †
Yes †
† †
District-by-district †
North Dakota No † † † †
Ohio No † † † † Oklahoma No † † † † Oregon Pennsylvania Rhode Island
No Yes Yes
† Yes Yes
† † Yes
† Yes Yes
† Amounts not reported in F-33 District-by-district
See notes at end of exhibit.
F-2

Appendix F—Fiscal Data Plan Responses
Exhibit F-1. Fiscal data plan responses to questions 1 through 3, by state or jurisdiction: Fiscal year 2011—continued Do local education agencies in your state receive Direct Program Support/State Payments on Behalf monies from the state?
Are these amounts reported in NPEFS?
If yes, where are these amounts reported in NPEFS?
Q. 2.a How are these amounts reported in F-33?
State or jurisdiction Q. 1 Q. 2 Revenues Expenditures Q. 3 South Carolina Yes Yes Yes Yes State totals South Dakota Yes Yes Yes Yes District-by-district Tennessee No † † † † Texas Yes Yes Yes Yes District-by-district Utah No † † † †
Vermont Yes Yes Yes Yes District-by-district Virginia No † † † † Washington No † † † † West Virginia Yes Yes Yes Yes District-by-district Wisconsin Yes Yes † Yes Amounts not reported in F-33 Wyoming No † † † † Other jurisdictions American Samoa No † † † † Guam No † † † † Commonwealth of the Northern Mariana Islands Yes Yes † Yes † Puerto Rico Yes Yes † Yes Amounts not reported in F-33 U.S. Virgin Islands No † † † † — Not available. † Not applicable. SOURCE: U.S. Department of Education, National Center for Education Statistics, Common Core of Data (CCD), "National Public Education Financial Survey (NPEFS)," fiscal year 2011, preliminary Version 1a.
F-3

Appendix F—Fiscal Data Plan Responses
Exhibit F-2. Fiscal data plan responses to questions 4.a.1 through 4.c.1, by state or jurisdiction: Fiscal year 2011 Please provide the Total Direct Program Support/State Payments on Behalf amounts in your state
(include all amounts, even those reported under their appropriate functions)
State or jurisdiction AlabamaAlaska Arizona Arkansas California
Textbooks for Public School
Students (Non-Property)
Q.4.a.1 †
— †
— $0
Textbooks for Public School
Students (Property only)
Q.4.a.2 †
— †
— $0
Transportation for Public School
Students (Non-Property)
Q.4.b.1 †
— †
— $0
Transportation for Public School
Students (Property only)
Q.4.b.2 †
— †
— $0
Direct Program Support for Private
School Students (Non-Property)
Q.4.c.1 †
— †
— $0
ColoradoConnecticut DelawareDistrict of Columbia Florida
† — † † 0
† — † † 0
† — † † 0
† — † † 0
† 24,435,417
† † 0
Georgia HawaiiIdahoIllinois Indiana
0 †
— 0 0
0 †
— 0 0
0 †
— 0 0
0 †
— 0 0
0 †
— 0 0
IowaKansas KentuckyLouisianaMaine
† —
100,000 0
—
† — — 0
—
† — — 0
—
† — — 0
—
† — —
25,026,514 —
MarylandMassachusetts MichiganMinnesotaMississippi
38,621,839 0 †
— —
— 0 †
— —
612,134,6400 †
— —
19,885,189 0 †
— —
8,307,823 0 †
— 5,366,378
Missouri MontanaNebraskaNevadaNew Hampshire
† † † †
—
† † † †
—
† † † †
—
† † † †
—
† † † †
—
New Jersey New Mexico New York North Carolina North Dakota
— †
254,837,832 † †
— †
— † †
— †
2,766,578,610† †
— †
— † †
88,585,502 †
1,483,564,297 † †
Ohio Oklahoma Oregon PennsylvaniaRhode Island See notes at end of exhibit.
† † † 0 0
† † † 0 0
† † † 0 0
† † † 0 0
† † †
112,574,534 0
F-4

Appendix F—Fiscal Data Plan Responses
Exhibit F-2. Fiscal data plan responses to questions 4.a.1 through 4.c.1, by state or jurisdiction: Fiscal year 2011—continued Please provide the Total Direct Program Support/State Payments on Behalf amounts in your state
(include all amounts, even those reported under their appropriate functions) Textbooks for Textbooks for Transportation for Transportation for Direct Program Public School Public School Public School Public School Support for Private
Students (Non- Students Students (Non- Students School Students Property) (Property only) Property) (Property only) (Non-Property)
State or jurisdiction Q.4.a.1 Q.4.a.2 Q.4.b.1 Q.4.b.2 Q.4.c.1 South Carolina $32,987,008 $0 $80,561,613 $25,471,768 $0 South Dakota 0 0 0 0 0 Tennessee † † † † † Texas 184,014,315 — 21488415 — 0 Utah † † † † †
Vermont 0 0 0 0 0 Virginia † † † † † Washington † † † † † West Virginia — — — — 1,673,165 Wisconsin — — — — 129,183,118 Wyoming † † † † † Other jurisdictions American Samoa † † † † † Guam † † † † † Commonwealth of the Northern Mariana Islands 0 0 — — 2,319,587 Puerto Rico 0 0 0 0 33,761,992 U.S. Virgin Islands † † † † † — Not available. † Not applicable. SOURCE: U.S. Department of Education, National Center for Education Statistics, Common Core of Data (CCD), "National Public Education Financial Survey (NPEFS)," fiscal year 2011, preliminary Version 1a.
F-5

Appendix F—Fiscal Data Plan Responses
Exhibit F-3. Fiscal data plan responses to questions 4.d.1 through 4.d.2, by state or jurisdiction: Fiscal year 2011 Please provide the Total Direct Program Support/State Payments on Behalf amounts in your state
(include all amounts, even those reported under their appropriate functions) Other Direct Program Other Direct Program
Support for Public Support for Public School Students School Students
(Non-Property) Program Name(s) (Property) Program Name(s) State or jurisdiction Q.4.d.1 Q.4.d.1 Q.4.d.2 Q.4.d.2 Alabama † † † † Alaska — — — — Arizona † † † † Arkansas $75,824,044 Leadership Academy- — —
Master Principal, AT Risk, Criminal Background Checks-Teachers, Gifted & Talented, Human Dev CTR Ed Aid, Nat Board Prof Teaching Standards, Master Principal Bonus, School Food Legislative Audit, SmartStart/Smart Step, Surplus Commodities, Teacher Licensure, Technology DIS, End of Level Testing, Court Ordered Desegregation, Alternative Pay, Office of Educational Renewal Zones, Economic Education, Home School Testing, School Worker Defense, AR Strive Transfer, Distressed School District Support, Surety Bond Transfer, Real Property Reappraisal Costs Transfer
See notes at end of exhibit.
F-6

Appendix F—Fiscal Data Plan Responses
Exhibit F-3. Fiscal data plan responses to questions 4.d.1 through 4.d.2, by state or jurisdiction: Fiscal year 2011—continued Please provide the Total Direct Program Support/State Payments on Behalf amounts in your state
(include all amounts, even those reported under their appropriate functions) Other Direct Program Other Direct Program
Support for Public Support for Public School Students School Students
(Non-Property) Program Name(s) (Property) Program Name(s) State or jurisdiction Q.4.d.1 Q.4.d.1 Q.4.d.2 Q.4.d.2 California $1,089,883,632 Charter schools $25,358,635 Charter schools Colorado † † † † Connecticut 422,080,888 Child Nutrition 17,870,722 State Technical High
programs run by School programs, and State Agencies, Regional Education State Technical High Service Center School programs, programs State Department of Correction programs, and Regional Education Service Center programs
Delaware † † † † District of Columbia † † † † Florida 441,596,061 FL School for Deaf & 0 †
Blind, FL Virtual School, McKay Scholarship Program, and FL Tax Credit Scholarship Program
Georgia 33,508,690 State Schools, Virtual School
0 †
Hawaii † † † † 3,177,022 Idaho Educational — —
Idaho Services for the Deaf and the Blind
Illinois 31,660,500 Direct Support Other 0 † Indiana 0 † 0 † Iowa † † † †
Kansas — — — — Kentucky 4,227,057 — — — See notes at end of exhibit
F-7

Appendix F—Fiscal Data Plan Responses
Exhibit F-3. Fiscal data plan responses to questions 4.d.1 through 4.d.2, by state or jurisdiction: Fiscal year 2011—continued Please provide the Total Direct Program Support/State Payments on Behalf amounts in your state
(include all amounts, even those reported under their appropriate functions) Other Direct Program Other Direct Program
Support for Public Support for Public School Students School Students
(Non-Property) Program Name(s) (Property) Program Name(s) State or jurisdiction Q.4.d.1 Q.4.d.1 Q.4.d.2 Q.4.d.2 Louisiana $87,943,110 LA School for the $0 †
Deaf and Visually Impaired; LA Special Education Center; LA School for Math, Science and the Arts; New Orleans Center for Creative Arts; Special School Districts; Office of Juvenile Justice; Student Scholarships for Educational Excellence Program
Maine — — — — Maryland — — — —
Massachusetts 0 † 0 † Michigan † † † † Minnesota 43,624,415 Tribal Contract — —
Schools, Department of Corrections, Faribault Academies, Perpich Center for Arts, Enrollment Options
Mississippi 18,280,098 — 348,994 — Missouri † † † † Montana † † † †
Nebraska † † † † Nevada † † † † New Hampshire — — — —
New Jersey — — — — New Mexico † † † † New York 775,360,500 District Payments to — —
Charter Schools See notes at end of exhibit.
F-8

Appendix F—Fiscal Data Plan Responses
Exhibit F-3. Fiscal data plan responses to questions 4.d.1 through 4.d.2, by state or jurisdiction: Fiscal year 2011—continued Please provide the Total Direct Program Support/State Payments on Behalf amounts in your state
(include all amounts, even those reported under their appropriate functions) Other Direct Program Other Direct Program
Support for Public Support for Public School Students School Students
(Non-Property) Program Name(s) (Property) Program Name(s) State or jurisdiction Q.4.d.1 Q.4.d.1 Q.4.d.2 Q.4.d.2
North Carolina † † † † North Dakota † † † † Ohio † † † †
Oklahoma † † † † Oregon † † † † Pennsylvania $0 † $0 †
Rhode Island 67,976,514 School Housing Aid — — Program
South Carolina 1,925,041 Community Education 0 † South Dakota 7,131,217 Connecting Schools 158,725 Connecting Schools
Tennessee † † † † Texas 0 † 0 † Utah † † † †
Vermont 0 † 0 † Virginia † † † † Washington † † † †
West Virginia 25,891,169 Corrections, School 16,288,470 21st Century for the Deaf and Blind Technology - Tools for
Schools Wisconsin 55,630,125 State Charter Schools — — Wyoming † † † † Other jurisdictions American Samoa † † † † Guam † † † † Commonwealth of 28,842,332 — — — the Northern Mariana Islands Puerto Rico 0 † 0 † U.S. Virgin Islands † † † † — Not available. † Not applicable. SOURCE: U.S. Department of Education, National Center for Education Statistics, Common Core of Data (CCD), "National Public Education Financial Survey (NPEFS)," fiscal year 2011, preliminary Version 1a.
F-9

Appendix F—Fiscal Data Plan Responses
Exhibit F-4. Fiscal data plan responses to questions 4.e through 4.f, by state or jurisdiction: Fiscal year 2011 Please provide the Total Direct Program Support/State Payments on Behalf amounts in your state
(include all amounts, even those reported under their appropriate functions) If you are reporting Direct Program Support expenditures
Employee Benefits for Public School for Employee Benefits, please indicate the general Employees categories of benefits these expenditures support
Q.4.e Q.4.f Non-Property Property Health
State or jurisdiction Q.4.e.1 Q.4.e.2 Retirement Insurance Other Alabama † † † † † Alaska $201,352,505 — Yes † † Arizona † † † † † Arkansas 59,677,904 — Yes Yes † California 1,159,821,000 0 Yes † †
Colorado † † † † † Connecticut 645,240,426 — Yes Yes † Delaware † † † † † District of † † † † † Columbia Florida 0 0 † † †
Georgia — — Yes Yes † Hawaii † † † † † Idaho 2,249,907 — † † Yes.Unemployment
Insurance Illinois 2,200,752,427 — Yes † † Indiana 759,013,073 0 Yes Yes †
Iowa † † † † † Kansas 184,500,740 — Yes † † Kentucky 958,421,153 — Yes Yes Yes.Life Insurance,
HRA, Voc Ed Louisiana 0 0 † † † Maine 216,529,249 — Yes Yes †
Maryland 809,235,203 — Yes † † Massachusetts 1,749,083,891 — Yes † † Michigan † † † † † Minnesota — — — — — Mississippi — — — — —
Missouri † † † † † Montana † † † † † Nebraska † † † † † Nevada † † † † † New Hampshire 24,836,000 — Yes † † See notes at end of exhibit.
F-10

Appendix F—Fiscal Data Plan Responses
Exhibit F-4. Fiscal data plan responses to questions 4.e through 4.f, by state or jurisdiction: Fiscal year 2011—continued Please provide the Total Direct Program Support/State Payments on Behalf amounts in your state
(include all amounts, even those reported under their appropriate functions) If you are reporting Direct Program Support
expenditures for Employee Benefits, please indicate the Employee Benefits for Public School general categories of benefits these expenditures
Employees support Q.4.e Q.4.f
Non-Property Property Health State or jurisdiction Q.4.e.1 Q.4.e.2 Retirement Insurance Other New Jersey $679,801,315 — Yes † † New Mexico † † † † † New York 12,008,924,570 — Yes Yes Yes. Workers
comp, life ins, unemployment ins, disability ins.
North Carolina † † † † † North Dakota † † † † †
Ohio † † † † † Oklahoma † † † † † Oregon † † † † † Pennsylvania 0 0 † † † Rhode Island 69,896,748 — Yes † †
South Carolina 0 0 † † † South Dakota 0 0 † † † Tennessee † † † † † Texas 1,340,448,290 — Yes † † Utah † † † † †
Vermont 46,913,381 0 Yes † † Virginia † † † † † Washington † † † † † West Virginia 347,162,638 — Yes † † Wisconsin — — — — — Wyoming † † † † † Other jurisdictions American Samoa † † † † † Guam † † † † † Commonwealth of 8,425,346 0 Yes Yes † the Northern Mariana Islands Puerto Rico 0 0 † † † U.S. Virgin Islands † † † † † — Not available. † Not applicable. SOURCE: U.S. Department of Education, National Center for Education Statistics, Common Core of Data (CCD), "National Public Education Financial Survey (NPEFS)," fiscal year 2011, preliminary Version 1a.
F-11

Appendix F—Fiscal Data Plan Responses
Exhibit F-5. Fiscal data plan responses to question 5, by state or jurisdiction: Fiscal year 2011
State or jurisdiction Alabama Alaska Arizona Arkansas California
Does your state report District Activities? Q. 5
Yes Yes Yes Yes No
If answer is no, please provide an explanation. Q. 5a
† † † †
—
ColoradoConnecticut Delaware District of ColumbiaFlorida
No Yes Yes
No Yes
— † †
— †
Georgia Hawaii Idaho Illinois Indiana
Yes Yes Yes Yes Yes
† † † † †
IowaKansas Kentucky Louisiana Maine
Yes Yes Yes Yes Yes
† † † † †
Maryland Massachusetts Michigan Minnesota Mississippi
Yes Yes Yes Yes Yes
† † † † †
Missouri Montana Nebraska Nevada New Hampshire
Yes Yes Yes Yes Yes
† † † † †
New Jersey New Mexico New York North Carolina North Dakota
Yes Yes Yes Yes Yes
† † † † †
Ohio Oklahoma Oregon Pennsylvania Rhode Island
Yes Yes Yes Yes Yes
† † † † †
See notes at end of exhibit.
F-12

Appendix F—Fiscal Data Plan Responses
Exhibit F-5. Fiscal data plan responses to question 5, by state or jurisdiction: Fiscal year 2011—continued Does your state If answer is report District Activities?
no, please provide an explanation.
State or jurisdiction Q. 5 Q. 5a South Carolina Yes † South Dakota Yes † Tennessee Yes † Texas Yes † Utah Yes †
Vermont Yes † Virginia No — Washington Yes † West Virginia Yes † Wisconsin Yes † Wyoming Yes † Other Jurisdictions American Samoa Yes † Guam Yes † Commonwealth of the Northern Mariana Islands No — Puerto Rico Yes † U.S. Virgin Islands Yes † — Not available. † Not applicable. SOURCE: U.S. Department of Education, National Center for Education Statistics, Common Core of Data (CCD), "National Public Education Financial Survey (NPEFS)," fiscal year 2011, preliminary Version 1a.
F-13

Appendix F—Fiscal Data Plan Responses
Exhibit F-6. Fiscal data plan responses to questions 6 through 7a, by state or jurisdiction: Fiscal year 2011 Are you including expenditures from ARRA funds in your
Are you reporting of including expenditures in the ARRA main part of the Revenues in NPEFS survey (For the amounts If answer is example: If answer is you report for no, please expenditures for no, please Federal provide an instruction, support provide an
State or Revenues? explanation. services, etc.)? explanation. jurisdiction Q.6 Q.6.a Q.7 Q.7a Alabama Yes † Yes † Alaska Yes † Yes † Arizona Yes † Yes † Arkansas Yes † Yes † California Yes † Yes †
Colorado Yes † Yes † Connecticut Yes † Yes † Delaware Yes † Yes † District of Columbia Yes † Yes †
Florida Yes † Yes †
Georgia Yes † Yes † Hawaii Yes † Yes † Idaho Yes † Yes † Illinois Yes † Yes † Indiana Yes † Yes †
Iowa Yes † Yes † Kansas Yes † Yes † Kentucky Yes † Yes † Louisiana Yes † Yes † Maine Yes † Yes †
Maryland Yes † Yes † Massachusetts Yes † Yes † Michigan Yes † Yes † Minnesota Yes † Yes † Mississippi Yes † Yes †
Missouri Yes † Yes † Montana Yes † Yes † Nebraska Yes † Yes † Nevada Yes † Yes † New Hampshire Yes † Yes †
New Jersey Yes † Yes † New Mexico Yes † Yes † New York Yes † Yes † North Carolina Yes † Yes † North Dakota Yes † Yes †
Ohio Yes † Yes † Oklahoma Yes † Yes † Oregon Yes † Yes † Pennsylvania Yes † Yes † Rhode Island Yes † Yes †
See notes at end of exhibit.
F-14

Appendix F—Fiscal Data Plan Responses
Exhibit F-6. Fiscal data plan responses to questions 6 through 7a, by state or jurisdiction: Fiscal year 2011—continued Are you including expenditures from ARRA funds in your reporting of expenditures in
Are you the main part of including ARRA the NPEFS survey Revenues in the (For example: amounts you expenditures for If answer is no, report for If answer is no, instruction, please provide an Federal please provide support services, explanation. Revenues? an explanation. etc.)? (Property only)
State or jurisdiction Q.6 Q.6.a Q.7 Q.7a South Carolina Yes † Yes † South Dakota Yes † Yes † Tennessee Yes † Yes † Texas Yes † Yes † Utah Yes † Yes †
Vermont Yes † Yes † Virginia Yes † Yes † Washington Yes † Yes † West Virginia Yes † Yes † Wisconsin Yes † Yes † Wyoming Yes † Yes † Other jurisdictions American Samoa Yes † Yes † Guam Yes † Yes † Commonwealth of the Northern Mariana Islands Yes † Yes † Puerto Rico Yes † Yes † U.S. Virgin Islands Yes † Yes † — Not available. † Not applicable. SOURCE: U.S. Department of Education, National Center for Education Statistics, Common Core of Data (CCD), "National Public Education Financial Survey (NPEFS)," fiscal year 2011, preliminary Version 1a.
F-15

Appendix F—Fiscal Data Plan Responses
Exhibit F-7. Fiscal data plan responses to questions 8 through 9a, by state or jurisdiction: Fiscal year 2011
State or jurisdiction AlabamaAlaska Arizona Arkansas California
Do you have ARRA expenditures for Instruction? Q.8 Yes Yes Yes Yes Yes
If answer is no, please provide an explanation. Q.8a † † † † †
Do you have Total Current Expenditures for ARRA? Q.9 Yes Yes Yes Yes Yes
If answer is no, please provide an explanation. Q.9a † † † † †
ColoradoConnecticut DelawareDistrict of Columbia Florida
Yes Yes Yes Yes Yes
† † † † †
Yes Yes Yes Yes Yes
† † † † †
Georgia HawaiiIdahoIllinois Indiana
Yes Yes Yes Yes Yes
† † † † †
Yes Yes Yes Yes Yes
† † † † †
IowaKansas KentuckyLouisianaMaine
Yes Yes Yes Yes Yes
† † † † †
Yes Yes Yes Yes Yes
† † † † †
Maryland MassachusettsMichiganMinnesotaMississippi
Yes Yes Yes Yes Yes
† † † † †
Yes Yes Yes Yes Yes
† † † † †
Missouri MontanaNebraskaNevadaNew Hampshire
Yes Yes Yes Yes Yes
† † † † †
Yes Yes Yes Yes Yes
† † † † †
New Jersey New Mexico New York North Carolina North Dakota
Yes Yes Yes Yes Yes
† † † † †
Yes Yes Yes Yes Yes
† † † † †
Ohio Oklahoma Oregon PennsylvaniaRhode Island
Yes Yes Yes Yes Yes
† † † † †
Yes Yes Yes Yes Yes
† † † † †
F-16
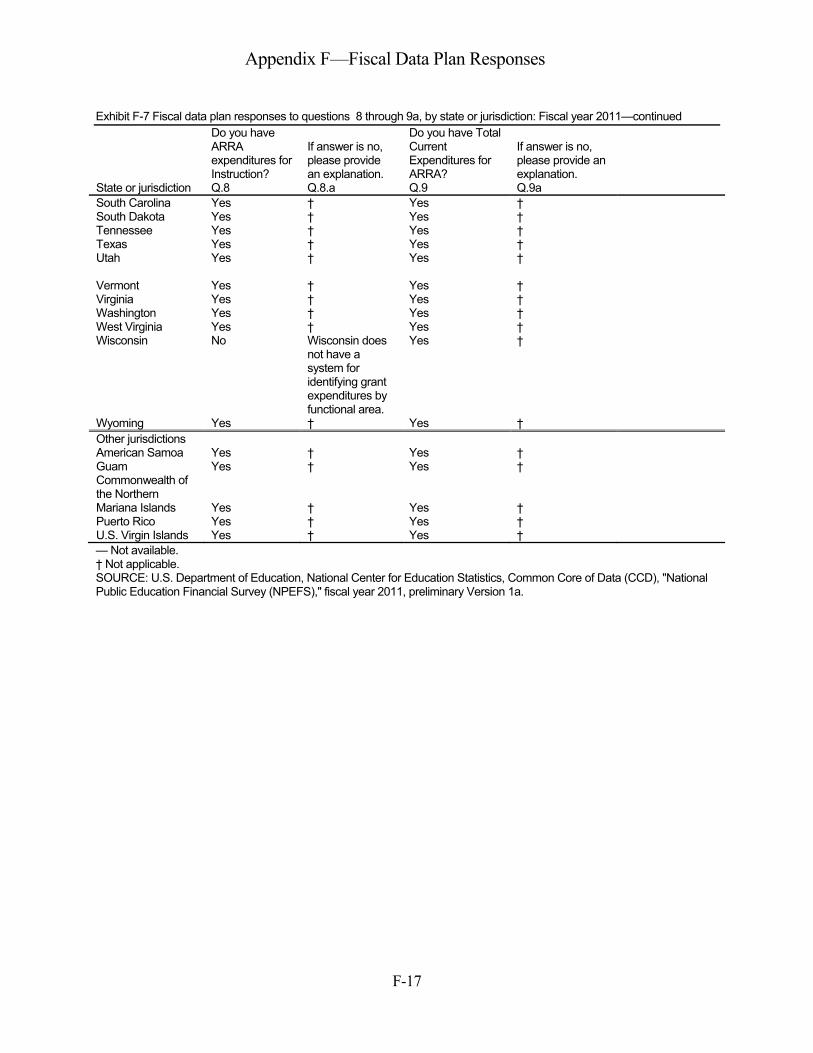
Appendix F—Fiscal Data Plan Responses
Exhibit F-7 Fiscal data plan responses to questions 8 through 9a, by state or jurisdiction: Fiscal year 2011—continued Do you have Do you have Total ARRA If answer is no, Current If answer is no, expenditures for please provide Expenditures for please provide an Instruction? an explanation. ARRA? explanation.
State or jurisdiction Q.8 Q.8.a Q.9 Q.9a South Carolina Yes † Yes † South Dakota Yes † Yes † Tennessee Yes † Yes † Texas Yes † Yes † Utah Yes † Yes †
Vermont Yes † Yes † Virginia Yes † Yes † Washington Yes † Yes † West Virginia Yes † Yes † Wisconsin No Wisconsin does Yes †
not have a system for identifying grant expenditures by functional area.
Wyoming Yes † Yes † Other jurisdictions American Samoa Yes † Yes † Guam Yes † Yes † Commonwealth of the Northern Mariana Islands Yes † Yes † Puerto Rico Yes † Yes † U.S. Virgin Islands Yes † Yes † — Not available. † Not applicable. SOURCE: U.S. Department of Education, National Center for Education Statistics, Common Core of Data (CCD), "National Public Education Financial Survey (NPEFS)," fiscal year 2011, preliminary Version 1a.
F-17

Appendix F—Fiscal Data Plan Responses
Exhibit F-8. Fiscal data plan responses to question 10, by state or jurisdiction: Fiscal year 2011 Please indicate that you understand the proper usage of flag fields and that you will be using them when reporting throughout the web form. Q.10State or jurisdiction
Alabama Yes Alaska Yes Arizona Yes Arkansas Yes California Yes
Colorado Yes Connecticut Yes Delaware Yes District of Columbia Yes Florida Yes
Georgia Yes Hawaii Yes Idaho No Illinois Yes Indiana Yes
Iowa Yes Kansas Yes Kentucky Yes Louisiana Yes Maine Yes
Maryland Yes Massachusetts Yes Michigan Yes Minnesota Yes Mississippi Yes
Missouri Yes Montana Yes Nebraska Yes Nevada Yes New Hampshire Yes
New Jersey Yes New Mexico Yes New York Yes North Carolina Yes North Dakota Yes
Ohio Yes Oklahoma Yes Oregon Yes Pennsylvania Yes Rhode Island Yes See notes at end of exhibit.
F-18

Appendix F—Fiscal Data Plan Responses
Please indicate that you understand the proper usage of flag fields and that you will be using them when reporting throughout the web form.
Exhibit F-8. Fiscal data plan responses to question 10, by state or jurisdiction: Fiscal year 2011—continued
Q.10State or jurisdiction South Carolina Yes South Dakota Yes Tennessee Yes Texas Yes Utah Yes
Vermont Yes Virginia Yes Washington Yes West Virginia Yes Wisconsin Yes Wyoming Yes Other jurisdictions American Samoa Yes Guam Yes Commonwealth of the Northern Mariana Islands Yes Puerto Rico Yes U.S. Virgin Islands Yes — Not available. † Not applicable. SOURCE: U.S. Department of Education, National Center for Education Statistics, Common Core of Data (CCD), "National Public Education Financial Survey (NPEFS)," fiscal year 2011, preliminary Version 1a.
F-19

Appendix G—Value Distribution and Field Frequencies
G-1

Appendix G—Value Distribution and Field Frequencies
Table G-1. Number and percentage distribution of imputation flag values, by imputation flag: Fiscal year 2011
Variable Description Total R A I T R A I T
IR1A FLAG LOCAL REV PROPERTY TAX 56 56 0 0 0 100.0 0.0 0.0 0.0
IR1B FLAG LOCAL REV NON PROPERTY TAX 56 56 0 0 0 100.0 0.0 0.0 0.0
IR1C FLAG LOCAL REV LOC GOVT PROP TAX 56 54 2 0 0 96.4 3.6 0.0 0.0
IR1D FLAG LOCAL REV LOC GOVT NON PROP TAX 56 54 2 0 0 96.4 3.6 0.0 0.0
IR1E FLAG LOCAL REV INDIVID TUITION 56 55 1 0 0 98.2 1.8 0.0 0.0
IR1F FLAG LOCAL REV TUITION FR LEA’S 56 56 0 0 0 100.0 0.0 0.0 0.0
IR1G FLAG LOCAL REV TRANSPORT FEES INDIV 56 56 0 0 0 100.0 0.0 0.0 0.0
IR1H FLAG LOCAL REV TRANSPORT FEES LEA’S 56 56 0 0 0 100.0 0.0 0.0 0.0
IR1I FLAG LOCAL REV EARNINGS ON INVESTMT 56 56 0 0 0 100.0 0.0 0.0 0.0
IR1J FLAG LOCAL REV FOOD SERVICE 56 56 0 0 0 100.0 0.0 0.0 0.0
IR1K FLAG LOCAL REV STUDENT ACTIVITIES 56 56 0 0 0 100.0 0.0 0.0 0.0
IR1L FLAG LOCAL REV OTHER REVS 56 55 1 0 0 98.2 1.8 0.0 0.0
IR1M FLAG LOCAL REV TEXTBOOK REVS 56 56 0 0 0 100.0 0.0 0.0 0.0
IR1N FLAG LOCAL REV SUMMER SCHOOL 56 54 2 0 0 96.4 3.6 0.0 0.0
ISTR1 FLAG LOCAL REV SUBTOTAL 56 56 0 0 0 100.0 0.0 0.0 0.0
IR2 FLAG INTERMED REVENUES 56 56 0 0 0 100.0 0.0 0.0 0.0
IR3 FLAG STATE REVENUES 56 56 0 0 0 100.0 0.0 0.0 0.0
IR4A FLAG FED REV DIRECT GRANTS 56 55 1 0 0 98.2 1.8 0.0 0.0
IR4B FLAG FED REV THRU STATE 56 55 1 0 0 98.2 1.8 0.0 0.0
IR4C FLAG FED REV THRU INTERMED AGENCIES 56 55 1 0 0 98.2 1.8 0.0 0.0
IR4D FLAG FED REV OTHER SOURCES 56 55 1 0 0 98.2 1.8 0.0 0.0
ISTR4 FLAG FED REV SUBTOTAL 56 56 0 0 0 100.0 0.0 0.0 0.0
IR5 FLAG REV FR OTHER SOURCES 56 55 0 1 0 98.2 0.0 1.8 0.0
ITR FLAG TOTAL REVENUE FROM ALL SOURCES 56 56 0 0 0 100.0 0.0 0.0 0.0
IE11 FLAG INSTR EXP SALARIES 56 41 15 0 0 73.2 26.8 0.0 0.0
IE12 FLAG INSTR EXP EMP BENEFITS 56 37 19 0 0 66.1 33.9 0.0 0.0
IE13 FLAG INSTR EXP PURCHASED SERVICES 56 40 16 0 0 71.4 28.6 0.0 0.0
IE14 FLAG INSTR EXP TUITION 56 55 1 0 0 98.2 1.8 0.0 0.0
IE15 FLAG INSTR EXP TUIT TO OTHER LEA’S 56 55 1 0 0 98.2 1.8 0.0 0.0
IE16 FLAG INSTR EXP SUPPLIES 56 41 15 0 0 73.2 26.8 0.0 0.0
IE17 FLAG INSTR EXP PROPERTY 56 53 3 0 0 94.6 5.4 0.0 0.0
IE18 FLAG INSTR EXP OTHER 56 40 16 0 0 71.4 28.6 0.0 0.0
ISTE1 FLAG INSTR EXP SUBTOTAL 56 36 0 0 20 64.3 0.0 0.0 35.7
IE11A FLAG INSTR EXP REGULAR PROGRAM SALARIES 56 54 2 0 0 96.4 3.6 0.0 0.0
IE11B FLAG INSTR EXP SPECIAL EDUCATION SALARIES 56 54 2 0 0 96.4 3.6 0.0 0.0
IE11C FLAG INSTR EXP VOCATIONAL SALARIES 56 52 4 0 0 92.9 7.1 0.0 0.0
IE11D FLAG INSTR EXP OTHER PROGRAMS SALARIES 56 53 3 0 0 94.6 5.4 0.0 0.0
IE2 FLAG INSTR EXP TEXTBOOKS 56 45 11 0 0 80.4 19.6 0.0 0.0
IE212 FLAG SUP EXP SALARY STUDENTS 56 42 14 0 0 75.0 25.0 0.0 0.0
IE213 FLAG SUP EXP SALARY INST STAFF 56 42 14 0 0 75.0 25.0 0.0 0.0
IE214 FLAG SUP EXP SALARY GEN ADMIN 56 42 14 0 0 75.0 25.0 0.0 0.0
IE215 FLAG SUP EXP SALARY SCH ADMIN 56 42 14 0 0 75.0 25.0 0.0 0.0
IE216 FLAG SUP EXP SALARY OPER & MAIN 56 42 14 0 0 75.0 25.0 0.0 0.0
IE217 FLAG SUP EXP SALARY STUDENT TRANSP 56 41 15 0 0 73.2 26.8 0.0 0.0
IE218 FLAG SUP EXP SALARY OTHER SERVICES 56 42 14 0 0 75.0 25.0 0.0 0.0
ITE21 FLAG SUP EXP SALARY SUBTOTAL 56 41 0 0 15 73.2 0.0 0.0 26.8
IE222 FLAG SUP EXP EMP BENE STUDENTS 56 37 19 0 0 66.1 33.9 0.0 0.0
IE223 FLAG SUP EXP EMP BENE INST STAFF 56 37 19 0 0 66.1 33.9 0.0 0.0
IE224 FLAG SUP EXP EMP BENE GEN ADMIN 56 39 17 0 0 69.6 30.4 0.0 0.0
IE225 FLAG SUP EXP EMP BENE SCH ADMIN 56 38 18 0 0 67.9 32.1 0.0 0.0
IE226 FLAG SUP EXP EMP BENE OPER & MAIN 56 40 16 0 0 71.4 28.6 0.0 0.0
IE227 FLAG SUP EXP EMP BENE PUPIL TRANSP 56 39 17 0 0 69.6 30.4 0.0 0.0
IE228 FLAG SUP EXP EMP BENE OTHER SERV 56 39 17 0 0 69.6 30.4 0.0 0.0
ITE22 FLAG SUP EXP EMP BENE SUBTOTAL 56 36 0 0 20 64.3 0.0 0.0 35.7
IE232 FLAG SUP EXP PURCH SV STUDENTS 56 42 14 0 0 75.0 25.0 0.0 0.0
IE233 FLAG SUP EXP PURCH SV INST STAFF 56 42 14 0 0 75.0 25.0 0.0 0.0
IE234 FLAG SUP EXP PURCH SV GEN ADMIN 56 42 14 0 0 75.0 25.0 0.0 0.0
See notes at end of table.
Number Percent
Flags Flags
G-2
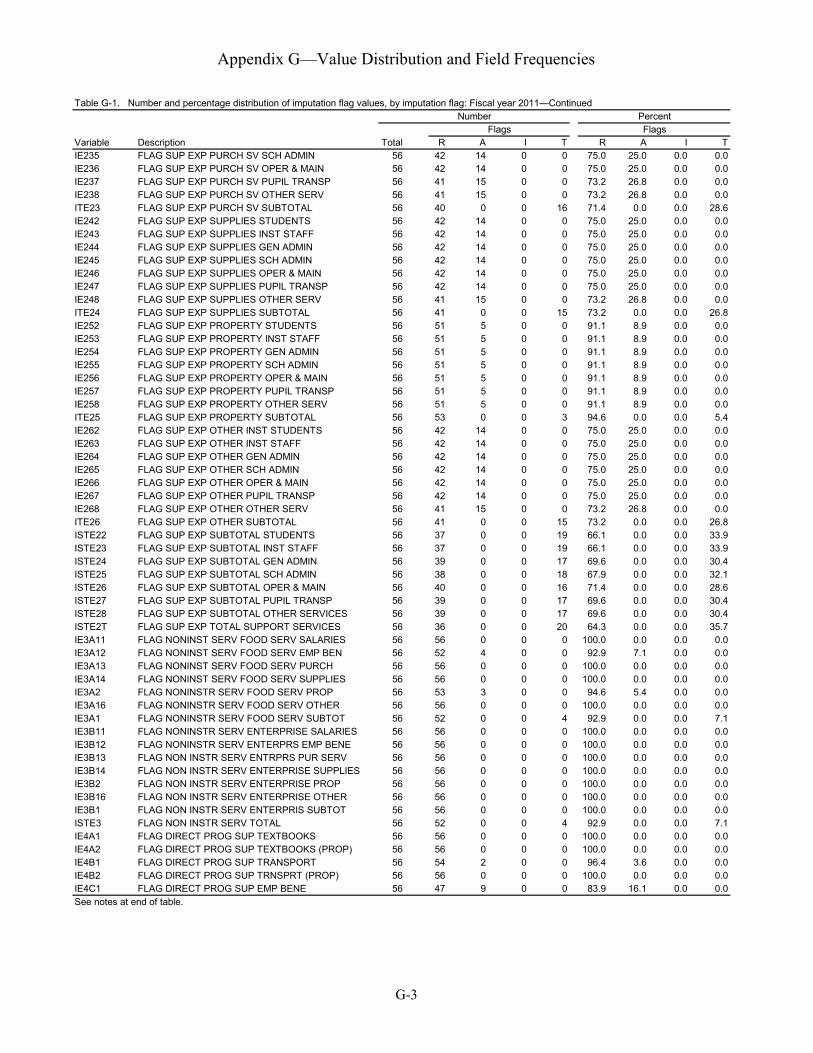
Appendix G—Value Distribution and Field Frequencies
Table G-1. Number and percentage distribution of imputation flag values, by imputation flag: Fiscal year 2011—Continued
Variable Description Total R A I T R A I T
IE235 FLAG SUP EXP PURCH SV SCH ADMIN 56 42 14 0 0 75.0 25.0 0.0 0.0
IE236 FLAG SUP EXP PURCH SV OPER & MAIN 56 42 14 0 0 75.0 25.0 0.0 0.0
IE237 FLAG SUP EXP PURCH SV PUPIL TRANSP 56 41 15 0 0 73.2 26.8 0.0 0.0
IE238 FLAG SUP EXP PURCH SV OTHER SERV 56 41 15 0 0 73.2 26.8 0.0 0.0
ITE23 FLAG SUP EXP PURCH SV SUBTOTAL 56 40 0 0 16 71.4 0.0 0.0 28.6
IE242 FLAG SUP EXP SUPPLIES STUDENTS 56 42 14 0 0 75.0 25.0 0.0 0.0
IE243 FLAG SUP EXP SUPPLIES INST STAFF 56 42 14 0 0 75.0 25.0 0.0 0.0
IE244 FLAG SUP EXP SUPPLIES GEN ADMIN 56 42 14 0 0 75.0 25.0 0.0 0.0
IE245 FLAG SUP EXP SUPPLIES SCH ADMIN 56 42 14 0 0 75.0 25.0 0.0 0.0
IE246 FLAG SUP EXP SUPPLIES OPER & MAIN 56 42 14 0 0 75.0 25.0 0.0 0.0
IE247 FLAG SUP EXP SUPPLIES PUPIL TRANSP 56 42 14 0 0 75.0 25.0 0.0 0.0
IE248 FLAG SUP EXP SUPPLIES OTHER SERV 56 41 15 0 0 73.2 26.8 0.0 0.0
ITE24 FLAG SUP EXP SUPPLIES SUBTOTAL 56 41 0 0 15 73.2 0.0 0.0 26.8
IE252 FLAG SUP EXP PROPERTY STUDENTS 56 51 5 0 0 91.1 8.9 0.0 0.0
IE253 FLAG SUP EXP PROPERTY INST STAFF 56 51 5 0 0 91.1 8.9 0.0 0.0
IE254 FLAG SUP EXP PROPERTY GEN ADMIN 56 51 5 0 0 91.1 8.9 0.0 0.0
IE255 FLAG SUP EXP PROPERTY SCH ADMIN 56 51 5 0 0 91.1 8.9 0.0 0.0
IE256 FLAG SUP EXP PROPERTY OPER & MAIN 56 51 5 0 0 91.1 8.9 0.0 0.0
IE257 FLAG SUP EXP PROPERTY PUPIL TRANSP 56 51 5 0 0 91.1 8.9 0.0 0.0
IE258 FLAG SUP EXP PROPERTY OTHER SERV 56 51 5 0 0 91.1 8.9 0.0 0.0
ITE25 FLAG SUP EXP PROPERTY SUBTOTAL 56 53 0 0 3 94.6 0.0 0.0 5.4
IE262 FLAG SUP EXP OTHER INST STUDENTS 56 42 14 0 0 75.0 25.0 0.0 0.0
IE263 FLAG SUP EXP OTHER INST STAFF 56 42 14 0 0 75.0 25.0 0.0 0.0
IE264 FLAG SUP EXP OTHER GEN ADMIN 56 42 14 0 0 75.0 25.0 0.0 0.0
IE265 FLAG SUP EXP OTHER SCH ADMIN 56 42 14 0 0 75.0 25.0 0.0 0.0
IE266 FLAG SUP EXP OTHER OPER & MAIN 56 42 14 0 0 75.0 25.0 0.0 0.0
IE267 FLAG SUP EXP OTHER PUPIL TRANSP 56 42 14 0 0 75.0 25.0 0.0 0.0
IE268 FLAG SUP EXP OTHER OTHER SERV 56 41 15 0 0 73.2 26.8 0.0 0.0
ITE26 FLAG SUP EXP OTHER SUBTOTAL 56 41 0 0 15 73.2 0.0 0.0 26.8
ISTE22 FLAG SUP EXP SUBTOTAL STUDENTS 56 37 0 0 19 66.1 0.0 0.0 33.9
ISTE23 FLAG SUP EXP SUBTOTAL INST STAFF 56 37 0 0 19 66.1 0.0 0.0 33.9
ISTE24 FLAG SUP EXP SUBTOTAL GEN ADMIN 56 39 0 0 17 69.6 0.0 0.0 30.4
ISTE25 FLAG SUP EXP SUBTOTAL SCH ADMIN 56 38 0 0 18 67.9 0.0 0.0 32.1
ISTE26 FLAG SUP EXP SUBTOTAL OPER & MAIN 56 40 0 0 16 71.4 0.0 0.0 28.6
ISTE27 FLAG SUP EXP SUBTOTAL PUPIL TRANSP 56 39 0 0 17 69.6 0.0 0.0 30.4
ISTE28 FLAG SUP EXP SUBTOTAL OTHER SERVICES 56 39 0 0 17 69.6 0.0 0.0 30.4
ISTE2T FLAG SUP EXP TOTAL SUPPORT SERVICES 56 36 0 0 20 64.3 0.0 0.0 35.7
IE3A11 FLAG NONINST SERV FOOD SERV SALARIES 56 56 0 0 0 100.0 0.0 0.0 0.0
IE3A12 FLAG NONINST SERV FOOD SERV EMP BEN 56 52 4 0 0 92.9 7.1 0.0 0.0
IE3A13 FLAG NONINST SERV FOOD SERV PURCH 56 56 0 0 0 100.0 0.0 0.0 0.0
IE3A14 FLAG NONINST SERV FOOD SERV SUPPLIES 56 56 0 0 0 100.0 0.0 0.0 0.0
IE3A2 FLAG NONINSTR SERV FOOD SERV PROP 56 53 3 0 0 94.6 5.4 0.0 0.0
IE3A16 FLAG NONINSTR SERV FOOD SERV OTHER 56 56 0 0 0 100.0 0.0 0.0 0.0
IE3A1 FLAG NONINSTR SERV FOOD SERV SUBTOT 56 52 0 0 4 92.9 0.0 0.0 7.1
IE3B11 FLAG NONINSTR SERV ENTERPRISE SALARIES 56 56 0 0 0 100.0 0.0 0.0 0.0
IE3B12 FLAG NONINSTR SERV ENTERPRS EMP BENE 56 56 0 0 0 100.0 0.0 0.0 0.0
IE3B13 FLAG NON INSTR SERV ENTRPRS PUR SERV 56 56 0 0 0 100.0 0.0 0.0 0.0
IE3B14 FLAG NON INSTR SERV ENTERPRISE SUPPLIES 56 56 0 0 0 100.0 0.0 0.0 0.0
IE3B2 FLAG NON INSTR SERV ENTERPRISE PROP 56 56 0 0 0 100.0 0.0 0.0 0.0
IE3B16 FLAG NON INSTR SERV ENTERPRISE OTHER 56 56 0 0 0 100.0 0.0 0.0 0.0
IE3B1 FLAG NON INSTR SERV ENTERPRIS SUBTOT 56 56 0 0 0 100.0 0.0 0.0 0.0
ISTE3 FLAG NON INSTR SERV TOTAL 56 52 0 0 4 92.9 0.0 0.0 7.1
IE4A1 FLAG DIRECT PROG SUP TEXTBOOKS 56 56 0 0 0 100.0 0.0 0.0 0.0
IE4A2 FLAG DIRECT PROG SUP TEXTBOOKS (PROP) 56 56 0 0 0 100.0 0.0 0.0 0.0
IE4B1 FLAG DIRECT PROG SUP TRANSPORT 56 54 2 0 0 96.4 3.6 0.0 0.0
IE4B2 FLAG DIRECT PROG SUP TRNSPRT (PROP) 56 56 0 0 0 100.0 0.0 0.0 0.0
IE4C1 FLAG DIRECT PROG SUP EMP BENE 56 47 9 0 0 83.9 16.1 0.0 0.0
See notes at end of table.
Flags Flags
Number Percent
G-3

Appendix G—Value Distribution and Field Frequencies
Table G-1. Number and percentage distribution of imputation flag values, by imputation flag: Fiscal year 2011—Continued
Variable Description Total R A I T R A I T
IE4C2 FLAG DIRECT PROG SUP EMP BEN (PROP) 56 56 0 0 0 100.0 0.0 0.0 0.0
IE4D FLAG DIRECT PROG SUP PRIV SCH STUDNT 56 56 0 0 0 100.0 0.0 0.0 0.0
IE4E1 FLAG DIRECT PROG SUP OTHER 56 41 15 0 0 73.2 26.8 0.0 0.0
IE4E2 FLAG DIRECT PROG SUP OTHER (PROPERTY) 56 53 3 0 0 94.6 5.4 0.0 0.0
ISTE4 FLAG DIRECT PROG SUP SUBTOTAL 56 36 0 0 20 64.3 0.0 0.0 35.7
ITE5 FLAG CURRENT EXPENDITURES 56 43 0 0 13 76.8 0.0 0.0 23.2
IE61 FLAG FACILITIES AQUIS NONPROPERTY 56 48 8 0 0 85.7 14.3 0.0 0.0
IE62 FLAG FACILITIES AQUIS PROP (LAND/BLDS) 56 47 9 0 0 83.9 16.1 0.0 0.0
IE63 FLAG FACILITIES AQUIS EQUIPMENT 56 50 6 0 0 89.3 10.7 0.0 0.0
ISTE6 FLAG FACILITIES AQUIS TOTAL 56 56 0 0 0 100.0 0.0 0.0 0.0
IE7A1 FLAG OTHER USE DEBT SERVICE INTEREST 56 56 0 0 0 100.0 0.0 0.0 0.0
IE7A2 FLAG OTHER USE REDEMPTION 56 56 0 0 0 100.0 0.0 0.0 0.0
ISTE7 FLAG OTHER USE DEBT SERV SUBTOTAL 56 56 0 0 0 100.0 0.0 0.0 0.0
IE81 FLAG COMM SERV NONPROPERTY 56 53 1 2 0 94.6 1.8 3.6 0.0
IE82 FLAG COMM SERV PROPERTY 56 54 1 1 0 96.4 1.8 1.8 0.0
IE9A FLAG DIRECT COST PROG NONPUB SCH 56 56 0 0 0 100.0 0.0 0.0 0.0
IE9B FLAG DIRECT COST PROG ADULT ED 56 56 0 0 0 100.0 0.0 0.0 0.0
IE9C FLAG DIRECT COST PROG COMM COLLEGE 56 56 0 0 0 100.0 0.0 0.0 0.0
IE9D FLAG DIRECT COST PROG OTHER 56 56 0 0 0 100.0 0.0 0.0 0.0
IE91 FLAG DIRECT COST PROG PROPERTY 56 56 0 0 0 100.0 0.0 0.0 0.0
ISTE9 FLAG DIRECT COST PROG SUBTOTAL 56 56 0 0 0 100.0 0.0 0.0 0.0
ITE10 FLAG PROPERTY TOTAL 56 47 0 0 9 83.9 0.0 0.0 16.1
ITE11 FLAG TOTAL EXPENDITURES FOR EDUCATION 56 43 0 0 13 76.8 0.0 0.0 23.2
IX12C FLAG EXCLUS FOR PL 100 297 TITLE I 56 56 0 0 0 100.0 0.0 0.0 0.0
IX12D FLAG EXCLUS FOR PL 100 297 TITLE I CO 56 56 0 0 0 100.0 0.0 0.0 0.0
IX12E FLAG EXCLUS FOR PL 100 297 TITLE V PART A 56 56 0 0 0 100.0 0.0 0.0 0.0
IX12F FLAG EXCLUS FOR PL 100 297 TITLE V PART A CO 56 56 0 0 0 100.0 0.0 0.0 0.0
ITX12 FLAG TOTAL EXCLUS FOR PL 100 297 56 55 0 0 1 98.2 0.0 0.0 1.8
INCE13 FLAG NET CURRENT EXPENDITURES 56 43 0 0 13 76.8 0.0 0.0 23.2
IADA FLAG ADA (STATE AND NCES DEFINITION) 56 56 0 0 0 100.0 0.0 0.0 0.0
IA14A FLAG ADA (STATE DEFINITION) 56 56 0 0 0 100.0 0.0 0.0 0.0
IA14B FLAG ADA (NCES DEFINITION) 56 56 0 0 0 100.0 0.0 0.0 0.0
IPPE15 FLAG PER PUPIL EXPENDITURES 56 54 0 0 2 96.4 0.0 0.0 3.6
IMEMBR10 FLAG TOTAL STUDENT 56 51 5 0 0 91.1 8.9 0.0 0.0
IARRASTE1 FLAG INSTRUCTIONAL EXP FROM ARRA 56 55 1 0 0 98.2 1.8 0.0 0.0
IARRATE5 FLAG TOTAL CURRENT EXP FROM ARRA 56 55 1 0 0 98.2 1.8 0.0 0.0
IARRAE81Z FLAG COMM SERV NONPROPERTY FROM ARRA 56 56 0 0 0 100.0 0.0 0.0 0.0
IARRATE10 FLAG PROPERTY EXP FROM ARRA 56 56 0 0 0 100.0 0.0 0.0 0.0
IARRASTE6 FLAG SCHOOL CONSTRUCTION EXP FROM ARRA 56 56 0 0 0 100.0 0.0 0.0 0.0
IARRATLEIZ FLAG EXP FROM TITLE I UNDER ARRA 56 55 1 0 0 98.2 1.8 0.0 0.0
IARRASTE4 FLAG DIRECT PROG SUP EXP FROM ARRA 56 56 0 0 0 100.0 0.0 0.0 0.0
Flags
SOURCE: U.S. Department of Education, National Center for Education Statistics, Common Core of Data (CCD), "National Public Education Finance
Survey (NPEFS)," Fiscal year 2011, preliminary version 1a file.
Number Percent
Flags
NOTE: Detail may not sum to totals because of rounding. Flag "R" denotes "As reported by the state." Flag "A" denotes "Edited." Flag "I" denotes "Imputed
based on a method other than prior year's data." Flag "T" denotes "Total based on sum of internal or external detail."
G-4

Appendix G—Value Distribution and Field Frequencies
Table G-2. Minimum, maximum, and mean for continuous variables, by variable: Fiscal year 2011
Variable Description
Number of
states
reporting Missing
Not
applicable Minimum Maximum Mean
R1A LOCAL REV PROPERTY TAX 40 0 16 1,276,311 20,382,781,762 4,268,754,905
R1BLOCAL REV NON PROPERTY TAX
31 0 25 5,391 1,810,806,318 358,088,864
R1C LOCAL REV LOC GOVT PROP TAX 22 0 34 168,400 10,086,390,209 1,859,145,212
R1D LOCAL REV LOC GOVT NON PROP TAX 24 0 32 470,068 3,114,621,967 382,745,506
R1E LOCAL REV INDIVID TUITION 56 0 0 0 121,234,526 16,644,276
R1F LOCAL REV TUITION FR LEA'S 56 0 0 0 2,081,187,421 123,028,886
R1G LOCAL REV TRANSPORT FEES INDIVID 56 0 0 0 18,216,201 1,769,177
R1H LOCAL REV TRANSPORT FEES LEA'S 56 0 0 0 186,544,220 6,259,776
R1I LOCAL REV EARNINGS ON INVESTMT 56 0 0 0 347,874,973 26,427,054
R1J LOCAL REV FOOD SERVICE 56 0 0 0 642,806,284 115,587,521
R1K LOCAL REV STUDENT ACTIVITIES 56 0 0 0 626,838,780 71,698,562
R1L LOCAL REV OTHER REVS 56 0 0 0 2,615,474,811 273,159,723
R1M LOCAL REV TEXTBOOK REVS 56 0 0 0 98,522,952 3,670,810
R1N LOCAL REV SUMMER SCHOOL 56 0 0 0 21,687,769 1,992,419
STR1 LOCAL REV SUBTOTAL 56 0 0 0 28,782,462,334 4,652,700,216
R2 INTERMED REVENUES 56 0 0 0 289,716,374 32,200,842
R3 STATE REVENUES 53 0 3 10688929 38,411,424,501 5,078,411,643
R4A FED REV DIRECT GRANTS 56 0 0 0 550,434,842 68,213,869
R4B FED REV THRU STATE 56 0 0 28,776,226 8,532,994,204 1,267,049,509
R4C FED REV THRU INTERMED AGENCIES 56 0 0 0 125,348,388 12,711,492
R4D FED REV OTHER SOURCES 56 0 0 0 251,800,112 31,326,610
STR4 FED REV SUBTOTAL 56 0 0 44,858,422 9,248,710,447 1,379,301,479
R5 REV FR OTHER SOURCES 56 0 0 0 7,465,153,012 712,608,820
TR TOTAL REVENUE FROM ALL SOURCES 56 0 0 82,920,876 67,864,061,951 10,870,556,414
E11 INSTR EXP SALARIES 56 0 0 20,733,960 22,874,871,130 3,823,295,372
E12 INSTR EXP EMP BENEFITS 56 0 0 3,592,946 10,225,653,869 1,348,723,412
E13 INSTR EXP PURCHASED SERVICES 56 0 0 563,123 2,196,960,384 265,487,655
E14 INSTR EXP TUITION 56 0 0 0 762,253,550 89,075,046
E15 INSTR EXP TUITION TO OTHER LEA'S 56 0 0 0 2,189,146,086 132,468,375
E16 INSTR EXP SUPPLIES 56 0 0 75,126 1,602,088,175 237,706,419
E17 INSTR EXP PROPERTY 56 0 0 0 171,552,974 40,867,156
E18 INSTR EXP OTHER 56 0 0 0 237,090,236 26,411,178
STE1 INSTR EXP SUBTOTAL 56 0 0 32,770,069 35,992,425,607 5,790,699,082
E11A INSTR EXP REGULAR PROGRAM SALARIES 54 2 0 14115834 16,561,534,321 2,405,628,057
E11B INSTR EXP SPECIAL EDUCATION SALARIES 54 2 0 1093567 5,544,289,000 575,439,958
E11C INSTR EXP VOCATIONAL SALARIES 52 4 0 111901 933,723,000 101,397,162
E11D INSTR EXP OTHER PROGRAMS SALARIES 53 3 0 1757 937,289,788 145,782,097
E2 INSTR EXP TEXTBOOKS 45 11 0 486734 319,965,605 51,726,787
E212 SUP EXP SALARY STUDENTS 56 0 0 48,910 1,997,477,161 347,423,963
E213 SUP EXP SALARY INST STAFF 56 0 0 1,865,900 1,999,831,271 260,723,051
E214 SUP EXP SALARY GEN ADMIN 56 0 0 340,643 399,317,931 80,474,243
E215 SUP EXP SALARY SCH ADMIN 56 0 0 2,939,245 2,622,872,760 362,723,696
E216 SUP EXP SALARY OPER & MAIN 56 0 0 473,363 2,157,945,202 315,891,243
E217 SUP EXP SALARY STUDENT TRANSP 56 0 0 0 642,580,266 134,959,596
E218 SUP EXP SALARY OTHER SERVICES 56 0 0 334,984 1,322,252,625 147,330,964
TE21 SUP EXP SALARY SUBTOTAL 56 0 0 8,233,614 10,896,954,498 1,649,526,757
E222 SUP EXP EMP BENE STUDENTS 56 0 0 10,469 671,295,140 117,086,858
E223 SUP EXP EMP BENE INST STAFF 56 0 0 325,524 682,006,424 88,451,763
E224 SUP EXP EMP BENE GEN ADMIN 56 0 0 66,681 265,131,041 33,811,927
E225 SUP EXP EMP BENE SCH ADMIN 56 0 0 550,795 944,582,251 124,454,340
E226 SUP EXP EMP BENE OPER & MAIN 56 0 0 86,339 960,983,902 128,724,074
E227 SUP EXP EMP BENE PUPIL TRANS 56 0 0 0 263,181,729 55,995,903
E228 SUP EXP EMP BENE OTHER SERV 56 0 0 97,142 584,480,431 58,535,529
TE22 SUP EXP EMP BENE SUBTOTAL 56 0 0 1,680,374 4,193,193,805 607,060,394
E232 SUP EXP PURCH SV STUDENTS 56 0 0 108,116 301,391,843 48,506,839
E233 SUP EXP PURCH SV INST STAFF 56 0 0 275,415 646,626,684 63,981,693
E234 SUP EXP PURCH SV GEN ADMIN 56 0 0 340,039 350,379,641 58,914,291
E235 SUP EXP PURCH SV SCH ADMIN 56 0 0 0 169,798,416 16,658,285
E236 SUP EXP PURCH SV OPER & MAIN 56 0 0 994,467 1,601,592,142 243,719,662
E237 SUP EXP PURCH SV PUPIL TRANSP 56 0 0 1,369 1,794,877,618 164,994,114
E238 SUP EXP PURCH SV OTHER SERV 56 0 0 21,223 449,642,325 69,411,340
TE23 SUP EXP PURCH SV SUBTOTAL 56 0 0 4,844,196 4,382,139,174 666,186,225
G-5

Appendix G—Value Distribution and Field Frequencies
Table G-2. Minimum, maximum, and mean for continuous variables, by variable: Fiscal year 2011—Continued
Variable Description
Number of
states
reporting Missing
Not
applicable Minimum Maximum Mean
E242 SUP EXP SUPPLIES STUDENTS 56 0 0 76,529 62,970,838 9,455,555
E243 SUP EXP SUPPLIES INST STAFF 56 0 0 59,725 201,538,415 32,397,083
E244 SUP EXP SUPPLIES GEN ADMIN 56 0 0 47,296 20,190,591 4,203,884
E245 SUP EXP SUPPLIES SCH ADMIN 56 0 0 0 72,643,476 7,828,535
E246 SUP EXP SUPPLIES OPER & MAIN 56 0 0 252,351 1,797,800,949 207,518,424
E247 SUP EXP SUPPLIES PUPIL TRANSP 56 0 0 0 219,671,562 41,447,253
E248 SUP EXP SUPPLIES OTHER SERV 56 0 0 5,155 113,382,569 15,662,498
TE24 SUP EXP SUPPLIES SUBTOTAL 56 0 0 1,403,397 2,448,390,745 318,513,233
E252 SUP EXP PROPERTY STUDENTS 56 0 0 480 36,840,515 2,065,093
E253 SUP EXP PROPERTY INST STAFF 56 0 0 0 129,663,209 13,344,452
E254 SUP EXP PROPERTY GEN ADMIN 56 0 0 0 9,732,236 1,394,259
E255 SUP EXP PROPERTY SCH ADMIN 56 0 0 1,648 8,422,785 1,446,109
E256 SUP EXP PROPERTY OPER & MAIN 56 0 0 25,371 191,536,870 18,183,481
E257 SUP EXP PROPERTY PUPIL TRANSP 56 0 0 0 119,690,338 22,237,556
E258 SUP EXP PROPERTY OTHER SERV 56 0 0 0 49,821,925 10,586,232
TE25 SUP EXP PROPERTY SUBTOTAL 56 0 0 94,429 348,940,429 69,257,182
E262 SUP EXP OTHER STUDENTS 56 0 0 0 167,051,882 6,756,694
E263 SUP EXP OTHER INST STAFF 56 0 0 0 44,734,036 4,213,905
E264 SUP EXP OTHER GEN ADMIN 56 0 0 0 126,548,417 16,082,312
E265 SUP EXP OTHER SCH ADMIN 56 0 0 0 32,795,486 2,456,962
E266 SUP EXP OTHER OPER & MAIN 56 0 0 0 145,394,016 8,542,961
E267 SUP EXP OTHER PUPIL TRANSP 56 0 0 0 76,782,709 3,384,485
E268 SUP EXP OTHER OTHER SERV 56 0 0 0 222,644,429 21,873,606
TE26 SUP EXP OTHER SUBTOTAL 56 0 0 1,286,210 335,305,880 63,310,924
STE22 SUP EXP SUBTOTAL STUDENTS 56 0 0 534,648 3,004,958,047 529,229,910
STE23 SUP EXP SUBTOTAL INST STAFF 56 0 0 4,847,653 3,499,992,071 449,767,495
STE24 SUP EXP SUBTOTAL GEN ADMIN 56 0 0 2,088,645 999,731,685 193,486,658
STE25 SUP EXP SUBTOTAL SCH ADMIN 56 0 0 4,383,543 3,811,665,826 514,121,818
STE26 SUP EXP SUBTOTAL OPER & MAIN 56 0 0 4,803,400 5,695,223,483 904,396,365
STE27 SUP EXP SUBTOTAL PUPIL TRANSP 56 0 0 1,014,000 2,686,652,047 400,781,351
STE28 SUP EXP SUBTOTAL OTHER SERV 56 0 0 1,176,122 2,462,741,903 312,813,937
STE2T SUP EXP TOTAL SUPPORT SERVICES 56 0 0 22,937,712 20,417,013,870 3,304,597,534
E3A11 NONINST SERV FOOD SERV SALARIES 56 0 0 251,056 734,050,457 117,478,463
E3A12 NONINST SERV FOOD SERV EMP BENE 56 0 0 47,620 330,592,066 45,093,138
E3A13 NONINST SERV FOOD SERV PURCH SERV 56 0 0 0 222,578,291 38,325,241
E3A14 NONINST SERV FOOD SERV SUPPLIES 56 0 0 89,286 1,139,782,640 164,811,060
E3A2 NONINSTR SERV FOOD SERV PROPERTY 56 0 0 0 38,603,064 5,643,161
E3A16 NONINSTR SERV FOOD SERV OTHER 56 0 0 0 33,807,605 4,406,088
E3A1 NONINSTR SERV FOOD SERV SUBTOTAL 56 0 0 8,553,781 2,333,727,542 370,113,990
E3B11 NONINSTR SERV ENTERPRISE SALARIES 56 0 0 0 76,063,231 6,039,424
E3B12 NONINSTR SERV ENTERPRISE EMP BENE 56 0 0 0 33,485,259 1,733,264
E3B13 NONINSTR SERV ENTERPRISE PURCH SERV 56 0 0 0 79,079,648 4,495,003
E3B14 NONINSTR SERV ENTERPRISE SUPPLIES 56 0 0 0 112,202,202 6,457,357
E3B2 NONINSTR SERV ENTERPRISE PROPERTY 56 0 0 0 15,438,141 751,835
E3B16 NONINSTR SERV ENTERPRISE OTHER 56 0 0 0 121,003,889 3,805,936
E3B1 NONINSTR SERV ENTERPRISE SUBTOTAL 56 0 0 0 260,242,945 22,530,984
STE3 NONINSTR SERV TOTAL 56 0 0 8,553,781 2,430,211,495 392,644,974
E4A1 DIRECT PROG SUP TEXTBOOKS 56 0 0 0 0 0
E4A2 DIRECT PROG SUP TEXTBOOKS 9 PROP 56 0 0 0 0 0
E4B1 DIRECT PROG SUP TRANSPORT 56 0 0 0 0 0
E4B2 DIRECT PROG SUP TRANSPORT (PROP) 56 0 0 0 0 0
E4C1 DIRECT PROG SUP EMP BENE 56 0 0 0 0 0
E4C2 DIRECT PROG SUP EMP BENE (PROP) 56 0 0 0 0 0
E4D DIRECT PROG SUP PRIV SCH STUDENT 56 0 0 0 2,319,586,587 48,520,826
E4E1 DIRECT PROG SUP OTHER 56 0 0 0 0 0
E4E2 DIRECT PROG SUP OTHER (PROPERTY) 56 0 0 0 0 0
STE4 DIRECT PROG SUP SUBTOTAL 56 0 0 0 0 0
TE5 CURRENT EXPENDITURES 56 0 0 75,354,820 57,526,834,875 9,487,941,591
E61 FACILITIES AQUIS NONPROPERTY 56 0 0 0 6,005,034,607 689,978,227
E62 FACILITIES AQUIS PROP (LAND & BLDS) 56 0 0 0 308,740,508 62,231,646
E63 FACILITIES AQUI PROP (EQUIPMENT) 56 0 0 0 328,264,522 41,810,637
STE6 FACILITIES AQUIS NONPROP & PROP TOTAL 56 0 0 0 6,495,019,463 794,020,511
G-6

Appendix G—Value Distribution and Field Frequencies
Table G-2. Minimum, maximum, and mean for continuous variables, by variable: Fiscal year 2011—Continued
Variable Description
Number of
states
reporting Missing
Not
applicable Minimum Maximum Mean
E7A1 OTHER USE DEBT SERVICE INTEREST 56 0 0 0 2,953,783,375 320,309,796
E7A2 OTHER USE DEBT SERV REDEMPTION 56 0 0 0 2,811,725,865 473,994,774
STE7 OTHER USE DEBT SERV SUBTOTAL 56 0 0 0 4,952,570,405 794,304,570
E81 COMM SERV NONPROPERTY 56 0 0 0 404,184,330 58,851,127
E82 COMM SERV PROPERTY 56 0 0 0 14,803,674 730,357
E9A DIRECT COST PROG NONPUB SCH 56 0 0 0 444,153,292 19,065,791
E9B DIRECT COST PROG ADULT ED 56 0 0 0 534,161,118 36,393,046
E9C DIRECT COST PROG COMM COLLEGE 56 0 0 0 33,009,950 607,953
E9D DIRECT COST PROG OTHER 56 0 0 0 1,295,350,871 25,745,405
E91 DIRECT COST PROG PROPERTY 56 0 0 0 16,546,559 697,410
STE9 DIRECT COST PROG SUBTOTAL 56 0 0 0 2,019,180,258 81,812,194
TE10 PROPERTY TOTAL 56 0 0 94,429 967,239,329 221,989,384
TE11 TOTAL EXPENDITURES FOR EDUCATION 56 0 0 84,478,314 65,228,879,578 10,540,572,523
X12C EXCLUS FOR PL 100 297 TITLE I 56 0 0 0 1,982,449,744 262,153,262
X12D EXCLUS FOR PL 100 297 TITLE I CARRYOVER 56 0 0 0 536,431,066 50,028,252
X12E EXCLUS FOR PL 100 297 TITLE V 56 0 0 0 22,190,490 461,598
X12F EXCLUS FOR PL 100 297 TITLE V PART A CARRYOVER 56 0 0 0 44,514,025 1,318,972
TX12 TOTAL EXCLUS FOR PL 100 297 56 0 0 6,713,817 2,964,671,887 525,324,849
NCE13 NET CURRENT EXPENDITURES 56 0 0 67,383,355 54,562,162,988 8,962,616,742
PPE15 PER PUPIL EXPENDITURES 56 0 0 4,361 20,532 10,995
ARRASTE1 INSTRUCTIONAL EXP FROM ARRA 56 0 0 0 1,755,242,704 270,085,291
ARRATE5 TOTAL CURRENT EXP FROM ARRA 56 0 0 0 2,671,310,060 377,317,785
ARRAE81Z COMM SERV NONPROPERTY FROM ARRA 56 0 0 0 68,807,535 2,984,212
ARRATE10 PROPERTY EXP FROM ARRA 56 0 0 0 84,492,791 12,513,638
ARRASTE6 SCHOOL CONSTRUCTION EXP FROM ARRA 56 0 0 0 191,871,059 8,344,031
ARRATLEIZ EXP FROM TITLE I UNDER ARRA 56 0 0 0 637,010,444 84,001,059
ARRASTE4 DIRECT PROG SUP EXP FROM ARRA 56 0 0 0 13,107,388 656,759
ADA ADA (STATE AND NCES DEFINITION) 56 0 0 9,965 6,029,786 833,027
A14A ADA (STATE DEFINITION) 30 0 26 28,765 6,029,786 1,076,812
A14B ADA (NCES DEFINITION) 26 0 30 9,965 1,668,916 551,736
MEMBR10 STUDENT MEMBERSHIP 55 1 0 11,105 6,289,578 909,002
SOURCE: U.S. Department of Education, National Center for Education Statistics, Common Core of Data (CCD), "National Public Education Finance Survey (NPEFS),"
Fiscal year 2011, preliminary version 1a file.
G-7

Appendix H—State Notes
H-1

Appendix H—State Notes
The following notes describe known anomalies in state data reported to the collection agent. Unless otherwise noted, each anomaly recorded here applies to fiscal year 2011 (FY 11). The absence of “Notes” for a state indicates that the state’s data did not contain any known anomalies. States are in order by their American National Standards Institute (ANSI) code.
Alabama Fiscal Year: October 1–September 30
Notes: Students do not pay fees for transportation. The chart of accounts for LEAs does not include a separate code for revenue for
tuition, fees, and charges paid by students to attend summer school. Revenue from Intermediate Sources (R2) increased substantially because of two
LEAs.
Alaska Fiscal Year: July 1–June 30 Notes: Property Tax (R1A) was distributed from Other Local Government Non-Property Tax
(R1D). There was a decrease in investment earnings by many LEAs, most notably,
Anchorage School District. The federal Title V money reported for FY 10 is from three districts utilizing the 15-
month extension and they are expending FY 09 funds. The $0 reported for FY 11 is accurate.
Arizona Fiscal Year: July 1–June 30 Notes: Arizona discontinued funding of all-day kindergarten in FY 11.
Arkansas Fiscal Year: July 1–June 30 Notes: Operation and Maintenance Support Services, Property (E256) expenditures decreased
primarily due to a decrease for one LEA (Fayetteville School District with a decrease of approximately $2 million). Expenditures from FY 10 ARRA funds of $2.5 million also contributed to this decrease.
California Fiscal Year: July 1–June 30 Notes: California LEAs do not collect tuition from students to attend summer school. California LEAs do not derive revenues from the sale or rental of textbooks.
H-2

Appendix H—State Notes
California does not report district activities. In California, revenues for extracurricular activities are typically collected and managed by student organizations rather than by districts.
Property tax revenue decreased for the first time in many years due to California’s continued depressed housing market.
Student Transportation Support Services, Property (E257) increased due to a large purchase of transportation equipment by California’s largest school district. Local bond proceeds and air quality grants were used to finance the purchase.
The decrease in SPPE (PPE15) from FY 10 to FY 11 was due to spending cuts and freezes that were put in place to build reserves in anticipation of the continued adverse economic environment in California.
Colorado Fiscal Year: July 1–June 30 Notes: Colorado received a substantial amount of ARRA funds in FY 11; accounting for the
increase in Federal Sources of Revenue Subtotal (STR4). General Administration Support Services, Purchased Services (E234) increased due to
a termination fee that was expensed when Denver Public Schools refinanced $792 million in Certificates of Participation (COP).
There were Property decreases across the board due to extreme statewide budget cutting.
Food, Purchased Service (E3A13) expenditures increase is due to eight school districts changing from fixed-fee food service contracts to cost-reimbursable food service contracts.
Connecticut Fiscal Year: July 1–June 30 Notes: Connecticut does not collect data from local school districts for the District Activities
item.
Delaware Fiscal Year: July 1–June 30 Notes: Delaware has anomalies throughout their data. There was a change in Delaware’s
accounting systems. The data reported is what was extracted. The data will have to be monitored in future years to know if this is a new trend.
District of Columbia Fiscal Year: October 1–September 30 Notes: As the LEAs have been educated about the use and definitions of the NPEFS form,
they have classified their revenue differently and more accurately for FY 11. The
H-3

Appendix H—State Notes
total revenue increase is due to an increase in local funds to the LEAs, as well as a better accounting of federal funds from the LEAs.
Throughout the expenditure data, there are large increases and decreases in certain categories. These variances are due to D.C.’s largest LEA, D.C. Public Schools (DCPS), crosswalking the data in a way that aligns more closely with the DCPS chart of accounts. The overall expenditure and revenue amounts for DCPS in FY 10 are still accurate and do not affect the FY 10 SPPE (PPE15).
Florida Fiscal Year: July 1–June 30 Notes:
Georgia Fiscal Year: July 1–June 30 Notes: More bonds were issued in FY 11 compared to FY 10. Increase in enrollment and
favorable interest rates contributed to this increase. The increase in Operation and Maintenance Support Services, Property (E256) is due
to an increase in building bond issues for FY 11. The increase in Student Transportation Support Services, Property (E257) is due to an
increase in bus purchases. Overall, districts spent less in FY 11 in anticipation of revenue reductions in FY 12
and FY 13. The majority of the Food, Other (E3A16) expenditures increase is made up of federal
indirect cost charges to the Food Services program. The decrease in Adult Education (E9B) expenditures is because two districts did not
report any adult education expenditures in FY 11. Districts have been increasing their Title I Expenditures (X12C) with ARRA funds.
Hawaii Fiscal Year: July 1–June 30 Notes: All federal grants are received through the state. There was a misclassification of
federal revenue types in prior years. There was no Title V, Part A Carryover Expenditures (X12F) from prior year.
Idaho Fiscal Year: July 1–June 30 Notes: Federal Revenue decrease is due to the Idaho Department of Education fully
expending a large ARRA award in FY 10. Total Property decrease is attributed to budget constraints and new schools that were
built or schools that were remodeled in FY 08 and FY 09. Title V, Part A federal revenue is no longer being given to states.
H-4

Appendix H—State Notes
Illinois Fiscal Year: July 1–June 30 Notes: Because districts received less state and federal funding, Instruction Salaries (E11) is
lower than in previous years.
Indiana Fiscal Year: July 1–June 30 Notes: The decrease in Property Tax (R1A) is because of a property tax cap that was
implemented in Indiana. As property taxes decreased, there was also a decrease in excise taxes, including
commercial vehicle, financial institutions tax and automobile tax. In addition, local option income tax revenue decreased from FY 10 to FY 11.
The decrease in Instruction, Property (E17) is due to corporations extending the use of textbooks beyond the adoption period rather than purchasing new textbooks.
Grants in Aid from the Federal Government through the State (R4B) have decreased because of an overall decrease in federal revenue, partially because ARRA Education Stabilization funds were not available in FY 11 as they were in previous years.
Iowa Fiscal Year: July 1–June 30 Notes: Increased Federal Revenues through the State are due to ARRA funding. ARRA State
Fiscal Stabilization dollars were used for state aid and instructional support for both FY 10 and FY 11. In previous years, this would have been state revenue.
Iowa has a statewide sales tax that allows for capital expenditures, such as equipment and vehicles. The function category for which districts will purchase equipment will vary from year to year.
More Title I carryover revenue was available in FY 11 since districts had more Title I revenue available in FY 10 due to ARRA. There was no new Title V revenue and all available carryover was expended in FY 10.
Kansas Fiscal Year: July 1–June 30 Notes: The increase in District Activities (R1K) revenue is due to a new District Activity
fund that was added to the Unified School Districts (USD) budget to capture all gate receipts and expenditures on behalf of activities that collect gate receipts. This new fund makes up the majority of the statewide increase.
The increase in Support Services Student Transportation, Property (E257) is due to 23 districts that had Capital Outlay equipment/buses purchases.
Many districts requested to carryover FY 10 Title I allocations, which resulted in increased federal Title 1 carryover expenditures for FY 11.
H-5

Appendix H—State Notes
Kentucky Fiscal Year: July 1–June 30 Notes: Instruction Support Services, Property (E253) increase is due to districts having an
increase in technology, hardware, and software expenditures for updating their systems.
Louisiana Fiscal Year: July 1–June 30 Notes: Several large LEAs made a one-time purchase of equipment. More charter schools are reporting data for FY 11 than in previous years.
Maine Fiscal Year: July 1–June 30 Notes: New bond sales for four school districts totaled over $150 million. Due to economic conditions, extracurricular activities have been reduced. Medicaid revenue was reduced by more than $29 million, which explains the decrease
in Federal Revenue. ADA decrease is consistent with prior years and is the result of declines in student
population. These declines have been occurring since FY 04.
Maryland Fiscal Year: July 1–June 30 Notes: The increase in General Administration Support Services, Employee Benefits (E224)
is due to one district, Baltimore City Public Schools, which had an increase of $5.8 million, mostly attributable to retiree employee benefits.
There was an increase in contracted services for two districts (Howard County Public Schools and Baltimore County Public Schools) that resulted in a significant increase in Purchased Services for School Administration Support Services (E235).
Ten out of thirteen Maryland LEAs that provide Adult Education curtailed their spending for the program.
Massachusetts Fiscal Year: July 1–June 30 Notes:
Michigan Fiscal Year: July 1–June 30 Notes: Districts reported an increase in fees collected from other LEAs. There is a push from
Michigan legislature to consolidate support services among districts. As districts consolidate services, there are more fees passed between them.
H-6
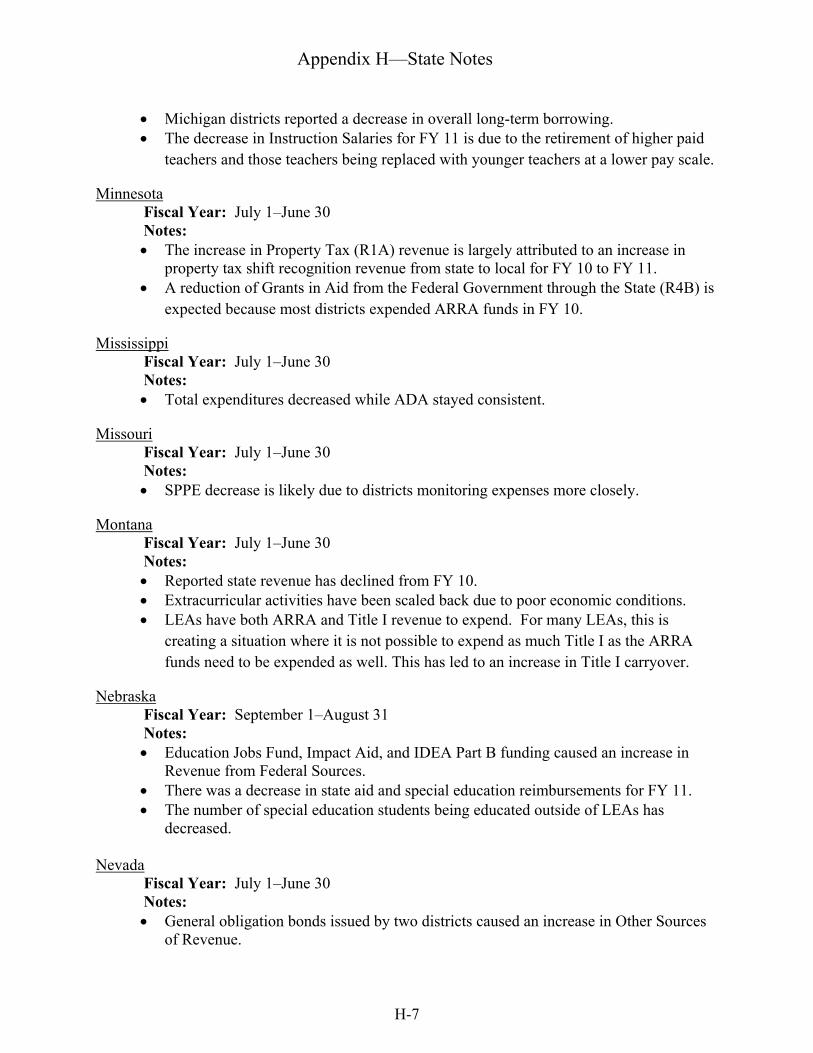
Appendix H—State Notes
Michigan districts reported a decrease in overall long-term borrowing. The decrease in Instruction Salaries for FY 11 is due to the retirement of higher paid
teachers and those teachers being replaced with younger teachers at a lower pay scale.
Minnesota Fiscal Year: July 1–June 30 Notes: The increase in Property Tax (R1A) revenue is largely attributed to an increase in
property tax shift recognition revenue from state to local for FY 10 to FY 11. A reduction of Grants in Aid from the Federal Government through the State (R4B) is
expected because most districts expended ARRA funds in FY 10.
Mississippi Fiscal Year: July 1–June 30 Notes: Total expenditures decreased while ADA stayed consistent.
Missouri Fiscal Year: July 1–June 30 Notes: SPPE decrease is likely due to districts monitoring expenses more closely.
Montana Fiscal Year: July 1–June 30 Notes: Reported state revenue has declined from FY 10. Extracurricular activities have been scaled back due to poor economic conditions. LEAs have both ARRA and Title I revenue to expend. For many LEAs, this is
creating a situation where it is not possible to expend as much Title I as the ARRA funds need to be expended as well. This has led to an increase in Title I carryover.
Nebraska Fiscal Year: September 1–August 31 Notes: Education Jobs Fund, Impact Aid, and IDEA Part B funding caused an increase in
Revenue from Federal Sources. There was a decrease in state aid and special education reimbursements for FY 11. The number of special education students being educated outside of LEAs has
decreased.
Nevada Fiscal Year: July 1–June 30 Notes: General obligation bonds issued by two districts caused an increase in Other Sources
of Revenue.
H-7

Appendix H—State Notes
Nevada’s economy continues to decline in part due to tax base devaluations and foreclosures, affecting tax revenues and general fund state support.
Instruction Purchased Services (E13) includes the Wi-Fi integration/upgrade project, an increase in annual copier maintenance agreements, and increases in Low Incidence Interpreter services and Autism workshops.
Nevada implemented a standardized chart of accounts that has caused some reclassification between functions. As districts become more accustomed, items previously coded to “other” will be coded more accurately.
New Hampshire Fiscal Year: July 1–June 30 Notes: State source revenues include the State of New Hampshire’s contribution to the New
Hampshire Retirement System on behalf of teachers. New Hampshire elected to expend all ARRA monies in FY 09 including their
allocation for FY10. No ARRA reported for FY 11. Enrollment has steadily been declining for a number of years resulting in lower ADA
numbers.
New Jersey Fiscal Year: July 1–June 30 Notes:
New Mexico Fiscal Year: July 1–June 30 Notes: New Mexico had less federal revenue and increased bonds for Capital Outlay
projects. The funding formulas for Supplies for Instruction Support Services (E243) and
Student Support Services (E242) were reduced so LEAs had to make reductions in several areas.
Total Property decreased as resources decreased due to reduced revenues in the state. SPPE decreased due to ADA increasing and expenditures decreasing.
North Carolina Fiscal Year: July 1–June 30 Notes: Textbook program cut significantly in FY 10 and FY 11. There was a large increase in the purchase of vehicles. Interest and redemption of principal debt increased. Even though Net Current Expenditures decreased slightly, the ADA increase of 6.22%
from the prior year is causing the SPPE to drop down.
H-8

Appendix H—State Notes
North Dakota Fiscal Year: July 1–June 30 Notes: The change in Other Sources of Revenue (R5) is primarily due to an increase in bond
sales over the previous year of $41 million. The change in Grants-in-Aid from the Federal Government (R4A) is due to the $86
million in one time ARRA Education Stabilization funding distributed in the previous school year.
Ohio Fiscal Year: July 1–June 30 Notes: An increase in professional, technical, and contracted food services expenditures
account for a large portion of the overall increase in Operation of Non-Instructional Food Services Operations Expenditures Subtotal (E3A1).
Ohio enrollment has been trending downwards since FY 05. FY 11 continues this trend.
Oklahoma Fiscal Year: July 1–June 30 Notes: Starting in FY 10, Tuition is being collected differently. Some Tuition object codes
were added to be more in line with NCES. In FY 11, as the districts started to make the change in their coding, it increased the amount reported and therefore decreased the Tuition and Voucher Payments to Other LEAs and Charter Schools within the State (E15) category.
Districts purchased fewer vehicles in FY 11 than in FY 10. The decrease of ARRA dollars in FY 11 with a higher ADA resulted in a lower SPPE. The increase in Other Local Government Units Non-Property Tax (R1D) is due to an
ongoing sales tax that Oklahoma implemented several years ago (MAPS for Kids).
Oregon Fiscal Year: July 1–June 30 Notes: There were large increases in long-term debt financing sources in a handful of
districts. Some of the LEAs have noted that the larger decreases in Other Local Government
Units Property Tax (R1C) were due to large businesses that stopped operations due to the recession and poor economy.
LEAs increased their opportunities to receive tuition in an attempt to generate revenues due to flat funding from the state.
The increases in the price of oil per barrel and the resulting increases in the price of transportation products, such as tires, motor oil, and fuel led to an increase in Student Transportation Supplies (E247).
H-9

Appendix H—State Notes
The slight decrease in SPPE is attributed to the decrease in state funding, which was replaced to a certain extent with ARRA funds, which caused the funding to be very flat as compared to FY 10. In addition, the districts were more conservative in their spending due to the uncertainty of the economy and relative flat funding from the State for the current biennium, which includes FY 12 and FY 13.
Pennsylvania Fiscal Year: July 1–June 30 Notes: Implementation of GASB 54 in FY 11 required many schools to report athletic
revenue within the General Fund. Prior year NPEFS report did not include athletic revenue.
There was an overall increase in equipment replacement throughout the districts.
Rhode Island Fiscal Year: July 1–June 30 Notes:
South Carolina Fiscal Year: July 1–June 30 Notes: The increase in Non-property Tax (R1B) is attributed to a new tax approved by the
Charleston County School District. The tax places a 1% Educational Capital Improvement Sales and Use Tax with proceeds used for rebuilding and renovating a number of schools. The new tax became effective March 1, 2011 and the school district recognized approximately $22,321,000 in revenues from this source in FY 11.
There is an increase in Other Revenue from Local Sources (R1L) due to an increase in the amounts reported for the Charleston County School District and the Greenville County School District for intergovernmental revenues due to charter schools.
There was a decrease in statewide expenditures from FY 10 to FY 11 due to ongoing budget issues.
South Dakota Fiscal Year: July 1–June 30 Notes: Due to the implementation of Cooperative Projects, expenditures were shifted from
Purchased Services to Salaries and Employee Benefits. There was a significant increase in school building repairs/upkeep. In FY 11, South Dakota started to collect attendance data for preschool children. The
inclusion of these students increased our ADA by 3,113 students and therefore decreased SPPE.
H-10

Appendix H—State Notes
Tennessee Fiscal Year: July 1–June 30 Notes: There was an increase in cost in attendance activities and classroom activities. There was a decrease in Other Support Services, Employee Benefits due to districts
outsourcing services and workforce reduction.
Texas Fiscal Year: September 1–August 31 Notes: SPPE declined because expenditures did not increase at the same rate as ADA.
Utah Fiscal Year: July 1–June 30 Notes: Due to the economic conditions, state legislature is not making any increases in
funding, and at the same time, are cutting programs. Local patrons are unhappy with these cuts and in many cases, either fees or donations are up.
Purchased services increased dramatically because several of the charter schools are reporting all of their expenses as contracted services.
The shift in teacher salaries from regular education programs is a shift in paying for regular education teachers from Education Jobs programs. If we count the Education Jobs as regular education programs, it would shift $65,573,946 in salaries back into the regular education programs column.
Older buses are still in the fleet and are requiring significantly more repair dollars. Gas prices are up over last year.
Vermont Fiscal Year: July 1–June 30 Notes: LEAs are predominantly funded by a statewide property tax in Vermont. By statute, Vermont municipalities collect property tax as agents of the state. Money
goes through a state equalization formula and is distributed as state revenue. Vermont's student population has been declining for several years and economist
forecasts project the trend to continue into the future. This reduction in pupils, along with spending increases from the prior year, accounts for the significant increase in annual per pupil spending in Vermont.
Virginia Fiscal Year: July 1–June 30 Notes: Virginia does not have District Activities revenue to report.
H-11

Appendix H—State Notes
Washington Fiscal Year: September 1–August 30 Notes: Washington does not collect transportation fees from individuals. Support Services, Student Transportation Supplies (E247) increase is due to an
increase in fuel costs. Direct Cost Programs, Adult Education (E9B) reduction is a continuation of ongoing
program cuts.
West Virginia Fiscal Year: July 1–June 30 Notes: The increase in total revenue was due to increases in revenue from state and local
sources. The decrease in federal revenue was due to a decrease in Grants-in-Aid from the
Federal Government through the State (R4B). The increases in Non-Public School Programs (E9A) expenditures are due to more
accurate coding of expenditures for private school support, particularly for the federal Special Education and Title I programs.
Wisconsin Fiscal Year: July 1–June 30 Notes: Districts that are funding post employment retirement benefits on a pay-as-you-go
basis are required to code annual retiree payments to this employee benefit account.
Wyoming Fiscal Year: July 1 – June 30 Notes: Total Revenue (TR) dropped due to a reduction in valuations that reduced local
income in the form of taxes. A number of districts defeased current bond issues or paid off bonded indebtedness
early.
American Samoa Fiscal Year: October 1–September 30 Notes: Revenue from Federal Sources, Grants-in-Aid through the State (R4B) increased due
to increases in Capital Improvement Projects (CIP) funds for new construction. These funds came from Federal Emergency Management Agency (FEMA) and Department of the Interior (DOI).
The increase in salaries is due to hiring of temporary workers for construction projects.
A 1% fuel excise tax generates about a half-million per year for school repairs.
H-12

Appendix H—State Notes
ARRA funds provide the means to do substantial new construction, and over $7 million was allocated over 2 years for that purpose.
Guam Fiscal Year: October 1–September 30 Notes: Two new federal grants were received in FY 11. Those new grants were the
Education Jobs Fund & State Fiscal Stabilization Fund. Although the grants were started in FY 09, Guam Department of Education (DOE) did not receive authorization until the end FY 10 and did not receive the funds until FY 11.
Support Services, Operation and Maintenance Purchased Services (E236) increased by 67% due to multiple reasons. State Fiscal Stabilization Fund provided funding for school repairs. This was the first year that the Guam DOE was charged for summer school busing (previously provided by other government agencies). Under the anti-bullying program, which started in FY 10, additional student resource officers were needed.
There was an increase in school equipment and vehicle purchases.
Commonwealth of the Northern Mariana Islands Fiscal Year: October 1–September 30 Notes: The Commonwealth of the Northern Mariana Islands does not collect property tax. Instruction Salaries (E11) and Instruction Employee Benefits (E12) increased due to
ARRA funds being spent in FY 11.
Puerto Rico Fiscal Year: July 1–June 30 Notes: The decrease in revenue from federal sources directly received from the federal
government was mainly due to the fact that in previous years that category included the total net authorization of funds (actual cash disbursements), as those were presented in the Puerto Rico Department of Education's (PRDOE) Grant Management system, G5. For the FY 11 report, these revenues only included the funds draw down for the period (actual cash receipts).
The variation in expenditures from FY 10 to FY 11 was because of new instruments available in the PRDOE accounting system, which improved financial reporting.
Virgin Islands Fiscal Year: October 1–September 30 Notes: The Virgin Islands government levied an 8% reduction to salaries. The Textbook Adaptation program began in FY 10. The bulk of the expenses and the
remaining books were purchased in FY 11.
H-13

Appendix I—Survey Form
I-1

Appendix I—Survey Form
ED Form 2447 OMB Number 1850-0067 Approval Expires:
December 31, 2012
U.S. DEPARTMENT OF EDUCATION NATIONAL CENTER FOR EDUCATION STATISTICS
THE NATIONAL PUBLIC EDUCATION FINANCIAL SURVEY
Fiscal Year 2011
NAME OF STATE NAME OF PERSON PREPARING THIS REPORT
TELEPHONE NUMBER (Include area code, extension)
NCES-Test User 2
RETURN COMPLETED FORM TO:
U.S. Census Bureau ATTN: Governments Division
Washington, D.C. 20233-6800
According to the Paperwork Reduction Act of 1995, no persons are required to respond to a collection of information unless such collection displays a valid OMB control number. The valid OMB control number for this information collection is 1850-0067. The time required to complete this information collection is estimated to average 78 hours, including the time to review instructions, search existing data resources, gather the data needed, and complete and review the information collection. If you have any comments concerning the accuracy of the time estimate(s) or suggestions for improving this survey, please write to: U.S. Department of Education, Washington, D.C. 20202-4651. If you have comments or concerns regarding the status of our individual survey, write directly to: U.S. Department of Education, National Center for Education Statistics, Elementary/Secondary and Libraries Studies Division, Washington, D.C. 20008-5651.
CERTIFICATION: I hereby certify that to the best of my knowledge and belief, the data reported in sections I-XV, below, constitute a true and
full report of revenues, expenditures, and student attendance during the regular school year and for summer school for the public elementary and secondary schools under this jurisdiction for purposes of public law 97-35, as revised by the Elementary and Secondary Act of 1965. TYPE/PRINT NAME OF AUTHORIZED OFFICIAL SIGNATURE OF AUTHORIZED OFFICIAL
TITLE
I-2

Appendix I—Survey Form
SECTION 1
PUBLIC ELEMENTARY AND SECONDARY EDUCATION REVENUES FROM ALL SOURCES
I. REVENUE FROM LOCAL SOURCES (1000) Current Amount Flag a. Property Tax (1110) b. Non-property Tax (1120-1190) c. Other Local Government Units-Property Tax (1210) d. Other Local Government Units-Non-Property Tax (1220-1290) e. Tuition from Individuals (1310) f. Tuition from other LEAs within the State (1321) g. Transportation Fees from Individuals (1410) h. Transportation Fees from other LEAs within the State (1421) i. Earnings on Investments (1500-1540; not 1532) j. Food Services (excluding federal reimbursements) (1600-1650) k. District Activities (1700-1790) l. Other Revenue From Local Sources (1320-1350, 1420-1440, 1800, 1900-1990; not 1321, 1421,1940) m. Textbook Revenues (1940) n. Summer School Revenues (not 1650) LOCAL SOURCES OF REVENUE SUBTOTAL (1000) [Sum a-e, g, i-n.]
II. REVENUE FROM INTERMEDIATE SOURCES (2000)
III. REVENUE FROM STATE SOURCES (3000)
IV. REVENUE FROM FEDERAL SOURCES (4000) a. Grants-in-Aid Direct from the Federal Government (4100,4300) b. Grants-in-Aid from the Federal Government through the State (4200,4500) c. Grants-in-Aid from the Federal Government through other Intermediate Agencies (4700) d. Other Revenue from Federal Sources (4800,4900) FEDERAL SOURCE OF REVENUE SUBTOTAL (4000) [Sum a-d]
V. OTHER SOURCES OF REVENUE (5000, 6000)
TOTAL REVENUE
I-3

Appendix I—Survey Form
SECTION 2
PUBLIC ELEMENTARY AND SECONDARY EDUCATION EXPENDITURES
I. INSTRUCTION (1000) Current Amount Flag 1. Salaries (100) 2. Employee Benefits (200) 3. Purchased Services (300-500; exclude 560) 4. Tuition (562,563,565,569) 5. Tuition to other LEAs within the State (561, 564, 566, 567) 6. Supplies (600) 7. Property (700) 8. Other (810, 890) INSTRUCTION SUBTOTAL (1000) [Sum 1-4, 6, & 8 only.]
INSTRUCTION, continued (1000)
Special Exhibit Items 1. Salaries (100) paid to teachers by program
A. Salaries paid to teachers in regular education programs (Objects 111 and 113; Program #100)
B. Salaries paid to special education teachers (Object 111 and 113; Program #200)
C. Salaries paid to vocational education teachers (Object 111 and 113; Program #300)
D. Salaries paid to teachers in other programs providing instruction to grades pre-kindergarten through grade 12 and ungraded students (Objects 111 and 113; Programs #400 and #900)
2. Textbook expenditures for classroom instruction (Function 1000, Object 640)
I-4

Appendix I—Survey Form
SECTION 3A
II. SUPPORT SERVICES (2000)
SUPPORT SERVICES, STUDENTS (2100) Current Amount Flag 1. Salaries (100) 2. Employee Benefits (200) 3. Purchased Services (300-500) 4. Supplies (600) 5. Property (700) 6. Other (810, 890)
SUPPORT SERVICES STUDENTS EXPENDITURES SUBTOTAL (2100) [Sum 1-4 & 6 only.]
SUPPORT SERVICES, INSTRUCTION (2200) 1. Salaries (100) 2. Employee Benefits (200) 3. Purchased Services (300-500) 4. Supplies (600) 5. Property (700) 6. Other (810, 890)
SUPPORT SERVICES INSTRUCTION EXPENDITURES SUBTOTAL (2200) [Sum 1-4 & 6 only.]
SUPPORT SERVICES, GENERAL ADMINISTRATION (2300) 1. Salaries (100) 2. Employee Benefits (200) 3. Purchased Services (300-500) 4. Supplies (600) 5. Property (700) 6. Other (810, 890)
SUPPORT SERVICES GENERAL ADMINISTRATION EXPENDITURES SUBTOTAL (2300) [Sum 1-4 & 6 only.]
SUPPORT SERVICES, SCHOOL ADMINISTRATION (2400) 1. Salaries (100) 2. Employee Benefits (200) 3. Purchased Services (300-500) 4. Supplies (600) 5. Property (700) 6. Other (810, 890)
SUPPORT SERVICES SCHOOL ADMINISTRATION EXPENDITURES SUBTOTAL (2400) [Sum 1-4 & 6 only.]
I-5

Appendix I—Survey Form
SECTION 3B
SUPPORT SERVICES, OPERATIONS AND MAINTENANCE 2600) Current Amount Flag 1. Salaries (100) 2. Employee Benefits (200) 3. Purchased Services (300-500) 4. Supplies (600) 5. Property (700) 6. Other (810, 890)
SUPPORT SERVICES OPERATIONS AND MAINTENANCE EXPENDITURES SUBTOTAL (2600) [Sum 1-4 & 6 only.]
SUPPORT SERVICES, STUDENT TRANSPORTATION (2700) 1. Salaries (100) 2. Employee benefits (200) 3. Purchased Services (300-500) 4. Supplies (600) 5. Property (700) 6. Other (810, 890)
SUPPORT SERVICES STUDENT TRANSPORTATION EXPENDITURES SUBTOTAL (2700) [Sum 1-4 & 6 only.]
SUPPORT SERVICES, OTHER SUPPORT SERVICES (2500, 2900) 1. Salaries (100) 2. Employee Benefits (200) 3. Purchased Services (300-500) 4. Supplies (600) 5. Property (700) 6. Other (810, 890)
SUPPORT SERVICES OTHER EXPENDITURES SUBTOTAL (2500, 2900) [Sum 1-4 & 6 only.]
ALL SUPPORT SERVICES TOTAL - BY OBJECT (100,200,etc.) 1. Salaries (100) 2. Employee Benefits (200) 3. Purchased Services (300-500) 4. Supplies (600) 5. Property (700) 6. Other (810, 890)
ALL SUPPORT SERVICES EXPENDITURES SUBTOTAL (2100-2900) [Sum 1-4 & 6 only.]
I-6

Appendix I—Survey Form
SECTION 4
III. OPERATION OF NON-INSTRUCTIONAL SERVICES (3000)
FOOD SERVICES OPERATIONS (3100) Current Amount Flag 1. Salaries (100) 2. Employee Benefits (200) 3. Purchased Services (300-500) 4. Supplies (600) 5. Property (700) 6. Other (810, 890)
FOOD SERVICES EXPENDITURES SUBTOTAL (3100) [Sum 1-4 & 6 only.]
ENTERPRISE OPERATIONS (3200) 1. Salaries (100) 2. Employee Benefits (200) 3. Purchased Services (300-500) 4. Supplies (600) 5. Property (700) 6. Other (810, 890)
ENTERPRISE OPERATIONS EXPENDITURES SUBTOTAL (3200) [Sum 1-4 & 6 only.]
SECTION 5
IV. DIRECT PROGRAM SUPPORT Current Amount Flag a1. Textbooks for Public School Children a2. Textbooks; Property (700) only b1. Transportation for Public School Children b2. Transportation; Property (700) only c1. Employees Benefits for Public School Employees c2. Employees Benefits; Property (700) only d. Direct Program Support for Private School Students e1. Other Direct Program Support for Public School Students
e2. Other Direct Program Support for Public School Students; Property (700) only
DIRECT SUPPORT EXPENDITURES SUBTOTAL [Sum a1,b1,c1, and e1.]
V. CURRENT EXPENDITURES [Sum Subtotals for Instruction(1000), Support Services (2000), Non-Instruction (3000 - exclude 3300: Community Services), and Direct Program Support (exclude Direct Program Support for Private School Students). Exclude Property (700).]
I-7
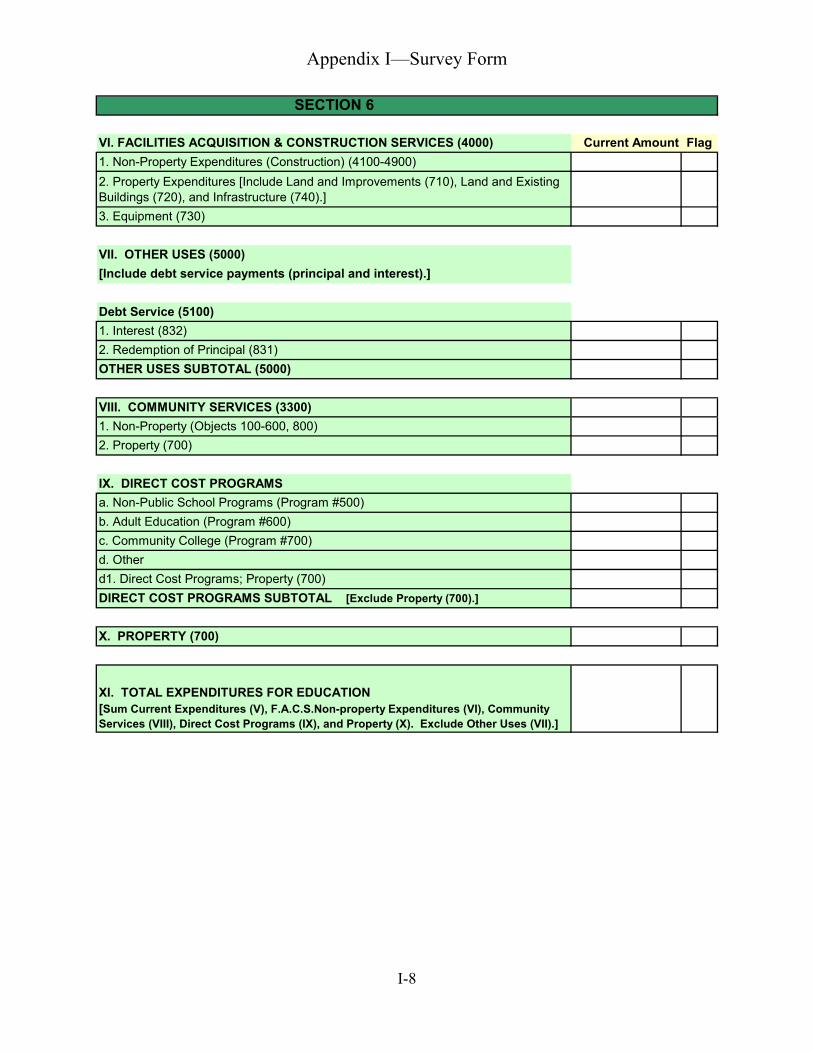
Appendix I—Survey Form
SECTION 6
VI. FACILITIES ACQUISITION & CONSTRUCTION SERVICES (4000) Current Amount Flag 1. Non-Property Expenditures (Construction) (4100-4900) 2. Property Expenditures [Include Land and Improvements (710), Land and Existing Buildings (720), and Infrastructure (740).] 3. Equipment (730)
VII. OTHER USES (5000) [Include debt service payments (principal and interest).]
Debt Service (5100) 1. Interest (832) 2. Redemption of Principal (831) OTHER USES SUBTOTAL (5000)
VIII. COMMUNITY SERVICES (3300) 1. Non-Property (Objects 100-600, 800) 2. Property (700)
IX. DIRECT COST PROGRAMS a. Non-Public School Programs (Program #500) b. Adult Education (Program #600) c. Community College (Program #700) d. Other d1. Direct Cost Programs; Property (700) DIRECT COST PROGRAMS SUBTOTAL [Exclude Property (700).]
X. PROPERTY (700)
XI. TOTAL EXPENDITURES FOR EDUCATION [Sum Current Expenditures (V), F.A.C.S.Non-property Expenditures (VI), Community Services (VIII), Direct Cost Programs (IX), and Property (X). Exclude Other Uses (VII).]
I-8

Appendix I—Survey Form
SECTION 7
EXCLUSIONS FROM CURRENT EXPENDITURES FOR STATE PER PUPIL EXPENDITURE (SPPE) Current Amount Flag a. Tuition from Individuals (1310)
b. Transportation Fees from Individuals (1410) c. Title I Expenditures
[As defined in the No Child Left Behind Act of 2001. DO NOT simply restate revenues received. This item is to contain expenditures.]
d. Title I Carryover Expenditures
e. Title V, Part A Expenditures [As defined in the No Child Left Behind Act of 2001. DO NOT simply restate revenues received. This item is to contain expenditures.]
f. Title V, Part A Carryover Expenditures [Include carryover expenditures from Title V, Part A (as defined in the No Child Left Behind Act of 2001).]
g. Food Services Revenues (excluding Federal Reimbursements (1600-1650)
h. District Activities Revenues (1700-1790)
i. Textbook Revenues (1940)
j. Summer School Revenues (1312)
TOTAL EXCLUSIONS [Sum a-j.]
NET CURRENT EXPENDITURES as defined by the Hawkins-Stafford Education Amendments of 1988 (P.L. 100-297). [Subtract Total Exclusions from Current Expenditures.]
AVERAGE DAILY ATTENDANCE (ADA) A. ADA as defined by state law
B. ADA as defined by NCES
STATE PER PUPIL EXPENDITURE
I-9

Appendix I—Survey Form
The American Recovery and Reinvestment Act of 2009, abbreviated ARRA (Pub.L. 111-5), is an economic stimulus package enacted by the 111th United States Congress in February 2009. The Act includes spending in education providing funds to implement longitudinal data systems to improve student achievement.
Do you have any ARRA expenditure data to report? oYes oNo
American Recovery and Reinvestment Act of 2009 (ARRA) a. Current expenditures for public elementary-secondary education instruction (function 1000, objects 100-600, 810, 890). b. Total current expenditures for public elementary-secondary education (functions 1000, 2000, 3100, 3200, objects 100-600, 810, 890). c. Current expenditures for community services, adult education and other programs outside of public elementary-secondary education (programs 500, 600, 800). d. Property expenditures (functions 1000-3200, object 700). e. School construction expenditures (function 4000, all objects). f. Expenditures for the Title I reported in Section 7d. Exclusions from Current Expenditures for State per Pupil Expenditures programs that were included in the data items above. g. Direct Program Support
I-10