Embed Size (px)
Citation preview

, 11'-
DOCUMENT RESUME
ED 286 474 IR 012 807
AUTHOR Curtis, P. A.; And OthersTITLE Measuring Computer Literacy in Colleges of
Agriculture: Results, Conclusions andImplications.
INSTITUTION Texas A and M Univ., College Station. Dept. ofAgricultural Economics.
REPORT NO FP-86-11PUB DATE Oct 86NOTE 30p.PUB TYPE Information Analyses (070) Reports
Research /Technical (143) -- Tests/EvaluationInstruments (160)
EDRS PRICEDESCRIPTORS
MF01/PCO2 Plus Postage.*Agricultural Education; Analysis of Variance;*College Students; *Computer Literacy; *CurriculumDevelopment; Higher Education; Majors (Students);Questionnaires
ABSTRACTA computer literacy assessment instrument was
developed to evaluate the current level of computer literacy ofstudents enrolled in agricultural classes at Texas A&M University. Afaculty member from each of the 19 departments in the College ofAgriculture was asked to recommend two classes representative of thestudents in his or her department, and the survey was administered tothis sample of 895 students. Results were analyzed by analysis ofvariance techniques to determine if there was a significantdifference in literacy scores between students in the freshman,sophomore, junior, senior, or graduate classifications, and Duncan'smultiple range test was used to separate the means. Scores werestratified to include those specifically related to computerhardware, software, programming, agricultural computer use,miscellaneous technical questions, and computer experience with sixspecific software packages. Scores were alsc analyzed for differencesdue to the students' majors. Results indicated that, regardless ofhigh school experience, freshman literacy scores were below those ofseniors. It is concluded that the responsibility for computerliteracy should be placed on the university, and several ways inrhich departments can work toward this goal are suggested.Statistical analyses are included, 12 references are listed, and thesurvey instrument is appended. (MES)
************************************************************************ Reproductions supplied by EDRS are the best that can be made *
* from the original document. *
***********************************************************************
FP 86-11 October 1986
MEASURING COMPUTER LITERACY INCOLLEGES OF AGRICULTURE:
RLL7S, CONCLUSIONS AND IMPLICATIONS
P. A. Curtis, F. A. GardnerK. K. Litzenberg
c,
I
Curtis is Assistant Professor, Department of Animal and Food Science,University of Wisconsin; Gardner is Professor of Poultry Science,Litzenherg is Associate Professor of Agricultural Economics, both atTexas A&M University.

Measuring Computer Literacy inColleges of Agriculture; Results,
Conclusions and Implications
Abstract
This research presents a computer literacy assessment instrument to
evaluate the current levels of computer literacy of students enrolled in
agricultural courses at a major land grant university. Differences in levels
of computer literacy resulting due to the classification of students and their
majors in the College of Agriculture were measured. Stratification of general
computer literacy is presented for catagories of: computer hardware, computer
software, computer programming, agriculture computer use, and technical
computer skill Finnlly, the experience level of agricultural students with
six specific computer software packages is presented.
4

Measuring Computer Literacy in Colleges of Agriculture:
Results, Conclusions and Implications
Familiarity with the computer in today's agricultural business, education
and research coununities is becoming increasingly more important. It has been
predicted that by the year 2000 there will be a 44 percent increase in the
number of service sector jots related to agriculture as =pared to this
component in 1978 (Todt, 1984). Computers are being used to keep inventory
and financial records and are becoming a necessary tool for decision making
and resource allocation in agriculture (Litzemberg, 1982). The agriculture
community is also beginning to use modern computer technology for information
exchange amc.g researchers and to deliver research results to the :'_xtension
service and other technology transfer groups. Direct access to large
information repositories through computer terminals in the home or workplace
can make keeping up with agriculture technology less costly and more
convenient (Roth, et al. 1984). Many current undergraduate students in
Colleges of Agriculture have limited and highly varied degrees of experienoe
in using computer technology. To function efficiently in tomorrow's world, it
is necessary that these students be computer literate. This does not mean
they must be knowledgeable it all areas of computer applications and
programming but they must have some experienoe in using computers and some
concept of how computers and the accompanying software can be efficiently
utilized (Magarrell, 1983).
Computer literacy is a topic which is receiving much attention at
5
2
colleges and universities. Wiggins and Trade (1985) have reported the effects
of various factors including mathematic grades, classification of strap,nts and
majors and other characteristics on student achievement. With the computer
revolution occurring around us, educators are anxious to see that their
students are at least exposed to the appropriate material But what is
computer literacy, and what level of expertise is appropriate for the College
cf Agriculture graduates in the '80s?
Computer literacy is a term which has different meanings to different
people. The Office of Technology Assessment (IOTA, 1982) defines computer
literacy as, "the knowledge of how to use computer programs and information
banks and how to critically eve'..uate the results". McWilliams (1982) defines
computer literacy as familiarity with computers. He further states that
computer literacy doesn't require speaking a computer language, nor does it
even require extensive knowledge of already-written programs. All it requires
is a sense of ease around computers, and the knowledge that personal computers
are powerful tools, not menacing characters out of science fiction.
Schlobin's (1985) definition of computer literacy demands at least a passing
familiarity with the strengths, weaknesses and applications of different kirms
of processors, operating systems, peripherals, and software. He felt that
progranuning was not a high priority of microcomputer literacy.
Sheppard (1984) descried computer literacy as a spectrum of four levels
of literacy based on the desired expertise of the participants. They are: (1)
Cnputer Appreciation where students are able to make intelligent decisions
regarding the role of computers in society; (2) Computer Use where students
are able to use the computer in solving rroblems in their own disciplinp
(experience with application packages not necessarily as programmers.); (3)
Boftwaxe Creativity where students are able to write their own software
3
(experience with one or more programming languages.); and (4) Computer
Cs2mxtency where students have a broad-based understanding of computer-related
topics. (This includes both hardware issues such as the internal electronics
and operations of the computer as well as software related topics such as
languages, data and file structure, operating systems and communication
protocols.)
Which of these levels of literacy is the correct one? The answer depends
on the rationale for individual students in developing computer literacy.
Cbrrent agricultural industry requirements for computer expertise differ
greatly between disciplinps and quite a lot for different students in a given
discipline within the College of Agriculture. Since we are preparing students
for a future career, we are caught up in predicting potential future needs for
all students. Alternative mechanisms are needed for implementing computer
literacy at the various :levels. Sheppead (1984) offers these possibilities:
(1) Offer computer-related curricula as a major field of study; (2) offer
computer-related curricula as a minor field of study; (3) provide a survey
course(s) from a computer -urriculum; (4) provide a survey course(s) in
computer literacy; (5) incorporate computer related topics into existing
course offerings; (6) other (make microcomputers available for student use on
their own, non-credit courses, etc.)
An alternative suggested by Van Horn (198.0 is that students be given a
set of tools that may be discipline dependent, but not course specific. A
different work bench would be expected for stliee.tts in electrical engineering
than for students in English. Van Horn stressed incippendent learning-
providing the general tools related to the basic problems of the discipline
and let the students select the tools to be utilized. When students leave the
university they will have to linderstand how to use those general tools to
7
4
solve problems.
Although many schools are requiring students to take a programming
course, Van Horn (1984) feels that some students will want to learn to program
and should be encouraged. However, he feels putting everybody through a
programming course is a waste of time and would have negative effects.
Sdhldbin (1985) suggested universities offer a degree in microcomputer
science. He described the ideal microcomputer science laboratory as being
very different from current ones. Rather than being stocked with identical or
even similiar nicrocamputers, it would be diverse. To produce the needed
professionals, numerous microprocessors, peripherals, and programs would have
to be available. In additon, multi -user and networked configurations would he
required. Theory and practicality must work hand in hand in the classroom and
laboratory. The graduate must have the professional skills to understand
existing software (and hardware) and also to evaluate new developments. This
curriculum would also offer valuable courses for the non-major.
S
5
A Computer Literacy Assessment Instrument
A computer literacy assessment instrument was developed to evaluate the
current level of computer literacy of students enrolled in agricultural
classes at Texas AYM University (Curtis, 1985). A faculty representative
from each department in the College of Agriculture at Texas AYM University was
selected and asked to recommend two classes--one lower level, fresh an or
sophomore class and one upper level, junior or senior class-that best
represented students from their department. The computer literacy assessment
tool was administered to students in each of these recommended classes.
Nineteen departments in the College of Agriculture at Texas AM University
were represented.
The results were analyzed by analysis of variance technique (SAS, 1979)
to determine if there was a significant difference in literacy scores between
the students in the freshman, sophomore, junior, senior and graduate
classifications. Duncan's multiple range test was used to separate the means.
Literacy scores were also stratified to include scores specifically related to
computer hardware, software, computer programming, agricultural computer use,
miscellaneous technical questions and computer experience. These additional
scores were then analyzed to see if there were any differences due to the
student's academic classification.
A copy of the computer literacy assessment tool can be found in the
Appendix.
9

6
The Study
Sinoe the nature of literacy for society is expanding to include computer
literacy, familiarity with the computer for agriculture students is becoming
increasingly important. Therefore, it is important that students graduating
from Colleges of Agriculture be computer literate in order to function
effectively. In this study, computer literacy is defined on three levels as
follows: (1) having a general knowledge of hardware and software applications;
(2) having a basic understanding of the logic of programming; and (3) having a
general idea of how computers are used in agriculture. This definition is
similar to the second level of computer literacy (computer use) described
earlier by Sheppard (1984).
Students from nineteen departments (or major area of study) representing
the College of Agriculture at Texas At4M were used to sample the population.
Of the 895 students taking the computer literacy assessment test, 149 were not
from the College of Agriculture (Table 1). These 149 students along with 40
graduate agriculture students were enrolled in the participating undergraduate
agriculture courses. During the 1984-85 spring semester, Texas A&M University
had a total enrollment of 33.851 and the College of Agriculture had 4568
students (Table 2) or 13.5 percent of Texas AUM University's total enrollment.
The target population for this study was the undergraduate students in the
College of Agriculture--a total of 3162 students. The sample population
contained 706 agriculture undergraduate or 22.3 percent of the undergraduate
enrollment from the College of Agriculture.
10
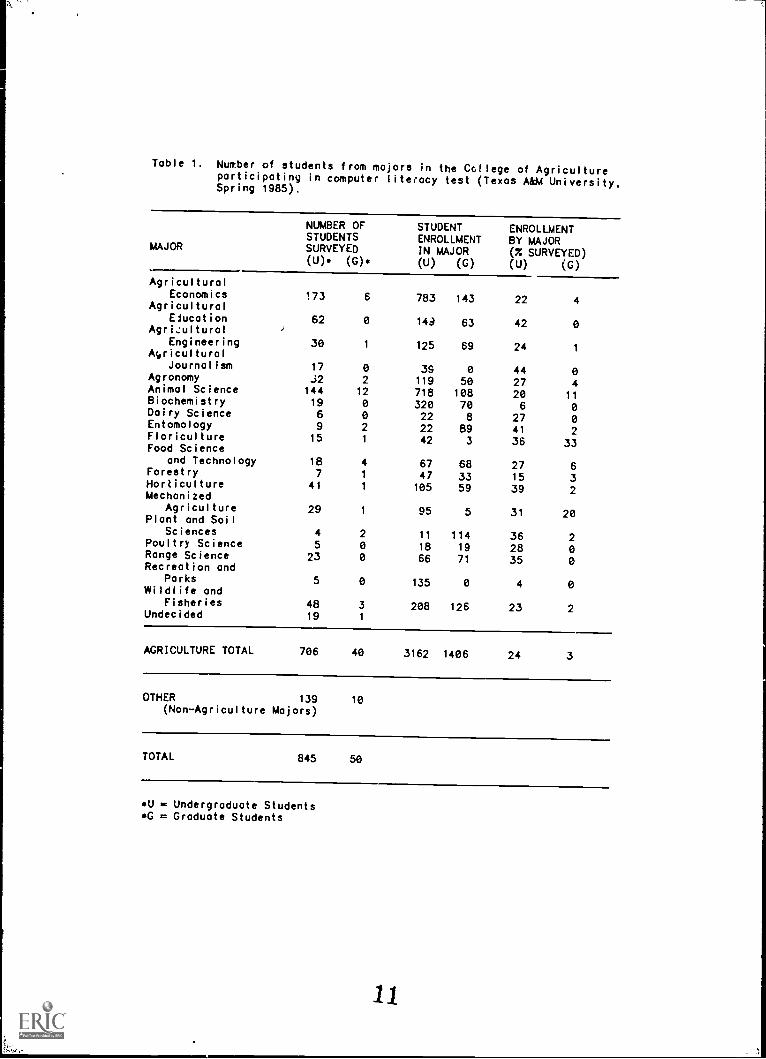
Table 1. Number of students from majors in the College of Agricultureparticipating in computer literacy test (Texas A&M University,Spring 1985).
NUMBER OFSTUDENTS
STUDENTENROLLMENT
ENROLLMENTBY MAJOR
MAJOR SURVEYED IN MAJOR (X SURVEYED)(U) (G) (U) (0) (U) (0)
AgriculturalEconomics 173 6 783 143 22 4AgriculturalEitication 62 0 149 63 42 0AgriculturalEngineering 30 1 125 69 24 1
AgriculturalJournalism 17 0 39 0 44 0
Agronomy .32 2 119 50 27 4Animal Science 144 12 718 108 20 11Biochemistry 19 0 320 70 6 0Dairy Science 6 0 22 8 27 0Entomology 9 2 22 89 41 2Floriculture 15 1 42 3 36 33Food Science
and Technology 18 4 67 68 27 6Forestry 7 1 47 33 15 3Horticulture 41 1 105 59 39 2Mechanized
Agriculture 29 1 95 5 31 20Plant and Soil
Sciences 4 2 11 114 36 2Poultry Science 5 0 18 19 28 0Range Science 23 0 66 71 35 0Recreation and
Parks 5 0 135 0 4 0Wildlife and
Fisheries 48 3 208 126 23 2Undecided 19 1
AGRICULTURE TOTAL 706 40 3162 1406 24 3
OTHER 139 10(NonAgriculture Majors)
TOTAL 845 50
I/ = Undergraduate Students= Graduate Students
11

Table 2. Sample student population by academic classificationenrolled in the College of Agriculture at Texas ALCMUniversity.
CLASS
NUMBERS OF PERCENT OFSTUDENTS IN TOTALSURVEY. SURVEYED
NUMBER OFSTUDENTS INCOLLEGE OF AG
Freshmen 199 22 423Sophomores 193 22 608Juniors 214 24 954Seniors 239 27 1177Graduates 50 5 1406
TOTAL 895 100 4568
Includes all students (agriculture and nonagriculture)
12

9
Classification
Each undergraduate acadsmic classification was almost equally represented
in the survey (Table 2). Although, the target population of this study were
the undergraduate studems, responses Obtained from the graduate students
added considerably to the study. The small sample which may or may not be
representative of the graduate population-,did provide some interesting
responses. These results will be presented, but the main discusssion will be
centered on the undergraduate results.
The computer literacy tes; covered topics on hardware, software, computer
programming, computel uses in agriculture, miscellaneous technical material
and previous computer experiume. With the exception of computer uses in
agriculture, the topics were chosen because they cover the basic areas
necessary for computer utilization and are the broad categories most often
covered in other computer literacy tests. However, the computer literacy test
developed for this study is more objective than most computer literacy tests
as it centers on knowledge and experience rather than attitude. The section
on computer uses in agriculture was added because this study was designed to
evaluate computer litelcy of students in the College of Agriculture.
Results
Since the computer literacy test used in the study was an objective tool,
scores were based on the percentage of correct responses. When mean test
scores were analyzed no significant difference was found between freshmen,
13

10
sophomore and junior students. However, the mean score for seniors was
significantly higher than underclassmen. The mean score from the small sample
of graduate students was fonnd to be significantly higher than all
undergraduate scores. Although not statistically different, the mean scores
for freshmen, sophomores, and juniors tended to increase with advanced
academic classification (Table 3).
Many more freshmen (31%) and sophomores (17%) actnally took computer
courses during high school than juniors (996) or seniors (7%) (Table 4).
Eighty-seven percent of the seniors surveyed never used computers in high
school compared to 45 percent of freshmen. This would indicate that students
now entering the university have had more exposure to computers than students
in the past. As would be expected, fewer computer courses have been taken by
freshmen and sophomores since coming to T.Oczn A&M University than by juniors
and seniors (Table 5).
Only 31 percent of the seniors have never taken a computer cairse at
Texas AYM as compared with 67 percent of freshmen. Based on these findings,
it appears that although freshmen and sophomores have been exposed to computer
use and have taken computer classes prior to their enrollment at Texas A&M,
college level computer use and courses axe still necessary to bring their
computer literacy up to a level equal to that of the seniors. Difference ih
material covered in the college classes, the repeated computer exposure in
other classes, and the relativeness of the computer to the student's major
area of study are major contributing factors to the significant difference in
undergraduates (Table 3). Therefore, to improve computer literacy college
tWring in computer utilization is needed. A variety of computer literacy
training alterneAxes (such as described by Sheppard, 1984 and Schiobin, 1985)
should be made available to students at the university to allow them to bring
14

Toble 3. Meon scores for literacy test by academic clossificotion
CLASSIFICATION MEAN SCORES
aFreshmen 55
aSophomore 57
0Junior 59
bSenior 65
Groduote 69
a,b.c
Score means followed by different letters differ significantly (P < 0.05).
Toble 4. Number of high school computer closses by academic classification.
STUDENTCLASSIFICATION N
NONE(NUM) (7.)
NUMBER OF COURSES TAKEN
1 COURSE 2 COURSE(NUM) (7.) (NUM) (7.)
Freshmen 199 124 62 62 31 12 6Sophomores 193 151 78 32 17 9 5Juniors 214 190 89 20 9 2 1Seniors 239 219 92 16 7 4 2Graduates 50 46 92 3 6 1 2
N = Totol number students surveyed by clossificotionNUM = Number of responsesM = Percent of students from academic clossificotion.
Toble 5. Number of computer classes taken of Texos ALCM University byacademic classification.
NUMBER OF COURSES TAKEN
CLASS N 0 1 2 >2NUM. 7.. NUM. M. NUM. %. NUM. Xs
Freshmen 199 134 67 61 31 2 1 1 1
Sophomores 193 116 60 63 33 11 6 2 1
Juniors 214 99 46 94 44 19 9 1 1
Seniors 239 74 31 111 46 37 15 16 7
Graduates 50 17 34 25 50 7 14 1 2
N = Total number students surveyed by classificationNUM = Number of responses
7. = Percent of students from academic clossificotion
15
12
their individual computer literacy up to the level which will be needed in
their specific discipline
It would be interesting to repeat this study in five years to determine
whether computer literacy scores for seniors who hati obtained amputer
experience and classes in high school actually achieved a higher level of
computer literacy than the senior students in this study. With the increased
interest in using computers in secondary and even elementary schools, student
exposure to computers should increase greatly. Depending on the content
taught to students in elementary and secondary schools, literacy scores (as
determined in this study) should increase considerably. However, computer use
in specific agricultural disciplines would still need to be taught at the
university. Rapid improvements in computer technology will in all iikelihood
continue. Once the elementary and secomary schools acquire hardware, this
hardware will be used for many years with only limited up-dating.
Universities will have to be responsible for training students to use a
varf_aty of up-to-date technological equipment. The concept of computer
literacy will continue to change due to the increase in technology.
Therefore, freshmen in 1990 would most likely have a higher level of computer
literacy than 1985 freshmen. However, seniors in 1990 will most likely have a
higher level of computer literacy than 1990 entering freshmen.
In an attempt to determine why the seniors' score was higher, the overall
literacy scores were expanded into five categories--hardware, software,
programming, use': of computers in agriculture and miscellaneous technical
questions. Computer experience cis also analyzed by determining the variety
of computer activities and/or software applications to which the student had
been exposed. It appears that as students progressed academically their
knowledge increased in all aspects of computer literacy (Table 6). There were
16
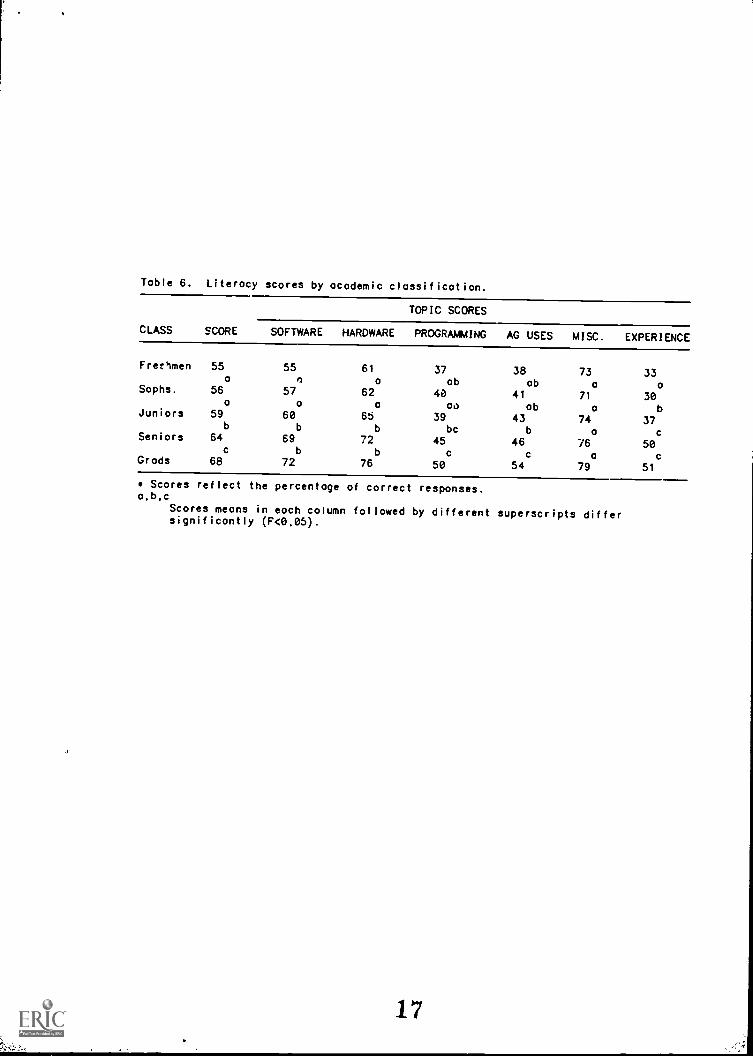
Table 6. Literacy scores by academic classification.
CLASS SCORE
TOPIC SCORES
SOFTWARE HARDWARE PROGRAMMING AG USES MISC. EXPERIENCE
Freshmen
Sophs.
Juniors
Seniors
Grads
55a
56a
59b
64c
68
55n
57a
60b
69b
72
61
a
62o
65b
72b
76
37ab
40al)
39be
45c
50
38ab
41ob
43b
46c
54
73a
71
a
74a
76a
79
33a
30b
37c
50c
51
Scores reflect the percentage of correct responses.a.b,c
Scores means in each column followed by different superscripts differsignificantly (F<0.05).
17

14
no significant differences between freshmen, sophomore or junior overall
scores, hardware section scores, or software section scores. Results from
programming scores (Table 6) suggest that the students develop programming
techniques and/or experience as they progress through college and that
programming is not taught and rarely experienced at the high school level.
The knowledge regarding computer use in agriculture, ag uses, (Table 6) tend
to increase (reflected by a higher computer literacy test score) as the
student progresses through school. This is most likely due to the number and
variety of classes the student has taken in agriculture and his ability to
determine possible computer application and/or computer applications being
discussed and/or utilized in the agriculture classes.
Computer Experience by Classification
A survey section of the computer literacy test asked students questions
about their experience with a variety of software applications. The
applications- -feed formulation. accounting, data entry, word processing,
spreadsheets and data base management -were chosen because they represented
the most popular type of software applications available Freshmen (63%),
sophomores (5896), juniors (63%) as well as seniors (82%) reported data entry
was the most common computer experience (Table 7). This is most 1ikply due to
the high number of laboratory courses in agriculture that require some type of
data analysis. Word processing was the second most common area of experience
-- freshmen (46%), sophomores (30%), juniors (42%) and seniors (57%).
Freshmen reported having experienced 33 percent of the computer
applications listed on the survey part of the computer literacy test. They
18
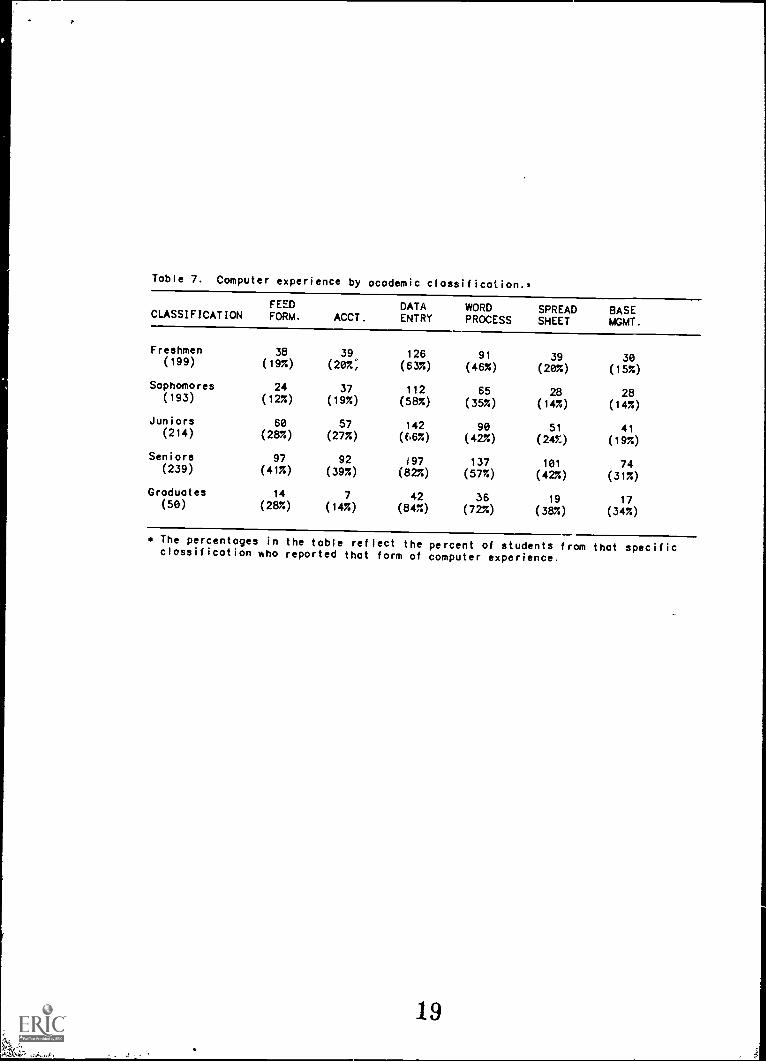
Table 7. Computer experience by academic classification.,
FEED DATA WORD SPREAD BASECLASSIFICATION FORM. ACCT. ENTRY PROCESS SHEET MGMT.
Freshmen 38 39 126 91 39 30(63%) (46%) (207.) (157,)
(199)
Sophomores
(197.)
24
(20%,
37(193) (127.) (19%)
Juniors 60 57(214) (28%) (27%)
Seniors 97 92
112 65 28 28(58%) (35%) (14%) (14%)
142 90 51 41(C6%) (42%) (24%) (19%)
197 137 101 74(239) (41%) (39%) (82%) (57%) (42%) (317.)
Graduates 14 7 42 36 19 17(50) (28%) (14%) (84%) (72%) (38%) (34%)
The percentages in the table reflect the percent of students from that specificclassification who reported that form of computer experience.
19
16
did not differ significantly from juniors (37%) or sophomores (30%) (Table 6).
However, seniors reported experiencing 50 percent of the applications listed
on the survey section and the graduates reported 51 percent which was
significantly higher than freshmen, sophomores and juniors. These results
suggest that students have been exposed to a variety of software applications
through computer courses taken and/or computer uses in other college classes.
As students increase their experience with computer software, they are
most likely increasing their knowledge of hardware because of the variety of
machines utilized. According to Sdhlobin (1985) this in itself should
increase computer literacy. As students use different machines they are also
learning to use different kinrie of software and operating systems. They also
see strengths and weaknesses of the various computers. This is important
because the student's computer literacy will not be based on a single brand of
computer. It will also make it easier for the student to adapt to machines
that he had not used before.
Because students in different depeeTents within the College of
Agriculture have different computer needs, individual departments may be in a
better position to determine computer literacy standards for their department
based on potential computer uses in their specific discipline This would
provide a minimum acceptable level of computer literacy for students
graduating from a specific department or with a specific major. By basing the
level of literacy on discipline needs, students will be better prepared for
future career opportunities. It is also very important that standards are
continually updated and revised. Some departments may want to emphasize one
sub-area (hardware, software, computer utilization in agriculture,
programming, etc.) more than would another department. For example, a
department such as agricultural journalism may want to emphasize Jftware
20

17
applications and de-emphasize programming.
In order for each department to reach the computer literacy standards
they have determined, some method of literacy assessment for incoming
students would be needed. Training would then be needed to bring the student
up to the predetermined standards by the time of graduation. This could be
accomplished through coursework (inside or outside the department) or computer
use in (noncomputer) departmental courses.
Another alternative would be for the College of Agriculture to set basic
computer literacy standards. This would provide a more uniform literacy level
and initial assessment could be made at the time of admission and pretesting
for other courses. Then departments would be responsible only for the
additional training, if any, necessary for their field of study.
The results of this research have shown that regardless of high school
experience freshmen literacy scores were still below those of seniors.
Therefore, the responsiblity for computer literacy should be placed on the
university and specifically on the College of Agriculture.
21

REFS
Curtis, Patricia A. 1985, Computer utilization in teaching principles of foodscience and agriculture in post secondary and extension education. Ph.D.Dissertation. Texas A4M University, College Station, TX.
Litzenberg, Kerry K. 1982, "Computer Use in the Agricultural EconomicsClassroom." American Journal of Agricultural Economics.64:970-977.
Magarrel, Jack. 1983, Microcomputers proliferate on college campuses. TheChronicle of Higher Education. 26(6):9.
McWilliams, Peer A. 1982, Personal computer in education./n ThePersonal Computer Book, Prelude Press, Los Angeles, CA.
Office of Technology Assessment (OTA). 1982, The United States as aninformation society. In Informational Technology and Its Impact onAmerican Education, U.S. Government Printing Office, Washington,D.C.
Roth, Jane, Tom Tate and Sam Waters. 1984, Information and communicationtechnology, Reference Document: Needs and assessment for the Food andAgricultural Sciences, pp. 279-290, January 1984, Joint Council on Food andAgricultural Science.
Statistical Analysis System (SAS) Institute, 1979, SAS Users Guide, SASInstitute, Inc., Cary, NC.
Sdhlbbin, Roger C. 1985, Microcomputer study in college. What's the hold up?Computing for Business 10(3):61-64.
Sheppard, Sallie V. 1984, Computer literacy. Proc. 2nd Annual Symposium.The Electronic Campus, Texas A&M University, College Station, TX pp. 52-57.
Todt, Jules R. et al. 1981, Project 1995, Farm Credit Service: HumanResource Trends through 1995, Farm Credit Service.
Van Horn, Richard L. 1984, The electonic campus. Proc. 2nd Annual Symposium,The Electronic Campus, Texas Atim University, College Station, TX. pp. 2-16.
Wiggins, Timothy A. and Larry D. Trede, 1985, "The Effect of Teaching Methodor Student Characteristics on Achievement or Attitudes in an Ag ComputerCourse", National Association of Colleges and Teachers ofAgriculture Journal.
22

APPENDIX
Course No.Student ID(Major) Dept.(use code given on last page)
AG_ COMPUTER LITERACY ASSESSMENT IOSTRUMENT (ACLAI)
The purpose of this survey is to attempt to determine the extent ofcomputer skills of students in the College of Agriculture. Pleaseanswer all questions, but do NOT guess. PLEASE DO NOT WRITE ONTHIS TEST FORM---WRITE ONLY ON THE SCANTRON.
1. In order to use a computer, a person must know how toprogram.
a) trueb) falsec) I don't know
2. An electronic worksheet (i.e. VISICALC or SUPERCALC) hasmany rows and columns. The CRT screen is used as a windowtoobserve and manipulate entries in a selected set of rowsand columns on the worksheet.
a) trueb) falsec) I don't know
3. An operating system is an integrated system of programswhich supervises the CPU operation and controls input/outputand storage functions.
a) trueb) falsec) I don't know
4. Compilers accept a batch, or number of lines, or languagestatements and develop an executable set of machineinstructions.
a) trueb) falsec) I don't know
5. A general purpose data base management system can be usedfor a farm or ranch production record system.
a) trueb) falsec) I don't know

6. Which of the following software would be best to use if youwanted to send twenty letters, exactly the same, except forthe addressee?
a) Data Base Managementb) Word Processingc) Accountingd) Electronic Spreadsheete) I don't know
7. The computer is important in the decision making process offarmers and ranchers because the computer can:
a) store and recall large amounts of data quicklyb) perform calculations that a calculator cannotc) a and bd) I don't know
8. A computer network can be defined as:a) a number of computers "tied together" with data
lines that communicate with each otherb) a number of computers linked together to share
resources such as disk storage or printersc) a central computer with a number of terminals
hooked to itd) all of the abovee) I don't know
9. Floppy disks are:a) storage mediums for microcomputersb) usually divided into tracks and sectorsc) often capable of holding hundreds of thousands of
characters of informationd) all of the abovee) I don't know
10. Computer software is a term describing:a) computer programsb) electronic components covered with soft plasticc) people who work with computersd) electronic parts of a computer systeme) I don't know
QUESTIONS 11 AND 12 USE THE FOLLOWING LINES OF BASIC
100 LET A = 2
110 LET B = 4120 LET C = 6130 LET D = C/A +B140 7F D<= 10 THEN 170150 PRINT 'LAST LINE D = ', D160 GOTO 200170 PRINT D, C, B, A
180 LET C = C + 2190 GOTO 130200 END
242

11. How many lines of output would this segment of BASIC programprint?
a) 4
b) 5
c) 6
d) 8
e) I don't know
12. The fourth line of the output would look like ...a) 7 6 4 2b) 10 ,2 2 4
c) Last line D = 11
d) 10 12 4 2
e) I don't know
13. The following type of memory can be used for computerizedfunctions of arithmetic, program instructions supplied bythe user, data storage, and retrieval
a) RAMb) ROMc) PROMd) EPROMe) I don't know
14. Microcomputers can use the following language(s):a) FORTRANb) BASICc) PASCALd) all of the abovee) I don't know
15. In your opinion, which one of the following potential usesof the computer do you think is most important for ALLIEDAGRICULTURAL INDUSTRIES (i.e. farm equipment suppliers,wholesale florists, etc.)?
a) calculations for problem solving and decision aidsb) order processing/inventory controlc) accountingd) securing and analyzing commodity datae) I don't know
16. In your opinion, which one of the following potential usesof the computer do you think is most important forAGRICULTURAL PRODUCERS?
a) calculations for problem solving and decision aidsb) order processing/inventory controlc) accountingd) securing and analyzing commodity datae) I don't know
3 25

,
17. In your opinion, which one of the following potential usesof the computer do you think is most important forAGRICULTURAL PROCESSORS?
a) calculations for problem solving and decision aidsb) order processing/inventory controlc) accountingd) securing and analyzing commodity datae) I don't know
QUESTION 18 USES THE FOLLOWING LINES OF BASIC
100 LET A = 3
110 LET B = 4120 LET C = A + B + 4130 PRINT C140 END
18. The correct output for the segment of BASIC programmingshown above is:
a) 9
b) 7
c) 11
d) 13e) I don't know
19. A computer program is a:a) course on computersb) a piece of computer hardwarec) a set of instructions to control the computerd) I don't know
20. The physical parts of a computer are referred to as:a) softwareb) hardwarec) programsd) I don't know
21. The computer must have two types of information to solve aproblem:
a) your user number and program nameb) the problem and the solutionc) the data and instructionsd) I don't know
GENERAL INFORMATION
22. My current TAMU classification is:a) freshmanb) sophomorec) juniord) seniora) graduate student
4
2

-4
23. How many semesters have you been at TAWa) This is my first semester.b) 1 to 3 semestersc) more than 3 semesters
Personal data:24. Sex: a) male
(optional)b) female
26. Ethnic background:(optional)
25. Age range: a) 17 -.19b) 20 - 22(optional)c) 23 - 25d) 26 - 29e) over 30
a) Blackb) Hispanicc) Whited) Other
27. My current overall GPR is:a) less than 2.25b) 2.25 - 2.5c) 2.6 - 2.9d) 3.0 - 3.5e) above 3.5
28. I would describe the size of the high school I graduated from as:a, 1A (less than 135 students)b) 2A (135-274 students)c) 3A (275-649 students)d) 4A (650-1304 students)e) 5A (more than 1304 students)
29. During high school I:a) never used a computer.b) used computers in some of my classes.c) took a computer course(s).d)learned about computers through practical experience.e)attended commercial computer short courses (i.e.
Radio Shack, Computerland etc.).
30. I learned about using computers by:a) never used a computer.b) used computers in some of my classes.c)took a computer course(s) at Texas A&M or other
university.d) learned about computers through practical experience
on my own.e)attended commercial computer short courses (i.e.
Radio Shack, Computerland, etc.).
31. I would describe my knowledge of computers as:a) never used a computerb) novicec) advancedd) expert
527
32. I took computer classes in high school.a) 0
b) 1
c) 2c) 3
e) more t:'an 3
33. I have takena) 0
b) 1
c) 2
d) more than 2
computer classes at Texas A&M.
34. Are you currently enrolled in a computer class?a) yesb) no
35. I have taken computers classes other than in highschool or at TAMU.
a) 0
t) 1
c) 2d) 3
e) more than 3
36. Do you own a computer?a) nob) yes
37. I enjoy working with computersa) agreeb) disagreec) undecided
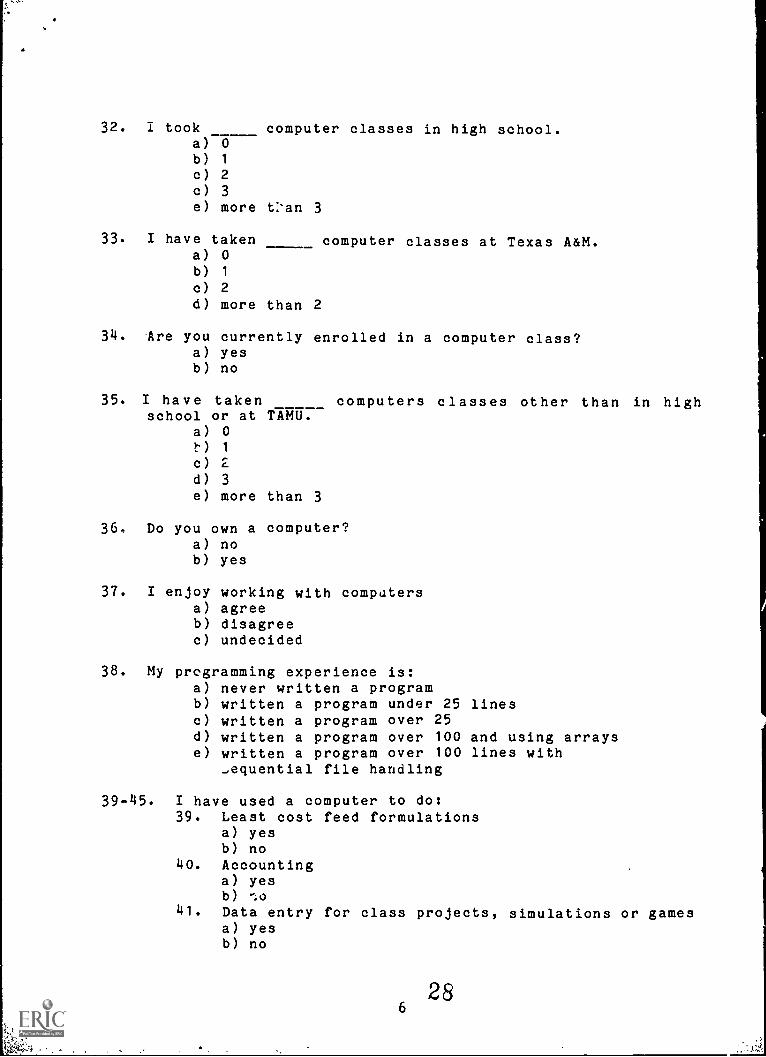
38. My programming experience is:a) never written a programb) written a program under 25 linesc) written a program over 25d) written a program over 100 and using arrayse) written a program over 100 lines with
-equential file handling
39-45. I have used a computer to do:39. Least cost feed formulations
a) yesb) no
40. Accountinga) yesb)
41. Data entry for class projects, simulations or gamesa) yesb) no
286

42. Word processinga) yesb) no
43. Spreadsheet activitiesa) yesb) no
44. Data base managementa) yesb) no
45. Othera) yesb) no
NUMBER CODES FOR CLASSIFICATION OF MAJOR:
A Agricultural EconomicsB Agricultural EducationC Agricultural EngineeringD Agricultural JournalismE AgronomyF Animal ScienceG BiochemistryH Dairy ScienceI EntomologyJ FloricultureK Food Science and TechnologyL ForestryM HorticultureN Mechanized AgricultureO Plant and Soil ScienceP Poultry ScienceQ Range ScienceR Recreation and ParksS Wildlife and Fisheries SciencesT UndecidedU Other
Developed by: Drs. P.A. Curtis, F.A. Gardner, K.E. LitzenbergTexas A & M University, 1985.
7 29

cit
A
facul
tp-isAkrad,.., -91,11,77
',:';,,.,','':'.'.',', ,., \,,': .. c '... ' - . ;
'.'"'",!,;'.
. .
-, :A.,,!..,.., ,
A ,..:4?"k i ..:-.A.t. 4,1,f ,..v, , p,?, ,. ,,, s ' , ,; ',. ,''s't
- -.'77.4,A,7-,,,,,
aPtip,,a10..a,:4..alli016119T diet,r),OUgort,without formal review by the Department of Agricultural Economics.-.7.,..4.',....)ve,m,,,,,wg,....-4*,.... .,:-. - ,, , .- . ,..
ONYk)' i .t,c,..4v.1,t,,r,...,w,'.: t, '.. ..., ..i.. , , '- .., .-, .
o3f.the exas Agrf9ulturai Experiment Station are available without regard to race-,--....... ...- ,,.......,,-;,:-:".,;,,,,,.......--;,.;...;,.. ... , ..4...!:j."
':4-1,:.'''..
, -
/-,', e fs 41, , .^
Ar7/.
.:411,..,x
' ''1
.
,.;


![Sophomore English [EX]](https://img.dokumen.tips/doc/110x75/568135aa550346895d9d18a5/sophomore-english-ex.jpg)