Embed Size (px)
Citation preview
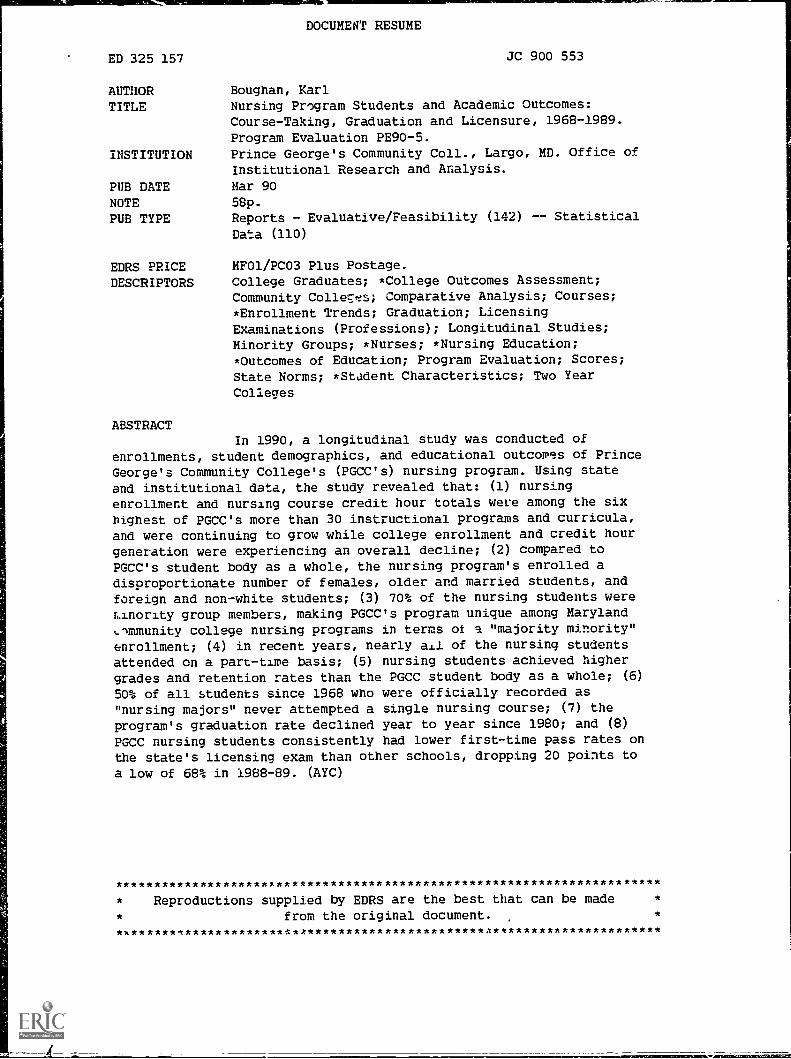
DOCUMENT RESUME
ED 325 157 JC 900 553
AUTHOR Boughan, Karl
TITLE Nursing Program Students and Academic Outcomes:Course-Taking, Graduation and Licensure, 1968-1989.Program Evaluation PE90-5.
INSTITUTION Prince George's Community Coll., Largo, MD. Office ofInstitutional Research and Analysis.
PUB DATE Mar 90
NOTE 58p.
PUB TYPE Reports - Evaluative/Feasibility (142) -- Statistical
Data (110)
EDRS PRICE MF01/PC03 Plus Postage.
DESCRIPTORS College Graduates; *College Outcomes Assessment;Community Collect!s; Comparative Analysis; Courses;*Enrollment Trends; Graduation; LicensingExaminations (Professions); Longitudinal Studies;Minority Groups; *Nurses; *Nursing Education;*Outcomes of Education; Program Evaluation; Scores;State Norms; *Student Characteristics; Two YearColleges
ABSTRACTIn 1990, a longitudinal study was conducted of
enrollments, student demographics, and educational outcomes of PrinceGeorge's Community College's (PGCC's) nursing program. Using stateand institutional data, the study revealed that: (1) nursingenrollment and nursing course credit hour totals were among the sixhighest of PGCC's more than 30 instructional programs and curricula,and were continuing to grow while college enrollment and credit hourgeneration were experiencing an overall decline; (2) compared toPGCC's student body as a whole, the nursing program's enrolled adisproportionate number of females, older and married students, andforeign and non-white students; (3) 70% of the nursing students wereLinority group members, making PGCC's program unique among MarylandLommunity college nursing programs in terms of a "majority minority"enrollment; (4) in recent years, nearly ail of the nursing students
attended on a part-time basis; (5) nursing students achieved highergrades and retention rates than the PGCC student body as a whole; (6)
50% of all students since 1968 who were officially recorded as"nursing majors" never attempted a single nursing course; (7) theprogram's graduation rate declined year to year since 1980; and (8)PGCC nursing students consistently had lower first-time pass rates onthe state's licensing exam than other schools, dropping 20 points to
a low of 68% in 1988-89. (AYC)
********************A**************************************************
* Reproductions supplied by EDRS are the best that can be made *
* from the original document. *
*X******.t*************t*A***********************A**********************

PROGRAM EVALUATION
NURSING PROGRAM STUDENTStt 10 AND ACADEMIC OUTCOMES:
COURSE-TAK1NG, GRADUATION AND LICENSURE 458-1 989C:4
PERMISSION TO REPRODUCE THISMATERIAL HAS BEEN GRANTED BY
K . BouAnan
TO THE EDUCATIONAL RESOURCESINFORMATION CENTER ERIC)
Karl Boughan
N,
PRI NCE GEORGESCOMMUNITY COLLEGE
Program Evaluation PE90-5
prepared by the
Office of Institutional Research and Analysis
March 1990 U S 'APARTMENT OF EDUCATIO::I .1 0-7c i7Pc.e,V.
EOU( ATONAk RE SOUPCES INIORt $1')N( NUR ,(441(
"as trer eps,4t, PA ASlot O wOrl 000 n` to,'So o o'ogOnottiftoon
o oo,jonAfonQ
o Mono, o hangec NaP tv.o, mail.. to root000 me
oog000lott form 4,aI tv
Pot.rott, f opo. o r to,o, 40(mono 0 ot no, OSStotnoto oot oSono on, o( If tw,S1 ton oEt polo ot

111
PRINCE GEORGE'S COMMUNITY COLLEGEOffice of Institutional Research and Annalysis
NURSING PROGRAM STUDENTS AND ACADEMIC OUTCOMES:COURSE-TAKING, GRADUATION AND LICENSURE 1968-1989
Program Evaluation Report PE90-5
Introduction
Nursing has always been an attractive career option forcommunity college stuchmts. Currently, more than 185,000 studentsare enrolled in 1,450 nursing programs in the United States, 55percent of which are pursuing Associate of Arts in Nursing degrees.Not only does nursing offer professional status, relatively aoodincome and the opportunity to make a vital contribution to society,but it also provides fairly ready access to graduates of two-yeardegree programs. Recently, its attractiveness has been enhancedeven more by what amounts to an explosion of the nursing jobmarket. Lately, fewer Bachelor of science in Nursing graduates arebeing produced by four-year institutions, a reflection of thenursing profession's waning ability to compete with theremuneration and prestige offered today's young women by manycareer paths formerly open only to men. Also within the lastdacade, dramatic structural changes in the nation's medicaldelivery system has had a discouraaing impact on the recruitmentand retention of all health health ix-ofessionals, nurses included.As a consequence of both trends, a very wide "nursing gap" has beenopened up country-wide, which also can be seen in effect locally.A summary article in recent Washington Post job market reviewdevoted entirely to health career opportunities [Welch/1989, p.335; see Appendix for full citations] estimated a national short-fall of nursing graduates of 257,000 by 1990, with the GreaterWashington area experiencing its proportionate share.
Prince George's Community College has always recognized theimportant career path potential nursing held for its occupation-seeking students, and has over the years built up the singlelargest two-year nursing program in Maryland in terms of creditenrollment. It has also, of course, strived to match quantity withquality, as much more difficult goal to accomplish and track.
This report will discuss the findings of an detailed OIRAstudy of all PGCC nursing students 1968-1989, focusing on the issueof the quality of the performance of the College's Nursing Programin moving its charges from declaration of nursing pajor through tothe passing of the registered nwtsing licensure examination. Thestudy is unprecedented in the scope of time span covered, numberof students included and in ti;e amount of effort expended to createthe most accurate, realistic prct4ram outcome measures possible.
1
3
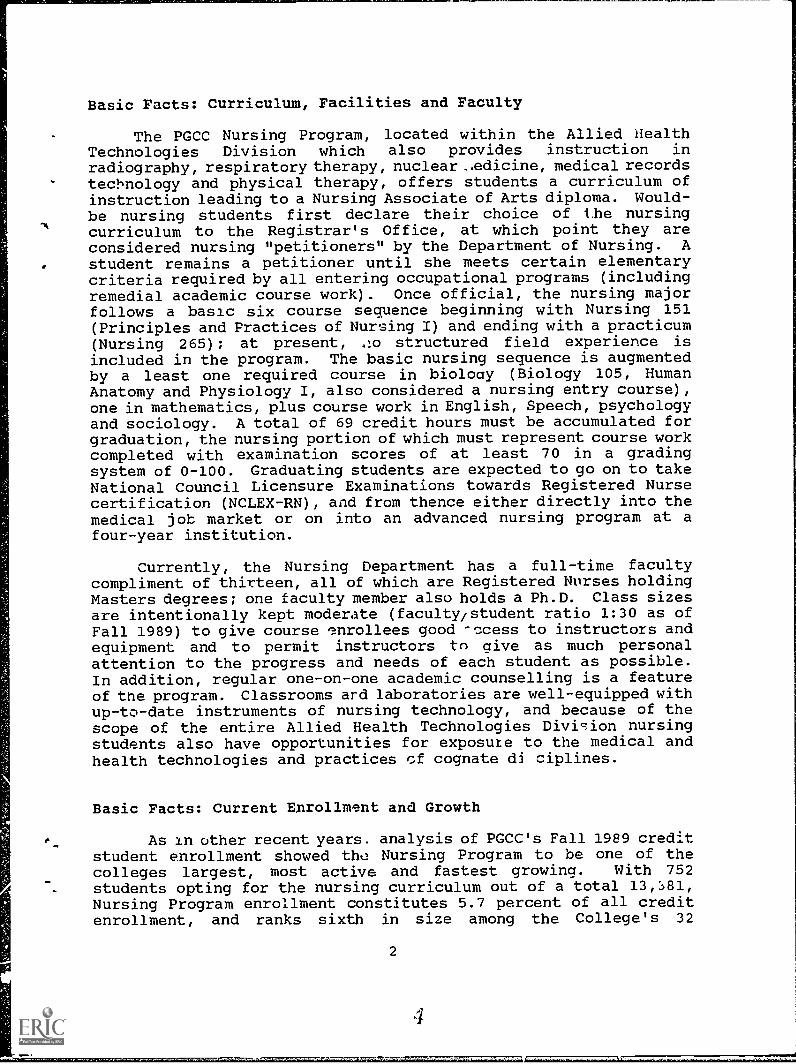
Basic Facts: Curriculum, Facilities and Faculty
The PGCC Nursing Program, located within the Allied HealthTechnologies Division which also provides instruction inradiography, respiratory therapy, nuclear .,edicine, medical recordstecl,nology and physical therapy, offers students a curriculum ofinstruction leading to a Nursing Associate of Arts diploma. Would-be nursing students first declare their choice of the nursingcurriculum to the Registrar's Office, at which point they areconsidered nursing "petitioners" by the Department of Nursing. Astudent remains a petitioner until she meets certain elementarycriteria required by all entering occupational programs (includingremedial academic course work). Once official, the nursing majorfollows a basic six course sequence beginning with Nursing 151(Principles and Practices of Nursing 1) and ending with a practicum(Nursing 265); at present, o structured field experience isincluded in the program. The basic nursing sequence is augmentedby a least one required course in bioloay (Biology 105, HumanAnatomy and Physiology I, also considered a nursing entry course),one in mathematics, plus course work in English, Speech, psychologyand sociology. A total of 69 credit hours must be accumulated forgraduation, the nursing portion of which must represent course workcompleted with examination scores of at least 70 in a gradingsystem of 0-100. Graduating students are expected to go on to takeNational Council Licensure Examinations towards Registered Nursecertification (NCLEX-RN), and from thence either directly into themedical job market or on into an advanced nursing program at afour-year institution.
Currently, the Nursing Department has a full-time facultycompliment of thirteen, all of which are Registered Nurses holdingMasters degrees; one faculty member also holds a Ph.D. Class sizesare intentionally kept moderate (faculty/student ratio 1:30 as ofFall 1989) to give course ,mrollees good -ccess to instructors andequipment and to permit instructors to aive as much personalattention to the progress and needs of each student as possible.In addition, regular one-on-one academic counselling is a featureof the program. Classrooms ard laboratories are well-equipped withup-to-date instruments of nursing technology, and because of thescope of the entire Allied Health Technologies Diviion nursingstudents also have opportunities for exposure to the medical andhealth technologies and practices cf cognate di ciplines.
Basic Facts: Current Enrollment and Growth
As in other recent years. analysis of PGCC's Fall 1989 creditstudent enrollment showed the Nursing Program to be one of thecolleges largest, most active and fastest growina. With 752students opting for the nursing curriculum out of a total 13,81,Nursing Program enrollment constitutes 5.7 percent of all creditenrollment, and ranks sixth in size among the College's 32
i.
2
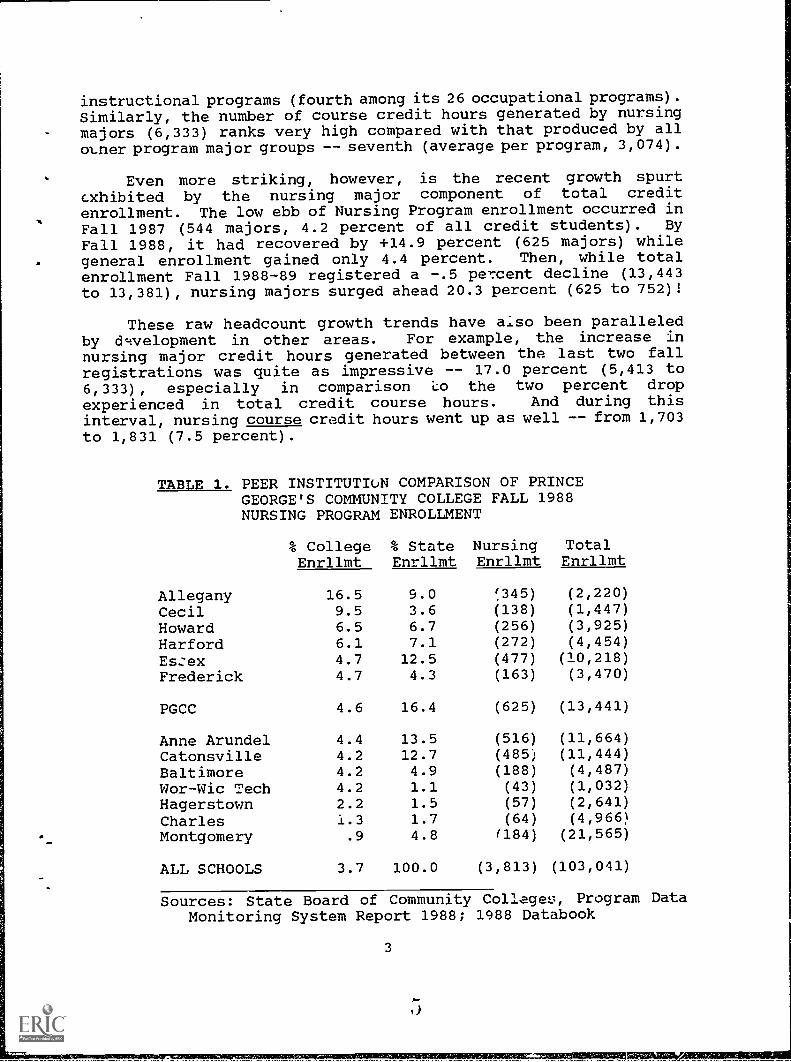
instructional programs (fourth among its 26 occupational programs).Similarly, the number of course credit hours generated by nursingmajors (6,333) ranks very high compared with that produced by all()trier program major groups -- seventh (average per program, 3,074).
Even more striking, however, is the recent growth spurtexhibited by the nursing major component of total creditenrollment. The low ebb of Nursing Program enrollment occurred in
Fall 1987 (544 majors, 4.2 percent of all credit students). By
Fall 1988, it had recovered by +14.9 percent (625 majors) whilegeneral enrollment gained only 4.4 percent. Then, while totalenrollment Fall 1988-89 registered a -.5 percent decline (13,443to 13,381), nursing majors surged ahead 20.3 percent (625 to 752)!
These raw headcount growth trends have aiso been paralleledby dwelopment in other areas. For example, the increase innursing major credit hours generated between the last two fallregistrations was quite as impressive -- 17.0 percent (5,413 to6,333), especially in comparison *co the two percent drop
experienced in total credit course hours. And during thisinterval, nursing course credit hours went up as well -- from 1,703to 1,831 (7.5 percent).
TABLE 1. PEER INSTITUTIoN COMPARISON OF PRINCEGEORGE'S COMMUNITY COLLEGE FALL 1988NURSING PROGRAM ENROLLMENT
% CollegeEnrllmt
% StateEnrllmt
NursingEnrllmt
TotalEnrllmt
Allegany 16.5 9.0 !345) (2,220)
Cecil 9.5 3.6 (138) (1,447)
Howard 6.5 6.7 (256) (3,925)
Harford 6.1 7.1 (272) (4,454)
Es:ex 4.7 12.5 (477) (10,218)
Frederick 4.7 4.3 (163) (3,470)
PGCC 4.6 16.4 (625) (13,441)
Anne Arundel 4.4 13.5 (516) (11,664)
Catonsville 4.2 12.7 (485) (11,444)
Baltimore 4.2 4.9 (188) (4,487)
Wor-Wic Tech 4.2 1.1 (43) (1,032)
Hagerstown 2.2 1.5 (57) (2,641)
Charles 1.3 1.7 (64) (4,966)
Montgomery .9 4.8 (184) (21,565)
ALL SCHOOLS 3.7 100.0 (3,813) (103,041)
Sources: State Board of Community Colleges, Program DataMonitoring System Report 1988; 1988 Databook
3

PGCC Nursing Program weight, however, should be placed withinthe larger state context to be fully appreciated. Table 1 abovedisplays figures on nursing program enrollment for PGCC and itsthirteen Maryland peer institutions, for the latest available data
-- Fall 1988. Even before its substantial numerical upswing in
1989, PGCC's nursing program is shown as having the single largestcommunity college nursing major headcount in the state,
representing almost one of every six nursing majors enrolled at
state two-year institutions (16.4 percent). Furthermore, PGCC'spercent nursing enrollment against total college enrollment of 4.6(Fall 1988) well exceeded the all-peer institution major vs. totalenrollment percentage of 3.7. It must be added, however, that sixother community colleges outstripped Prince George's in nursingmajor proportions of total college enrollment. For example, firstranked Allegany Community College claimed that about one in six of
its enrollees (16.5 percent) was following a nursing A.A.
curriculum. On the other hand, another look at Table 1 indicatesthat the top four colleges according to nursing major enrollmentproportion, including Allegany, are all relatively smallinstitutions (unde4. 5,000 students) while the next five, including
PGCC, are with one exception large institutions with fallenrollments averaging over 10,000 students. It would seem that themore comprehensive curricular range which larger institutions offerstudents mostly accounts for their somewhat smaller proportions of
nursing majors.
Nursing Students at PGCC: What are They, Who are They?
At first blush, it might seem that the definition of a nursingstudent is non-problematical: nursing student =- nursing major, what
else? But dee,?.r analysis reveals that answering the question ofwhat constitutes genuine pursuit of a course of nursing studywithin a community college context is anything but simple.
Essentially, the problem is this: Prince George's CommunityCollege, not atypical in this regard, is an open-enrollment schoolwhich accepts students of widely differing levels of collegiatereadiness, clarity of personal goals and occupational commitment.This means relatively easy access to occupational instruction
programs but also many problems in maintaining and trackingretention -- especially when it comes to more academicallydemanding programs like Nursing. In other words, not all who maysign up for a program are serious, not all who may be serious arein an academic or personal position to stick it out, and not allwho may attempt to stick it out can afford to do so in theconventional two-years straight-through style. When one adds toall this a "student-friendly" academic status tracking system whichleaves registering changes in program major up to the studentsthemselves, one begins to see the real dimensions of the analysis
problem. Since the core of any instructional program evaluationis a program outcome analysis (student success in terms of
4

graduation ratas, etc.), and since the results of any outcomeanalysis is so dependent upon how students-in-the-procram is
defined, this report will utilize and assess several differentconcepts of "nursing student", some standard and some innovative,in order to gain the most realistic picture possible of how wellPGCC's nursing program has been performing.
Who are the Nursing Majors? The "nursing major" concept ofnursing student is first for review. Table 2 below displays thedemographic and academic category percentage break-downs for allPGCC fall enrollees (1985-1989) who in their most recent move toinform the Registrar's Office of study subject preference indicated"nursing" as their curriculum choice. (Figures in parentheses areratios of category nursing percentages to corresponding totalenrollment percentages, and thus indicate comparative nursingdisproportions.)
TABLE 2. PGCC NURSING MAJORS BY DEMOGRAPHIC AND ACADEMICCATEGORIES
1989
- FALL ENROLLMENTS
1988 1987
1985-1989*
1986 1985
Female 93 (1.49) 94 (1.53) 94 (1.52) 95 (1.54) 93 (1.54)
Male 8 ( .20) 6 ( .16) 6 ( .17) 6 ( .14) 7 ( .17)
White 32 ( .69) 35 ( .72) 40 ( .77) 45 ( .83) 50 ( .89)
Black 59 (1.26) 59 (1.32) 53 (1.28) 49 (1.24) 45 (1.18)
Other 9 (1.25) 6 ( .94) 7 (1.06) 7 ( .99) 6 ( .89)
< 21 24 ( .71) 24 ( .69) 27 ( .76) 34 ( .85) 28 ( .84)
21-25 25 (1.07) 25 (1.08) 25 (1.09) 24 (1.15) 29 (1.17)
26-35 30 (1.31) 32 (1.40) 31 (1.41) 25 (1.24) 29 (1.24)
36-60 21 (1.24) 19 (1.13) 16 (1.00) 15 (1.01) 14 ( .89)
> 60 - ( .00) - ( .00) * ( .07) - ( .00) - ( .00)
Single 65 ( .88) 67 ( .92) 68 ( .93) 68 ( .94) 67 ( .94)
Married 35 (1.32) 33 (1.23) 32 (1.19) 32 (1.16) 34 (1.16)
US Cit 86 ( .91) 88 ( .93) 91 ( .96) 92 ( .98) 92 ( .97)
Non-Cit 14 (2.31) 12 (2.08) 9 (1.67) 8 (1.40) 8 (1.44)
Flltime 22 ( .88) 28 (1.01) 30 (1.07) 26 ( .95) 28 (1.02)
Prttime 78 (1.04) 73 (1.00) 70 ( .97) 74 (1.02) 73 ( .99)
New 16 ( .72) 21 ( .89) 18 ( .66) 17 ( .67) 15 ( .60)
Cont. 58 (1.22) 58 (1.26) 63 (1.35) 66 (1.39) 68 (1.3')
Trnsfer 13 (1.11) 10 ( .85) 7 ( .77) 6 ( .60) 6 ( .7._)
Readmit 12 ( .69) 11 ( .59) 12 ( .70) 11 ( .62) 11 ( .62)
NOR,ENRL 752 [5.6] 625 [4.6] 544 [4.2] 561 [4.5] 677 [5.3]
5

Looking first at the 1989 column, we notice above all theextreme disproportion of women students among nursing major::: (93
percent) which is the reason why "she" and "her" are used in thisevaluation when pronominal terms are called for. In the entirestudent body, women are disproportionately represented (62 percent)but traditional occupational gender-linkage here produces a sub-.
set of students who are almost 50 percent more female than thewhole (ratio 1.49).
Although the sex imbalance is not surprising, what might be
- considered so is the large majority of non-whites (68 percent;black 59 percent) among PGCC nursing majors. This stands outagainst state nursing student statistics which show blacks andother non-whites as a small minority of all currently pursuingnursing A.A.s and B.S.s. To some degree this disproportionreflects the unique overall character of the PGCC credit studentbody (54 percent non-white) and surrounding county (51 percent non-white), but not entirely since the non-white nursing major ratesignificantly exceeds even these levels (non-white ratio 1.25).PGCC nursing majors also show another ethnic distinction -- theyare well over twice as likely to be non-citizens (ratio 2.31) thanstudents on average. Even so, non-citizen nursing majorsconstitute only a very small minority component of this group (14percent). Another departure from the norm is nursing student agedistribution, which is mildly but definitely skewed to the upperend: Age 26-35 ratio -- 1.31; Age 36-60 ratio -- 1.24. However,in straight percentage terms Under-26-Year-Olds still make upalmost half of all nursing majors (49 percent). A related findingof Table 1 is the disproportion of married nursing majors (ratio1.32).
In academic terms, the average nursing major is a bit lesslikely to be studying full-time than the randomly selected student(ratio .88), tends less to be a newcomer to college and to PGCC(ratio .72), and more to be a transfer in from some other highereducational institution (ratio 1.11). Most outstandingly, however,is the likelihood that she will be a hold-over from a previoussemefter. Continuing students make up 58 percent of Fall 1989'scrop of nursing majors, a proportion well above the norm (ratio1.2:1).
The nursing major demographic and academic profile justsketched seems to be one quite stable or only slightly alteringover time, with one exception. Table 2 shows no discernable trendsfrom Fall Enrollment 1985 to Fall Enrollment 1989 for gervier andmarriage status whatever, and no real change in the proportion offull-time students until the last term considered. Snail's paceincreases over time seem to be registering for the proportion ofstudents aged over 26 years and foreign majors, while gradually thepercentage of continuing nursing majors has dropped from 68 to 58
percent. The dramatic exception is racial balance. The proportionof white students registered in the nursing curriculum has been
5
slipping roughly 4.5 points with each fall enrollment, plummetingfrom 50 percent in 1985 to only 32 percent most recently.
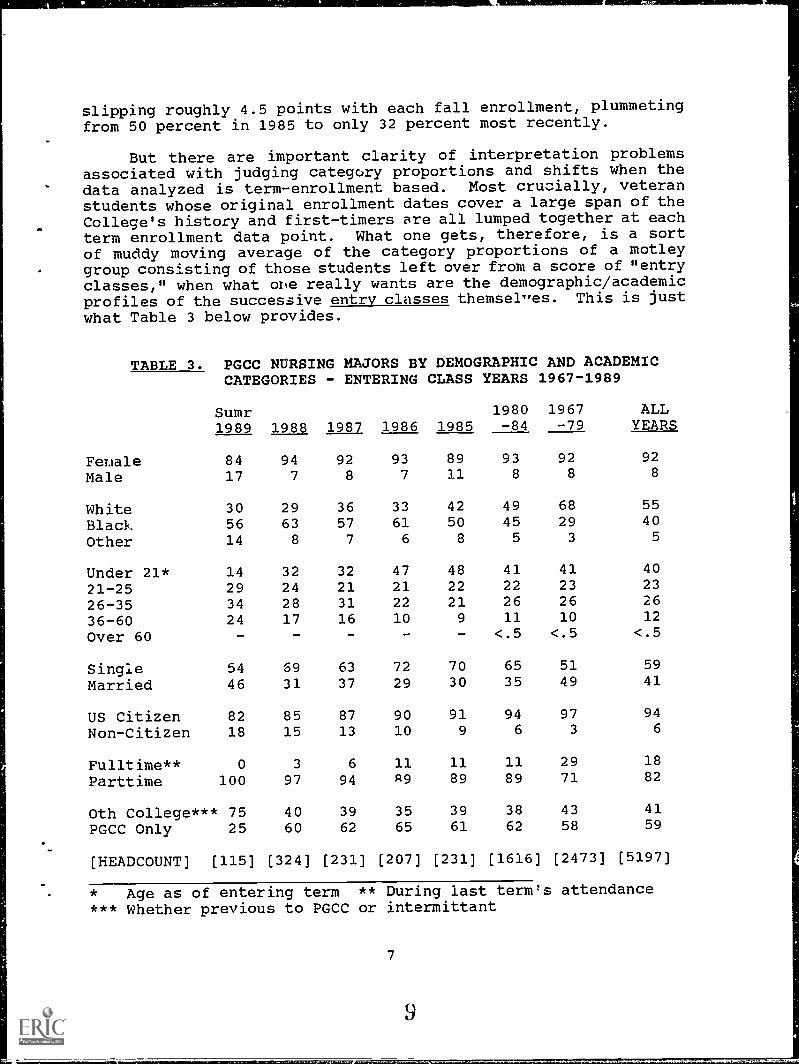
But there are important clarity of interpretation problemsassociated with judging categcxy proportions and shifts when thedata analyzed is term-enrollment based. Most crucially, veteranstudents whose original enrollment dates cover a large span of theCollege's history and first-timers are all lumped together at each
term enrollment data point. What one gets, therefore, is a sortof muddy moving average of the category proportions of a motley
- group consisting of those students left over from a score of "entryclasses," when what one really wants are the demographic/academicprofiles of the successive entry classes themsel,res. This is justwhat Table 3 below provides.
TABLE 3. PGCC NURSING MAJORS BY DEMOGRAPHIC AND ACADEMICCATEGORIES
Sumr1989 1988
- ENTERING CLASS YEARS
19801987 1986 1985 -84
1967-1989
1967 ALL-79 YEARS
Fenale 84 94 92 93 89 93 92 92
Male 17 7 8 7 11 8 8 8
White 30 29 36 33 42 49 68 55
Black 56 63 57 61 50 45 29 40
Other 14 8 7 6 8 5 3 5
Under 21* 14 32 32 47 48 41 41 40
21-25 29 24 21 21 22 22 23 23
26-35 34 28 31 22 21 26 26 26
36-60 24 17 16 10 9 11 10 12
Over 60 - - - - - <.5 <.5 <.5
Single 54 69 63 72 70 65 51 59
Married 46 31 37 29 30 35 49 41
US Citizen 82 85 87 90 91 94 97 94
Non-Citizen 18 15 13 10 9 6 3 6
Fulltime** 0 3 6 11 11 11 29 18
Parttime 100 97 94 R9 89 89 71 82
Oth College*** 75 40 39 35 39 38 43 41
PGCC Only 25 60 62 65 61 62 58 59
[HEADCOUNT] [115] [324] [231] [207] [231] [1616] [2473] [5197]
* Age as of entering term ** During last term's attendance*** Whether previous to PGCC or intermittant
7

Whereas Table 2 was based upon several independent data sets(one per each fall term 1985-89), Table 3 is established upon asingle data file called TAB, which contains unduplicatedobservations on every credit course-taking PGCC student virtuallyfrom the beginning of this institution down to the term (Summer II1989) just preceding the present one (Fall 1989). F':om thisimmense set, a sub-set was selected for analysis consisting of allnursing majors from Summer I 1968 term onwards. TheJe were then
grouped into five "entering class years" (all students whoseoriginal terms of attendance fell within a single Summer
-I/II/Fall/Spring academic year), plus two longer period groupsrepresenting pre-1985 entrants. (It should be noted that "1989"is an immature entry year covering Summer terms I and II only, andtherefore should be interpreted with caution.)
Comparing Table 3 to its predecessor we observe largely thesame basic patterns of distribution across categories and over timebut often in a more emphatic form. In particular, the racialeffect appears much more pronounced. The last two entry classesexhibit a white minority of considerably less than one-third of allnursing majors, down from about two-fifths (42 percent) in the 1985
entry class. The extent of this decline is even more impressivewhen pre-1985 data is considered: almost half of 1980-24 enteringnursing majors were white (49 percent), and over two-thirds werein the pre-1980 period (68 percent). Also, the upward trend inproportions of students from outside the U.S. seems sharper (9
percent in 1985, 18 percent in 1989), as does the decline in thenumbers of younger nursing majors (48 percent in 1985, 32 percentin 1988, and with the caveat mentioned above 14 percent in 1989).
But perhaps the single most noteworthy trend detected in Table
3 has to do with full-time/part-time status. It would appear thatonce the "carry-over" effect of Table 2 is eliminated what emergesis a picture of the almost wholesale abandonment of fuli-time studyby more recent nursing major entrants: since 1987, fewer than 5percent of entering nursing majors can be called full-timers, a
statistic unchanged even when students taking non-countingderelopmental courses are removed from the analysis. A partialexplanation, however, may be the sharp revision in studentcounselling policy adopted by the nursing faculty in 1987. In thelast three years students haN'e been strongly advised to limitcredit hours in their initial and final terms to minimize academicstress at the start and allow for post-graduate preparations at the
finish.
uStudyingn Nursing Majors: What are They, Who are They?
One of the peculiarities of PGCC's student tracking systemis that registering changes in curriculum pursued is entirely upto the students hemselves. Students who objectively switch fromone course of study to another without informing the Registrar's
8
1 0
Office will continue to besubject -- even if they achisecond or some subsequmisclassification is usuallybecause it is assumed thatextremely infrequently. Such adangerous in the case of studentmore academically demanding inNursing, where one might expect aout among the less gifted or motiv
recorded as "majors" in the originalve A.A. degrees or certificates in theent subject. This chance fordiscounted in the College's researchdiscrepancies of this sort occur
assumption, however, may be veryinitially pursuing the College'sstructional programs, such ashigher than usual rate of drop-ted.
In order to guard against the inour analysis, a strategy was devisedThe strategy called for definingobjective course-taking and progrLogically, any student on record as a nattempted even one entry-2avel nursing c
clusion of "pseudo-majors" into isolate them in 'Advance.seudo-majors in terms ofam comPletion criteria.ursing major who had neverurse (NUR 151 or BIO 105)
before her last known term at PGCC is apseudo-major title, or at very least theAlso, there may appear a residual group ofwho while still without nursing course entryattendance at PGCC. These can be termed "Pe
prime candidate for thetitle "Unbagun Major."ecorded nursing majorshave not yet left offding Majors."
Then, to follow the logic through, recordehave attempted at least one entr -level course
d nursing majors whocan be considered
"real" or "studying" nursing majors. Meeting this positivecritel.ion does not, of course, guarantee that a stud:ring major hasactually passed her entry course let alone gone on to success in
the nursing program. But it does separate off if rather liberallythose nursing majors who are now or have in the past been genuinely
"in-the-program."
Table 4 (p. 11) displays the demography and academic categorydistrinutions for all 2,815 studying nursing majors attending PGCC
at some point since 1968. The Table's columns represent studyclass year sub-sets, analogous to the entry class years of Table3, the main difference being that "entry" in this case me ns entryupon nursing study (the timing of the first entry-level nursingcourse attempt), not entry upon general study (the timing of firstattendance at PGCC) -- although, of course, in a few instances astudent nurse's entry and study class years may turn out to be
identical. Also, since the studying major group by definitionhas some level of academ:x experience it seems appropriate at thispoint to introduce in Tible 4 four course performance variab esnot previously utilized -- Duration of Nursing 5.,:tudy, General GradePoint Average, GPA for nursing courses only, and DevelopmentalCourse-taking. (The two GPA measures are expressed here as ifletter grades rather than average numerical scores to facilitate
interpretation. Study Duration counts the number of terms -- fourper year -- passed from the first term of nursing study (entrycourse attempt) through to the last term of attendance.)
9
11

The first point to be grasped from Table 4, before anydiscussion of category distributions, is global -- only 2,815 ofour 1968-1989 set of 5,241 PGCC nursing majors qualify as studyingmajors (54 percent)! Almost half of all nursing majors in oursample prove to be "unbegun." A handful (under 3 percent) arestill "pending," but most are those who left PGCC before eventrying to aet into the nursing program beyond stating a major.
This need not necessarily be taken as an indication of theweakness of nursing as a study at PGCC, either absolutely orrelatively. No one really knows how Auch normal undeclaredshifting around of area of study exists at PGCC. And moreimportantly it is only to be expected that a demanding, qualityprofessional program will daunt many, which is as it should be.
Nursing is serious business. Much of the shock value offinding comes from .s unexpectedness. Standard analysis has neverlooked for this phenomenon before, so naturally it never found it.
But it may have been operative all along -- and not just at PrinceGeorge's Community College but at our peer institutions and othersoffering nursing programs as well.
Also, while the finding deflates our sense of the size ofPGCC's nursing program, J.t works in reverse on our sense of thesuccess of the program. One might argue that the number of genuinestudents of nursing -- those truly in the program -- ought to bethe denominator of all realistic formulas measuring program
performanc..e, not merely the number of declared nursing majors.Thus the finding -- truthfully -- tends roughly to double oursuccess ratings.
But the finding should give us some qualms as well. "Unbegun"majors, after all, did expreEs enough early interest in nursing asa career to take the first step -- inform educational authoritiesof their intentions to study. Some, perhaps many, had they t.kenthe second step of beginning course work, might have gone on to
graduate and become credits to the profession. Is the high numberof "unbegun" majors at PGCC an indication of an access problem in
the program? Maintaining both high standards and fair access isalways an agonizing balancing act. In glowing recognition of theimportance of the latter the Nursing Division has within the last
few years undertaken several projects to enhance access and
encourage retention -- for example, the Nursing EducationalPreparation Program (or NEPP). The proportion of "unbegun" nursingmajors suggests that such efforts should be strengthened andbroadened, and that more research be carried out in support of them
and in an attempt to identify more clearly the nature and
implications of the "unbegun" phenomenon.
10

Male
TABLE 4. PGCC STUDYING NURSING MAJORS BY DEMOGRAPHIC ANDACADEMIC CATEGORIES - STUDY CLASS YEARS 1968-89*
1980 1967 ALL1988 3987 1986 1985 -84 -79 YEARS
10 8 5 6 8 7 7
White 37 49 51 56 66 78 68
Black 55 45 45 36 29 19 28
Other 8 6 4 8 5 3 5
Under 21 32 38 48 46 45 40 41
21-25 26 22 15 21 19 22 21
26-35 29 31 26 23 26 26 27
36-60 14 9 11 10 10 12 11
Over 60 - - - - - <.5 <.5
Married 41 38 34 30 37 52 44
Non-Citizen 16 7 4 7 4 3 5
Fulltime (1) 3 12 19 20 17 47 30
<1Yr Study (2) 70 9 8 8 6 5 10
1 - <2 Yrs 30 78 23 35 25 36 362 - <3 Yrs - 13 67 37 40 37 36
3 - <4 Yrs 2 18 13 9 9
4 Ys Plus - - 2 15 13 11
Oth College (3) 6I 46 43 46 46 47 48
.1l Crs: A/B (4) . 24 19 25 25 31 27
All Crs: C 59 57 61 59 58 58 57
All Crs: D 15 13 16 11 13 7 10
All Crs: D-/F 10 6 4 5 5 4 5
Nur Crs: A/B (5) 21 32 26 30 25 37 32
Nur Crs: C 54 46 53 58 57 53 54
Nur Crs: D 19 18 16 10 15 8 11
Nur Crs: D-/F 6 4 5 2 3 2 3
No Pass Grde (6) 57 33 31 20 25 16 24
Dev Crs: 1+ (7) 29 34 39 34 33 23 28
[HEADCOUNT [175] [140] [1:37] [119] [820] [1384] [2815]
* Too few in 1989 to percentage 1-Last Registered Term Only2-First Nurs. ClIrse to Last Term 3-Any Non-PGCC Experience4-All Courses GPA (Letter Grade Equivalents B=3.0/C=2.0/D=1.0)5-All-Nursing Courses GPA 6- At least 1 Nursing Course7-Students with at least 1 Developmental Course attempted
11
13

As to the category distributions themselves, for the commonvariables Table 4 by and large repeats the patterns by now familiar
from Tables 2 and 3: extreme under-representation of males,significant drop off of students under age 26, increase in theproportion of marrieds since 1935, sustained growth of the non-white segment into a strong majority along with recent discernableinfluxes of overseas students, disappearing full-time study ardsudden important jump :n the percentage of students with non-PGCCexperience within the last few years.
But the new course work-based variables deepen the picture.Student nurse general academic performance compares well with thatof all credit students 1968-1989. Overall, studying nursing majorsregistered an all-courses grade point average equivalent to about
a (2.49); tha corresponding general student GPA was 2.05. Thespread of studying major course performanca, expressed in GPAintervals set to letter grades, centered on the median C-range (57
percent), while over a quarter averaged A or B grades (27 percent);only 5 percent tended to receive course grades in the failure
range. Furthermore, this distribution has remained relativelystable through the years and up to the present.
The variable measuring nursing course performance, besidesbeing based cxclusively on nursing course grades, varies somewhatfrom the computational strategy of general GPA. The intent indesigning this variable was to gauge fundamental academic abilityin dealing with the substantive content of nursing courses, apartfrom qualities like willingness to work hard and perseverance.Many students manage after several attempts to achieve respectablepassing grades in challenging courses, but only the most talenteddo so on their initial effort. Therefore, cumulative nursing GPAhere reflects only first received letter grades F through A. In
addition, we should mention that only grades in NUR-prefixedcourses were included in the calculation; though other courses --for example, those in biology -- are relevant to the nursingprogram, they were considered lass central to the measurement ofessential nursing talent. F.nally, Table 4 provides a fifth
category (No Passing Grade) which requires explanation. "No
Passing Grade" was calculated apart from the regular F-Apercentages, and includes all studying nursin majors who to datehave received no grade other than F or who have gott,n only non-counting results from course attempts (e.g., "withdraw"). Thepurpose here was to isolate and fix the proportion of studyingmajors who were essentially stalled or balked in their programprogress by the height of the academic hardles with which tuay wereconfronted.
The mean nursing GPA turns out to be very close to the general
GPA for studying nursing majors 1968-89 -- 2.51 to 2.49,respectively, as are the comparable grade interval distributions.As before, the median category was C (c4 percent) with 32 percent
12
tr,ir
1 4
at the B/A and 3 percent at the F/D- extremes. This is a littlesurprising because one might have expected either a significantlyhigher general GPA (suggesting the greater difficulty of a
concentrated professional program) or a discernably higher nursingGPA (suggesting greater interest and motivation).
But by far the most interesting finding has to do with thepercentage of .tudent nurses who occupy the No Passing Gradecategory. Over the years, almost one in four (24 percent)qualified as a balked maior, a nursing student who simply couldnot get through her entry-level courses. Furthermore, thispercentage seems to be slowly growing -- from 16 percent for the1968-79 period to 33 percent for the 1987 study class. (The 57percent figure for 1988 is unreliable as an estimator of the balkedeffect, since many in this late entry class are likely to be stillin the process of acquiring their first counting nursing grades.)
The segment of all nursing majors (Unbegun as well asStudying) who found it necessary or desirable to take at least onedevelopmental course accounted for .9 percent of the whole. Thisfigure is quite high compared with a..1 students of whatever majorover the years being considered (22 percent), and demonstrates theexistence of a relative lack of academic preparedness workingagainst those who come to PGCC to study nursing. Table 4 showsthat even though nursing majors who manage to begin taking nursingcourse tend to be the somewhat more acadenically fit among allnursing majors, still almost one in three (28 percent) laborsagainst some serious deficiency in mathematics, English usage orreading ability. On the positive side, the table data give no realindication that the proportion of developmental course-takers isincreasing with each study class.
Finally, Table 4 allows us to gauge nursing study duration -- the number of terms and years once nursing course-taking begirsbefore either graduation, other PGCC attendance termination, or upto the present in the case of continuing students. About 10percent (all studying majors 1968-89) were or have been in nursingcoarse study for less than one year; about the same proportion (11percent) fell into the other extreme -- study duration of four ormore years. The median intervals were 1-2 and 2-3 years (36
percent each). In raw mean duration terms, the hypotheticalaverage studying major spent 2.07 years pursuing PGCC's nursingprogram (one year = four possible terms set at .25 each).Naturally, part-time students tend to take longer than do full-timers, but interestingly the difference in mean duration is notthat great 2.14 to 1.90, respectiN ,ly. The explanation for therelative smallness of the gap can be grasped easily from thefollowing interval data:
13
1 5

Less than 1 Year1 up to 2 Years2 up to 3 Yeals3 up to 4 Yeate"4 or more Yeark,
Full-time Part-time
7 %46 %39 %5 %3 -%
24 %24 %30 %10 %12 %
Unsurprisingly, very few full-time studying mdjors (8 percent)spent over three years in PGCC's nursing program whia 22 percentof the part-timers did. But counter-intuitively, ovel three timesas many part-timers as full-timers left the program tefore fourterms were up (24 to 7 percent). It would seem that the principlecause of restricted study -- time scarcity and personal rressIlres -- also works to short-circuit the nursing program careers of alal3e minority of part-timers, perhaps a quarter of them.
Nursing Program Outcomes: Academic Sucaess Measures 1968-1989
There are many ways of conceptualizing and measuringoccupational program "success." First, it is desirable to makedistinctions among three broad types of progran success:
A. Success measured by Objective Academic Outcomes(e.g., Nursing A.A. Graduation rate)
B. Success measured by Objective Occupational Outcomes(e.g., Job Placement rate among Graduates)
C. Success measured by Subjective Client Evaluation(e.g., Student/Employer satisfaction responses)
In this report, only academic outcomes will be considered,formulated in terms of a series of progressive steps leading to thecapstone of nursing program academic achievement -- the passing 3fthe National Council Licensure Examination for Registered Nursingor NC ,EX-RN. The sequential steps and associated rates of
achievment to be discussed are:
1. From non-studying to studying nursing major2. From studying major to Nursing A.A. graduate3. From graduate to registered nurse via successful passage
of the NCLEX-RN
Step 1: Conversion to Studying Major. Actually embarking upona course of nursing study represents the first real step along thepath leading to becoming a registered nurse. It is the conversionof mere intention into positive action.
14

TABLE 5. PROGRESSIVE TYPESACADEMIC CATEGORIES
UnbegunMajors-1
8
40555
38242512
<.5
OF NURSING MAJORS- ALL YEARS
Balked ProgressingMa'ors-2 Ma'ors-3
BY DEMOGRAPHIC(1968-3989)
AllMajors
AND
Male
WhiteBlackOther
Under 2121-2526-3536-rOve? 60
10
51436
4421259
-
7
73234
40212712.5
8
55405
40232612
<.5
Married 37 36 47 41
Non-Citizen 8 7 4 6
Fulltime/LT 5 7 38 19
Oth College 33 47 49 41
All Crs: B/A 17 20 29 23
All Crs: C 21 37 64 41
All Crs: D 18 22 6 14
All Crs: D-/F 43 22 <.5 23
Devl Crs: 1+ 52 39 24 39
[HEADCOU14T] [2409] [E 4] [2148] (5241]
(% cf TOTL) (46) (41) (100)
* See Table 3 for Row Category Descriptions1-Never took a single Nursing course2-At least 1 Nursing course but no passing grades (> F)3-At least 1 Nursing course and 1 passing grade (> F)
Table 5 above shows the overall percentage of nursing majors1968-89 failing to take this step (Unbegun Majors) and those whodid and proceeded to cumulative study (Progressing Majors). Inaddition, the table provides data on those who attempted but failedto get through their entry nursing courses (Balked Majors). Thedistribution of Unbegun, Balked and Progressing Majors across theusual demography and academic categories is also shown so that thediscussion of the correlates of nursing student progress can begin.(Two variables found on Table 4 are dropped due to irrelevancy --Study Duration and Nursing GPA -- since these are zero by
15
17
definition for Unbegun Majors.)
During the last two decades a majority (54 percent) of thedeclared nursing majors at PGCC took the first step by attempting
a nursing entry course. Of these, about a quarter (24 pc cent)however were not able to acquire any passing grade of D-A and thus
were balked from pursuing their nursing studies further. Becominga Balked MeDr was the fate of about one in ten (13 percent) of allmajors. 1-us, once she declared, the odds of a nursing majorbeginning nursing study were roughly even; those for becoming aprogressing student were about 2:3 (progressing Studying Majors -
41 percent of all majors).
Among the demographic factors, Gender and Age seemed to havealmost nothing to do with the.,e odds; Marriage Status appeared onlylittle more active (about 10 percent more of the Progressing Majorswere married compared with both Unbegun and Balked groups), whilethe percentages of foreign students in all three group were so lowthat it is difficult to gauge any trend. Only the racial backgroundof nursing students revealed a clear, strong association withnursing study progress: percent non-white -- Unbegun Majors 60,Balked Majors 49, Progressing Majors 27.
All four academic variables seem predictive, three to a verysignificant extent. Full-time students are almost non-existent inthe Unbegun and Balked categories but represent almost two-fifths
(38 percent) of all Progressing Majors. The proportion ofDevelopmental course-takers declines from over half (52 percent)among Unbeguns to merely a quarter (24 percent) of Progressingstudents. And, viewed in raw general GPA scores, the means goingfrom Unbeaun to Balked to Progressing headings are 1.40-2.02-2.65.Clearly, academic dedication and performance count towards academic
progress. (As for the weaker academic variable, having collegiateexperience other than that derived from PGCC is somewhat lesscharacteristic of Unbegun Majors than of the others.)
Table 6 (p. 17) is an attempt to track progress groupproportions over time. Prior to 1979, only about a third (35
percent) of PGCC's de..lared nursing majors got stuck in the Unbegun
category. Then, during this passing decade the Unbegun percentbeginning at 45 slowly rose until it reached a peak among lastsummer's entrants -- 77 percent. Conversely, the Progressing Majorsegment has be.n shrinking -- from 54 percent pre-1979 to only 16
percent most recently.
But caution must be exercised lest these findings be over-interpreted. The curves presented should not be taken at facevalue because the meaning of "Unbegun" major becomes increasinglymore problematic as one moves closer to the present.
16
is

TABLE 6. PROGRESSIVE MAJOR TYPES BY ENTRY ACADEMICYEAR - FALL
UnbegunMa.ors
(PLUS SUMNER)/SPRING*
Balked ProgressingMeors Ma'ors
No. AllNursingMajors
Pre-1979 35 11 54 (2251)
1979-80 45 12 43 (266)
1980-81 44 17 39 (308)
1981-82 46 15 39 (378)
1982-83 55 14 31 (382)
1983-84 50 13 37 (289)
1984-85 58 9 33 (259)
1985-86 54 15 32 (231)
1986-87 56 15 29 (207)
1987-88 61 15 24 (231)
1988-89 67 17 16 (324)
Fall 89 77 22 1 (115)
1979-82 45 15 40 (952)
1982-87 54 13 32 (1368)
1987-5u89 67 17 16 (670)
ALL YRS 46 13 41 (5241)
* See Table 5 for Column Category Descriptions
One would like "Unbegun" students to refer only to those whowithdrew from PGCC before attempting any nursing classes; however,the limited variables we have been forced to use to define"Unbegunness" do not preclude the possibility of presentlycontinuing students falling into this category, students who havenot as yet had a full opportunity to advance to nursing course-taking. (As we shall see, it takes 50 percent of our eventualstudying majors two years or more after arrival to attempt anursing course.) This is because the technical definition of"Unbegun" is: no course-taking before the last term of attendancenoted by the Registrar, although last term of attendance does notnecessarily mean withdrawal term. This poses little or nointerpretation lifficulty fur students whose entry classes wereearly ones and whose last te-ms of attendance precede the lastpossible set of terms covered in this study, e.g., Spring, SummerI and Summer II of 1989. They can safely be assumed to have leftthe College, at least temporarily. But the overwhelming majorityof late year entering students (roughly those arriving 1987-

present) have just these terms recorded as their last, and for amajority of this majority this simply means term "previous" tocontinuing in ,?all 1989.
We conclude that the 1987-Summer '89 figures are not fairindicators of Unbegunness and so also of neither of the other twocategories of study progress. The most recent set to provide suchfair indication available is that of the very stable years 1982-
1987. And during this period 45 percent of all declared majorsbecame studying majors, 13 percent faltered at the entry courselevel, but about a third (32 percent) went successfully throughthese and on to further nursing study. Therefore, our study's mostrealistic estimates of First Step PGCC Nursing Program rates of
success are: Studying Majors 45 and Progressing Majors 32 percentof all Declared Majors.
Step 2: Conversion to Nursing A.A. Graduate. Winning anAssociate of Arts degree in Nursing is the obvious next step inacademic progress toward a registered nursing license. Table 7 (p.19) sets out the overall 1968-87 proportions of Studying Maiors innon-graduating and graduating groups as well as their demographyand distributions across academic categories.
For all Studying Majors 1968-89, the table reports a 47
percent rate of non-graduation and a 53 percent rate of graduation.We would argue that total number of Studying Majors is the properdenominator on which to base graduation success calculations.Figures based on total number of Declared Majors, however, areeasily computed, and are: 72 percent no Nursing A.A., 28 percentearning a Nursing A.A.
The main demographic differences between non-graduates andgraduates, according to Table 7, relate to Marriage Status andRace. Half of our Nursing A.A. achievers over the last two decadeshave been married, while more than three in five leaving withouta degree were singles. (Age, which turned out to be an importantdifferentiator among study progress groups is relatively weak hereas a discriminator; distinctions show up mostly at the extremes- about three out of four (74 percent) of the Under 21s failed tograduate while al,Aost 60 percent of the Over 35s earned degrees.)
Nursing graduates proved very unlikely to be non-white (only22 percent); in conirast non-whites made up 43 percent of the non-graduate group. 7he racial effect is even more striking whenpercentages are run in the other direction, from race group todegree group -- 60 percent of white studying majors earned aNursing A.A. compared with only 36 percent of the non-whites.
18
2 9
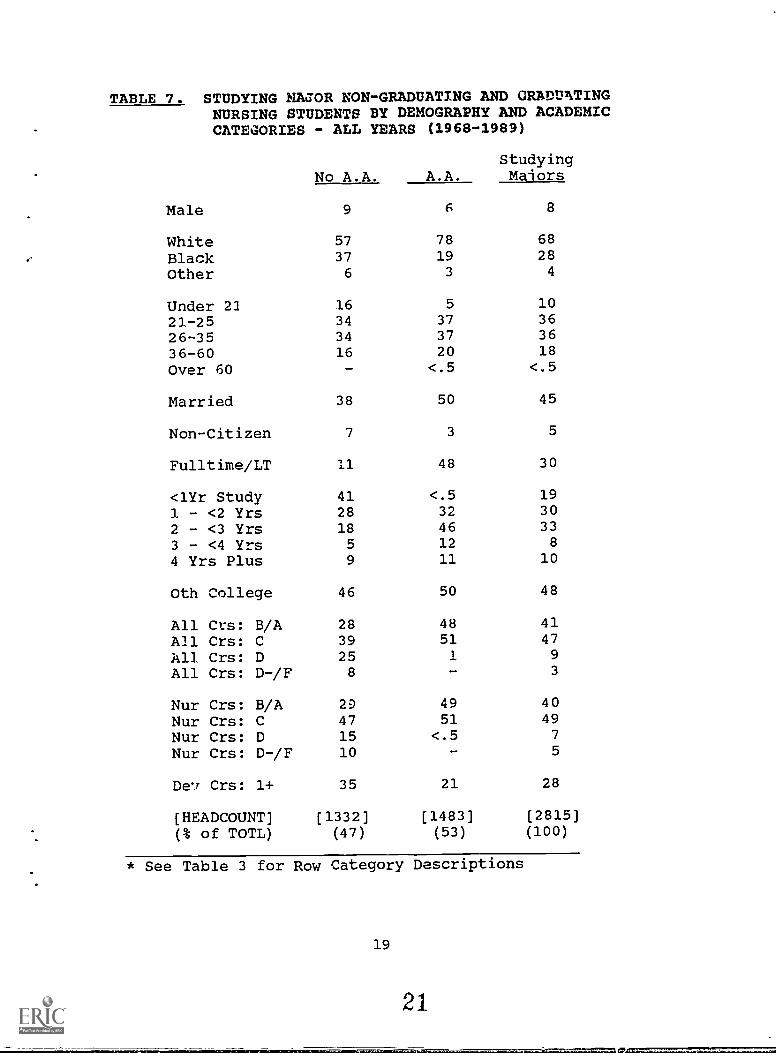
TABLE 7. STUDYING NACOR NON-GRADUATING AND GRADUATINGNURSING STUDENTS BY DEMOGRAPHY AND ACADEMICCATEGORIES - ALL YEARS
No A.A.
(1968-1989)
StudyingA.A. Ma'ors
Male 9 6 8
White 57 78 68
Black 37 19 28
Other 6 3 4
Under 21 16 5 10
21-25 34 37 36
26-35 34 37 36
36-60 16 20 18
Over 60 - <.5 <.5
Married 38 50 45
Non-Citizen 7 3 5
Fulltime/LT 11 48 30
<1Yr Study 41 <.5 19
1 - <2 Yrs 28 32 30
2 - <3 Yrs 18 46 33
3 - <4 Yrs 5 12 8
4 Yrs Plus 9 11 10
Oth College 46 50 48
All Crs: B/A 28 48 41
All Crs: C 39 51 47
All Crs: D 25 1 9
All Crs: D-/F 8 - 3
Nur Crs: B/A 29 49 40
Nur Crs: C 47 51 49
Nur Crs: D 15 <.5 7
Nur Crs: D-/F 10 - 5
Crs: 1+ 35 21 28
[HEADCOUNT] [1332] [1483] [2815]
(% of TOTL) (47) (53) (100)
* See Table 3 for Row Category Descriptions
19
21

Gender and Citizenship impact little on graduation rate mostlybecause so few males and non-citizens show up among Studying
Majors. Men constitute only 8 percent, foreigners only 5 percent.This does not mean, however, that if their numbers wereconsiderably greater that their effect on graduation rate wouldstill be small. To the contrary, it would be significant, asdemographic-to-graduation group percentaging shows: men were 10percent less likely to become graduates than women, and non-citizens 19 percent less likely than citizens.
Academics, though, showed even more power than demo. Aphics
in distingaishing graduates and nor-aduates. Almost half of all
A,A. achievers were full-time studeLts (48 percent); only 11
percent of the non-achievers were. ne proportion of A and Bstudents (measured by both general and nursing GPA) among thegraduate group was almost double that included among non-graduates.Ana Developmental course-takers were almost 70 percent more likely
to show up without than with A.A.s (35 to 21 percent,
respectively).
Except that it is organized on the basis of study class yearsrather than entry class years, Table 8 (p. 21) is similar to Table6 and will help us get a fix on the best and most realisticestimate of PGCC Nursing Gradual-ion rate -- progress Step 2. On
the surface, it depicts trendlJss and mildly flucturting set ofgrad: .tion rates (between 54 and 63 percent) for the whole period
of 1968-1986. The pre-1979 average was 63 percent while the 1979-86 showed a mean of 59 percent. Thereafter, the percentage ofNursing A.A.s earned by study classes plummeted from 40 to 0.
As before, we face the question of whether the later apparenttrend is real or an artifact of measurement method. The answer isthe same: variable definition and data limitations conspire tomislead us. In this case the problem is with the definition of"Non-Graduate," wtich includes all studying majors with no recordof nursing degree achievement by the date of their last known termof attendance. These criteria were supposed to classify as Non-Graduate only students withdrawing from PGCC before acquiring A.A.s
in nursing. But once again, "last" term does not always mean"drop-out" term, especially for students coming late to nursing
course-taking, most of whom will not have had the chance toaccumulate sufficient program credit hours and cshose last term is
simply the one previous to continuing in Fall 1989. (Over thewhole period considered, 50 percent of all studying majors requiredmore than 2 years to complete their programs.)
The implication is that the mean rate for the years 1986-89
must be set aside as unreliable estimator; too many students inthis interval are still in process of degree achievement. Weconsider the mean graduation rate for the fairly recent and verystable 1982-86 period a satisfactory alternative.
20
22

TABLE 8. NURSING A.A. ACHIEVEMENT RATESBY STUDY CLASS YEAR - 1968-1989
Nursing A.A. Graduate Percent of Studying
Pre-1979
Majors
63 (1265)
1979-80 61 (119) 1979-82 58 (444)
1980-81 54 (120)
1981-82 59 (205)
1982-83 57 (166) 1982-86 59 (614)
1983-84 62 (179)
1984-85 59 (150)
1985-86 56 (119)
1986-87 40 (137) 1986-F89 15 (492)
1987-88 11 (140)
1988-89 1 (175)
Sumr 89 - (40)
ALL YRS 53 (2815)
Therefore, our study's estimate of recent PGCC Nursing Programgraduation rate is 59 percent. (A precisely comparable figure usingall Declared Majors as the denominator cannot be calculated becausethe table's 1982-86 interval is 'ased upon Study Class years;however, the figures for the rougA Entry Class 1980-84 parallelwould be 54 percent of Studying Majors and 27 percent of allDeclared Majors graduating.)
It remains in this section to examine how PGCC's nursinggraduation performance compares with that of its peer institution
in Maryland. Table 9 (p. 22) contains the basic data for thisdiscussion.
The second column shows the raw number of Nursing A.A.sgenerated in 1984-1988 by all fourteen Maryland community collegeswith comparable nursing programs, as culled from the State Boardof Community Colleges Program Data Monitoring System reports.Column Three repeats this data in the form of percentages ofnursing A.A.s generated by all institutions over that period.Column Four represents the sum of each college's annual nursingenrollment over the four years in question.
21
23
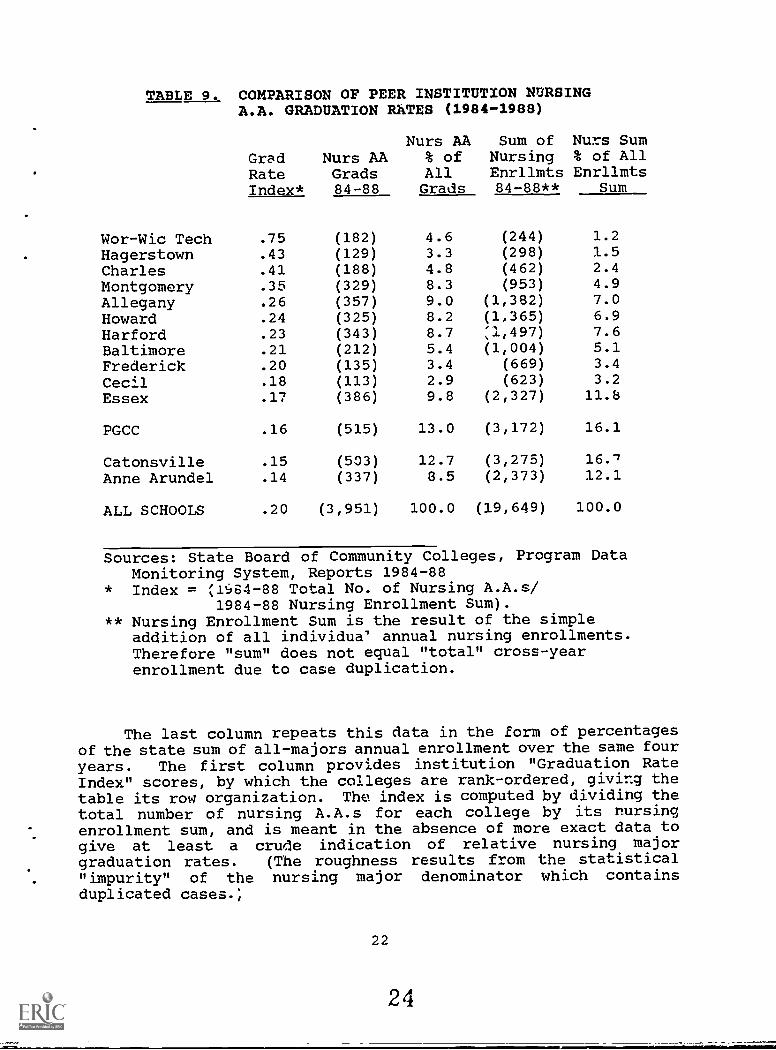
TABLE 9. COMPARISON OF PEER INSTITUTION NURSINGA.A. GRADUATION RATES (1984-1980
Nurs AA Sum ofGrad Nurs AA % of NursingRate Grads All EnrllmtsIndex* 84-88 Grads 84-88**
Nurs Sum% of AllEnrllmts
Sum
Wor-Wic Tech .75 (182) 4.6 (244) 1.2
Hagerstown .43 (129) 3.3 (298) 1.5
Charles .41 (188) 4.8 (462) 2.4
Montgomery .35 (329) 8.3 (953) 4.9
Allegany .26 (357) 9.0 (1,362) 7.0
Howard .24 (325) 8.2 (1,365) 6.9
Harford .23 (343) 8.7 71.,497) 7.6
Baltimore .21 (212) 5.4 (1,004) 5.1
Frederick .20 (135) 3.4 (669) 3.4
Cecil .18 (113) 2.9 (623) 3.2
Essex .17 (386) 9.8 (2,327) 11.6
PGCC .16 (515) 13.0 (3,172) 16.1
Catonsville .15 (503) 12.7 (3,275) 16./
Anne Arundel .14 (337) 8.5 (2,373) 12.1
ALL SCHOOLS .20 (3,951) 100.0 (19,649) 100.0
Sources: State Board of Community Colleges, Program DataMonitoring System, Reports 1984-88
* Index = .1.64-88 Total No. of Nursing A.A.s/1984-88 Nursing Enrollment Sum).
** Nursing Enrollment Sum is the result of the simpleaddition of all individua' annual nursing enrollments.Therefore "sum" does not equal "total" cross-yearenrollment due to case duplication.
The last column repeats this data in the form of percentagesof the state sum of all-majors annual enrollment over the same four
years. The first column provides institution "Graduation RateIndex" scores, by which the colleges are rank-ordered, giving thetable its row organization. The index is computed by dividing thetotal number of nursing A.A.s for each college by its rursingenrollment sum, and is meant in the absence of more exact data togive at least a crude indication of relative nursing majorgraduation rates. (The roughness results from the statistical"impurity" of the nursing major denominator which containsduplicated cases.,
22
24

PGCC's nursing program is shown to produce larger numbers of
nursing A.A.s than ny other community college in the state -- 315
over the 1984-88 interval -- which represents 13 percent of allstate graduates, not surprising since its nursing program is alsothe biggest among Maryland peer institutions. However, thispercentage is somewhat below the estimated 1984-88 PGCC nursingmajor proportion of all state CC nursing majors (16 percent), a lagsuggest'ng some relative weakness in nursing A.A. generation. Thisis furdler born out by PGCC's graduation index score of .16, whichis significantly below the state average (.20) and which places it
only at the twelfth rank out of fourteen.
On the other hand, a more thorough examination of Table 9reveals a perhaps mitigating pattern: there exists a strongnegative correlation (-.64) between graduation rate index score andabsolute si,,e of nursing program (sum of nursing enrollments). Topranking schools in nursing graduation rate tend to have very smallnursing programs (e.g., Wor-Wic Tech with an index score of .75 butaccounting for only 1.2 percent of all state majors).
This may be a function of the extra-special attention whichcan be paid to each individual student and each aspect of thenursing program, while the large schools rust struggle to find thetime and resources to nersonalize and enhance their programs. Orperhaps the known higher full-time/part-time ratios enjoyed bysmall schools and leading to faster student advancemnent may playa role.)
In any case, we may observe that if the peel institution listis restricted to those four institutions with nursing enrollmentsaccording to Table 9 of 2,000 or better (in some sense PGCC's truepeer group), then our college's nursing program does relativelywell, coming in second behind Essex but ahead of both Catonsvilleand Anne Arundel.
State reported data also permits a glance at 1984-88 rates ofchange in the number of nursing graduates among peer institutions.Table 10 (p. 24) ranl:s all fourteen peer community colleges interms of four-year average annual percentage increase or decreasein the number of nursing students earning A.A. degrees. What itshows is tht nursing graduate numbers have been annually fallingoff of late a:most everywhere. Only four peer institutions managedoverall gains (Wor-Wic Tech leading with an increase of 13.8percent) whilE the rest dropper" some precipitously, like PGCCrivals Catonsville -10.4 percent) and Essex (-20.2 percent).PGCC's performance fell into the middle range (-6.9 percent),actually beating the whole peer group of community colleges (-8.6
percent).
23

TABLE 10. NURSING PROGRAM A.A. GRADUAt253 NUMBERS1984-89 COMPARED WITH PEER COLLEGE TRENDS
Wor-Wic Tech
MeanYrly %Chanae
Anne Arundel
ZeanYrly %Chanqg
13.8 - 6.3
Baltimore f 1 PGCC - 6.9
Hagerstown 5.2 Howard - 9.2
Charles 4.0 Montgomery - 9.3Cecil 2.1 Frederick - 9.4
Allegany - 2.3 Catonsville - 10.4Harford 6.1 Essex - 20.2
ALL PEER CCs* - 8.6
Sources: State Board of Community Colleges, Program DataMonitoring System, Reports 1984-88; PGCC Internal Reports
* Including Prince George's Community College
Step 3: Conversion to Licensed Registezed Nurse. The lastacademic step is the passing of the National Council LicensureExamination for Registered Nursing, which is scheduled twiceannually (February and July) and ideally is takwn at the firstopportunity by nursing graduates. Successful completion of theNCLEX-RN means automatic licens ng. It is expected that licensecandidates pass the exam on their first attempt, however, withpermission multiple attempts are possible.
Like the SAT and GRE tests, the NCLEX is a standardizsdnational examination purported to be as culturally and regionallyunbiased, and as little varying in knowledge and skill areascovered year to year, as possible. (Both assertions have becomesomewhat controversial lately. Sone, including black caucuseswithin the nursing ,71-nfession, question NCLEX's racialunbiasedness; others note that important subt_antive revisions have-4nelradical1y occurred, particularly in 1989 with a significan:.enlargement in the coverage of hands-on field experience whichrequires just the sort of training difficult for many communitycollege programs to provide for their students.)
All correct question respolises are accorded numerical values,the sum needed for passing being a hard fixed 1600. Through 1986,NCLEX policy was to post raw total scores as well as simplepass/fail indication to examinees and relevant parties likecommunity college nursing departments. On the grounds, however,that dissemination of raw scores might possibly lead to breachesof confidentiality and the unfair jeopardizing of ntrsing careers,this policy was cancelled with the 1989 exams; now, only simplu
24
26
.Iwm 2:=EIN

pass/fa4l indication is made known to those concerned.
From a research perspective, this last move was unfortunatebecause it severely limits the kinds of statistical techniqueswhich can be brought to bear upon analysis of NCLEX performance.But there are other hindrances to our analysis which we mustmention as well before turning to a substantive discussion of PGCCgraduate licensing rates. Here, we find ourselves unable to makethe kind of confident generalizations concerning overall successrates we gave out concerning conversions to studying major andnursing graduate. For these, we could base our conclusions uponlarge, complete data sets including all PGCC declared majors andtheir academic histories over the whole of two decades. But NCLEXresults are not part of PGCC's regular system of student tracking.These must be independently collected and then specially matchmerged with our computer files. Available to us for this study wasonly a small sample (n=237) of the most recent PGCC NCLEX-takers.Although the sample was virtually complete for last six NCI3Xopportunities (February 1987-July 1989) and quite matchable hAckto our general student files, still the small sample size madedetailed category analysis very awkward and the limited time rangeproduced only one complete entry class whose career could beaccurately traced from Declared Major to Nursing License.
But putting caveats aside, what can be said about PGCC nursinglicense rates with the data on hand?
Table 12 (p. 26), like Tables 5 and 7 before it, displays thewhole-base division among progress groups and group distributionsacross demographic and academic categories. In this case, of
course, the progress groups are NCLEX passers and failers, but weneed to add only of a particular sort. "Passing" and "failing"here refers only to first-time test-taking results. This is donefor two reasons. First, such is the form used in the reports ofboth the State Board of Community Colleges and the Maryland Boardof Nursing. Second, first-time performance is the most likelygauge of the main concern of this section -- how well does the PGCCnursing program prepare its nursing graduates for their licensingexams. Second- and Nth-time performance may be conditioned partlyby factors other than college program (e.g., growing familiaritywith the exam, extra personal study, etc.).
Actually, there is also a third reason. Typically, Ma-ylandcommunity college nursing graduates, even on their first tries,pass the NCLEX overwhelming. PGCC's graduates are no exception inthis regard; our 1987-89 sample's pass rate is 79 percent, as Table11 indicates. Naturally, the cumulative pass rate goes up over anumber of attempts (the last-time pass rate for our sample was 88percent), but 79 percent is already awkwardly lopsided from theanalyst's standpoint. At this level of category skew, it alreadybecomes difficult to judge differences across several variables.
25

TABLE 12. PGCC NURSING GRADUATE PERFORMANCE ON NCLEX-RN:PASS AND FAIL GROUPS BY DEMOGRAPHIC
CATEGORIES (1987-1989)FIRST-TIMEAND ACADEMIC
EntireFail Pass Sample
Male 2 5 5
White 31 66 59
Black 65 30 38
Other 4 3 3
Under 21 2 2 2
21-25 45 36 38
26-35 27 39 37
36-60 27 23 24
Over 60 - - -
Married 33 46 43
Non-Citizen 10 4 5
Fulltime/LT 16 32 29
<1Yr Study - 1 <.51 - <2 Yrs 12 23 212 - <3 Yrs 47 42 43
3 - <4 Yrs 22 18 19
4 Yrs Plus 18 16 16
Oth College 41 48 46
All Crs: B/A 6 49 41All Crs: C 94 51 59
All Crs: D - -
All Crs: D-/F - - -
Dev Crs: 1+ 53 23 29
[HEADCOUNT] [49] [188] [237](% of TOTL) (21) (79) (100)
This preliminary finding leads to a more important point. Thesample's 79 percent first-time pass rate, although not definitiveof PGCC's true recent rate as we shall see, is broadly indicativeof that true rate. And although 8 out of 10 first-time NCLEXsuccesses might seem quite respectable to the outsider, it is notconsidered so by Nursing Board reviewers who are unsatisfied withany rate under 85 percent. Moreover, data we will shortly presentshow that the PGCC first-time NCLEX pass rate has been dropping
26
28

seriously in recent years and that it is almost always found to be
lower than those of most peer institutions. All this is cause forreal concern, and makes an understanding of the forces at work indetermining PGCC NCLEX performance crucial.
It would appear from Table 12 that Race is the only reallyimportant demographic correlate with NCLEX performance. Fully two-thirds of the Passers in our sample proved tc be white while morethan two out of three tcst-takers scoring below 1600 turned out to
be non-whi.. The white percentage difference between pass and
fail groups vas 35 percent. The next most powerful demographicpredictor -- Marriage Status -- paled in comparison; the differencein married percentages between pass (the higher) and fail grcupswas only 13 points. Age showed little impact, manifesting only aslight older student bias among Passers.
But even exceeding the ethnic factor in cogency were the twoacademic variables General GPA and Developmental Course-taking.(Table 11 drops Nursing CPA from consideration as redundant; withinour NCLEX sample General and Nursing GPA distributions paralleleach other almost exactly.)
TABLE 13. PGCC NURSING GRADUATE FIRST-TIME NCLEX PASS RATESCOMPARED WITH
Mean 1st-TimePassing % :
PEER COLLEGE TRENDS
80-88 80-82 83-85
(1984-1988)
86-88
Frederick >99 100 99 100
Montgomery 96 100 95 92
Baltimore 96 98 94 94
Wor-Wic Tech 95 96 96 93
Anne Arundel 93 87 94 97
Hagerstown 93 93 92 94
Catonsville 93 92 94 92
Essex 92 92 92 93
Allegany 90 93 90 89
Harford 90 83 91 92
Cecil 87 83 91
Howard 87 85 87 83
PGCC 84 80 87 84
Charles 84 77 86 86
ALL PEER CCs* 91 90 92 92
Sources: Maryland Board of Nursing, Annual Report 1988
* Including Prince George's Community College
27
2:)

The Fail group was almost empty of GPA equivalent B-or-betterstudents (6 percent) while these made up almost a majority ofpassing examinees (difference 45 percent). Developmental course-takers were predominant in the Fail group (53 percent) but fcr a30 percent difference constituted fewer than a quaxter of the Passcategory (23 percent).
According to statistics supplied by the Maryland Board ofNursing on state community college annual NCLEX performance(fiscal years/successive July-February NCLEX pairs), 84 percent ofPGCC examinees managed to pass on their first attempts over the
period 1980-1988. This near decade average comes very close to thepar of 85 percent, but masks a good deal of fluctuation. In
particular the last Board-supplied figure (FY 1987-88) was 78percent passing, down from the previous year's 88 percent. Usingour sample data we are able to supply estimates of post-FY87performance to extend the trend through July 89's examination:
FY 1986-87 88 %
FY 1987-88 78 %
FY 1988-89 68 %
July 1989 78 %
Thus, the extended curve depicts at very least the existence of acurrent sub-80 percent slump, one not necessarily bottoming at 68percent in 1988 for it is to early to tell if last July's 78percent rebound represents the beginning of a trend.
Furthermore, Table 13 nails down PGCC's NCLEX performancedeficit relative to other state communities colleges. PGCC ranksthirteenth out of fourteen for the whole 1980-88 period, the same1980-82, twelfth 1983-85 and last 1986-88.
Nursing Program Outcomes: A Cohort Analysis. In the precedingthree sections this study attempted to arrive at fair outcome rateestimates one outcome one class at a time. Now, finally, with thenature of the data and essential variables well discussed, we arein position to approach the question of outcome rates moresystematically -- through cohort analysis.
Cohort analysis sets out to establish what trends characterizea group of people all who began undergoing a particular process atthe same time. Such a group is called a "cohort." For ourpurposes, cohorts were nursing major entry year classes -- sets ofmajors who began attending PGCC during the same term, aggregatedby Academic Year (Fall + Sum I and II/Spring). These form thebasis for the organization of Table 14 below (p. 29).
The table is designed to capture the declared major rates ofcunversion first to studying major status and then to Nursing A.A.graduate status.
28

TABLE 14. COHORT ANALYS7.S: CUMULATIVE RATES OF CONVERSION TOMAJOR AND FURSING GRADUATE AFTER 2, 4, 6, 8
MAXIMUM V2aRS OF ATTENDANCE BY YEAR ENTRY CLASSES
A. Studying Major Corversion
As of Sprg 89Begin Study by End Study Unbegun
STUDYINGAND
Entry (Max YrsClass PossibleYears Attend.) 2 4 6 8 Max Cont Out [Ncs.]
1979-80 (11**) 14 35 44 50 55 <.5 45 [266]
1980-81 (10) 17 38 47 52 52 1 47 [308]
1981-82 ( 9) 39 49 53 53 <.5 47 [378]
1982-83 ( 8) 10 30 39 45 45 4 51 [382]
1983-84 ( 7) 12 35 49 g- 0 50 2 48 [289]
1984-85 ( 6) 9 29 42 * 42 R 53 [259]
1985-86 ( 5) 15 40 46 * 46 6 48 [231]
1986-87 ( 4) 16 44 * * 44 10 46 [207]
1987-88 ( 3) 27 39 * * 39 21 40 [231]
1988-89 ( 2) 33 * * * 33 49 18 [324]
1979-85 (6-10) 13 34 45 49 50 2 48 [1882]
1985-87 (2-5) 24 38 40 40 40 24 36 [993]
B. Nursing A.A. Conversion
Entry (Max Yrs As of Sp89Class Possible Graduation by End No A.A.Years Attend.) 2 4 6 8 Max Cont Out [Nos.]
1979-80 (11**) 6 20 28 31 33 3 19 [266]
1980-81 (10) 5 21 26 30 31 3 18 [308]
1981-82 ( 9) 7 22 30 32 32 2 18 [378]
1982-83 ( 8) 1 15 22 24 24 3 18 [382]
1983-84 ( 7) 2 17 24 24 24 6 20 [289]
1984-85 ( 6) 3 15 21 * 21 5 16 [259:1
1985-86 ( 5) 6 18 18 * 18 14 14 [231]
1986-87 ( 4) 6 14 * * 14 19 11 [20 ]
1987-88 ( 3) 2 2 * * 2 31 6 [231]
1988-89 ( 2) 0 * * * 0 30 3 [324]
1979-85 (6-10) 4 18 25 27 28 4 18 [1882]
1985-87 (2-5) 3 8 8 8 8 24 8 [993]
29
31

Each conversion rate appears as a cumulative series ofpercentages giving the proportion of all declared majors in anentry class which had made the status transition by the timeindicated -- end of year 2, 4, 6, 8 and the last possible year ofattendance considering the entry year date. (For example, by theend of the Class 79's eighth year, 50 percent in this cohort hadbecome studying majors.) Th. columns headed "Cont(inuing)" showthe percentage of students in each class who are still "in thepipeline" -- "unconverted" but still enrolled as of Spring/Summe/1589. The "Out" columns display the proportions of "unconvarted"extry class students whose last term of attendance preceded Fall1S,89, in other words those who stopped attenling from PGCC withouta status change.
Single asterisks (*) on the table indicate tineinapplicability, the fact that the indicated time slot exceeds themaximum possible for a particular entry class (e.g., to date, ithas been only seven years since the start of Entry Class 19S3-84;thus no figure is shown for the year 8 observation point). Thedouble asterisk next to the Maximum Year column is just a reminderthat the last possible "year" for any group is only a part-year,Summer I/II 1989.
Since every percentage on Table 14 has the same calculationbase -- total Entry Class Declared Majors -- one can follow themsequentially over time to trace the pattern of each cohort'sacademic progress towards studying major status and on to nursinggraduation, as far as the data permits. For classes 1979-80 to1984-85, this is virtually the entire class career judging by thevery marginal percentages of continuing students left over fromthese groups. Almost all of their original inhabitants by thistime either have left PGCC with nursing degrees in hand or havefallen by the wayside as permanent non-studying nursing majors ornursing non-graduates. Thus, hard conversion rate estimates canbe derived for this period. For the more recent post-1984students, the large proportions of students "still in the pipeline"preclude making final estimates of conversion rates, however, manyof the percentages in the in-transit columns may still be usefullycompared with parallels for the earlier classes. Finally, it
should be pointed out that in both early and late cases the"ultimate" status percentages of each class sum to 100, meaningthat al., of its students are accounted for under some heading orother. (The ultimate statuses are: Unbegun/Withdrawn +
Unbegun/Continuing + Studying/Withdrawn + Studying/Continuing +Nursing A.A. Graduate.)
The substantive findings of Table 14 are as follows: First,for the most recent group of Entry Classes permitting stable,complete conversion estimates (1979-85), we discover that overall,50 percent of Declared Nursing Majors nake the transition toStudying Major successfully, and 28 percent go on to win NursingA.A.s (or 56 percent of all Studying Majors). Second, Studying
30
32

Major and Nursing A.A. conversion rates compared across the cl'Assesin this period show considerable similarity; however, upon closerexamination there appears a detectable downward trend in bothcases. For 1979-82, the average Studying Major conversion rate wasabout 53 percent, dropping to around 46 percent for the 1982-85interval; likewise, gradnation conversion went from 32 percent onaverage to approximately 23 percent. Unfortunately, the data forthe most recent years is too incomplete to allow any judgements tobe made concerning trend continuation. Third, the data suggest incrude fashion that over half of all conve'rsions occur before thefinish of the fourth year. Table 15 below elaborates on the timingdimension of academic progress, most importantly documenting thatduring this last decade it took the average Nursing Declared Majorabout 1.7 term-years after enrolling to begin taking Nursingcourses and another 2.2 to earn her nursing degree -- 3.8 term-years altogether.
TABLE 15. TIMING OF CONVERSIONS TO STUDYINGMAJOR AND NURSING A.A. GRADUATE
Percent by Yr Intervals
DeclaredMajor toStudyingMa'or
StudyingMajor toNursing
A.A.
DeclaredMajor toNursing
A.A.
Under 1 Year1 1 Yr 3 Terms2 2 Yrs 3 Terms3 3 Yrs 3 Terms4 4 Yrs 3 terms (Plus)5 5 Yrs 3 Terms6 Yrs Plus
43 %32 %10 %5 %11 %*
*
<.5 %32 %46 %12 %11 %*
*
<.5 %9 %
35 %22 %12 %8 %15 %
Quartiles by Term-Yr**
25 % within .50 1.50 2.25
50 % within (Median) 1.00 2.00 3.25
75 % within 2.00 2.50 4.50
Mean Term-Yr 1.68 2.46 3.84
Group Base*** (2488) (1309) (1309)
* Inapplicable; falls under 4 Yrs Plus category** Term-Yr is calculated on a College Term basis; each term
(Summer-I/Summer-II/Fall/Spring) is set to .25 of oneAcademic Year.
*** N=2488 (Studying Majors only); missing cases=328;N=1309 (Nursing Graduates only); missing cases=23;Missing cases due to incomplete initial study term data.
-
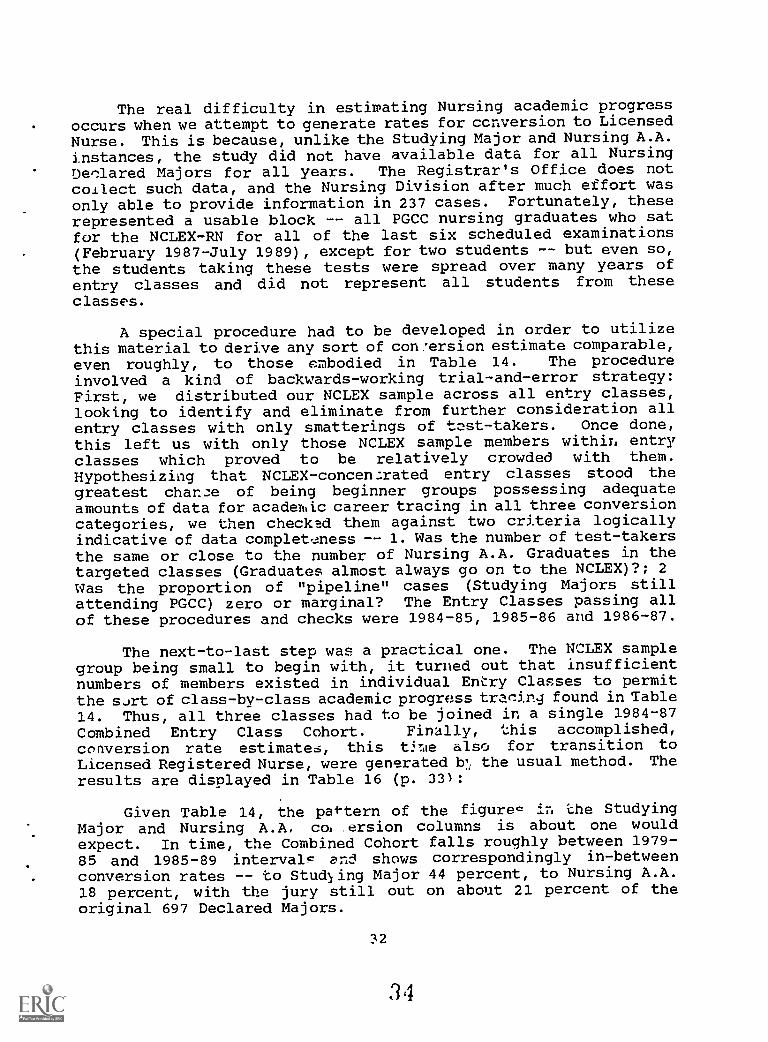
The real difficulty in estimating Nursing academic progressoccurs when we attempt to generate rates for conversion to Licensed
Nurse. This is because, unlike the Studying Major and Nursing A.A.instances, the study did not have available data for all NursingDeclared Majors for all years. The Registrar's Office does notcollect such data, and the Nursing Division after much effort wasonly able to provide information in 237 cases. Fortunately, theserepresented a usable block -- all PGCC nursing graduates who satfor the NCLEX-RN for all of the last six scheduled examinations(February 1987-July 1989), except for two students -- but even so,the students taking these tests were spread over many years of
entry classes and did not represent all students from these
classes.
A special procedure had to be developed in order to utilizethis material to derive any sort of con'ersion estimate comparable,even roughly, to those embodied in Table 14. The procedureinvolved a kind of backwards-working trial-and-error strategy:
First, we distributed our NCLEX sample across all entry classes,looking to identify and eliminate from further consideration allentry classes with only smatterings of tast-takers. Once done,this left us with only those NCLEX sample members withir, entryclasses which proved to be relatively crowded with them.Hypothesizing that NCLEX-concen.:rated entry classes stood thegreatest chan.m of being beginner groups possessing adequateamounts of data for acaderuic career tracing in all three conversioncategories, we then checked them against two criteria logicallyindicative of data complet..eness -- 1. Was the number of test-takersthe same or close to the number of Nursing A.A. Graduates in thetargeted classes (Graduates almost always go on to the NCLEX)?; 2Was the proportion of "pipeline" cases (Studying Majors stillattending PGCC) zero or marginal? The Entry Classes passing allof these procedures and checks were 1984-85, 1985-86 and 1986-87.
The next-to-last step was a practical one. The NCLEX samplegroup being small to begin with, it turned out that insufficientnumbers of members existed in individual Entry Classes to permitthe sJrt of class-bv-class academic progress tracing found in Table
14. Thus, all three classes had to be joined in a single 1984-87Combined Entry Class Cohort. Finally, this accomplished,conversion rate estimates, this tjnie also for transition toLicensed Registered Nurse, were generated la: the usual method. Theresults are displayed in Table 16 (p. 33):
Given Table 14, the paftern of the figurec in ehe StudyingMajor and Nursing A.A. col ersion columns is about one wouldexpect. In time, the Combined Cohort falls roughly between 1979-85 and 1985-89 intervals an6 shows correspondingly in-betweenconversion rates -- to Studying Major 44 percent, to Nursing A.A.18 percent, with the jury still out on about 21 percent of theoriginal 697 Declared Majors.
32
34

TABLE 16. COHORT ANALYSIS: CUMULATIVE RATES OF CONVERSION TOSTUDYING MAJOR, NURSING GRADUATE AND NCLEX-RN PASSERPOR COMBINED ENTRY CLASS COHORT 1984-1987
(N = 697)
By End of Year:
ToStudyingMaior
ToNursing
A.A.PassingNCLEX
: 5 0 0
2 13 5 3
3 27 14 9
4 37 16 11
5 43 18 12
6 44 18 13
Cont/No Conyers 7 13
Out/No Conversn 49 13
The mol interesting column, of course, is the Passing NCLEXone which reveals that by the end of the cohort's sixth year 13percent of is founding sisters (or 76 percent of cohort membersthen graduated) had finally won their way through to a RegisteredNursing license. The problem is that these proportions are not thelast word. A fifth of the cohort still awaits ultimate dispositionand many NCLEX re-takes will be tried by presently exam-failinggraduates, so we can be sure that several percentage points willbe added to both graduation and test-passing columns before the
cohort is completely exhausted. But how many?
To get an answer at least in the form of an estimate, anadditional cohort analysis was conducted. Our research managed toturn up one nursing cohort that had run its full course (no
remaining undisposed of students), formed by joining semester studyclasses Spring 1985 and Fall 1985. Although this combined cohortwas study class- rather than entry class-based and thus could notbe directly compared with Table 16's classes, what it could providewas a firm final rate for gradaate-to-NCLEX passer which then couldbe applied in projecting ulti:nate Table 16 results. With thiscaveat: the study class cohort data is in effect data for early
entering students; therefore, its final rate may not perfectlyrepresent final rate by the time of the eventual exhaustion ofTable 16's later cohort. (See Appendix for a complete tabledetailing the academic progress of the Spring/Fall 1985 study classcohort.)
The study class's final graduate-to-license rate was 46
percent of all original studying majors (or 90 percent of allcohort graduates). In our rough and ready projection we shavedthis .90 re s down to .75 to err on the side of conservatism, then
33
3 5
multiplied it. by an estimate of eventual numbers of new graduates
now in the two unconverted/continuing categories. To arrive at thcnew graduate numbers estimate we simply assigned a third of thecontinuing non-studying majors to the continuing non-graduatestudying major group, and then assigned a third of this merger to
the graduate category. (The .33 rates used here are veryconservative given the actual effective rates during the first tenyears of the cohort's existence.) All of this when crankcd throughamounts to an additional 4 points in the license column, for anestimated eventual 17 percent total. Thus it is probably safe toguess that between one in six to one in five PGCC declared nursingmajors has fouglIt her way through J'.) become a registered nurse in
recent years.
Models of Nursing AcademiL Progress
Our final task is to become more systematic concerning whysome students progress towards licensed nursing while others stallat points along the way. To enable us to carry out this lastassignment, the study included a number of multivariate analysesdesigned to discover which demographic and academic variables fromamong tne large set we began with were truly causal, which wereonly spuriously related or unrelated, and how ths important factorsthus identified worked together to determine student successes and
failures.
The specific multivariate method employed is called analysisof variance (or ANOVA for short), wh!.ch has the power to determineprecisely how Luch independent effect any hypothesized causalvariable has on an outcome variable when the interfering andcompeting impacts of all the other causal variables are also taken
into account. It can be thought of as a kind of statistical net
which captures only the crucial factors in a sea of causes and lets
the little non-sign.;ficant ones escape. ANOVA also has thecapacity to weigh the total impact of the set of crucial factorsthus identified (usually called Fhe analytic model) upon theoutcome variable, so that the analyst can gauge his overall successin accounting for a phenomenon with the best variables in hand.Without going into the underlying mathematical letails, let it
simply be noted that the degree of impact determined for bothindividual causal variables and causal models is traditionallyexpressed in terms of percentage of variance explained, and thata 100 percent finding for a variable or a model would imply thatone could completely predict the correct outcome assignments ofcases by means of that variabl or model.
But for the institutional researcher, ANOVA has one major
drawback. It is mathematically structured only to work withcertain types of variables -- integer scales (e.g., age in number
of years) or real number scales (e.g., height in inches and
fractions of inches). Educational research, however, often
34
3 6

requires the employment of simple category variables like race andfull-time/part-time study; and in this study, all three outcomevariables are of this type (e.g., NCLEX-Pass/Fail). Fortunately
there is a statistical loophole. The simplest fon:. of integerscale is the binary number system -- 0,1. Thus, naturallydichotomous (two-category) variables (of which this study containsmany) whose levels are assigned 0 or 1 values qualify as integerscales and can be treated under ANOVA. And even more complicatedvariables (e.g., Race:White/Black/Asian/Hispanic/Native American)cen legitimately be "collapsed down" to two categories for ANOVAinclusion (e.g., White/Non-White). There is a cost associated withthis approach, however. Forced dichotomization means some loss ofprecision in estimating percentage of variance explained, as weshall see, and some other statistical risks we need not discusshere are run. But if one exercises due care in interpreting andcross-checking results, the loses and hazards pale in comparisonto the gains in olarity and explanatory power acquired through theemployment of ANOVA.
Raw Outcome Correlations. Table 17 below has two purposes.First, it sert7cts to .,pecify the ANOVA-ready dichotomous forms ofthe study's original full demographic and academic variables. Butmore importantly, it presents in one location all possible two-waycausal variable-to-outcome variable correlations given our data.The correlations are expressed in terms of outcome percentagedifferences between paired categories.
TABLE 17. NURSING PROGRAM OUTCOMES BY ALL AVAILABLEDEMOGRAPHIC AND ACADEMIC VAaIABLES (DICH. FORMS)
StudyingMajorDelta
NursinyA.A.Delta
NCLX Pass1st Time
Delta
MALE/Female 3 - 11 + 12WHITE/Non-White + 27 + 24 + 24
26 YRS OLD+/< 26 Yrs + 11 + 8 + 6
MARRIED/Single + 7 + 12 + F
FOREIGN/US Citizen - 14 - 19 - 22
i.LJL-TIME/Part-Time + 42 + 43 + 13STUDY 2.5 YRS+/< 2.5 * + 29 - 12
OTH COLL EXPR/PGCC Only + 16 + 4 + 5
GEN GPA 2.75+/< 2.75 + 8 + 17 + 30NUR GPA 2.75+/< 2.75 * + 15 + 26DEVL CRS 1+/None - 25 - 18 31**
A&S CRS 2-:-/< 2 - 35 - 1 (
OUTCOME BASE (5241) (2815) (237)
* Not applicable ** Devl. Math course substituted
35
3 7

For example, the table indicates that the percentage of
Studying Majors among men is 3 percentage points smaller than that
among women. (The raw figures were 51 to 54 percent, respectively.See the Appendix for tables detailing the size of categorypopulations, exact outcome percentage breakdowns and other relevant
information.)
The first category presented (in capital letters) is the"anchor" category; the percentage difference (technically called"delta") is always the remainder left when the percentage of thesecond or "complement" category is subtracted from the anchorpercentage. The +/- sign indicates "direction" of relationship:plus shows a positive one betwaen anchor quality and outcome, minus
a negative one. Under ANOVA, the anchor is set to 1 (presence ofa quality) and the complement set to zero (absence of anchorquality). Beyond Table 17 just below, each variable will beidentified in terms of its anchor quality only.
Consistently high correlating variables prove to be Race/White(delta = > +23 with all three outcomes), Developmental Course-taking (over +17 with all three outcomes) and Non-Citizenship (over+13 with all three outcomes), while Full-Timeness (over +41 withboth Studying Major and Nursing A.A.) and High General G.P.A. (+17
with Nu:sing A.A. and +30 with NCLEX Passing) score highly in twoout of three outcome cases. Two other variables also show two outof three moderate-to-high outcome deltas but with reverse effects:Maleness correlates moderately negatively with Nursing A.A. butpositively with NCLEX Passing, while Long Study Duration is astrong predictor of Nursing A.A. acquisition (+29) but seems amedium deficit to first-time NCLEX Passing (-12). ThP remaiaingvariables feature significantly in determining on.ly one outcomecase or show little real impact anywhere (Higher Age, MarriedStatus, Non-PGCC College Experience and Humanities/Social ScienceCourse-taking).
But a more useful way of reviewing Table 17's findings isoutcome column-by-column. Looking only at the top six correlatingvariables in each outcome case we get the following rankings:
Study Major
1. Full-Time +422. A&S Courses +353. Whites +274. Devi Crses -255. Oth College +166. FoL,Iyn -14
Nursing AA
Full-TimeLong StudyWhitesFoleignDevl 2rsesGen GPA
36
as
NCLEX Pass
+43 Dev1 Math -31+29 Gen GPA +30+24 Whites +24-19 Foreign -22-18 Full-Time +13+17 Long Study -12
Male- +12

Because these findings are provisional (The promised statisticalcontrols via ANOVA have yet to be applied), it must be underrtoodthat their discussion below will he equally provisional.
The two cross-the-board variables of high impact are Race and
Foreign Origin, which also seem to be the only demographicvariables of any consistent significance. At every nursingacademic crossroad, being white or a U.S. citizen appears to conferadvantage, being non-white or an overseas student disadvantage.(Foreign student disadvantages in acquiring Nursing A A.s andpassing the NCLEX have tbien noted as a general phenomenon in thisst,te [Maryland Board, 1988] and traced mainly to languagedifficulties and prior nursing training in countries diverging fromU.S. nursing practice norms.)
As one would expect, the taking of developmental courses is
a strong negative correlator with beginning nursing study; manyless academically prepared nursing hopefuls become discouraged oroutright fail at this point. But the special flavor of the StudyMajor column is given by the A&S Course-taking and AlternateCollege Experi.ence variables, found important only here. Thatalternate college experience (which includes prior non-PGCCexperience) appears significantly related to taking the plunge intonursing ,.:ourse suggests the hypothesis that more broadly preparedor veteran student may have acquired better, more definite careerdirection than her more novice counterpart. The case of the verystrong negative correlation between beginning nursing study andabove average course-taking in the humanities and social studiesis more difficult to speculate upon. The variable was originallyincluded in the hope that it might serve to indicate a waninginterest in nursing brought on by a waxing interest in othersubjects. Unfortunately the timing of A&S Course-taking (whetherit occurred before or after the inner decis. )n not to followthrough on initial nursing interest) cannot be pinned down. Ifbefore, then the finding does suggest the subversive effects ofexposure to other disciplines; if after, it merely shows that thereis academic life after nursing.
But although the interpretation of A&S Course-taking impacton Studying Major ccrversion is ambi uous, the total lack ofsignificant impact on Nursing AA Graduation and NCLEX Passingunambiguously allows for the cancelation of some other interestinghypotheses. One might theorize that many non-nursing courses wouldspread nursing student energies too thinly, thus interferi.-g withprogress toward the degree and beyond. Or, the revere might haveproved true -- that A&S courses energize and intellectually enhancestudents no matter which discipline they are pursuing. Accordingto our data, neither Lleory is demonstrable.
The most interesting thing to us about the Nursing A.A.Conversion column is how it is dominated by the two academicvariables which have o do with shear effort -- Full-Time Study
37
'3 '4I

(delta = +43) and Long Haul Study (+29). Apparently, students whodedicate their waking hours to nursing study or who just hang inno matter what the exigencies or who do both dramatically increasetheir chances of winning a Nursing A.A. in the end. ^This may not
sound like news, but what may be news is how lss importantacademic perfolmance is in comparison. (Althotigh in absoluteterms, not at all unimportant: delta = +17.) Thr. grading systemhas acted as a weaker academic filter than one might legitimatelyhave expected it to act.
One thing that it would be good to reiterate at this point is
that the only academic performance variable that countsanalytically in this study is General, not Nursing GPA. As we havealready discussed, the correlatiun between the twc proves so highthat it is virtually impossible to separate out their individualeffects upon student progress. And since General GPA'scorrelations with outcome alwaYs tarns out to be somewhat strongerthan parallel Nursing G.P.A. correlations, we have dropped thelatter as both redundant and less ind%cative of performanceeffects.
Compared with the data configuration of the Nursing A.A.Conversion column, that of the NCLEX First-Time Pass column ispractically the reverse. Here academic performance variablesdominate -- Developmental Math Course-taking (delta = -31) andGeneral G.P.A. (+30) -- while effort measures distinctly tckesecond place -- Full-Time Study (+13) and Long Term Study (-12).Perbaps there is little surprise at this, since the NCLEX after allis both an exercise in and a measure of academic performance.Truly, the most intriguing finding in this column has to do witheffort, the seeming sieciative impact of study duration upon NCLEXpassing. As an hypothesis, we suggest that study duration withrespect to the NCLEX may actually function as a sort of academicperformance variable. For ss.udents of lesser fact-retentionability, a long spreading out of study may mean loss of much early-gained knowledge, leading to lower NCLEX scores.
It remains to explain why the study substitutesDevelopmental Math Course-taking for any Developmeatal Coursa-taking in the analysis of the NCLEX outcome. The reason has to dowith the desire always to utilize the most potent possible measureof a particular concept when there are several conceptuallyequivalent measurer., available. This was the basis of our decisionto employ General GPA rath,_r than Nnrsind GPA or both to4ether togauge course pei2ormance. As it tLrned out, general D,velopmentalCourse-taking showed higher impact upon Studying Major anz! Nur-ingA.A. outcome than did any particular variety of DevelopmentalCourse-taking considered separately. But not in the NCLEX Passingcase; here indicated need for remedial training in mathematicsclearly surpassed generally indicated remediation need (deltas -31and -26, respectively). That indicated poor math preparationspecifically should reveal the most power when it comes to NCLEX
38
4 0

performance may in itself be significant. Perhaps the mathematicaldimension of the NCLEX examination poses a special problem to ournu:sing graduates, at least to those whose math skills have alwaysbeen questionable.
ANOVA Outcome Results. The above discussion of raw outcomecorrelations had to be provisional because measurement of thestrength of simple one-on-one relationships cannot be trusted toproduce reliable estimates of pure variable weights when theenvironment conditioning an outcome is a complex field ofrelationships. In this circumstance, causal variables have a wayof impinging upon one another in the producti,n of the overalleffect, and it often turns out upon an analysis which trulyisolates indivi,Lial effects that seemingly powerful variables areactually weaker contributors to a phenomenon while seemingly minorvariables prove to have major impacts once the statistical noiseproduced by other factors is filtered out. But this point,perhaps, is best made by illustration, as below:
White Non- FT PT
ALL: % A.A. 60 37 D=+23 ALL: % A.A. 83 40 D=+43
White Non- FT PTFT: % A.A. 85 75 D=+10 WHT: % A.A. 86 47 D=+39PT: % A.A. 47 28 D=+18 NWH: % A.A. 75 28 D=+47
Avr: D=+15 Avr: D=+43
We have already noted that the raw Nursing A.A. correlationsof Race/White (delta = +23) and Full-Time Study (+43) are among thestrongest. But what happens when we introduce statisticalcontrols, for example correlating Race with Nursing Graduationwhile controlling for the effect of Study Time and vice versa?
Controlling for the effect of Study Time reduces the delta-correlation of Race/White upon Nursing Graduation from +23 to only+15 (or by 35 percent of initial delta) whereas controlling theStudy Time-Graduation relationship for Race/White has no impact onthe strength of Study Time's power. Once it is known that thewhite nursing student group cont. almost four out of five of allfull-time nursing students, what . ing on here becomes easy tofigure out. The Full-Time/Non-wh... jraduation is almost as goodas the white graduation rate, but ve.y few non-whites are full-timestudents. Over a third of the Race/White-Graduation connection isspurious and is really the Full-Time-Graduation connection indisguise. That is why statistical controls are so important.
The kNOVA method, in effect, is a way of working out thesimultaneous impacts of each variable upon all other variables sothat in the end each variable's pure singular causal weight is
3e.
4 1

discerned. Put another way, it is a technique for controllingeverything by everything all at once. Furthermore, the entirecorrelation matrix is weighed by ANOVA for total impact.
We subjected each all-variables outcome correlation matrix toan exhaustive series of ANOVA tests with the goal of identifyingthe three best models of PGCC Nursing Program outcome. Each modelhad to meet this objective -- that it be he. ld up out of smallestset of causal variables capable collectively of explaining at lea.95 percent of the outcome variance accounted for by all thevariables. In other words, our goal was the construction of themost powerful yet most parsimonious model possible to explain eachoutcome.
The results are summarized in Table 18 (p. 39). The Tablereports the final analysis of variance results for the threeoutcome models surviving the test series, plus ANOVA statistics fortwo variant models. For each model, percents of outcome varianceexplained are shown only for those causal variables actuallyincluded in the model, plus the total variance by the whole model.(The direction of relationship, called "effect" here, is alsodisplayed in the form of plus and minus signs.)
TABLE 18. NURSING PROGRAM OUTCOMEOF ANALYSIS OF
Model
MODELS --VARIANCE RESULTSSUMMARY
A
(Effct) / (Effct)/% Var Ex % Var Ex
(Effct)/% Var Ex
CI
(Effct) / (Effct) /% Var Ex % Var Ex
Main Effects Studying Nursing Nursing 1st Pass 1st Pass
Variables Major A.A.-1 A.A.-2 NCLEX-3 UCLEX-4
ANOVA Tests*White (+) 7.4 (+) 4.8 (+) 8.7 17.3
Older Student (+) 4.3 (+ 1.6
Fulltime (+) 7.4 (+) 10.5 (+) 12.6 --
Long Study (+) 12.8 (+) 13.4
Oth College (+) 2.1 OM OM
Gen GPA (+) 1.9 (+) 2.3 (+) 6.5 (+) 15.5
Devl Crs 1+ (-) 1.1 (-) ).3 (-) 2.0Math (-) 7.9 (-) 3.2
A&S Crs 2+ (-) 13.9
TOT VARIANCEEXPLAINED 31.9 31.3 30.2 27.5 44.5
* Standard Analysis of Variance, main effects only.1- White var included 3- Dichotomous dependent var (n=237)2- White var excluded 4- Raw Score dependent var (n=158)
40

Column A models the Studying Major outcome which includes fivevariables (total variance explained 31.9 percent):
A&S Course-Taking (-) 13.9 Other College (+) 2.1Full-Time Study (+) 7.4 Devl Course-Taking (-) 1.1Race/White (+) 7.4
Above average enrollment in number of humanities and social sciencecourses proves to be the single strongest element of the StudyingMajor model, given a percent variance explained (PVE) figure of13.9, almost twice as high as the next. The more A&S coursestudents take prior to launching into nursing study, the lesslikely will be that launching. Unfortunately, as we have alreadyremarked, the variable's timing and therefore its meaning is highlyambiguous -- does attending a lot of A&S cotses tend to divertUnbegun Nursing Majo:s from nursing study or do Unbegun NursingMajors tend to take a lot of such courses because they have alreadyturned away from nursing study? More research has to be donebefore this question can be cleared up.
The next weightiest element of Model A is Full-Time as opposedto Part-Time study (7.4 PVE); one might argue that taken togetherwith Other College Experience (2.1 PVE) a kind of "I (now) knowwhere I'm going" factor is formed explaining almost 10 percent ofthe outcome variance. The implication is that having a sense ofpurpose and direction is as important lead into commitment to astudy program like nursing.
Developmental Course-taking makes the Model A ciAt though justbarely (1.1 PVE). While lack of academic preparation and thehurdle of remedial instruction do take their toll on would-benursing students, apparently th se are relatively minor deterentsto nursing study over all. Much more important is Race which showsan irreducible 7.4 PVE impact on Studying Major conversion.
Cclumn B models the Nursing Graduation outcome which alsoincludes five variables (total variance explained 31.3 percent):
Long Time Study (+) 12.8 High General G.P.A. (+) 1.9Full-Time Study (+) 10.5 Devl Course-Taking (-) 1.3Race/White (+) 4.8
With two exceptions, this is the same list in variableinclusion and weight as we saw emerging from consideration of theraw Nursing Graduation correlations. The first exception is theabsence of Non-Citizenship. There were simply too few foreignnursing majors at PGCC to make a dent in the total NursingGraduati,.n variance, despite the strength of the relationshipwithin this tiny group.
41

The other exception is far more important. In raw correlationterms, the Race/White factor was far more impressive than itappears here represented by a relatively small PVE of 4.8. Thisweight looks feather-light compared with the combined over 23percent varir-ce explained by the two effort variables -- Durationof Nursing St-ady (12.8 PVE) and Full-Time Study (10.5 PVE). Infact, if the purpose of the analysis is shifted from creatingmaximally explanatory models (discerning causal structures) togenerating merely highly predictive ones, then the Race variableis not strictly needed. Model B' tests the effect of removing Racefrom the original B Model, and reveals that it is minimal. Thevariant model's total PVE is only 1.1 percent less than that ofModel B. In any case, the true story found in Model B is theoverwhelming importance of plain effort in procuring a nursingdegree at PGCC. Three out of four Nursing A.A. explanatory pointscontributed by the m,del derive from the two effort variables.
Column C models the NCLEX Passina outcome which includes onlyfour variables (total variance explained 27.5 percent):
Race/White (+) 8.7 High General G.P.A. (+) 6.5Devl Math-taking (-) 7.9 Older Students (+) 4.3
The main lesson to be derived from Model C, as we tentativelyposited based on raw correlations, is that NCLEX performanceheavily depends upon past college academic performance.Collectively, shaky math skills (7.9 PVE) and good grades (6.5)account for over half of all model-explained NCLEX Passingvariance. But Model C allows the addition of a corollary to thisbasic insight: adequate preparation in mathematics is the singlemost important academic element in determining NCLEX outcome.
The relative importance of student age in NCLEX performanceis the entirely new and unanticipated finding co emerge from thecreation of Model C (Age/Older Student PVE r-- 4.3). The raw NCLEXcorrelation turned up hardly a hint that this might be true (delta= +6 only); the importance of the Age variable uncovereA throughANOVA testing was almost totally masked by the stronger surfaceeffects of other factors. Age seems to be operative in a definitebut indirect fashion, interacting with other va_iables to amplifyor diminish their impacts. For example, The simple NCLEX delta forRace is +23, but when Race is crossed with Age the following deltasare obtained: Young/Race = +7, Older/Race = +36. This is thebasic pattern. Younger NCLEX takers show more solidarity and breakless on other variables when it comes to exam success; among OlderNCLEX takers, the examination effects of other forces are enhanced.In our data, both younger whites and non-whites fall towards themiddle in NCLEX performance (78 and 72 percent passing,respectively), while older whites occupied the performance peak (99percent passing) and older non-whites the nadir (62 percentpassing).
42
4 4
Which partly anticipates Model C's last finding -- Race is thesingle most important predictor of recent PGCC nursing graduatesuccess on the NCLEX (8.6 PVE). This is in striking contrast tothe Nursing Gradnation case, where the initial finding ofextraordinary Race impact did not survive ANOVA testing. In theNCLEX case, no matter what statistical controls were introduced,the Race factor remained as the predominant outcome determinant.Not even taking into account prior correlations of Race with othervariables like course grade performance and level of pre-collegeacademic preparation could shake this finding. Why this should beso cannot be determined from the data at hand, and is well worthfurther research. Fcr the moment, we are left only withspeculations, perhaps the most likely of which is that there maybe something to the growing suspicion among many in the nursingcommunity concerning possible inadvertent cultural bias in thestructure and language of the NCLEX itself. By itself, our -tudywould be a "weak reed" to build an entire case on, but ic isanother "straw in the wind."
The issue is a vital one for PGCC's nursing program. Thoughits performance may be considered adequate or better than adequatein most areas, the one truly worrisome area is the NCLEXperformance of its graduates of late. And performance has declinedover the same recent years which have been showing simultaneousgrowth in the proportion of non-white nursing majors, includingolder non-white nursing majors who manifest the greatest difficultyin handling the NCLEX and who have increased from 20 percent of allnursing majors before 1979 to 30 percent 1984-1989.
Our Column C findings suggest that the PGCC Nursing Programis on the right track to promoting better NCLEX performance in itsrecent serious attempts to enhance the biology and other componentsof its instructional base for improved nurse training (A'Hearn &Basili/1989) and in its work in helping its students overcome prioreducational deficit by revising its entry mathematics requirementsand establishing projects like NEPP. The data do indicate thatregardless of racial backgrounfl, the better course traired are ourgraduates the beLter they perform on the NCLEX and the poorer theirearly academic ability, especially in mathematics, the lower theirchances of licensing.
But what the program can do ab..,ut the race factor per se isdifficult to say. PGCC is a public open-enrollment institlitionwith the mission of serving the educational needs of a county whichhappens to have a growing majority non-white population. Thismeans that as a matter of course a non-white nursing studentmajority and an increasing one, which mc.kes the PGCC nursingstudent boay exceptional compared with that of its institutiynalpeers in Maryland and across the nation where typica'ly whitesdominate. It also implies that so long as NCLEX pJrformanceremains race-linked in a way independent of somewhat controllaplefactors like amount and quality of student learning, PGCC nursing
43
.1 5
graduate performance will appear relatively poor. If the link isforged in the NCLEX itself by some hidden cultural bias, then theproblem ultimately can be solved only by the powers that be, andnot by our program.
On the other hand, there may be "meanwhile" steps the programcan take to mitigate this situation. First, it might try todiscover new ways to help minority students identify and deal withwhite majority-oriented exam material and structures should anyexist in the NCLEX. Second and perhaps more importantly, it mightfocus its extra efforts on older non-white students, because ourdata strongly suggest that younger non-whites in the program tendto approach white student NCLEX performance norms, all things beingequal, while it is the older non-white who txmly tend to lagbehind.
Finally in this NCLEX outcome section, we nay compare theresults of our study with those of researchers from other highereducational institutions who have investigated the correlates ofnursing graduate licensing success. There exists a reasonablylarge literature with this concern (see Appendix Reference Table),but several caveats are in order before we can begin comparison offindings. First, only one of the published research came out ofa community college setting; the remainder were conducted at mostlyMidwestern universities and four-year colleges using graduates ofBachelor of Science in Nursing programs as subjects. Second, notone of the study graduate samples contained analyzable numbers ofnon-white students, except for one which focused on black graduatesto the exclusion of all others [Outtz/1979). Third, with twoexceptions [Whitly/1986; Woodham/1986J, all of the studies dealtnot with the NCLEX but with its predecessor -- the State Board TestPool Examination (SBTPE). Fourth, our study was the only onefounded on the ANOVA method; all the rest employed multipleregression analysis, which is similar in its mathematicalunderpinnings h t which has a different research goal (predictionrather than explanation), and which tends to produce slightlydifferent results in model variable-inclusion given the same data.
With all of the above divergences from our own work,nevertheless the literature review revealed that our study'sfindings were not out of line with those given by previousresearchers on the subject. For example, all of the studies coveredturned up significant correlations between licensing . st successand college course performance measures like cumulative ZPA. Oneresearch project confirmed our specific finding that General GPAis more strongly predictive of licensing test performance thanNursing Course G.P.A. [Seither/1980], two others found littlediffercnce between them as predictors [Perez/1977; Whitly/].986],while a fourth reversed their precedence [Yocum/1985]. Most ofthem also test.itd a range of other specialized course performancescales, particular measuring natural science performance as apredictor of licensing success, with much contradictory result.
44
4 r.
The four-year college study [Perez/1977] showed unambiguously goodpredictive results from a measure based on social science courseperformance, which runs somewhat counter to our null-finding forA&S course-taking's impact on NCLEX performance.
Prior academic preparation was also featured by all studies,although measured in an extreme variety of ways (SAT scores,remedial course placement scores, high school course performance,etc.). It too was found significantly correlated with licensingtest performance. Most researchers found poor English languageskills a hinderance to license exam passing, as did we, but opiniondiffered OD the impact of poor matn skills thich we found highlysignificant. The Northwestern University project agreed with us(Whitly/1986], the Indiana University project did not(Woodham/1986]. Lastly, little use was made of demographicvariables in the research reviewed; mostly, our findings here standalonL, as do those on Study Time and Duration which were alsoignored except in one inclusive case [Yocum/1985].
The Reliability of Study Outcome Findings. The decision toemploy ANOVA as the methodological basis of this study stemmed fromthe desire to utilize the most powerful explanatory statisticaltechnique available. Our main goal was to x-ray the structure ofcausality determining nursing program outcomes; the mere generationof predictive equations, however accurate, could not give us whatis critical -- the understanding of the whole pattern of programsuccess and failure necessary in strategizing future improvements.Other statistical approaches would have been more strictlyappropriate given the nature of our data [Yocum/1987], but none ofthose could have readily taken us beyond prediction intoexplanation. Only ANOVA could do so. Thus, despite certain costsin accuracy lost and risk of unreliability run to which we alludedearlier, we opted for analysis of variance. But cognizant of theseloses and risks, we also decided to attempt an indirect validationof our ANOVA-based findings by re-rLaning the data using alternatemethods and then corparing these results for compatibility with andconfirmation of the original results.
The last column on Table 18 presents the C' Model of NCLEXoutcome. Lodel C' was created not so much to test for analtcrnative to Model C as it was to provide a hint of how muchstronger Model C (and by implication also Models A and B) mighthave been had we available to us better data. Our study's mainmethodological problem has been the restriction to entirelycategory-level data, on both the causal variable and outcomevariable sides of the equation. As we already explained, wemanoeuvred around this difficulty by converting all variables intobinary scales (losing data power in the process) so that ANOVAwhich requires integer scales could be utilized. But we mentionedat the time that one consequence inevitably would be an artifactualdeflation of impact estimates. That is, the correlations thus
45
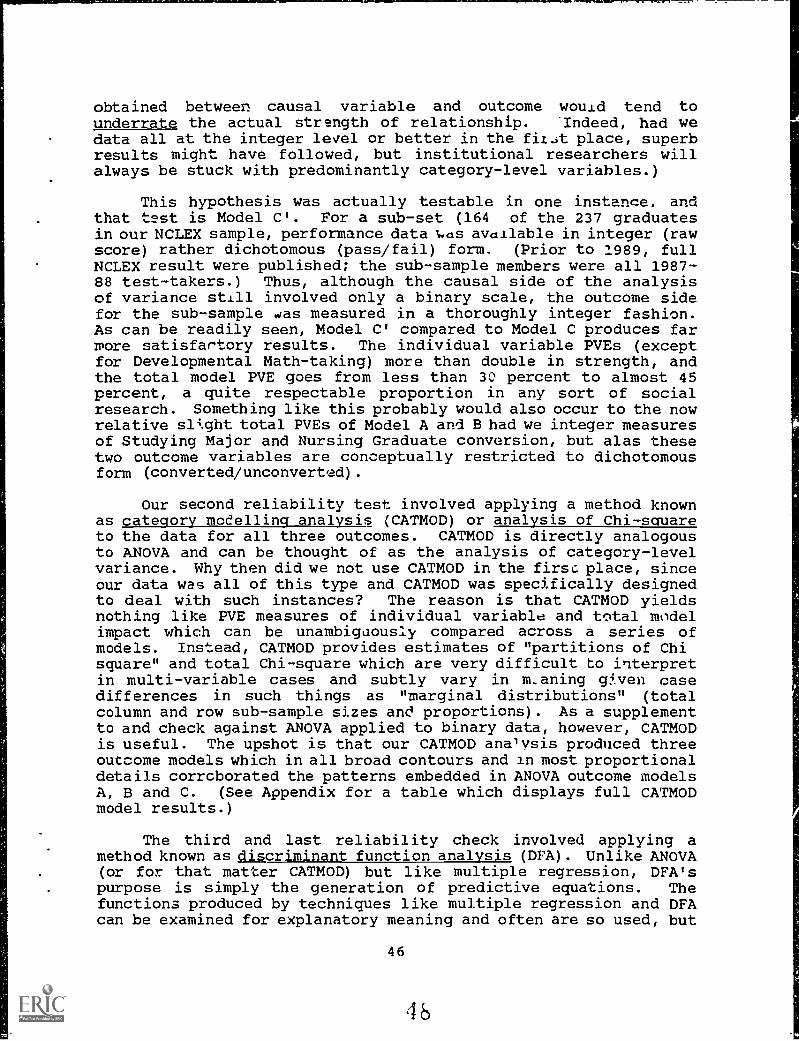
obtained between causal variable and outcome would tend tounderrate the actual strength of relationship. Indeed, had wedata all at the integer level or better in the fit.st place, superbresults might have followed, but institutional researchers willalways be stuck with predominantly category-level variables.)
This hypothesis was actually testable in one instance, andthat test is Model C'. For a sub-set (164 of the 237 graduatesin our NCLEX sample, performance data %yds avdilable in integer (rawscore) rather dichotomous (pass/fail) form. (Prior to 1989, fullNCLEX result were published; the sub-sample members were all 1987-88 test-takers.) Thus, although the causal side of the analysisof variance still involved only a binary scale, the outcome sidefor the sub-sample was measured in a thoroughly integer fashion.As can be readily seen, Model C' compared to Model C produces farmore satisfartory results. The individual variable PVEs (exceptfor Developmental Math-taking) more than double in strength, andthe total model PVE goes from less than 30 percent to almost 45percent, a quite respectable proportion in any sort of socialresearch. Something like this probably would also occur to the nowrelative snght total PVEs of Model A and B had we integer measuresof Studying Major and Nursing Graduate conversion, but alas thesetwo outcome variables are conceptually restricted to dichotomousform (converted/unconverted).
Our second reliability test involved applying a method knownas category modelling analysis (CATMOD) or analysis of Chi-squareto the data for all three outcomes. CATMOD is directly analogousto ANOVA and can be thought of as the analysis of category-levelvariance. Why then did we not use CATMOD in the firs': place, sinceour data was all of this type and CATMOD was specifically designedto deal with such instances? The reason is that CATMOD yieldsnothing like PVE measures of individual variable and total modelimpact which can be unambiguously compared across a series ofmodels. Instead, CATMOD provides estimates of "partitions of Chisquare" and total Chi-square which are very difficult to interpretin multi-variable cases and subtly vary in m_aning gven casedifferences in such things as "marginal distributions" (totalcolumn and row sub-sample sizes and proportions). As a supplementto and check against ANOVA applied to binary data, however, CATMODis useful. The upshot is that our CATMOD analysis produced threeoutcome models which in all broad contours and in most proportionaldetails corrcborated the patterns embedded in ANOVA outcome modelsA, B and C. (See Appendix for a table which displays full CATMODmodel results.)
The third and last reliability check involved applying amethod known as discriminant function analysis (DFA). Unlike ANOVA(or for that matter CATMOD) but like multiple regression, DFA'spurpose is simply the generation of predictive equations. Thefunctions produced by techniques like multiple regression and DFAcan be examined for explanatory meaning and often are so used, but
46
4

by design fortune telling is the real point -- using past trends,mathematically expressed in formulas, to project future outcomes.DFA can be thought of as multiple regression using categoryvariables. In DFA, the predicted variable is always of thecategory type (e.g., pass/fail) and a formula or "discriminantfunction" works in all of the causal variables (integer scales)used to describe a population, converting population known orestimated population values into probabilities of placement intothe first, second or nth category of the outcome variable --highest probability wins. DFA is not much used in social scienceor educational research but it is a prime tool in marketingresearch were outcomes of interest are naturally categorical (e.g.,Brand X purchase/Brand Y purchase) and where the premium is put onanticipating, not understanding, consumer behavior.
Adopting the marketing outlook for the moment, could it notbe said that one quite reasonable test of the validity of anymodel's ability to capture a phenomenon in microcosm is theability of that model to make accurate determinations of theempirical behavior of that phenomenon? In other words, if it canbe well predicted, then it is well modelled. There are very realresearch dangers, of course, in such "black box" thinking, but usedas the basis of a secondary test of findings derived by morecareful means it has its place. Our last reliability test tookadvantage of these assumptions. We generated a discriminantfunction out of the causal variables of each PGCC nursing programoutcome model, predicted the outcome placement of our samplemembers and then compared that predicted placement with the knownplacement. The results are that in each outcome case, we accuratelypredicted the placement of over 70 percent of our sample members,results at least 44 percent better than random guessing in two-category cases:
Percent Properly Classified
DF Model for: NO YES TOTAL (Base)
Studying Major (A) 74 74 74 (5241)Nursing A.A. Grad. (B) 74 74 74 (2196)Nursing A.A. Grad. (B') 69 78 74 (2196)NCLEX 1st Time Pass (C) 65 79 76 (237)
Executive Summary and Conclusions
This report has covered a wide variety of PGCC nursing programissues and generated a comprehensive set of empirical findings onprogram performance. In this final section, we would like togather together in summary form the substantive results of our
47
4 1- )
study.
1. In numerical terms, the nursing program at Prince George'sCommunity program is extremely healthy. Nursing enrollment anenursing course credit hour totals are among the six highest of theCollege's more than thirty instructional programs and curricula;moreover both are experiencing exceptional growth at a time whenCollege enrollment and credit-hour generation is declining overall. The shear size of the PGCC nursing program is also impressivecompared with those of other state community colleges. PGCC's isthe largest in Maryland, training almost one in every eight two-year program nursing majors.
2. Compared demographically with PGCC's credit student bodyas a whole, the nursing program's segment is disproportionatelyfemale, older (26 years plus), married, foreign and non-white, andwith the exception of gender, these attributes are the result oflong term and continuing trends.
3. The most distinctivt. characteristic of the nursing studentbody is the predomination of non-whites (seven out of ten). In thelast five years minority enrollment in the nursing program has beenan accelerating trend paralleling and surpassing the whole Collegetrend. The result has been to place PGCC's nursing program in analmost demographically unique position. None of the othercommunity college nursing programs in Maryland, and few in thenation, are "majority minority" or even close.
4. Compared academicz. _1r with PGCC's cr.edit student body asa whole, the nursing program's segment is disproportionately part-time (approaching 100 percent in recent years, partly a functionof changes in counselling policy) and non-PGCC college experienced.Nursing major all-courses grade performance is high (about .50better in general cumulative GPA), and nursing major term-to-termretention rate is also superior.
5. The single most striking academic finding of the study isthat fully one-half of all students since 1968 who are officiallyrecorded as "nursing major" in fact never attempted a singlenursing course. Put another way, only 50 percent of all declarednursing majors turned out upon examination (the taking of eitherof two entry-level nursing courses) to be genuine nursing students.This raises two unanticipated issues: (a) level of programperformance in "occupational interest" retention; (b) reform ofprogram performance measures (use of "studying major" rather than"declared major" as the base for graduation rate calculations,etc.).
6. Analysis of PGCC nursing program success focused onSt dying Major, Nursing Graduate and NCLEX Passing outcomes andtheir rates. The analysis aimed at producing the fairest, mostaccurate and realistic conversion estimates by taking into account
48

long-term trends, estimator instability of the most recent data,the clarity provided by cohort analysis and variant results givenalternative calculation bases (declared vs. studying major). Thefollowing best "recent years" estimates were obtained:
* Conversion to Studying Major
* Conversion to Nursing Graduate
* Conversion to Registered Nurse
- 50 % of Declared Majors
- 28 % of Deenred Majors(56 % of Studying Majors)
- 22 % of Declared Majors(44 % of Studying Majors)(80 % of Nursing A.A.$)
7. The PGCC Nursing A.A. graduation rate since the beginningof the last decade has been suffering a slight year-to-year decline(about - 2 percent); its first-time NCLEX pass rate actuallyincreased for the first five years, but chen dropped 20 points toa low of 68 percent in FY 1988-89. Partial FY 1989-90 datapossibly but not certainly indicate the beginnings of a recovery(78 percent).
8. Comparison with peer institution data suggest (uncertainperformance index) that our nursing program's 1984-88 A.A.graduation rate has been normal given its size, but that it lagsmarginally behind the mean rate for all Maryland communitycolleges; on the other hand its graduation rate decline over thelast ten years appears to be less than the state community collegeaverage overall decline. Comparative first-time NCLEX passagestatistics, however, show PGCC consistently at a disadvantage,school-to-school and year-to-year.
9. By means primarily of ANOVA, the study attempted tocomprehend the structure of causality underlying the three nursingprogram outcome. Three outcome mo1els were produced, all of whichwere found to be highly explanatory and moderately predictive oftheir respective type of nursing student progress. The three were(variables listed in order of impact):
* Model A (Studying Major Conversion) -- A&S Course-Taking,Full-Time Study, Race/White, Non-PGCC Experience,Developmental Course-taking.
* Model B (Nursing A.A. Conversion) -- Long-Time Study, Full-Time Study, Race/White, General GPA, Developmental Course-taking
* Model C (First-Time NCLEX Passage) - Race/White, DevelopmentalMath Course-taking, General GPA, Age/Older.
49
5

10. Thus, the main underpinning of Studying Major conversionseems to be the maintenance of subject interest (as indicated bythe predominance of the A&S Course-taking); however, the criticalvariable here is inherently ambiguous and the finding should betaken as strictly provisional. Otherwise, variables suggesting theimportance of student purposefulness and clarity of directiondominate (Full-Time Study, Non-PGCC Experience) . Less ambiguously,the thrust of the Nursing A.A. conversion model is dedication andperseverance (Long-Time Study, Full-Time Study). Also clear is theacademic perfoxmance and readiness theme of the NCLEX passage model(Developmental Math Course-taking, GPA).
11. Just as important in all three of these models is the Raceeffect. Minority status was a debilitating factor in eachconversion. However, it was the single most prominent factor inonly the NCLEX passage case. The implication seemed to be thatthere may very well be something race-linked in the nature of thetest instrument itself operating here. Also of interest was theway the Age variable cropped up, which further analysis showedfunctioned by interacting with Race. The effect was thesuppression of passage differences among younger students and theirexaggeration among older ones. Most at risk of any group provedto be non ites over the age of 25.
In colusion, we would like to emphasize the planningimportanc of the study's outcome findings. Further research netAsto be carried out to pin down whether there truly is a loss-cf-interest factor operating during the early phase of a nursingmajor's career at PGCC or vhether we have turned up merely evidenceof the long overlooked but normal shake-out of new student academicobjectives. Concerning nursing graduation rates, the data showboth strengths and weaknesses. Fortvnately, this rate seemsla:gely a function of factors over which the nursing progran iscapable exercising some influence -- amount and concentration ofstudy. Also fortunately, its faculty and staff have alreadyundertaken some recent steps in this direction, particularly inplacing greater recent emphasis on student cademic counselling andby inaugurating such study support p.rojects as NEPP. Finally,concerning the performance area of least strength, the NCLEX -- thenursing program has already begun the process of the reform of theremedial education component (particularly regarding mathematicsdeficit) and enhancing the biology course component. Since NCLEXperformance i. so dependent on academic readiness, all of thesemoves are highly appropriate and should produce results. But asto the main negative correlate of NCLEX passaye -- minority status-- this factor is beyond the nursing programs ability to controlfor its power in all likelihood lies in tie examina,ion itself.
Karl BoughanResearch and Planning Analyst
50

A iPENDI X
51
53
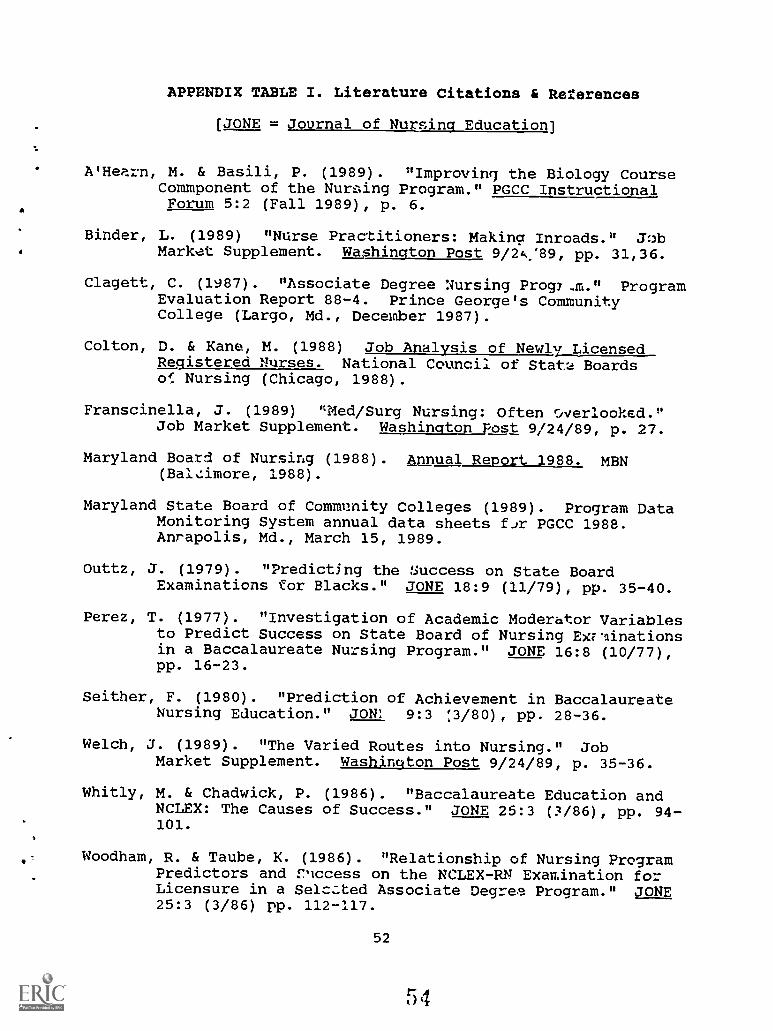
-.
,
APPENDIX TABLE I. Literature Citations & References
NONE = Journal of Nursing Education]
A'Hearn, M. & Basili, P. (1989). "Improving the Biology CourseComponent of the Nurzing Program." PGCC InstructionalForum 5:2 (Fall 1989), p. 6.
Binder, L. (1989) "Nurse Practitioners: Making Inroads." JobMarket Supplement. Washington Post 9/2c89, pp. 31,36.
Clagett, C. (1987). "Associate Degree Nursing Prov.m." ProgramEvaluation Report 88-4. Prince George's CommunityCollege (Largo, Md., December 1987).
Colton, D. & Kane, M. (1988) Job Analysis of Newly_LicensedRegistered Nnrses. National CounciI of Stata Boardso4: Nursing (Chicago, 1988).
Franscinella, J. (1989) "Med/Surg Nursing: Often f-..verlooked."Job Market Supplement. Washington Post 9/24/89, p. 27.
Maryland Board of Nursing (1988). Annual Report 1988. MBN(Bal,Amore, 1988).
Maryland State Board of Commanity Colleges (1989). Program DataMonitoring System annual data sheets Lir PGCC 1988.Anrapolis, Md., March 15, 1989.
Outtz, J. (1979). "Predicting the success on State BoardExaminations for Blacks." JONE 18:9 (11/79), pp. 35-40.
Perez, T. (1977). "Investigation of Academic Moderator Variablesto Predict Success on State Board of Nursing Exil-ainationsin a Baccalaureate Nursing Program." JONE 16:8 (10/77),pp. 16-23.
Seither, F. (1980). "Prediction of Achievement in BaccalaureateNursing Education." JONI 9:3 :3/80), pp. 28-36.
Welch, j. (1989). "The Varied Routes into Nursing." JobMarket Supplement. Washington Post 9/24/89, p. 35-36.
Whitly, M. & Chadwick, P. (1986). "Baccalaureate Education andNCLEX: The Causes of Success." JONE 25:3 (3186), pp. 94-101.
Woodham, R. & Taube, K. (1986). "Relationship of Nursing ProgramPredictors and rnccess on the NCLEX-RN Examination forLicensure in a Selc.-..ted Associate Degree Program." JONE25:3 (3/86) pp. 112-117.
52
54

Yoc:um, C. (1987). "Statistical Approaches to Educational ProgramEvaluation with New NCLEX Score Reporting." Nursing Issues8:6 (1987), pp. 5-7.
Yocum, C. & Scherubel, J. "Selective Pre-Admission and AcademicCorrelates of Success on State Board Examinations.JONE 24:6 (6/85), pp. 244-249.
53
rroo
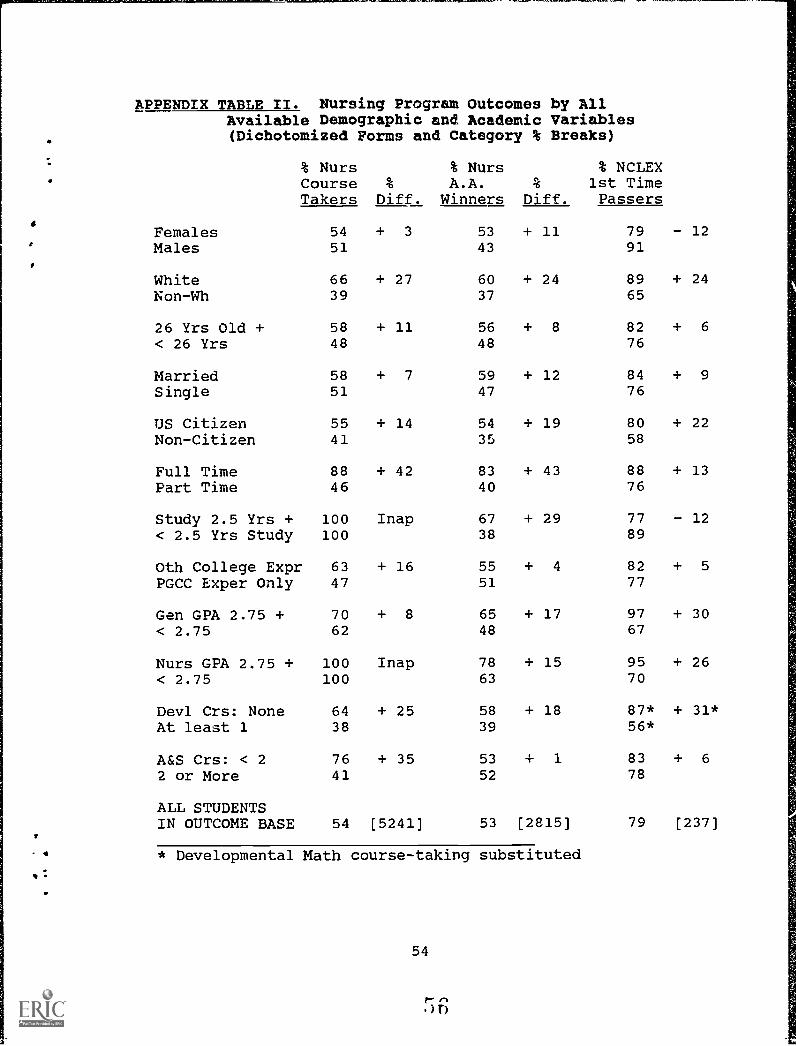
APPENDIX TABLE II. Nursing Program Outcomes by AllAvailable Demographic and Academic Variables(Dichotomized Forms and Category % Breaks)
% NursCourseTakers
%
Diff.
% NursA.A.
Winners%
Diff.
% NCLEX1st TimePassers
Females 54 + 3 53 + 11 79 - 12Males 51 43 91
White 66 + 27 60 + 24 89 + 24Non-Wh 39 37 65
26 Yrs Old + 58 + 11 56 + 8 82 + 6
< 26 Yrs 48 48 76
Married 58 + 7 59 + 12 84 + 9
Single 51 47 76
US Citizen 55 + 14 54 + 19 80 + 22Non-Citizen 41 35 58
Full Time 88 + 42 83 + 43 88 + 13Part Time 46 40 76
Study 2.5 Yrs + 100 Inap 67 + 29 77 - 12< 2.5 Yrs Study 100 38 89
Oth College Expr 63 + 16 55 + 4 82 + 5
PGCC Exper Only 47 51 77
Gen GPA 2.75 + 70 + 8 65 + 17 97 + 30< 2.75 62 48 67
Nurs GPA 2.75 + 100 Inap 78 + 15 95 + 26< 2.75 100 63 70
Devl Crs: None 64 + 25 58 + 18 87* + 31*At least 1 38 39 56*
A&S Crs: < 2 76 + 35 53 1 83 + 6
2 or More 41 52 78
ALL STUDENTSIN OUTCOME BASE 54 [5241] 53 [2815) 79 [237]
* Developmental Math course-taking substituted
54

APPENDIX TABLE III. Dichotomized Variables Used in AllNursing Program Outcome Analyses by CategoryPercentages ard Base Headcounts
*
AllMa.ors Base
AllCrs Tak Base
NCLEXSample Base
Females 92 (5241) 93 (2815) 95 (237)Males 8 8 5
White 55 (5241) 67 (2815) 59 (237)Non-White 45 33 41
26 Yrs Old + 49 (4949) 54 (2625) 60 (237)< 26 Yrs 51 46 40
Married 42 (5241) 45 (2815) 43 (237)Single 58 55 57
US Citizen 94 (5241) 95 (2815) 95 (237)6 5 5
Full Time 19 (5241) 30 (2815) 29 (237)Part Time 81 70 71
Study 2.5 Yrs + 52 (2461) 52 (2461) 85 (234)< 2.5 Yrs Study 48 48 15
Oth College Expr 41 (5241) 48 (2815) 46 (237)PGCC Exper Only 59 51 54
Gen GPA 2.75 + 39 (4123) 41 (2683) 41 (237)< 2.75 61 59 59
Nurs GPA t.75 + 42 (2144) 42 (2129) 37 (237)< 2.75 58 58 63
Devl Crs: None 61 (5241) 72 (2815) 75* (237)*At least 1 39 28 25*
A&S Crs: < 2 37 (5241) 48 (2815) 68 (237)2 or More 63 52 32
ALL STUDENTSV IN OUTCOME BASE 100 (5241) 100 (2815) 100 (237)-
V: * Dovelopmental Math course-taking slabstituted
55
57

a
APPENDIX TABLE IV. Nursing Program Outcome Models -- Summaryof Analysis of Chi-Square Analysis
(Category Modelling)
Main Effect-Variables
WhiteAge 26+ YrsFulltimeSem Study 2.5+Oth CollegeGen GPL 2.75+Devl Crs 1+Devl MathA&S Crs 2+
Chi-Sqr/(Prop Idx)TakingNur Crs
Chi-Sqr/(Prop Idx)WinningNur AA-1
Chi-Sqr/(Prop Idx)WinningNur AA-2
Chi-Sqr/(Prop Idx)1st PassNCLEX
111 (.09) 30 (.05) -- 3.6 (.13)4.0 (.15)
305 (.24) 249 (.45) 268 (.46)226 (.40) 229 (.39)
159 (.13) --40 (.07) 60 (.10) 11.0 (.40)
66 (.05) 15 (.03) :1,) (.05)8.6 (.32)
627 (.49)
TOT CHI-SQREAMONG VARS 1268
INTERCEPT/RES 490TOTAL CHI-SQR 1758
559113672
587118705
27.251.678.8
NOTE: Column figures outside parentheses are chi-squarescontributed by each variable to the model's total chi-square;those in parethesis are values of the "Proportion Index" andequal variable chi-square divided by model all-variable chi-square; intercept and residedual chi-squares represent totalchi-square variation unaccounted for by the model.
1,2 - See footnotes to Table 18.
56
56ERIC Clearinglibuse for
Junior Colleges
tli+C-ICHKIMItiren19416K+C4C1C4444-KV+C-1(____

Appendix 16
END
U.S. Dept. of Education
Office of EducationResearch and
Improvement (OERI)
ERIC
Date Filmed
March 29, 1991