Embed Size (px)
Citation preview

DOCUMENT RESUME
ED 305 312 SO 019 802
AUTHOR McKinney, C. Warren; And OthersTITLE Preservice Elementary Education Majors' Knowledge of
Economics.PUB DATE 88
NOTE 27p.; For related documents, see SO 019 803-805.PUB TYPE Reports - Research/Technical (143)
EDRS PRICE MF01/PCO2 Plus Postage.DESCRIPTORS *Economics Education; Educational Improvement;
Educational Research; *Education Majors; *ElementaryEducation; Elementary School Teachers; HigherEducation; *Knowledge Level; Methods Courses;*Preservice Teacher Education; *Social Studies;Teacher Effectiveness; Teacher Improvement; TeacherQualifications
ABSTRACTEvidence that elementary school children possess
inadequate economic knowledge is presented, and four arguments areoutlined for the importance of economics education in the publicschools: (1) economic knowledge is essential to civic duty in ademocracy; (2) economic knowledge is important when individualsattempt to function rationally in a complex, industrial society; (3)economic knowledge is unlikely to be acquired without instruction;(4) prior research indicates that children in the earliest grades canlearn economic concepts if ex?osed to an appropriate social studiescurriculum. It is suggested that elementary students perform poorlyon economics achievement tests due to inadequate economics knowledgepossessed by their teachers. This study is designed to assesspreservice elementary education teachers' knowledge of economics.Form A of the "Test of Economic Literacy" was administered to 113students enrolled in social studies methods courses at a southernuniversity. This 46-item test was subdivided into the following sevencontent areas: the basic economic problem, economic systems,microeconomics, macroeconomics, the world economy, economicinstitutions, and concepts for evaluating economic actions andpolicies. Student performance was evaluated and presented in ninetables detailing the percentage of correct responses by content area.Using 70 percent as the cutoff for a passing grade, only threestudents passed the test. The relationship between teacher knowledgeand student achievement is discussed, and additional economicstraining for teachers is recommended. A 17-item bibliography isincluded. (GEA)
**********************************************************t*******t****Reproductions supplied by EDRS are the best that can be made
from the original document.************t**********************************************************

/
Economics
1
Preservice Elementary
Education Majors' Knowledge of Economics
C. Warren McKinney
Oklahoma State University
A. Guy Larkins
University of Georgia
Kay C. McKinney
Stillwater (OK) Middle School
Allison C. Gilmore
Mercer University-Atlanta
Mary Jane Ford
University of Southwestern Louisiana
Running head: ECONOMICS
"PERMISSION TO REPRODUCE HIS U.S DEPARTMENT OF EDUCATIONMATERIAL HAS BEEN GRANTED BY Office of Educational Research and Improvement
e ithweN,,,,-,.,iay EDUCATIONAL RESOURCES INFORMATIONCENTER (ERIC)
Altai/yTha document has been reproduced asreceived from the person or organaationongmatmgd
0 Minor changes have been made to improvereproduction quality
TO THE-EDUCATIONAL lESOURCESINFORMATION CENTER (ERIC)."
2
Points of view of ornmons stated u) Ims 0..Cumerit do not neceSsanly represent officialOERI position or policy

%.
Economics
Abstract
The authors present evidence from the research literature that
elementary school children possess inadequate knowledge of
economics. Four arguments are given for the importance of
economic education in the public schools. It is argued that poor
pupil performance on economics achievement tests might reflect
vacuous social studies texts in the primary grades and an
inadequate stock of economics knowledge possessed by teachers.
Data from the present study support the latter claim; the mean
score for this sample of preservice teachers was less than 50% on
the Test of Economic .jt2rjxa. It is then argued that providing
teachers with additional training in economics could increase the
stock of economic knowledge possessed by their students.
3
2

Economics
3
Preservice Elementary
Education Majors Knowledge of Economics
Eighteen years ago, McKenzie (1970) found that children in
grades four and seven had "grossly distorted" economic knowledge.
Many believed that God controlled the price of goods, that most
factories and stores were owned by the government, that the
government rationed goods such as bubble gum, that average
citizens would be better off if they had a machine for printing
money, and that a house cost about $100. Recent attacks on the
public schools echo the belief that American children are
undereducated in all academic subjects, including history and the
social sciences (Magnet, 1988). Prior research by the current
authors (Larkins, Hawkins, & McKinney, 1985) supports that belief.
Should the economic ignorance of elementary school children
trouble us? We think so, for several reasons. First, economic
knowledge is essential to civic duty in a democracy. Public
issues that citizens have the right and duty to address have
economic causes and consequences. Rational decisions about public
policy concerning the national debt, foreign aid, social welfare
programs, military spending, and taxes cannot be made out of a
fund of economic ignorance. Second, public policy aside, economic
knowledge is important when individuals attempt to function
rationally in a complex, industrial society. Decisions about
career goals, employment, family finances, savings, investment,
and retirement can be informed by economic knowledge. Third,
4

Economics
4
economic knowledge is unlikely to be acquired without instruction.
We cannot depend on economic ignorance to be self correcting.
Fourth, prior research (Larkins, 1968) indicates that children in
the earliest grades can learn economic concepts if exposed to an
appropriate social studies curriculum.
How might we account for children's lack of knowledge of
history and the social sciences in general, and economics in
particular? Children's economic knowledge, like other
achievement, is influenced in part by variables which are not
controlled by schools, such as the academic ability of the child,
out-of-school experience, and family history. Two important
variables, however, are obviously related to schooling--the
curriculum, including textbooks, that children are required to
study, and the stock of knowledge possessed by teachers.
A recent study (Larkins, Hawkins, & Gilmore, 1987) found that
social studies texts in the primary grades contain vacuous,
superficial, redundant, and superfluous information. Too often
texts merely rearrange the information already possessed by young
children, rather than add to the children's stock of knowledge.
We are convinced that one reason children are ignorant of
important social science knowledge, including economics, is that
texts too often contain little that is worth learniag.
Not all texts are vacuous. The original editions of Science
Research Associates' elementary social studies series, Our Working
World, contained substantial economic information at all

F
Economics
5
elemantary grade levels, including grade one. That series,
however, is seldom found in public schools today, and none of the
series that we examined contain the quantity or quality of
information found in the older SRA texts. We suspect that part of
the decline in popularity of 2gr Workina World is that elementary
school teachers are not well-grounded in economics. We believe
that when teachers lack an adequate knowledge of history and the
social sciences, they reject texts which contain substantial
information.
Is our assumption about elementary teachers' lack of
knowledge correct? Larkins, Hawkins, and McKinney (1985) examined
social studies texts in grades one through four, then wrote a test
to reflect the content of those texts. The test was administered
to approximately 350 preservice elementary teachers enrolled at
major colleges in two southern states. If grading scales usually
applied in the elementary school were applied to this sample of
preservice teachers, only 3% would have received As, 25% Bs, 39%
Cs, 23% Ds, and 10% Fs. It should be kept in mind that this
instrument has content validity for grades on through four, and
should be an embarrassingly simple test for college students.
Kleg (1987) also tested the general social studies knowledge
of preservice elementary teachers, but his instrument differed
from Larkins, Hawkins, and McKinney (1985) in that it contained an
eight-item economics subtest adapted from the Tegt of Economic.
Literacy, as well as subtests in history, political science, and

Economics
6
geography. The four subtests combined contained 40 items, which
were administered to 98 students majoring in elementary education
at a midwestern university. Kleg's sample obtained z mean score
of 62% on the total test, and averaged 5.13 (66%) on the eight
items on the economics subtest.
Although Kleg (1987) extended the findings of Larkins,
Hawkins, and McKinney (1985), results from an eight-item economics
test are hardly convincing. Nor should we generalize from
preservice to inservice teachers. Those concerns are relieved
somewhat by examining one more study. McKenzie (1971)
administered the Test ofammuligLkaukEL to 144 inservice
teachers in three Virginia school districts. His results were
similar to those reported in studies summarized above. McKenzie's
sample averaged approximately 30 correct answers out of 50 items
(60%).
It is apparent that direct evidence about elementary teachers'
stock of economics knowledge is limited. Indirect evidence is
supplied by Walstad and Watts (1985) who reviewed state surveys
of economic education. An Ohio survey reported that 54% of
gathers (K-12) had no formal training in economics, and only 25%
had taken a single course. A survey in Idaho reported that 73% of
the elementary teachers had never taken an economics course. In
Wisconsin, 43% of the elementary teachers surveyed had no
economics coursework. Virginia requires one economics course for
elementary certification. In Indiana, 75% of the fifth-grade
7

Economics
7
teachers had taken no more than one economics course. Walstad
and Watts (1985) summarize their review thus: "In general, the
surveys of elementary teachers found that about half had no course
work and another 25% percent had taken just 1 course" (p. 139).
Clearly, information about the economic knowledge possessed
by elementary teLchers is limited. Additional information is
needed. The current study addresses that problem.
Procedures
Sample
One hundred - thirteen students who attended a university
located in a southern state and were enrolled in sections of a
social studies methods course composed the sample. All subjects
were female, and most were white. Approximately 10% were
classified as nontraditional in that they were over the age of 22.
The economics test contained a bibliograhic section which included
an item concerning prior economics instruction. Approximately 90%
of the subjects either left that item blank or checked "nc.".
Instumentation
Date were gathered using the 46-item, Form A, of Test of
Economic Literacy, which is published by the Joint Council on
Economic Education (Soper, 1979). In 1977 the Joint Council
released a major report by the National Task Force on Economic
Education, the Master Curriculum Guide for the Nation's Schools,
part 1, A Framework for Teaching Economics: Basic Concepts. In
recent years, major curriculum efforts for the public schools, K-
8

Economics
8
12, have been based on that framework. T92121:acamotillsa
is an updated version of the older :DMIL.J.ILa0M141cgndaL/LaatiD...g,
and is based on the JCEE Fr_artLeilpsh. Validity of the ItuL is
discussed in several publications, including Soper (1979) and
Walstad and Buckles (1983). The alpha for both forms of the TEL
is reported as .87 (Walstad & Buckles, 1983, p. 17). The test is
subdivided into the following seven content areas: (a) the basic
economic problem, (b) economic systems, (c) microeconomics:
resource allocation and income distribution, (d) macroeconomics:
economic stability and growth. (e) the world economy, (f) economic
institutions, and (g) concepts for evaluating economic actions and
policies. Three of these content areas have only one or two
items.
Findings
The frequency of the number of correct responses are
presented in Table 1. Scores ranged from six correct responses to
37 correct responses. Fifty-two percent of the students responded
correctly 4.o 21 or less of the 46 items. Using the traditional
70% cutoff for a passing grade, only three students would have
passed the test. The mean raw score was 21.68 with a standard
deviation of 6.67.
Insert Table 1 about here
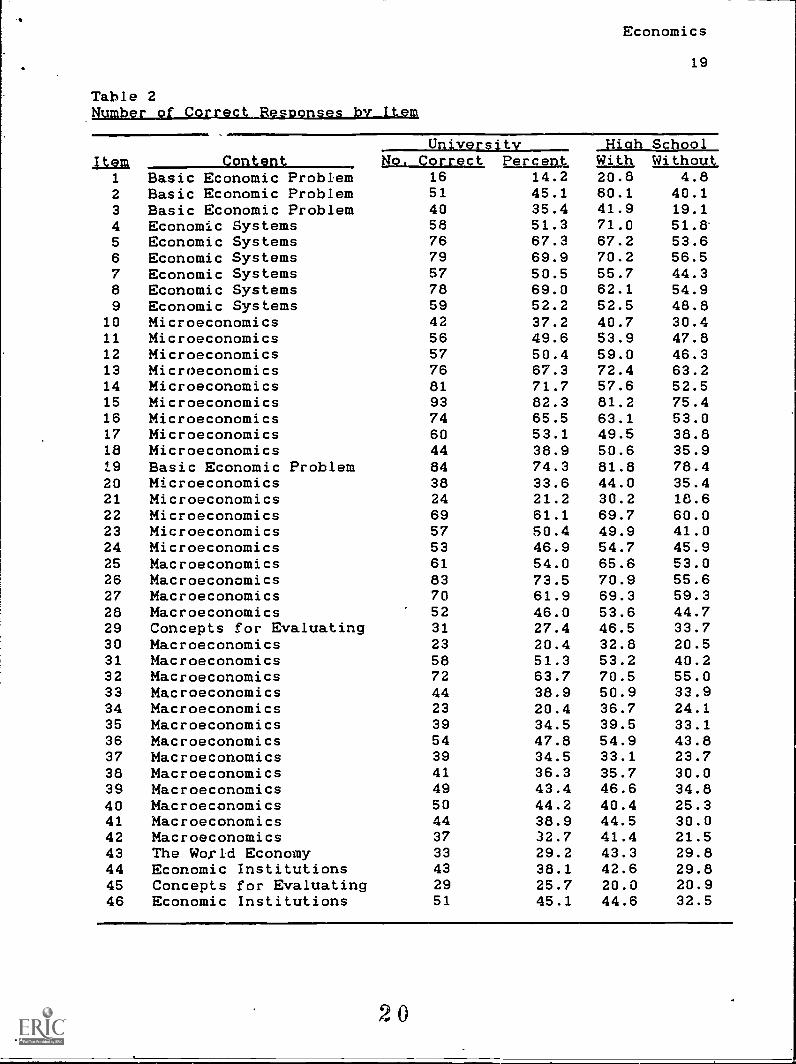
The number of correct responses by item for the university
9

Economics
9
sample and the percentage of correct responses for the university
sample, high school students who had taken an economics course,
and high school students who had not taken an economics course are
presented in Table 2. On only 20 items did 50% or more of the
students respond correctly. When comparecl to the high school
students (n=8,660), it is clear that the college sample scored
slightly better than high school students who had not taken an
economics course. However, the university students' performance
was inferior to the high school students who had taken an
economics course. If we take into account chance correct
response, it is clear that substantially less than half of the
university students could respond correctly to items on this
instrument.
Insert Table 2 about here
The percentage of correct responses for the four questions
that measured "the basic economic problem" are presented in
Table 3. Nearly one-half of the students responded correctly to
only one of the four questions. Eighty-four percent of the
students knew that as income increases, the rate and the amoun,, of
taxes increase. Only 51% knew that every economic system has to
deal with the problem of scarcity. Only 16% could identify
examples of land, labor, and capital. Forty percent could
recognize an example of opportunity cost.
10

Economics
10
Insert Table 3 about here
Six questions are related to the second content area,
economic systems. Slightly over 40% of the students responded
correctly to half of these items (see Table 4). Approximately 70%
knew that active competition is essential to a market economy,
that locations benefit from specialization and exchange, and that
the purpose of profits is to provide incentives for businesses to
produce what consumers want. Approximately 50% knew that higher
rents will most likely lead to an increase in the supply of rental
housing over time. Approximately 50% knew that all economic
systems have to answer ,.he question as to what goods and services
will be produced, and specialization and exchange will most likely
lead to the production of more goods and services.
Insert Table 4 about here
Fourteen items are related to the third content area,
microeconomics: resource allocation and income distribution.
Performance was best on two items. The first is related to the
law of supply and demand. The second tests for belief that an
increase in wages for teenagers would result in fewer teenagers
being hired. Performance was poor on items related to pricing
within an oligopolistic industry, the effect of a monopoly on
11

Economics
11
efficiency, the most likely cause of low income within the United
States, and recognition of a progressive income tax (see Table 5).
Insert Table 5 about here
There are 14 items related to macroeconomics, the
fourth content area. Students performed well on only one item- -
that the gross national product is the Jingle best measure of the
total economic output in the United States. Only 20% of the
students knew that lenders would be hurt more by unexpected
inflation than would farmers, debtors, or manufacturers; and that
the Federal Reserve Board'generally tries to increase the money
supply when it wants to fight unemployment (see Table 6).
Insert Table 6 about here
Only one item is related to the fifth content area, the world
economy. Twerty-nine percent of the students responded correctly
to this item. This question is concerned with the relationship
between tariffs and employment wit'iin protected industries (see
Table 7).
Insert Table 7 about here
1,17,!MIMIN--
Two questions are related to the sixth content area,
12
1

Economics
12
economic institutions. Fewer than half of the students responded
correctly to either of these items <see Table 8). One item tests
the advantage of the corporate form of business organization. The
other item tests whether labor unions strenghtened the bargaining
power of unionized workers.
aMMIal
Insert Table 8 about here
Two questions are related to the seventh content area,
concepts for evaluating economic actions and policies.
Approximately 94% of the students missed one or both of these
items (see Table 9).
Insert Table .3 about here
MialMar.
Taken as a whole, results of this study can summarized through
simple descriptive statistics. The mean raw score for our sample
was 21.68 out of 46 items. The standard deviation was 6.67.
Percent of correct response by item ranged from 14.2 to 83.3. On
the average, approximately 47% of our sample of preservice
teachers correctly responded to questions on the Ia. If we take
into account chance correct responses, it is clear that
substantially less than half of our subjects could respond
correctly to items on this instrument.
13

Economics
13
Discussion
It is difficult to escape the conclusion that preservice
elementary teachers in our sample do not possess an adequate stock
of economic knowledge to teach the concepts in the Master
Curriculum Guide recommended by the Joint Council on Economic
Education. Should we, therefore, recommend that additional
training in economics be required of elementary school teachers?
Our answer depends, in part, on whether such training improves the
economic knowledge of elementary school children. Would greater
teacher knowledge lead to increased student knowledge? Several
studies reported in the literature are relevant. Based on limited
evidence, the answer appears to be "yes".
Waistad and Watts (1985) conducted a statewide study
involving over 150 schools in Indiana. Economics achievement data
were gathered at four grade levels--5, 8, 11, and 12. Among his
findings, Watts reported that pupil achievement was related to the
time-lapse since the last economics course taken by teachers. The
more recent the course, the higher the pupil achievement.
Buckles and Freeman (1984) analyzed "the effect of a
traditional comprehensive K-12 DEEP project at all grade levels
over a three-year period in one school district" (p. 5). They
assessed the effect of the DEEP program on student achievement,
but did not separate the effects of teacher training on pupil
achievement from the direct effects of the curriculum.
Nevertheless, they concluded: "This study does demonstrate that
14

Economics
14
a traditional DEEP process of in-service training and curriculum
change can be extremely effective in increasing economic
understanding..." (p. 19).
Chizmar and McCarney (1984) evaluated the implementation of
"Trade-Offs". Teachers in the sample received either a one-day
workshop, a three-day workshop, a semester workshop, or no
training. The total sample included 555 students in grades four,
five, and six. The original sample contained approximately 1,200
students, but data for more than 600 were incomplete. Students of
teachers who received the semester workshop outscored students of
teachers who received the one-day workshop by an average of 11.86
points. Students of teachers who received the three-day workshop
outscored students of teachers who received the one-day workshop
by an average of 3.11 points. In'this study, the effect on pupil
achievement of teacher training in economics appears clear-cut.
Other studies, using a variety of samples and research designs
also indicate a positive relationship between teacher knowledge of
economics a u pupil achievement (Schober, 1984; Highsmith, 1974;
Thornton & Vrdeveld, 1977; Walstad, 1980). We located one study
which found no relationship between teacher knowledge and pupil
achievement (Lawson & .'Donnell, 1986).
We recommend that school districts, state departments of
education, and colleges of education which accept the arguments
in favor of economic education in the elementary grades require
additional training in economics for teachers.
5

Economics
15
References
Buckles, S., & Freeman, V. (1984). A longitudinal analysis of a
developmental education program. The Jour
Education, 11(1), 5-10.
Chizmar, J. F., & McCarney, B. J. (1984). An evaluation of a "Trade-
Offs" implementation using canonical estimation of joint
education production funntimls. The Journal of Economic
Education, 15(1), 11-20.
Highsmith, R. (1974). A study to measure the impact of in-service
institutes on the students of teachers who have participated.
The Journal of Economic Education, 1(2), 77-81.
Kleg, M. (1987). General social studies knowledge and critical
thinking among preservice elementary teachers: A comparative
survey. International Journal of Social Education, in press.
Larkins, A. G. (1968). Assessing achievement on a first'-arade
economics course of study. Unpublished doctoral dissertation,
Utah State University, Logan, UT.
Larkins, A. G., Hawkins, M. L., & Gilmore, A. C. (1987). Trivial and
noninformative content of elementary social studies: A review
of primary texts in four series. Theory and Research in,
Social Education, 11(4), 299-311.
Larkins, A. G., Hawkins, M. L., & McKinney, C. W. (1985, November).
P s ' k ial s content in
t.tepsdamsygsAaRsj_pbugtyo. Paper presented at the meeting
of the National Council for the Social Studies, Chicago.
16

Economics
16
Lawson, L. D., & O'Donnell, M. G. (1986). Identifying factors that
influence the learning of economics: A sixth-grade case
study. The Journal of Economic Education, 17(3), 177-185.
Magnet, M. (1988). How to smarten up the schools. Fortune, 1 a(3),
86-94.
McKenzie, R. B. (1970). The economic literacy of elementary school
pupils. Elementary aghool Journal, Z1, 26-35.
McKenzie, R. B. (1971). An exploratory study of the economic
understanding of elementary school teachers. The Journal of
Economic Education, 3(1), 26-31.
Schober, H. M. (1984). The effects of inservice trainma on
participating teachers and students in their economics
classes. The ..2otation, 1E(4),282-295.
Soper, J. C. (1979). Test of economic literacy: Discussion guide
and rationale. New York: Joint Council on Economic Education.
Thornton, D. L., & Vrdeveld, G. M. (1977). In-service education and
its effects on secondary students: A new approach. ma
azs"2ALaLziammi.s.__Essclation, 3(2), 93-99.
Walstad, W. B. (1980). The impact of "Trade-Offs" and teacher
training on economic understanding and attitudes. The Journal
of Economic Education, lam, 41-48.
Walstad, W. B., &Buckles, B. (1983). The new economics tests for
the college and pre-college levels: A comment. The Journal of
Economic Educsktion, LA(2), 17-23.

Economics
17
Walstad, W. B., & Watts, M. (1985). Teaching economics in the
schools: A review of survey findings. The Journal of Economic
Education, 11(2), 135-146.
18

Economics
18
Table 1Freauencv of Correct Responses
CorrectResponses Freauencv Percent
CumulativePercent
6 1 .9 .9
9 1 .9 1.810 2 1.8 3.511 2 1.8 5.312 4 3.5 8.813 2 1.8 10.614 1 .9 11.515 7 6.2 17.716 9 8.0 25.717 4 3.5 29.218 8 7.1 36.319 3 2.7 38.920 5 4.4 43.421 10 8.8 52.222 7 6.2 58.423 2 1.8 60.224 7 6.2 66.425 5 4.4 70.826 7 6.2 77.027 3 2.7 79.628 5 4.4 84.129 4 3.5 87.630 1 .9 88.531 2 1. 90.332 2 1.1. 92.033 5 4.4 96.534 1 .9 97.336 1 .9 98.237 2 1.8 100.0
Total 113 100.0
Economics
19
Table 2NL11102191SSZCZIGI132222112es----b21---11en
ContentUniversity Hiah School_
No. Correct Percent With Without,Item1 Basic Economic Problem 16 14.2 20.8 4.82 Basic Economic Problem 51 45.1 60.1 40.13 Basic Economic Problem 40 35.4 41.9 19.14 Economic Systems 58 51.3 71.0 51.8.
5 Economic Systems 76 67.3 67.2 53.66 Economic Systems 79 69.9 70.2 56.57 Economic Systems 57 50.5 55.7 44.38 Economic Systems 78 69.0 62.1 54.99 Economic Systems 59 52.2 52.5 48.8
10 Microeconomics 42 37.2 40.7 30.411 Microeconomics 56 49.6 53.9 47.812 Microeconomics 57 50.4 59.0 46.313 Microeconomics 76 67.3 72.4 63.214 Microeconomics 81 71.7 57.6 52.515 Microeconomics 93 82.3 81,2 75.416 Microeconomics 74 65.5 63.1 53.017 Microeconomics 60 53.1 49.5 38.818 Microeconomics 44 38.9 50.6 35.919 Basic Economic Problem 84 74.3 81.8 78.420 Microeconomics 38 33.6 44.0 35.421 Microeconomics 24 21.2 30.2 18.622 Microeconomics 69 61.1 69.7 60.023 Microeconomics 57 50.4 49.9 41.024 Microeconomics 53 46.9 54.7 45.925 Macroeconomics 61 54.0 65.6 53.026 Macroeconomics 83 73.5 70.9 55.627 Macroeconomics 70 61.9 69.3 59.328 Macroeconomics 52 46.0 53.6 44.729 Concepts for Evaluating 31 27.4 46.5 33.730 Macroeconomics 23 20.4 32.8 20.531 Macroeconomics 58 51.3 53.2 40.232 Macroeconomics 72 63.7 70.5 55.033 Macroeconomics 44 38.9 50.9 33.934 Macroeconomics 23 20.4 36.7 24.135 Macroeconomics 39 34.5 39.5 33.136 Macroeconomics 54 47.8 54.9 43.837 Macroeconomics 39 34.5 33.1 23.738 Macroeconomics 41 36.3 35.7 30.039 Macroeconomics 49 43.4 46.6 34.840 Macroeconomics 50 44.2 40.4 25.341 Macroeconomics 44 38.9 44.5 30.042 Macroeconomics 37 32.7 41.4 21.543 The World Economy 33 29.2 43.3 29.844 Economic Institutions 43 38.1 42.6 29.845 Concepts for Evaluating 29 25.7 20.0 20.946 Economic Institutions 51 45.1 44.6 32.5
20

Table 3
Economics
20
Percentage of Correct Responses by Content Area: The Basis,
cmiomic ProbIam
Number of
Correct Cumulative
Responses Freauencv Percent, Percent
0 7 6.2 6.2
1 48 42.5 48.7
2 36 31.9 80.5
3 17 15.0 95.6
4 5 4.4 100.0
Total 113 100.0
Standard Deviation=.955
21

Economics
21
Table 4
ElEalnlAa2_aLCorrect Responsqs by Coulpnt Are; Econon4c System:7
Number of
Correct
Responses_ EL2auftnai Percent
Cumulative
PercEtnt_
0 2 1.8 1.8
1 10 8.8 10.6
2 16 14.2 24.8
3 19 16.8 41.6
4 33 29.2 70.8
5 22 19.5 90.3
6 11 9.7 100.0
Total 113 100.0
Mean=3.602
Standard Deviation=1.503
22

Economics
22
Table 5
.= 2 .or; tq.
EgPource Allocation and Income Distribution
Number of
Correct
PesR2nses Erequencv Percent
Cumulative
Percent
1 2 1.8 1.8
2 5 4.4 6.2
3 9 8.0 14.2
4 8 7.1 21.2
5 12 10.6 31.9
6 15 13.3 45.1
7 2 1.8 46.9
8 9 8.0 54.9
9 21 18.6 73.5
10 12 10.6 84.1
11 /1 9.7 93.8
12 5 4.4 98.2
13 1 .9 99.1
14 1 .9 100.0
Total 113 100.0
Mean=7.292
Standard Deviation=3.067
23

Economics
23
Table 6 I C 11
Econoxic Stability and Growth
Number of
Correct
Responses Frequency Percent
Cumulative
Percent
1 1 .9 .9
2 1 .9 1.8
3 6 5.3 7.1
4 5 4.4 11.5
5 10 8.8 20.4
6 17 15.0 35.4
7 17 15.0 50.4
8 24 21.2 71.7
9 9 8.0 79.6
10 9 8.0 87.6
11 7 6.2 93.8
12 5 4.4 98.2
13 1 .9 99.1
14 1 .9 100.0
Total 113 100.0
Mean=7.425
Standard Deviation=2.503
24

Economics
Table 7
Eerentame of Correct Responses by Content Area: The World
Econqwv
Number of
Correct
Responses Freauencv Percent
Cumulative
Percent
0 80 70.8 70.8
1 33 29.2 100.0
Total 113 100.0
Mean=.292
Standard Deviation=.457
25

Economics
25
Table 8
1221.9201112.-91.!19tre.ct Responses by Content Area;
Institutions
Number of
Correct
Responses Freauencv Percent
Cumulative
Perceal_
0 41 38.3 36.3
1 50 44.2 80.5
2 22 19.5 100.0
Total 113 100.0
Mean=.832
Standard Devition=.731

4
Economics
26
Table 9
C
Evaluatina Economic Actions and Policies
Number of
Correct
B2.2.22111.12. Freauen.c_Y Percent
Cumulative
Percent
0 60 53.1 53.1
1 46 40.7 93.8
2 7 6.2 100.0
Total 113 100.0
Mean=.531
Standard Deviation=.631
2 7
![Combined Meeting of The Blueprint Executive Committee and ......Vermont Blueprint for Health [Phone] 802-879-5988 312 Hurricane Lane, Suite 201 [Fax] 802-879-5651 Williston VT 05495-2807](https://img.dokumen.tips/doc/110x75/600e0d56ef0e787d9e3c311b/combined-meeting-of-the-blueprint-executive-committee-and-vermont-blueprint.jpg)


![7HPHW I|OGHN 6]i]KDORPEDWWD · 2017-07-06 · 022 a b a b sz 7 019/94 L a b 019/95 019/98 L L L L 019/99 L 019/100 019/101 019/102 019/103 019/87 019/96 019/88 019/89 019/90 019/91](https://img.dokumen.tips/doc/110x75/5e4940c49568aa74b4721e0b/7hphw-ioghn-6i-2017-07-06-022-a-b-a-b-sz-7-01994-l-a-b-01995-01998-l-l-l.jpg)