Embed Size (px)
Citation preview
ED 095 159
DOCUMENT RESUME
95 ''SP 008 338
AUTHOR Whitmore, Joanne RandTITLE A Teacher Attitude Inventory: Identifying Teacher
Positions in Relation to Educational Issues andDecisions. Research and Development Memorandum No.118.
INSTITUTION Stanford Univ., Calif. Stanford Center for Researchand Development in Teaching.
SPONS AGENCY National Inst. of Education (DREW), Washington,D.C.
REPORT NO RDM-118PUB DATE Jun 74CONTRACT NE-C-00-3-0061NOTE 60p.
EDRS PRICE MF-$0.75 HC-$3.15 PLUS POSTAGEDESCRIPTORS *Education; *Instrumentation; Intermediate Grades;
Primary Grades; *Teacher Attitudes; *TeachingStyles
IDENTIFIERS TAI; *Teacher Attitude Inventory
ABSTRACTThis memorandum reports on the preliminary research
using a 24-item inventory designed to measure teacher's positions inrelation to education issues and teaching decisions. The instrument,whose development is reported, is intended to identifyrepresentatives of two dichotomous styles of teaching: traditional,teacher-centered teaching and experimental, pupil-centered teaching.Each item in the inventory consists of a pair of extreme positions onan issue, to which the subject gives one of five responses rangingfrom strong agreement with the first statement to strong agreementwith the second statement. The items were assigned to'four subscales:Controlling, Rigidity, Individualism, and Professionalism. Scales,scores on too combined scales (R+C, P+I), and total scores werecomputed. In addition, Teacher Attitude Inventory (TAI) scores werecompared with observations of teacher behavior obtainW on anobservation instrument developed as part of a larger:project that theTAI also served. The TAI was administered twice to pfimary avidintermediate teachers in two school districts attended by students ofdifferent socioeconomic strata. Differences in teaching stylesbetween the two groups of teachers, as informally observed by theexperimenter, were shown by self-reports on the TAI to exist, exceptin relation to Professionalism. Data on relialAlity 'and validity areincluded, and conditions suitable for obtaining accurate self-reportsare described. (Author)
CT`
LfLC\CY`OLi.J
cc
STANFORD CENTERFOR RESEARCH AND DEVELOPMENTIN TEACHING
Research and Development Memorandum No. 118
A TEACHER ATTITUDE INVENTORY: IDENTIFYINGTEACHER POSITIONS IN RELATION TO EDUCATIONALISSUES AND DECISIONS
Joanne Rand Whitmore
School of EducationSanford UniversityStanford, California
June 1974 U.S. DEPARTMENT OF HEALTH,EDUCATION & WELFARENATIONAL INSTITUTE OF
EDUCATIONTHIS DOCUMENT HAS BEEN REPRODUCED EXACTLY AS RECEIVED FROMTHE PERSON OR ORGANIZATION ORIGINAT I NG IT. POINTS OF VIEW OR OPINIONSSTATED DO NOT NECESSARILY REPRESENT OFFICIAL NATIONAL INSTITUTE OFEDUCATION POSITION OR POLICY
Published by the Stanford Center for Researchand Development in Teaching, supported in partas a research and development center by fundsfrom the National Institute of Education, U. S.Department of Health, Education, and Welfare.The opinions expressed in this publication donot necessarily reflect the position, policy,or endorsement of the National Institute ofEducation. (Contract No. NE-C-00-3-0061.)
Introductory Statement
The Center's mission is to improve teaching in American schools.Its work is carried out through five programs:
Teaching Effectiveness
The Environment for Teaching
Teaching Students from Low-Income Areas
Teaching and Linguistic Pluralism
Exploratory and Related Studies
The instrument described in this report was developed for usein a project on effective reinforcement for achievement behaviors inminority children, a part of the Program on Teaching Effectiveness.
ii
Preface
This paper reports preliminary research on the TAI, an inventoryassessing teachers' attitudes toward controversial issues in education.It is intended to be helpful in predicting teaching practices and inevaluating changes in opinions over time. At this stage, all conclu-sions must be regarded as tentative. This memorandum was written toassist fellow researchers interested in contributing to the evaluationof the TAI. Other persons desiring to use the instrument are requestedto contact the author (see p. 42). All use of scores from the TAIshould be cautious and should show due regard for the sensitive nature.of self-reports.
This publication is one of a series from a three-year project in-vestigating the relationship between teacher behavior and student cogni-tive and affective achievement. Data were collected over a three-yearperiod in a school district serving predominantly black children. Cor-relates of motivational variables in students and reinforcement strategiesin teachers were examined in all three years. The data from each of thefirst and second years were used to formulate intervention programs usedin the second and third years.
The following is a complete list of materials from this projectpublished, or to be published, by the Stanford Center for Research andDevelopment in Teaching.
Summarizing Reports
Sears, P. S., Bloch, M. Hubner, J., Gamble, J., Adenubi, M., & Crist,J. L. Effective reinforcement for achievement behaviors in disadvan-taged children: The first year. (Stanford Center for Research andDevelopment in Teaching, Technical Report No. 30), Stanford University,1972. (ED 067 442)
Crist, J. L., Marx, R. W., Whitmore, J. R., & Sears, P. S. Effectivereinforcement for achievement behaviors in minority children: Thesecond and third years. (Stanford Center for Research and Developmentin Teaching, Technical Report), Stanford University, forthcoming.
Marx, R. W., & Crist, J. L. Effective reinforcement for achievement be-haviors in minority children: Summary of research. (Stanford Centerfor Research and Development in Teaching, Research and DevelopmentMemorandum), Stanford University, forthcoming.
Specific Intervention Techniques
Beckum, L. C. The effect of counseling and reinforcement on behaviorsimportant to the improvement of academic self-concept. (Stanford
iii
Center for Research and Development in Teaching, Technical Report No.38), Stanford University, 1973. (ED 081 880)
Whitmore, J. R. The modification of undesirable attitudes and classroombehavior through constructive use of social power in the school peerculture. (Stanford Center for Research and Development in Teaching,Technical Report No. 36), Stanford University, 1973. (ED 084 489)
Whitmore, J. R. Student leadership:in distressed low-incomo elementarysearch and Development in Teaching,No. 113), Stanford University, 1973.
Guidelines for developing programsschools. (Stanford Center for Re-Research and Development Memorandum
(ED 083 348)
Whitmore, J. R., Crist, J. L., & Marx, R. W. An experimental in-serviceteacher education program for distressed elementary schools. (StanfordCenter for Research and Development in Teaching, Research and Develop-ment Memorandum No. 117), Stanford University, 1974. (ED 087 777)
'Test Manuals and Summaries of Instruments
Marx, R. W., Peterson, P., & Nichols, S. Test manual: Sears Self-ConceptInventory. (Stanford Center for Research and Development in Teaching,Research and Development Memorandum), Stanford University, forthcoming.
Sears, P. S., Crist, J. L., & Marx, R. W. The teacher behavior observa-tion schedule: An instrument for coding teachers' classroom inter-action. (Stanford Center for Research and Development in Teaching,Research and Development Memorandum), Stanford University, forthcoming.
Sears, P. S., Marx, R. W., & Crist, J. L. Teacher forced ratings: Aninstrument for assessing children's intellectual, social, emotional,and physical development. (Stanford Center for Research and Develop-ment in Teaching, Research and Development Memorandum), Stanford Uni-versity, forthcoming.
Whitmore, J. R. A teacher attitude inventory: Identifying teacher posi-tions in relation to educational issues and decisions. (StanfordCenter for Research and Development in Teaching, Research and Develop-ment Memorandum No. 118), Stanford University, 1974.
Whitmore, J. R. "Thinking About My School": The development of an in-ventory to measure pupil perception of the elementary school environ-ment. (Stanford Center for Research and Development in Teaching,Research and Development Memorandum), Stanford University, forthcoming.
iv
7//C, 4L5 1.6 ":7. 72_ 6-
T-14tAS MISSING FROM THE DOCUMENT THAT WASSUBMITTED TO ERIC DOCUMENT REPRODUCTION SERVICE.
Contents
Preface iii
Abstract
List of Tables ix
Introduction 1
Development of the Inventory 2
The Theoretical Framework 2
Survey of the Research Literature 3
Construction of the TAI 5
Administration and Scoring 7
Administration 7
Scoring 9
Interpretation and Use of Scores 10
Experimental Development of the Inventory 11
The Samples 11
Initial Testing and Revision of the TAI 13
Reliability Data 14
Inter-Item Correlations 14
Subtests 16
Internal Consistency 18
Fall-Spring Stability 20
Summary 21
Validation of the Instrument 21
Factor Analyses 21
Criterion Validity 27
Problems with Validating the TAI 34
The Practical Value of the TAI for DiscriminatingBetween Groups 35
Limitations of the Field Test 40
vii
Potential Uses of the TA: 41
In Research 41
By Districts 41
By Principals 41
By Teachers 41
Cautions 42
Conclusions 42
References 43
Appendixes
I. Teacher Attitude Inventory, 1974 (Revised Form) 45
II. Items Excluded From TAI 51
III. Outline of Teacher Behavior Observation Schedule 53
IV. Means and Standard Deviations for Teachers Groupedby School and Grade Level 54
viii
Tables
1.
2.
3.
4.
5.
Characteristics of Two Contrasting Basic Styles of Teaching .
Inter-Item Correlation Matrix
Item-Subscale Correlations
Correlations Between Hypothesized Subscales
Coefficients of Internal Consistency on TAI Subscales,
4
15
16
l7
by District 19
6. Fall-Spring Correlations for Subscales and Total Scores . . 21
7. Results of Orthogonal Rotation of Four Factors 22
8. Results of Orthogonal Rotation of Two Factors 27
9. Reported Attitudes and Observed Behavior, 1970-71: Style One 30
10. Reported Attitudes and Observed Behavior, 1970-71: Style Two 31
11. Reported Attitudes and Observed Behavior, 1971-72: Style One 32
12. Reported Attitudes and Observed Behavior, 1971-72: Style Two 33
13. Means, Variance, and t Values on TAI Subscales, by District . 36
14. Comparison of Machers by Grade Level on Fall TAI . . . 3 37
15. Means and Variance on Fall TAI Subscales, by School 39
16. Tests of Significance Between TAI Means for Schools 2 and 5 . 39
ix
A TEACHER ATTITUDE INVENTORY: IDENTIFYING TEACHER POSITIONS
IN RELATION TO EDUCATIONAL ISSUES AND DECISIONS
Joanne R. Whitmore
Introduction
The Teacher Attitude Inventory (TAI) was prepared for use in an ex-
tensive research project titled Effective Reinforcement for Achi.evement
Behaviors in Minority Children. The project included three years of re-
search in the schools of a community whose residents were black and of
low socioeconomic status (hereafter referred to as low-SES). The first
year (1969-70) involved making classroom observations, analyzing teachers'
needs, and developing instruments for data collection. It was during
this phase that the TAI was developed.
During the subsequent two years (1970-71, 1971-72), the project pro-
vided teachers in the district with experimental programs of in-service
education. The first was a year-long biweekly series of workshops on
motivation that was offered to fourth-grade teachers. The second was an
intensive program of in-service education designed to assist an entire
school faculty in changing some of the pupils' attitudes and behavior.
In both years, the major objectives of the program were to encourage
teachers to break away from traditional methods and to experiment; to
attend more to individual students and their socioaffective needs; and
to individualize instruction in order to increase pupil success and
opportunities for self-direction. It was for the general purpose of
measuring changes in teachers' attitudes toward the substance of these
objectives and toward the experiences of in-service education programs
that this inventory was constructed.
Dr. Whitmore is now at Peabody College for Teachers. The projectof which this work was a part was conducted at SCRDT. The entire projectstaff, especially Project Leader Pauline S. Sears, assisted the authorwith the development of the instrument. Ronald W. Marx contributedinvaluably to its evaluation.
-2-
Development of the Inventory
The specific purposes of developing a scale to assess teachers'
attitudes were: (a) to provide the research staff with self-reported in-
formation about the attitudes of the participating teachers, and (b) to
measure the effectiveness of the programs provided. The areas investi-
gated were (1) attitudes toward workshops, faculty meetings, and other
opportunities for professional growth and contribution, and (2) the
positions individual teachers or groups of teachers tended to take in
relation to pertinent educational issues and decisions influencing
teacher behavior.
The rationale behind the development of the instrument may be ex-
plained briefly as follows. Today, educational institutions are besieged
by conflicting advice and expectations for the teacher'in the elementary
classroom. Both novice and experienced teachers find themselves exposed
to conflicting views of what methods or practices will increase their
effectiveness. Thus the teacher seeking professional growth and in-
creased effectiveness must be involved in examining, selecting, and eval-
uating alternatives. This problem-solving process leads the teacher to-
ward defining his or her relationship to the positions of other teachers
on questions of methods. The design of the TAI was based on the assump-
tion that a scale identifying a teacher's positions in relation to educa-
tional issues would provide an adequate measure of the attitudes or opin-
ions that influence teaching practices.
The Theoretical Framework
The format and content of the TAI were based on the belief that
teachers, as they engage in problem solving or decision making, are aware
of dichotomous ideologies or educational philosophies. Although teacher
behavior is not simple and individual patterns cannot easily be categor-
ized, there is much evidence that two dichotomous styles of teaching tend
to be practiced and advocated. In fact, one could say that American
teachers have become polarized into clusters drawn toward either tradi-
tional "3-R" practices or innovative and experimental teaching behavior.
Most teachers have been exposed to individuals representing both poles
-3-
and are aware of their views as they make professional decisions. TAI
items ask the teacher to place himself or herself on a continuum between
two antithetical statements regarding a fundamental question of teaching
practice or professional participation. The teacher's response is ex-
pected to indicate a tendency to be influenced in decision making toward
one of the two dichotomous positions.
It is recognized that there is much variation within and between
individuals regarding teaching behavior over time. However, the first
year of the project confirmed the existence of two contrasting basic
styles of teaching (see Sears et al., 1972). A premise of this study was
that ideologically teachers tend to endorse behaviors associated with one
or the other of the two styles, even if the teacher's own behavior is in-
consistent or includes elements of both styles. The ideology being meas-
ured represents the "should" conception evolved through the individual's
experiences in professional training and classroom teaching. The two
basic styles are outlined in Table 1.
Survey of the Research Literature
Prior to preparation of the TAI, the literature was searched for a suit-
able instrument already in existence. Most of the inventories reported
were comprised of comparatively general philosophical statements or of
items related to a specific training program, curriculum, or practice.
More philosophical instruments included items such as: "Man is nothing
til he acts" or "The essence of reality is choice." Inventories contain-
ing more specific items did not sample the wide variety of teaching prac-
tices for which assessment was desired.
Of the numerous attitude questionnaires devised for the purpose of
predicting success in teaching low-income or minority children, none re-
viewed by the experimenter yielded evidence that the instrument achieved
its objective. Frequently the items on such questionnaires reflected
the pedagogy of specific training programs and items for which this in-
vestigator would expect a tendency toward particular socialized responses.
Many inventories that measured the degree to which teachers endorsed
policies or procedures were designed for secondary or college level use.
Although some of the forms could be adapted for elementary teachers, the
TABLE 1
Characteristics of Two Contrasting Basic Styles of Teaching
Category of
Teacher Characteristics
Style One
Style Two
Primary concern expressed
(Measure of success)
Teaching emphasis
Belief about source of
teaching effectiveness
Basic approach in teaching
Perception of teacher role
Attitude toward
professional role
Control of deviants.
Mastery of
subject matter
Learning content; subject
matter instruction
(lecture and reading
primarily)
Structure, Consistency:
result-
ing in group achievement and
well-controlled behavior
Group, with the teacher at center
Authority, Expert Controller
Reluctant to move away from
tradition, to disturb
status quo
Enjoys independence; wants
minimal faculty teamwork,
few meetings
Motivation, total growth of
individuals--cognitive and
socioaffective development,
self-image and aspirations;
optimal growth of individuals
Learning Process:
problem solving in a
group and individually;
development of skills for inquiry
(minimal lecture and reading)
Flexibility, Ability to Individualize:
resulting in individual achievement
and self-fulfillment
Individuals, with much self-direction
Resource, Catalyst, Leader or
Facilitator
Seeking continual professional growth,
teaching improvement;
Eager to experiment; not threatened
by changes;
Desires participation on a faculty team
with much cooperative effort and
problem solving
-5-
overall content was not suitable. Likewise, many items of potential
worth were found ori inventories assessing teacher values, but none of
the questionnaires, in toto, was sufficient for our purposes.
Furthe:, most of the questionnaires contained many items, often 100
to 300. Wtta teachers resent time spent completing forms or are uncom-
fortable with requested self-disclosure, it is important to choose concise
measurement techniques. It seemed desirable to have an attitude measure
as brief as possible without losing accuracy and breadth of information.
Numerous researchers have reported constructing items and scoring
responses in such a way as to allow for segregating teachers into two
basic groups. Many different labels were chosen to represent the two
types, but invariably the detailed descriptions were dirz!ctly related to
the two styles or positions proposed in this study: (1) traditional
teacher-centered methodology, designated as Style One, and (2) pro-
gressive, pupil-centered approaches and experimentation, designated as
Style Two.
The scales developed by Kerlinger and Kaya (1959) and Kreitlos and
Dreier (1955) are suggestive of the type desired, but the items tend to
be philosophical statements rather than practical decisions or explicit
teaching behaviors. It was considered important that items be clearly
related to specific teaching behavior or practices and that ambiguous
or connotative wording be avoided.
The research instrument that approximated the type sought was Dimen-
sions of Teacher Beliefs About the Teaching Process (Wehling & Charters,
1969). The original inventory contained 118 items, later reduced after
factor analysis to 86. The format is the Likert-type 6-point scale.
The eight dimensions identified by factor analysis were related to the
basic distinction between pupil- orientation and teacher-orientation in
teaching practices. Many of the items on this instrument are similar to
those finally included in the TAI. Wehling and Charters included no
items pertaining to professionalism, however.
Construction of the TAI
After surveying the literature, the decision was made to construct
an inventory of no more than 40 items clearly based on thi theoretical

-6-
framework described earlier and including the dimension of interest in
professional growth. The latter dimension had not been found elsewhere.
It was decided also that an inventory especially for elementary teachers
was needed and that the items should be meaningful to teachers in any
locale, grade, or type of school. Therefore, even though the teacher
sample for this project was from low-SES black schools, the instrument
was intended to be a valuable source of information about teacher atti-
tudes in any district or community.
In preparation for item construction, statements believed to reflect
basic attitudes that would influence Either classroom. decisions and prac-
tices or interest in opportunities for professional growth were compiled.
Each statement was judged by the research staff to represent one of the
two Major styles. Opposite statements, reflecting contrasting views on
is,s.oas, were paired to formulate items.
The teacher places a mark on a 5-point Likert scale to express the
tendency to agree or disagree with one of the statements in each pair.
It is assumed that the statements are dichotomous, i.e., agreement with
one presupposes disagreement with the otIxer. A 5-point scale was used
to allow individuals to indicate a position of uncertainty or of equiva-
lent acceptance or rejectiofi. A neutral response was considered to be
important information.
From the original collection of statements, 40 pairs judged to be
most informative and clear in meaning were selected and assigned to four
subscales. Those subscales were: Controlling versus Releasing, Rigidity
versus Flexibility, Individualism versus Group-orientation, and interest
versus disinterest in Professionalism (opportunities for growth and con-
tribution). These subscales were comeived as continuums with dichoto-
mous ends. A scale score then would indicate a teacher's tendency toward
one end of that subscale, e.g., tendency to individualize as opposed to
tendency to work with large groups.
The Total score would place the individual teacher on the continuum
between the two contrasting styles. Higher scores would report prefer-
ence for more pupil-centered, individualized, flexible, and innovative
teaching behavior, and probably greater interest in opportunities for
-7-
professional growth and contribution. Lower scores would suggest a
tendency to prefer teaching behavior that is more teacher-centered
(Controlling), large group-oriented, and bound to tradtional methods
and content, and to favor strong administration and minimal teacher
participation in professional activities.
Administration and Scoring
Administration
Because of the pressures for accountability and evaluation of
teacher competency, an attitude inventory may frighten insecure teachers.
In most schools, at least a few individuals will be uncomfortable with
the questionLaire, fearing to be judged by supervisory administrators
for giving "wrong" responses, which might influence the evaluation of
their professional competence. Therefore, even though the nature of the
inventory is explained and clear directions are provided on the cover
page of the TAI, it is advised that extreme care be taken to establish
an open, trusting, nonjudgmental climate for "testing." The accuracy or
honesty of the teachers' responses will depend upon the adequacy of the
climate established. If the school district administrators or the
school principal have strongly advocated one of the two styles, there
probably will be more socialized responses. This source of bias can be
reduced by using only group membership for identification. The informa-
tion about a faculty as a whole or about subgroups in a district (e.g.,
intermediate teachers) can be very useful.
The ability of an administrator to obtain honest responses when
asking for teacher identification by name depends on the extent to which
he or she has established a truly open, nonthreatening climate of commu-
nication. If differences in teaching style are accepted in the school
or district, teachers may feel free to identify honestly with either set
of practices, and the resulting information may be highly useful to
administrators placing or grouping teachers.
The following specific procedures are recommended for the adminis-
tration of the TAI
-8-
1. Discuss with the teachers as a group the purpose of asking them
to complete the questionnaire. Make it clear that TAI is not a test but
a means of gathering opinions on controversial issues and a means of
helping teachers individually to clarify--privately--their positions on
the questions.
Discuss confidentiality in accordance with the needs of the situation.
Teachers should feel confident that their self-reports will not be dis-
closed to anyone unless with their permission. If someone from the dis-
trict administration is giving the questionnaire, teachers should be
told who will see the results--the principal? the superintendent? the
board of education? fellow teachers?--and should be given the option of
refusing to participate. Likewise, if a principal is administering the
TAI and requesting identification, teachers should decide whether they
want to make their opinions known to each other or just to the principal.
The examiner may wish to offer to hold faculty discussions of some of
the items at a later time.
2. Distribute the inventory and ask the teachers to read the first
page. Discuss the idea of a continuum between two contrasting approaches,
neither of which is necessarily always best. Stress that the response de-
sired is the one that describes where each person, as an individual
teacher, most often would stand in relation to the two views stated.
Use the following examples on a blackboard for practice:
1 2 3 4 5
Children should be allowed tomake many choices regardingcurriculum or procedures.
Heterogeneous grouping isdefinitely best for the childand probably for the teacherin the long run.
Children are usually notvery capable of makingchoices effectively asto work or procedures.
Some form of homogeneousgrouping is definitelythe only way a teachercan effectively teach.
Explain that the individual teacher's response should reflect her
tendency to respond across differences between classes, pupils, and
teaching situations. Advise that it is better not to deliberate too long
about each item, but rather to answer rather impulsively.
-9-
3. If someone asks for clarification of the meaning of two posi-
tions in an item, suggest that she respond according to her best inter-
pretation of them. Individuals should not belabor details of the state-
ments, and the examiner should not offer interpretations. It is important
that each teacher answer all items according to her understanding.
4. Teachers should be advised that individuals may vary in the
amount of time desired to complete the questionnaire. Most people request
10 to 15 minutes. Those who finish early should not discuss items or con-
verse while waiting for others to finish. Perhaps the forms can be com-
pleted at the close of a faculty meeting and teachers can be encouraged to
leave when they finish.
Scoring
The TAI is short and easy tc score by hand. For each item, a score
of 5 is given for the response most representative of Style Two; a score
of 1 indicates the position closest to Style One. On items 2, 4, 5, 7, 8,
11, 15, 16, 18, 20 and 22 the score will be identical to the TAI column
number in which the mark is placed. On the remaining 13 items, reverse
scoring is necessary: a mark in column 1 is a score of 5, column 2 is a
score of 4, etc. There is a sample scoring sheet at the end of Appendix
I. Beside each item which has to be reverse-scored, an "R" is present
as a reminder.
The scoring sheet allows responses to be grouped on subscales. As
each item is scored, the value may be entered in the Score column and
again the subscale column designated by an asterisk. The asterisks
indicate subscale membership for each item. The sum of the Score column
will be the Total score. The subscores are obtained by summing each column.
If subscales are being used, one may choose not to enter values in the
Score column and simply sum across the subscales to obtain the Total.
The theoretical factors used to define the subscales will be discussed
in more detail in the section "Experimental Development of the Inventory."
It is only necessary here to say that one may use subscores as indicators
of specific attitudes toward flexibility and experimentation (Rigidity),
toward discipline (Controlling), toward professional growth (Profession-
alism), and toward personal, more individualized instruction (Individual-
ism). The validity of these subscales is uncertain at this stage of
-10-
research. Their value may vary from school to school, as well as accord-
ing to the purpose of the research. It seems that the Total scores are
of greatest value in most circumstances.
Interpretation and Use of Scores
The interpretation of the TAI is subject to the same limitations
imposed upon any self-report attitude measure. Further limitations exist
owing to the lack of extensive field testing and normative data. But even
after more elaborate analyses have been completed and norms established,
this type of instrument will require extreme caution by interpreters of
results.
It will always be a serious responsibility of the tester to consider
carefully the potential bias in the scores of individuals within a group.
An especially common source of bias may be the previously mentioned exter-
nal pressures within a school to subscribe to a particular philosophy of
teaching. Other sources of bias include recent events in the school or
district which might encourage exaggerated emotional states, conditions of
fatigue, and lack of motivation to complete the self-report. In looking
at the scores of individuals, if there is considerable discrepancy between
actual classroom behavior and reported attitude (e.g., a person who
teaches only in large groups strongly advocates individualization on the
questionnaire), ode may assume that either there is great inner conflict
within that teacher on account of the discrepancy or that the self-report
is invalid and probably contains socially desirable responses.
If optimal conditions of trust were created (perhaps partly by ano-
nymity), and teachers seemed to respond willingly and honestly to the
inventory, then the amount of error in the results should be minimal and
the following interpretive hypotheses may be tested. (1) Teachers who
have relatively higher total scores (probably over 100, out of 120 maxi -
mum)1 are those most inclined to be flexible, to be interested in new
ideas and materials, and to encourage pupil self-direction through a pro-
gram of individualized instruction. Those teachers tend to perceive stu-
dents more as individuals than as groups, and to believe that high qual-
ity opportunities for professional growth are desirable. To administra-
tors, high scores might identify teachers most apt to respond to
1On the revised TAI, which contains 24 items.
experimental projects, in-service education, or team teaching.
(2) Teachers with notably low scores (probably under 85) are possibly
least willing to experiment or participate in programs of professional
growth. They tend to be more "traditional" teachers who prefer to
direct their teaching to the whole group in a self-contained classroom.
The following section of this report will include statistical data
used to test the hypothesized interpretations. The scores in the middle
range (86-99) are most difficult to interpret for practical application.
One might look at the subscores for more specific information, although
there is no strong evidence indicating that it would be especially bene-
ficial to do so. For example, it is expected that high scores on Pro-
fessionalism would indicate receptivity to experimentation and profes-
sional growth experiences (e.g., workshops, faculty study groups, etc.).
Or, another example, teachers who have low scores on Individualism will
probably function more comfortably in self-contained classrooms and have
greatest difficulty if forced to adjust to team teaching or to implement
programs of individualized study. All hypothesized interpretations of
scores should be tested by data from systematic observations of actual
teaching behavior, supplemented by personal interviews with the teachers.
Experimental Development of the Inventory
The Samples
The subjects were drawn from two contrasting school districts within
20 miles of each other in California. The first sample of teachers were
those teachers (District One) participating in the two in-service educa-
tion projects described earlier. They were teaching in a low-SES black
community; 75 percent of the teachers were white and 90 percent of the
students were black. The projects were being conducted in the district
as a service to administrators seeking to increase achievement motivation
and harmony in the schools. Teaching in the district had traditionally
emphasized the 3-R's, and firm discipline and control of pupils had been
the principal concern of teachers. Administrators hoped to increase
willingness to experiment with new methods, individualize instruction,
work flexibly in teams, reduce harsh discipline, and increase each
-12-
student's motivation to learn and to behave "appropriately." Observa-
tions in these classrooms by researchers confirmed the report that teach-
ers were often preoccupied with techniques of control and that the in-
structional style tended to be group-oriented and conservatively tradi-
tional in approach (textbook, and a teacher providing information). The
1970-71 sample from this district was composed of fourth-grade teachers
from eight schools which, for simplicity in reporting results, have been
labeled School 1. The total teaching staff of one school involved in
1971-72 has been designated School 2.
The second sample of teachers (District Two) was drawn from a
middle-class community, predominantly white, which was part of a large,
heterogeneous district. Three schools, located within five miles of
each other, were selected. Two were traditional California school
buildings with mostly self-contained classrooms (Schools 3 and 4). The
faculties were considered by administrators to be very competent, moder-
ately flexible, and open to experimentation and professional growth
experiences. Teachers were frequently engaged in some form of innova-
tive experiment in grouping or instruction.
The third school in District Two (School 5) was a new type of
building--entirely round and partitioned into "pods." Teachers were
present on this faculty because of their desire to teach in teams and
in "stations" or learning centers almost exclusively. The principal and
her faculty were recognized by fellow educators as extremely innovative
and flexible. Faculty problem solving and team planning were routine.
Children and teachers enjoyed a relaxed atmosphere free from "discipline
problems."
The reason for selecting different types of schools in the second
sample was to gain information regarding the sensitivity of the instru-
ment. The experimenter had taught in the school district and had served
as a consultant to the district for several years, becoming well informed
as to the characteristics of each faculty. If the instrument were sensi-
tive, it should discriminate between the groups. The first two middle-
class schools were in buildings very similar to those in the low-income
community of District One. Data from those schools compared to the first
-13-
group would help answer the question, "How do teachers in the low-SES
black community differ in attitude from those in middle-class schools
nearby?" Differences in teaching behavior had been observed. There was
interest in determining whether related differences in attitudes would
be identifiable from self-reports of teachers. School 5 was used to
test whether the instrument would discriminate more finely between levels
of interest in innovation and commitment to professional growth and coop-
eration. It was expected that this school would produce the highest
scores and perhaps the lowest variance.
The number of teachers in both districts who completed the TAI in
the fall was 99; the spring N was 81. Some data are missing both fall
and spring from both district samples; consequently the N varies in the
results reported according to the type of analysis. Complete fall and
spring data were available on 64 teachers, 35 in District One and 29 in
District Two. No spring data were available on the teachers in School 5
(N=24); they were unwilling to complete the inventory in May because of
"too many end-of-the-year activities."
Initial Testing and Revision of the TAI
The original questionnaire used contained 40 items, 9 assigned to
each of the four theoretical subscales (Rigidity, Controlling, Profes-
sionalism, and Individualism) and 4 labeled "Miscellaneous." Only the
36 items classified into subscales were used in analysis. All subjects
completed the long questionnaire. Most of the data were collected in
October 1970 and May 1971. Data from half of the low-SES (District One)
sample were gathered in September-October 1971 and May 1972.
Initial analyses of the data included item analysis, fall-spring
correlations, correlations within and between scales, and subsequent
tests of significant differences between scores of groups. Suggestions
regarding item construction or content were solicited from colleagues,
administrators, and subjects (i.e., teachers completing the inventory).
Combining the results of these research efforts, it was determined that
24 of the 36 items discriminated most between subjects and elicited re-
sponses most reliably fall to spring. Since the decision to drop 12
items was based on a relatively small sample, and since other researchers
-14-
might want to examine or test the value of the items, those that were
excluded, including the 4 Miscellaneous items, have been listed in Ap-
pendix II. Statistical information on the first level of analysis will
not be reported; the results presented in this memorandum will be based
entirely upon the revised 24-item questionnaire (see Appendix I).
Reliability Data
Inter item correlations. Table 2 reports the inter-item correla-
tion matrix for fall and spring data. The sample size used in the com-
putation ranged from 68 to 97, the variation created by missing data.
In the table, asterisks indicate some pairs of items intended to require
very similar choices. The letters R, C, P, and I accompanying item num-
bers represent the subscale to which each item was assigned. The corre-
lations between items within each scale were expected to be higher.
Examination of the table reveals predominantly low to moderate
correlations. Spring r's were placed beneath fall r's for immediate
comparison. Generally, discrepancies were not large. The low correla-
tions between "similar items" were disappointing. Tables not included
here show that correlations were more substantial for District Two than
for District One.
It may be that inter-item correlations, and other analytical re-
sults, contain some error resulting from the use of two statements in
each item. In evaluating the results reported herein, the reader should
remember that error may have occurred in the original pairing of state-
ments assumed to be dichotomous, or in the assignment of items to sub-
scales. In addition, post hoc evaluations suggest that teachers may have
responded primarily in terms of one of the statements rather than both.
The correlation to other items or to a scale may vary according to which
statement generated the individual's response. Other researchers might
consider testing the use of TAI contents with Likert-scale responses to
each of the 48 statements contained in the 24 pairs. Administration
of both forms to the same sample should be informative.
-15--
TABLE 2
Item-Item Correlation Matrix
1-8 1-C 2-P 1-C 2-1 2-P 2-1 1-8 2-1 2-P 1-C 2-P 1-R 1-C 1-8 2-1 2-P 1-C 1-R 2-1 1-C 1-8 2-1 2-P1 2 3 4 5 6 7 8 9 10 11 12 13 14 15 16 17 18 19 20 21 22 23 24
.01 .13 .11 .12 .01 .13 -.08 .25 .17 .34 .01 -.06 .05 .42 .23 .24 .17 .04 .02 .46 .23* .33 .211 8.19 -.06 .23 .13 .21 .16 -.01 -.07 .31 .09 .09 .20 .20 .26 .27 .12 .17 -.01 -.04 .17 .16 .23 -.02 .01
-.01 .33 .26 .16 .22 .19 .09 -.11 .20 -.04 .16 .13 .09 .19 .10 .10 .32 .22 .12 .18 -.03 .322 C .27 .02 .27 .16 .19 .22 .16 .08 .08 .25 -.13 .26 .20 .10 .18 .08 .23 .12 -.14 .26 .26 .17 .12
0.0 .08 .17 .23 .01 .25 .16 .13 -.05 .12 .08 .03 -.05 .14 -.08 .01 -.04 .27 .10 .07 -.013 P .36 N.87 .06 .25 -.01 -.15 .26 .24 .09 .05 .03 -.11 .15 .14 -.01 .20 -.12 .11 .08 .10 -.07 .13
.08 -.08 .30 .30 .09 .02 .20 .16 .12 .07 .30 .28 -.01 .16 .26 -.03 .21 .34 .11 .144 C .26\,,16 .06 -.08 .14 .22 .10 .30 .25 .08 .33 .06 .08 .09 -.06 .22 .2] .20 .12 .10 .07
.03 .19 .03 .23 .00 .13 .17 .14 .34 .12 .05 .12 -.05 .15 .28 .13 .25 .43* .085 1 .30 .09 .28 .10 .19 .01 .27 .16 .24 .18 .11 -.11 .14 .06 .35 .47 .15 .07 .54 -.12
.02 -.02 .25 .06 .04 .02 .02 .12 .01 -.09 .17 .10 .08 .08 .13 -.01 .07 .106 R .26 .07 -.06 .40 .27 -.03 .06 .29 .28 .33 -.04 .13 .03 .06 .35 .32 .34 .21 .23
.35 .11 .14 .28 .13 .13 .19 .13 .18 .16 -.02 .25 .14 .18 .31 .18 .117 1 .38 .22 .14 -.13 .32 .12 .03 -.03 .28 .13 -.04 .06 -.02 -.00 -.18 -.02 .20 -.08
.21 -.01 .37 .40* .20 .04 .19 .14 .26 .14 .29 -.03 .01 .3u .u4 .148 R .41 .14 -.03 .38 .21 -.06 .13 .16 .27 .01 -.08 .40 .18 .41 -.01 .16 .41
.28 .1i ,26 .07 .14 .21 .16 .34 .14 .25 .09 .37 .31 .24 .289 1 .26 .25 .19 .33 .10 .43 .22 .12 .26 .21 .24 .36 .25 .14 .28 .23
.14 .11 .01 .20 .15 .15 .14 .27 .05 .06 .35 .12 .19 .1310 P .20 -.89 -.06 .02 -.09 .21 .02 .20 .07 .03 .22 .09 .03 .13 .33
.19 -.04 -.07 .29 .46 .17 .18 .17 -.05 .38 .32 .19 .3011 C .35\ .15 -.04 .30 .25 .28 -.10 .12 .27 .19 .39 .04 .19 .18
N. .19 .15 .09 -.04 .14 .11 .27 .10 .08 .18 .22 .2812 P .49" .17 .11 .13 .20 .19 -.02 .42 .10 .01 .02 .08 -.01
.33 -.04 -.06 .14 .24 .18 .16 .12 .05 .16 .1213 R .58 .23 .15 .08 .35 .16 .19 .30 .22 .45 .29 -.07
.10 .09 .39 .17 .31 .31 .19* .01 .26 .2114 C .14 .30 -.09 .26 .01 .28 .40 .36 .11 .23 .15
.43 .34 .36 .32* .16 .47 .48 .02 .3215 P. .27 .26 .18 .15 .17 .21 .28 .40 .13 .02
.24 .25 .22 .12 .39 .53 .05 .2916 1 .39 .19 .26 .07 .16 .18 .24 .07 .16
.28 .38 .07 .24 .24 .37 .27*17 P .12 .09 .01 .22 .06 .08 .14 .04
.18 .04 .24 .19 .12 .3018 C .26 .02 .25 .19 .17 .10 .00
.32 .21 .42 .13 .3019 P. .31 .34 .27 .07 .29 .24
.10 .14 .14 .2320 I .18 .43 .27 .28 .1.5
.46 .26 .2321 C .44 .28 .20 .25
.15 .2822 R .09 .28 -.05
.2923 1 .30 .07
24 P .18
%0N.: = 68-97. The top figure in each cell is the fall correlation; the bottom figure is the spring correlation.Correlations on the diagonal are fall-spring Item stability coefficients. Asterisks indicate pairs of items intended torequire similar choices.
-16-
Subtests. Item-subscale correlations are reported in Table 3 for
fall and spring data. The items were correlated with the four scores
previously described (Rigidity, Controlling, Professionalism, and Indi-
vidualism) and with combined scales R + C and P + I, as well as with the
Total score. The reason for combining the scales to form two larger sub-
scales was the hypothesis that responses to items intended to measure
rigidity and tendency to be controlling would be significantly correlated.
It was also expected that responses to P and I items would be highly
correlated.
TABLE 3
Item-Subscale Correlations
Item
Fall (N = 99) Spring (N = 81)
R C P I R+C P+I Tot.* P I R+C P-FI Tot.
1(R) .46* .35 .25 .33 .44* .34 .44 .46* .16 .24 .23 .34* .28 .352(C) .26 .59* .10 .25 .48* .21 .39 .26 .63* .12 .27 .54* .24 .443(P) .11 .13 .49* .17 .13 .37* .27 .08 .09 .55* .15 .10 .41* .284(C) .41 .64* .08 .27 .59* .21 .45 .22 .60* .18 .20 .50* .23 .415(I) .23 .25 .14 .64* .26 .47* .40 .30 .28 .07 .65* .33 .43* .446(P) .02 .12 .45* .10 .08 .31* .21 .36 .24 .57* .31 .33 .53* .487(I) .38 .32 .26 .57* .39 .49* .48 .17 .08 -.05 .51* .14 .29* .248(R) .57* .32 22 .24 .48* .27 .42 .42* .34 .12 .31 .44* .27 .409(I) .37 .34 I.53 .55* .39 .62* .55 .33 .38 .50 .62* .41 .68* .61
10(P) .14 .22 .62* .25 .20 .49* .37 .09 .18 .73* .17 .16 .53* .3811(C) .43 .62* .31 .43 .59* .43 .57 .29 .67* .12 .41 .58* .33 .5112(P) .32 .18 .48* .25 .27 .42* .37 .32 .11 .29* .29 .23 .35* .3313(R) .33* .23 .18 .17 .30* .20 .28 .60* .25 .21 .29 .47* .31 .4414(C) .20 .32* .35 .38 .29* .43 .39 .38 .62* .29 .33 .60* .37 .5515(R) .69* .48 .28 .33 .64* .36 .56 .68 .32 .24 .35 .55* .36 .5216(I) .46 .51 .15 .51* .53 .40* .52 .32 .24 .23 .42* .32 .40* .4017(P) .45 .29 .50* .40 .40 .52* .51 .25 .13 .40* .26 .21 .39* .3418(C) .35 .46* ,31 .15 .45* .26 .40 .13 .34* .12 .28 .29* .25 .3019(R) .63* .41 .31 .38 .57* .41 .54 .47* .34 .17 .36 .46* .32 .4420(I) .21 .14 .16 .45* .19 .36* .30 .43 .44 .34 .63* .50 .60* .6221(C) .51 .66* .43 .44 .65* .50 .64 .49 .69* .24 .29 .69* .32 .5822(R) .76* .48 .28 .53 .67*. .48 .64 .68* .27 .13 .28 .52* .25 .4423(I) .23 .25 .37 .60* .26 .57* .45 .34 .28 .16 .66* .36 .51* .4924(P) .39 .43 .54* .38 .45 .53* .54 .15 .22 .60* .12 .22 .42* .36
*Correlations may be spuriously high due to inclusion of item in scaleor smaller score in larger score.
Levels of significance, two - tailed test:p < .01 df = 80, r = .28 df = 100, r = .25
-17-
Table 3 was a preliminary step in attempting to discern the value
of using two scales vs. four. Asterisks indicate correlations that may
be spuriously high due to inclusion of the item or subscale in the score
to which the correlation was computed. Considering the spurious nature
of these values, most items appeared to be almost equivalently correlated
to another scale. More than 75 percent of the r's between items and the
combined scales (R + C, P + I) were significant at the .11 level. Most
items had comparable r's with more than one of the four subscales.
Table 4 contains the correlations between the subscales on fall and
spring data. The same level of significance applies as was cited for
Table 3. Again the correlations which may be spuriously high are marked
by asterisks.
TABLE 4
Correlations Between Hypothesized Subscales(Fall correlation followed by Spring)
C P I R+C P+I Total
Rigidity
Controlling
Professionalism
Individualism
R+C
P+I
.66 .50 .44
.43
.33
.30
.58
.56
.48
.54
.49
.37
.90*
.92*
.48
.63
.83
.90
.36
.59
.60
.58
.84*
.88*
.65
.53
.48
.81
.84
.58
.83
.84
.71
.82
.92
.90
.77
.78
.65
.80
.90
.88
*Correlations may be spuriously high due to inclusion of smallerfactor in larger score.
Examination of the preceding tables suggests that the subscales may
not be measuring distinctly separate attitudes as much as a more general
attitude represented by the Total score, although the subscales share be-
tween 10 percent and 35 percent of their variance. The scales of Rigidity,
Controlling, and Individualism are equally intercorrelated. Rigidity and
Controlling were hypothesized to be the most similar in item content but
correlations between those two scales were no higher than between Individu-
alism and R + C. Correlations were lowest in relation to Professionalism.
-18--
It is not at all unreasonable to find this scale less clearly related to
the other three, which contain items clearly tied to classroom teaching
practices. All subsequent tests indicated that the Professionalism scale
was least reliable and less dependent upon attitudes and opinions about
classroom teaching.
Internal consistency. There was interest in comparing the two
samples to determine whether there was greater error in the self-reports
of teachers in the low-SES community (see Table 5). It was expected that
if external pressures upon teachers biased self-reports, or if lack of
interest in such a measure increased random responses, the alpha coeffi-
cients would be lower and the variance greater in District One than in
District Two. A danger in this line of reasoning, however, is assuming
that the teachers in the middle-class district felt freer to be honest
in their self-reports and would reflect more consistent opinions.
Table 5 indicates that responses in District One were considerably
less consistent on Controlling items than responses in District Two.
This is interesting since the issue of maintaining control, or exercising
"good discipline," was the principal criterion for teacher evaluation in
the District One, according to teachers. Problems of classroom disci-
pline were listed by teachers as their first concern, and methods of
improving student behavior were controversial topics of frequent informal
discussions.
Alpha coefficients were especially low in District One for Profes-
sionalism and Individualism on the fall measure, and for Rigidity on
spring reports. It may be that teachers in that district were less cer-
tain about their views regarding matters of Professionalism a. 4 Individu-
alism in the fall. The workshop experiences during the year may have
helped them develop more consistent opinions by spring. One might also
speculate that the lower alpha coefficient on Rigidity in the spring
reflected beginning changes in attitude resulting from intervention
experiences not yet generalized and consistent.
-19-
TABLE 5
Coefficients of Internal Consistency on TAI Subscales, by District
SubscaleDistrict One District Two
Alpha' X S.D. Alpha R S.D.
Rigidity Fall .59 23.84 3.66 .60 25.75 2.62Spr. .47 24.29 3.36 .68 25.19 2.21
Controlling Fall .35 21.45 3.40 .59 24.17 3.33Spr. .55 23.00 3.81 .70 24.39 2.92
Professional. Fall -.08 24.92 2.39 .43 25.13 2.82Spr. .46 25.28 3.24 .50 24.17 2.62
Individual. Fall .45 22.76 3.44 .64 24.23 3.19Spr. .58 23.17 3.68 .59 23.84 2.76
R + C Fall .69 45.29 6.35 .75 49.92 5.43Spr. .65 47.30 6.03 .80 49.58 4_61
P + I Fall .47 47.68 4.85 .72 49.36 5.34Spr. .67 48.44 5.89 .62 48.01 4.28
Total Fall .76 92.97 10.26 .84 99.28 9.73Spr. .80 95.74 11.02 .82 97.59 7.94
Note: For District One, N=37 fall and 40 spring. For DistrictTwo, N=54 fall, 37 spring.
-20-
Looking at the two combined scales, the District One alpha for P + I
was notably lower on fall data and the R + C alpha was markedly lower on
spring scores than for District Two. However, alphas for the Total
scores were not significantly different for the two groups either fall or
spring; in all cases, they indicated adequate reliability. Responses on
the TAI seem to bP sufficiently reliable to provide meaningful informa-
tion on either teacher sample.
Fall-Spring stability. Coefficients indicating the stability of
responses over the period of a school year, October to May, are reported
in Table 6. These two times were selected for the purpose of assessing
changes that might have been related to the research project interven-
tions. Correlations for subscales and the Total scores were calculated
for all 64 subjects in both districts for whom data were complete. They
were then calculated separately for the two schools in the middle-class
district not participating in any experimental projects.
Fall-spring coefficients for all subjects were low, though signifi-
cant. Coefficients were much larger for District Two teachers (see Table
6), suggesting that attitudes toward Controlling and Rigidity, in partic-
e- , remained quite similar fall to spring, and Total scores were moder-
ately stable. Views regarding Individualism and, especially, Profession-
alism appear to be less similar from fall to spring. Thus, this study
suggested, at least in middle-class schools, without intervening projects
directed toward change, that the self-reported attitudes of teachers are
moderately stable over a year's time.
It should be noted that these coefficients are not considered to be
good measures of test-retest stability for a number of reasons, the most
important being that the emotional climate and conditions of fatigue and
pressure frequently are quite different at the beginning and the end of
the school year. Stability could be more effectively measured with a
two-month interval, midyear (e.g., January and March).
-21--
TABLE 6
Fall-Spring Correlations for Subscales and Total Scores
Both Districts (N = 64) District Two (N = 29)
Rigidity .36 .60
Controlling .26 .66
Professionalism .21 .30
Individualism .29 .49
R + C .38 .71
P + I .25 .34
Total .37 .66
Summary. The results of the computation of reliability coefficients
indicate that this instrument, as tested to date, is moderately reliable.
The Total score seems to provide the most reliable information. The
valge of subscales will have to be determined by more extensive field
testing and analyses, as well as by practical uses of the instrument. At
present it appears reasonable to assume that there is a general attitude
factor that influences all responses on the inventory with moderate con-
sistency. Responses regarding Rigidity and Control are the most reliable.
The type of teaching situation, as tested by the contrasting dis-
tricts, did not appear to significantly influence the overall reliability
of the instrument, but it may be that grade level does. Examination of
group means suggests that primary teachers may be more stable in self-
reports fall to spring than intermediate teachers. (See table in Appen-
dix IV.) To obtain more accurate indicators of stability, the inventory
should be administered about two months apart in winter.
Validation of the Instrument
Factor analyses. The items included in this inventory were intended
to ascertain an individual's position on a continuum between dichotomous
teaching styles. It was hypothesized that four distinct areas of opinion
would comprise a general attitude that influences teaching practices.
The fall data were factor-analyzed in order to determine to what extent
responses corresponded to the hypothesized four dimensions, and to obtain
bases for revising the dimensions. On the basis of the reliability data,
the possibility of two factors was also considered.
The inter-item correlation matrix for the pretests of all groups of
teachers (N = 89) was factor analyzed by BMD X-72 (Dixon, 1972), using
squared multiple correlations as commonality estimates. Two varimax ro-
tations were performed, one rotating two factors and one rotating. four
factors. The findings are presented in Tables 7 and 8.
TABLE 7
Results of Orthogonal Rotation of Four Factors
ItemFactor Loadings
1 2 3 4
1 (R) .49 .09 -.02 -.352 (C) .00 -.35 .49 .10
3 (P) .03 .02 .00 -.39
4 (C) .19 -.02 .49 .18
5 (I) -.12 -.28 .21 -.446 (P) .02 -.16 -.03 -.237 (I) .05 -.05 .42 -.258 (R) .03 .04 .64 .04
9 (I) .26 -.07 .23 -.47
10 (P) .34 -.05 -.12 -.2711 (C) .36 .23 .48 -.2612 (P) -.01 -.12 .27 -.1613 (R) -.01 -.41 .00 -.0314 (C) .10 -.64 -.05 -.2315 (R) .71 -.09 .25 .02
16 (I) .58 .05 .35 .02
17 (P) .36 -.32 .14 -.3118 (C) .58 -.20 .00 .17
19 (R) .20 -.53 .46 -.0420 (I) .05 -.51 .07 -.0921 (C) .65 -.04 .07 -.37
22 (R) .48 .02 .54 -.17
23 (I) .11 -.16 .00 -.5824 (P) .37 -.30 .29 -.10Proportionof TotalVariance 18% 7% 6% 4%
Cumulative Proportion = 35%
-23-
The rotated factor matrix with four factors is found in Table 7.
In parentheses following the item number is a letter indicating the
scale to which the item was assigned: Rigidity (R), Controlling (C),
Professionalism (P), and Individualism (I).
About half of the items were clearly loaded on one factor. Fre-
quently items were loaded highly on two factors. one positively and one
negatively. Accepting the highest loading as most valid, the items can
be assigned to the four factors, with 8, 4, 7, and 5 items falling in each,
respectively. The rotated factors did not confirm the hypothesized
scales, but similarities in content were seen. To help the reader exam-
ine the results, an abbreviated form of each item is listed for each
factor.
Items Loading Highest on Factor One
l. Schools are too structured these days A major problem is alack of well-defined structure
1.0. Faculty meetings should expose teachers to new ideas, materials andapproaches Faculty meetings should be very brief "business"
15. There is too much experimentation in our schools Teachers mustbe willing to experiment
16. A teacher can and should make time for frequent conferences withindividuals Individual conferences are very seldom possible
17. Teaching staffs should be more involved in the development and eval-uation of their programs Development and evaluation are donebest by the administrative staff
18. Group discussions in class are usually a waste of time Groupdiscussions are useful educational techniques
21. Students should be encouraged to become increasingly involved inplanning and evaluating Students may be involved only to avery limited extent
24. Teachers should help each other evaluate approaches, identify prob-lems or weaknesses, and design methods_of correcting theproblems Evaluation should be a personal matter, involvingonly the teacher and principal
The items on Factor One seem to have a common element of closedness
and rigidity. This cluster accounted for 18 percent of the, total vari-
ance, and appeared to be the most clear and influential factor.
-24-
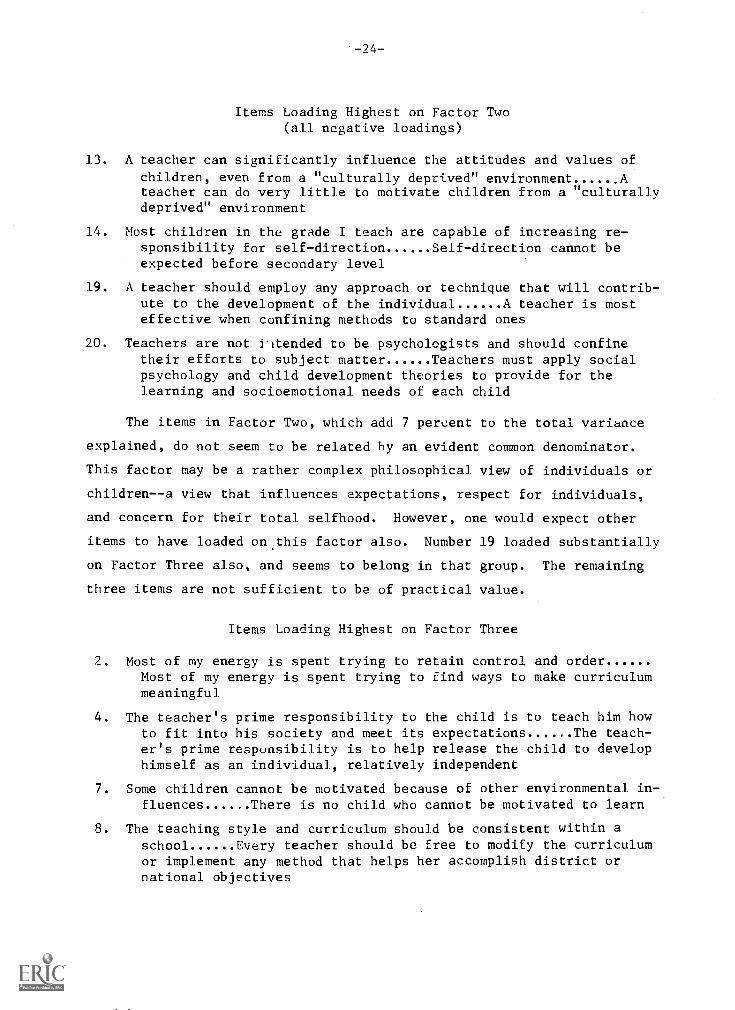
Items Loading Highest on Factor Two(all negative loadings)
13. A teacher can significantly influence the attitudes and values of
children, even from a "culturally deprived" environment Ateacher can do very little to motivate children from a "culturallydeprived" environment
14. Most children in the grade I teach are capable of increasing re-sponsibility for self-direction......Self-direction cannot beexpected before secondary level
19. A teacher should employ any approach or technique that will contrib-ute to the development of the individual A teacher is mosteffective when confining methods to standard ones
20. Teachers are not i-itended to be psychologists and should confinetheir efforts to subject matter Teachers must apply socialpsychology and child development theories to provide for thelearning and socioemotional needs of each child
The items in Factor Two, which add 7 percent to the total variance
explained, do not seem to be related by an evident common denominator.
This factor may be a rather complex philosophical view of individuals or
children--a view that influences expectations, respect for individuals,
and concern for their total selfhood. However, one would expect other
items to have loaded on this factor also. Number 19 loaded substantially
on Factor Three also, and seems to belong in that group. The remaining
three items are not sufficient to be of practical value.
Items Loading Highest on Factor Three
2 Most of my energy is spent trying to retain control and orderMost of my energy is spent trying to find ways to make curriculummeaningful
4 The teacher's prime responsibility to the child is to teach him howto fit into his society and meet its expectations The teach-er's prime responsibility is to help release the child to develophimself as an individual, relatively independent
7. Some children cannot be motivated because of other environmental in-fluences There is no child who cannot be motivated to learn
8. The teaching style and curriculum should be consistent within aschool Every teacher should be free to modify the curriculumor implement any method that helps her accomplish district ornational objectives
-25-
11. Ch4_1dren cannot learn well in a noisy room full of movementChildren should be allowed to talk and leave their seats toaccomplish work
12. A teacher should be free to test any idea or new technique in teach-ing Experimentation should occur only under the close super-vision of administration staff
22. Too much flexibility and pupil planning in a classroom creates feel-ings of insecurity and confusion Flexibility and spontaneityare vital to foster creativity and enthusiasm
The seven items in Factor Three may share in common an attitude
toward conformity or the status quo. This could be very similar to the
original concept of Controlling. Two items also have high loadings on
Factor One.
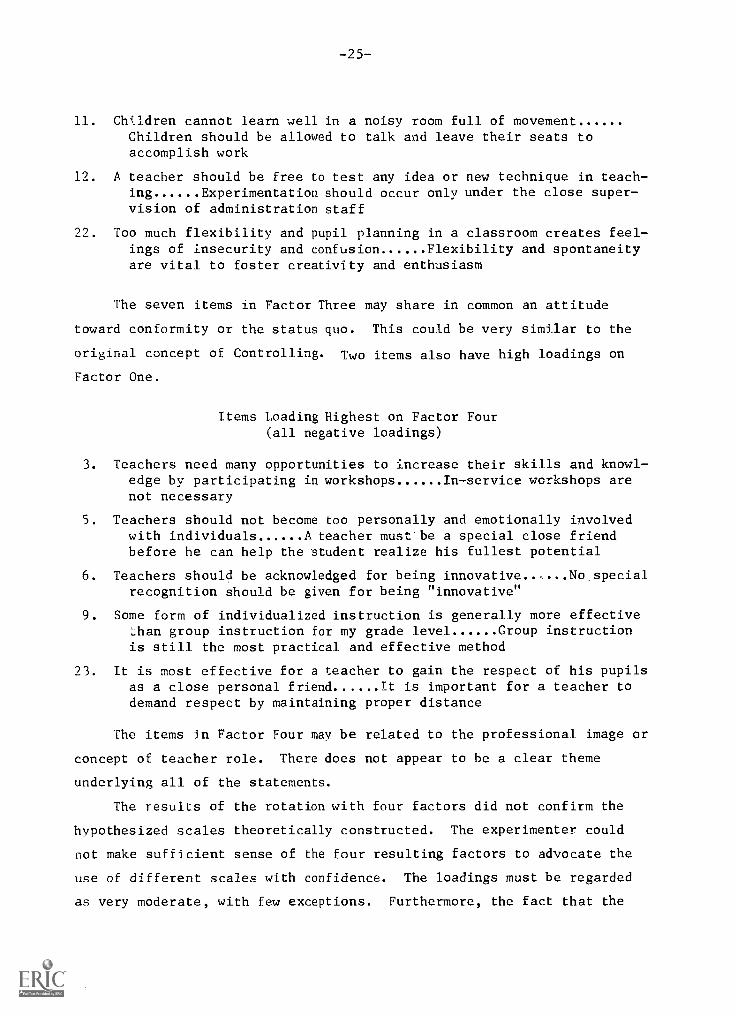
Items Loading Highest on Factor Four(all negative loadings)
3. Teachers need many opportunities to increase their skills and knowl-edge by participating in workshops In-service workshops arenot necessary
5. Teachers should not become too personally and emotionally involvedwith individuals A teacher must'be a special close friendbefore he can help the student realize his fullest potential
6. Teachers should be acknowledged for being innovative......No specialrecognition should be given for being "innovative"
9. Some form of individualized instruction is generally more effective,.han group instruction for my grade level Group instructionis still the most practical and effective method
23. It is most effective for a teacher to gain the respect of his pupilsas a close personal friend It is important for a teacher todemand respect by maintaining proper distance
The items in Factor Four may be related to the professional image or
concept of teacher role. There does not appear to he a clear theme
underlying all of the statements.
The results of the rotation with four factors did not confirm the
hypothesized scales theoretically constructed. The experimenter could
not make sufficient sense of the four resulting factors to advocate the
use of different scales with confidence. The loadings must be regarded
as very moderate, with few exceptions. Furthermore, the fact that the
-26-
four factors account for only 35 percent of the total variance raises
questions about possible measurement error. Certainly more comparative
data are needed for further analyses before a decision about scales can
be made.
After the factor rotation with four factors was completed, the pos-
sibility that two factors existed was investigated. This question was
raised partly by the overlap between the four factors derived on the
first analysis, and partly by the item-to-scale and intrascale correla-
tions. The hypothesis of two factors was based on the combination of
former scales (R + C and P + I) which, on the basis of theoretical simi-
larity, might be measuring two distinct components of general teacher
attitude. The loadings before and after rotation are provided in Table
8, since the results showed little evidence that the rotaLlue was bene-
ficial in gaining precise information.
In Table 8, the Classification column indicates die original scale
(R, C, P, or I) to which each item was assigned, and on which of the two
factors hypothesized (1 or 2) it was expected to be loaded. In a sense,
the loading of each item on one of the two scales was predicted. The
hypothesis was confirmed for 13 of the 24 items to the extent that the
highest loadings for those items were on the predicted factor. This re-
sult is little better than chance, however, with two factors. Factor
One contributed 18 percent to the total variance and Factor Two added
7 percent more. Although results must be considered very tentative at
this stage of research, with two factors explaining only 25 percent of
the total variance and the composition of the factors being somewhat
ambiguous, their value is negligible and does not seem promising.
The factor analyses were completed to determine what groupings of
items might be profitable as subscale scores. At this point, the find-
ings suggest that one general factor of attitude is measured best by the
inventory, and that subgroupings of items, as originally hypothesized,
may be of value only pragmatically--i.e., to answer specific questions,
as noted earlier. If more extensive field testing is completed. a more
accurate method of factor analysis might be the Procrustes method (see
Zwirner, Cronbach, Gage, & Beck, 1972, for an excellent discussion of the
-27-
use of this methodology on a similar measure). The relatively low
reliabilities obtained on items in this study would severely limit the
value of further analysis with the present data.
TABLE 8
Results of Orthogonal Rotation of Two vartors
Item ClassBefore After
1 2 3 4
1 R-lt .44 .01 .38 .21
2 C -1 .34.34 -.01 .17 .29
3 P-
2
.16 .19 .04 .25
4 C-1t .33 -.33 .45 -.125 I-2t .28 .39 .05 .48
6 P-2t .14 .24 .00 .28
7 1-9 .37 .00 .32 -.188 R-1t .34 -.30 .45 -.099 1-2 .50 .14 .36 .37
10 P-2 .29 .13 .18 .26
11 C-lt .54 -.31 .62 .00
12 P-2 .24 .07 .18 .18
13 R-1 -.13 .31 .04 .33
14 C-1 .32 .56 .00 .64
15 R-1t .64 .25 .68 -.1016 1-2 .57 -.35 .67 -.0317 P -2 .54.54 .22 .35 .46
18 C-1 .39 .13 .40 -.0819 R-1 .57 .15 .42 .41
20 I-2t .26 .36 .05 .44
21 C-1t .64 .01 .55 .32
22 R-1t .68 .27 .72 -.1023 I-2t .34 .39 .10 .51
24 P-2 .54 .04 ./:4 .31
tHypothesis confirmed.
Criterion validity. The value of this instrument depends on its
ability to predict teacher behavior or to reveal concurrent teaching
practices. The basic questions that must be asked are as follows. (1)
To what extent does a score on the TAI accurately indicate the
-28-
approximation of that teacher's behavior to Style One or Two? (2) To
what extent does a score in the fall on TAI predict teaching behavior in
the spring? Information about teacher behavior was extracted from the
extensive data collected for evaluation of the two in-service education
research projects mentioned earlier in a post hoc effort to obtain pre-
liminary answers to those two questions; the information used came from
the Teacher Behavior Observation Schedule (Sears, Crist, .8t Marx, forth-
coming), an instrument developed for the large study of which the TAI
was a part. The purpose of this memorandum is primarily to stimulate
interest in further collection of validation data for the TAI.
The hypothesis for testing the validity of the TAI is that teachers
exhibiting those behaviors described as Style One should report signifi-
cantly lower scores on the TAI than teachers behaving as described by
Style Two. The hypothesis was tested at two levels--highly objective
(i.e., via the TBOS) and more subjective (informal). Similar observation
data were available for the two sets of teachers participating in the
workshops in District One. (Eighteen of the teachers participated in
biweekly workshops for the year 1970-71. Twenty-two teachers partici-
pated in a year-long in-service project during 1971-72.)
The objective data were obtained from time point sampling observa-
tions by naive observers coding six aspects of teacher behavior into
mutually exclusive descriptive categories (see the outline of the TBOS
in Appendix III). Combinations of categories believed to be critical in
discriminating between the two theoretical styles were identified, and
the frequency of each of the teacher behaviors in those categories was
analyzed.
The procedure for testing the hypothesis was as follows. The ex-
perimenter attempted to divide the teachers in each year into two equal
groups most closely approximating the two teaching styles. This assign-
ment to groups was artificial in that very few teachers in District One
could be considered to exemplify Style Two. However, the division was
a reasonable test--perhaps more arduous than necessary to test the
hypothesis because of the restricted range of teacher behaviors in the
sample. The assignment of a teacher to a group was not based on limited
-29-
information about the person's teaching behavior. The experimenter had
observed formally and informally in the classrooms on numerous occasions,
had observed behavior during workshops, and had shared in problem solving
with the teachers as a consultant. Three teachers with whom there was
very limited contact were dropped from the 1970-71 sample for this analy-
sis. The experimenter considered herself adequately knowledgeable about
the classroom practices of the remaining 15 teachers.
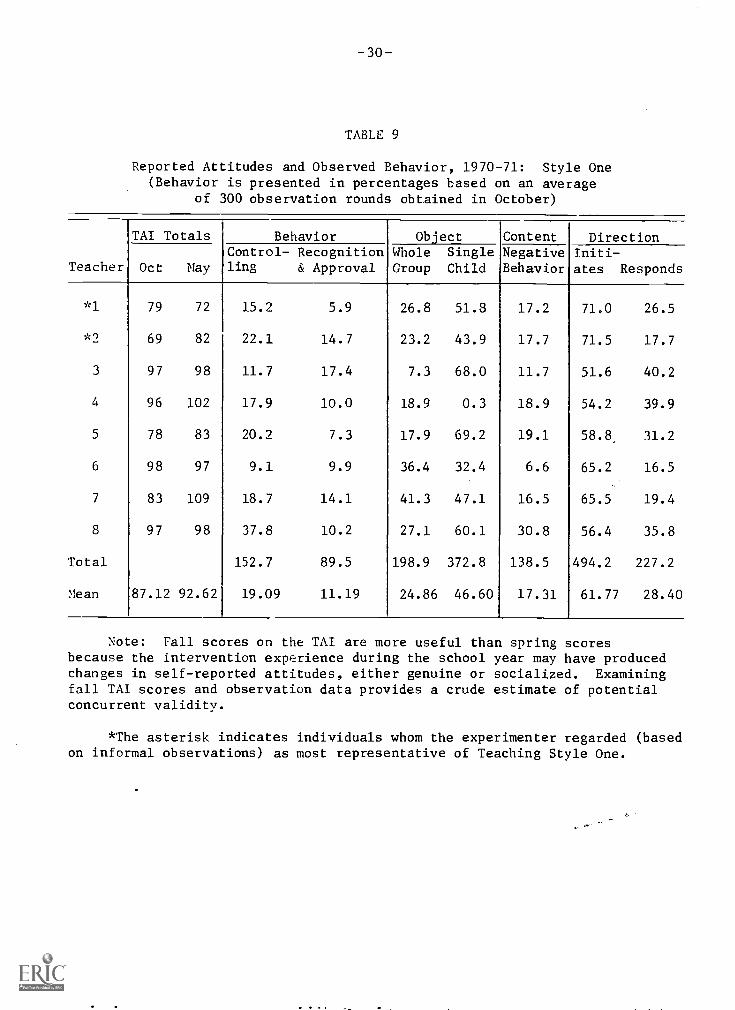
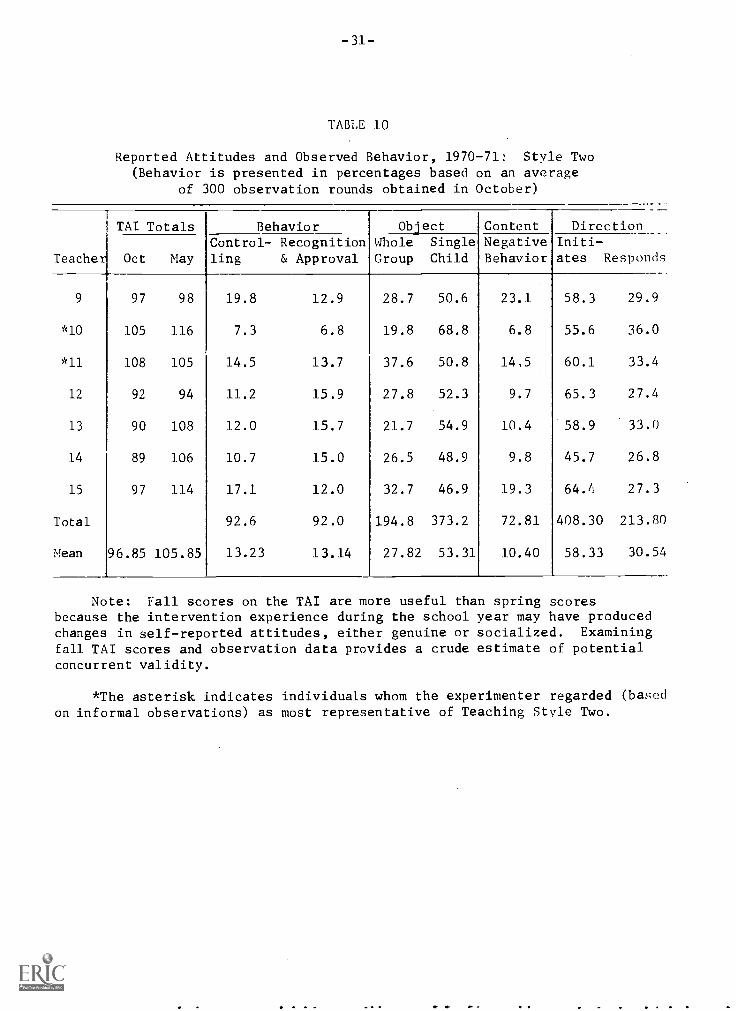
In Tables 9 -12 there is evidence that scores on the TAI may
often be accurate indicators of concurrent and future behavior of indi-
viduals in the classroom. The results also show a large amount of
variance within groups and a lack of consistent differences between
groups. This finding may be produced by the relative homogeneity of the
sample from District One and the artificiality of group assignments.
The fact that differences between group means were usually in the pre-
dicted direction was encouraging.
Because of the ad hoc nature of this analysis and awareness of the
limitations upon this study, extensive analyses of the relationship be-
tween self-report of teachers and their observed behavior were not pur-
sued. Unfortunately it was not possible to obtain observations of class-
room behavior from teachers in District Two. That would have made pos-
sible a more nearly adequate analysis of validity. The raw data from
District One reported here are offered as encouragement to other research-
ers to design a more complete field test to further test TAI validity.
The self-reports from individuals were apparently accurate, since
they were consistent with the experimenter's informal observations.
Even those teachers who seemed to say one thing and do another (e.g.,
to endorse innovation and experimentation in workshop sessions but never
to find it convenient to try something different) were revealed accurately
through the TAI and the classroom observations. An example is S# 9 in
Table 12. The experimenter was aware of the "gap" between this subject's
"intellectual" or "rational" verbalizations in workshops and faculty
sessions and her more emotional and irrational behavior in the classroom.
The teacher was extremely distressed by the tension resulting from the
acute discrepancies.
-30--
TABLE 9
Reported Attitudes and Observed Behavior, 1970-71: Style One(Behavior is presented in percentages based on an average
of 300 observation rounds obtained in October)
Teacher
TAI Totals Behavior Object Content Direction
Oct MayControl- Recognitionling & Approval
WholeGroup
SingleChild
NegativeBehavior
Initi-ates Responds
*1 79 72 15.2 5.9 26.8 51.8 17.2 71.0 26.5
.A.-) 69 82 22.1 14.7 23.2 43.9 17.7 71.5 17.7
3 97 98 11.7 17.4 7.3 68.0 11.7 51.6 40.2
/4 96 102 17.9 10.0 18.9 0.3 18.9 54.2 39.9
5 78 83 20.2 7.3 17.9 69.2 19.1 58.8 31.2
6 98 97 9.1 9.9 36.4 32.4 6.6 65.2 16.5
7 83 109 18.7 14.1 41.3 47.1 16.5 65.5 19.4
8 97 98 37.8 10.2 27.1 60.1 30.8 56.4 35.8
Total 152.7 89.5 198.9 372.8 138.5 494.2 227.2
Mean 87.12 92.62 19.09 11.19 24.86 46.60 17.31 61.77 28.40
Note: Fall scores on the TAI are more useful than spring scoresbecause the intervention experience during the school year may have producedchanges in self-reported attitudes, either genuine or socialized. Examiningfall TAI scores and observation data provides a crude estimate of potentialconcurrent validity.
*The asterisk indicates individuals whom the experimenter regarded (basedon informal observations) as most representative of Teaching Style One.
-31-
TABLE 10
Reported Attitudes and Observed Behavior, 1970-71: Style Two(Behavior is presented in percentages based on an average
of 300 observation rounds obtained in October)
Teacher
TAI Totals Behavior Object Content Direction
Oct MayControl- Recognitionling & Approval
wholeGroup
SingleChild
NegativeBehavior
Initi-ates Respond9
9 97 98 19.8 12.9 28.7 50.6 23.1 58.3 29.9
*10 105 116 7.3 6.8 19.8 68.8 6.8 55.6 36.0
*11 108 105 14.5 13.7 37.6 50.8 14.5 60.1 33.4
12 92 94 11.2 15.9 27.8 52.3 9.7 65.3 27.4
13 90 108 12.0 15.7 21.7 54.9 10.4 58.9 33.0
14 89 106 10.7 15.0 26.5 48.9 9.8 45.7 26.8
15 97 114 17.1 12.0 32.7 46.9 19.3 64.4 27.3
Total 92.6 92.0 194.8 373.2 72.81 408.30 213.8C
Mean 96.85 105.85 13.23 13.14 27.82 53.31 10.40 58.33 30.54
Note: Fall scores on the TAI are more useful than spring scoresbecause the intervention experience during the school year may have producedchanges in self-reported attitudes, either genuine or socialized. Examiningfall TAI scores and observation data provides a crude estimate of potentialconcurrent validity.
*The asterisk indicates individuals whom the experimenter regarded (basedon informal observations) as most representative of Teaching Style Two.
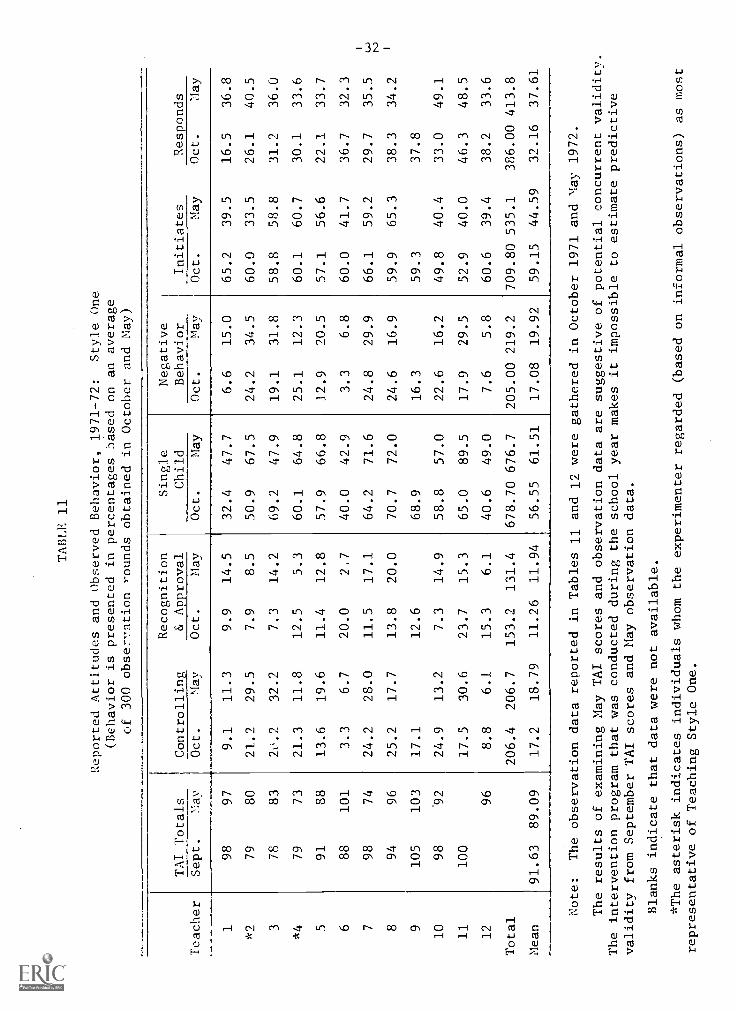
TABLE 11
Reported Attitudes and observed Behavior, 1971-72:
Style One
(Behavior is presented in percentages 'Dased on an average
of 300 observation rounds obtained in October and May)
Teacher
TAI Totals
Controlling
Recognition
& Approval
Single
Child
Negative
Behavior
Initiates
Responds
Sept.
May
Oct.
May
Oct.
May
Oct.
May
Oct.
May
Oct.
May
Oct.
lay
198
97
9.1
11.3
9.9
14.5
32.4
47.7
6.6
15.0
65.2
39.5
16.5
36.8
*7
79
80
21.2
29.5
7.9
8.5
50.9
67.5
24.2
34.5
60.0
33.5
26.1
40.5
378
83
2c.2
32.2
7.3
14.2
69.2
47.9
19.1
31.8
58.8
58.8
31.2
36.0
*4
79
73
21.3
11.8
12.5
5.3
60.1
64.8
25.1
12.3
60.1
60.7
30.1
33.6
591
88
13.6
19.6
11.4
12.8
57.9
66.8
12.9
20.5
57.1
56.6
22.1
33.7
688
101
3.3
6.7
20.0
2,7
40.0
42.9
3.3
6.8
60.0
41.7
36.7
32.3
798
74
24.2
28.0
11.5
17.1
64.2
71.6
24.8
29.9
66.1
59.2
29.7
35.5
894
96
25.2
17.7
13.8
20.0
70.7
72.0
24.6
16.9
59.9
65.3
38.3
34.2
9105
103
17.1
12.6
68.9
16.3
59.3
37.8
10
98
92
24.9
13.2
7.3
14.9
58.8
57.0
22.6
16.2
49.8
40.4
33.0
49.1
11
100
17.5
30.6
23.7
15.3
65.0
89.5
17.9
29.5
52.9
40.0
46.3
48.5
12
96
8.8
6.1
15.3
6.1
40.6
49.0
7.6
5.8
60.6
39.4
38.2
33.6
Total
206.4
206.7
153.2
131.4
678.70
676.7
205.00
219.2
709.80
535.1
386.00
413.8
Mean
91.63
89.09
17.2
18.79
11.26
11.94
56.55
61.51
17.08
19.92
59.15
44.59
32.16
37.61
Note:
The observation data reported in Tables 11 and 12 were gathered in October 1971 and May 1972.
The results of examining May TAI scores and observation data are suggestive of potential concurrent validity.
The intervention program that was conducted during the school year makes it impossible to estimate predictive
validity from September TAI scores and May observation data.
Blanks indicate that data were not available.
*The asterisk indicates individuals whom the experimenter regarded (based
on informal observations) as most
representative of Teaching Style One.
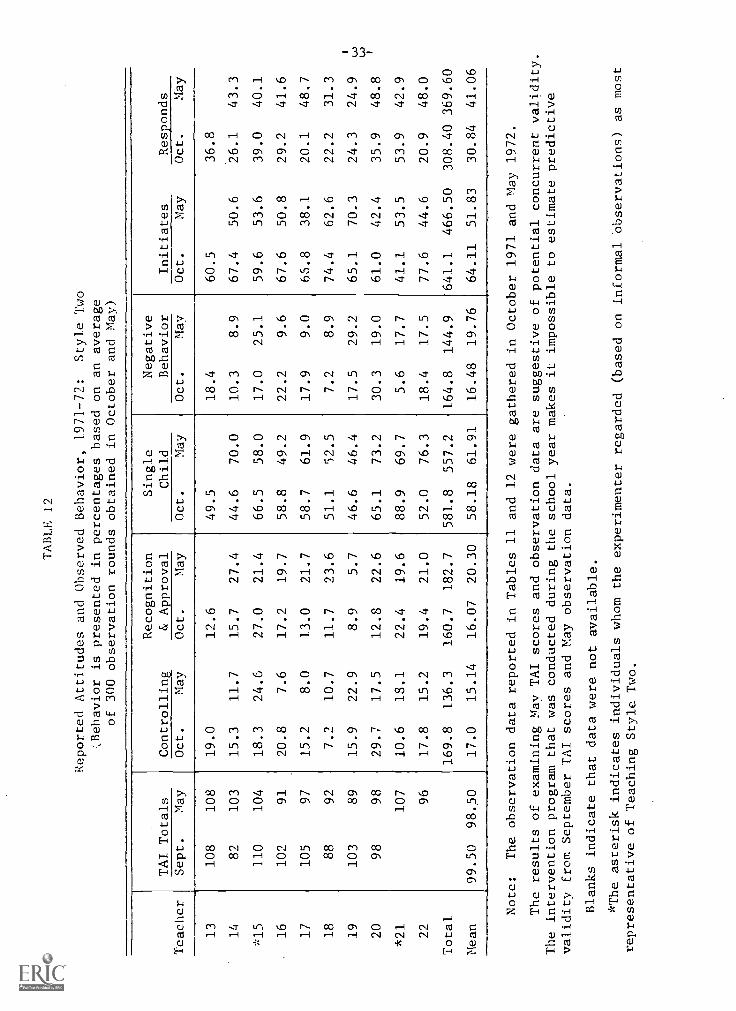
TABLE 12
Reported Attitudes and Observed Behavior, 1971-72:
Style Two
:,Behavior is presented in percentages based on an average
of 300 observation rounds obtained in October and May)
Teacher
TAI Totals
Controlling
Recognition
& Approval
Single
Child
Negative
Behavior
Initiates
Responds
Sept.
May
Oct.
May
Oct.
May
Oct.
May
Oct.
May
Oct.
May
Oct.
May
13
108
108
19.0
12.6
49.5
18.4
60.5
36.8
14
82
103
15.3
11.7
15.7
27.4
44.6
70.0
10.3
8.9
67.4
50.6
26.1
43.3
*15
110
104
18.3
24.6
27.0
21.4
66.5
58.0
17.0
25.1
59.6
53.6
39.0
40.1
16
102
91
20.8
7.6
17.2
19.7
58.8
49.2
22.2
9.6
67.6
50.8
29.2
41.6
17
105
97
15.2
8.0
13.0
21.7
58.7
61.9
17.9
9.0
65.8
38.1
20.1
48.7
18
88
92
7.2
10.7
11.7
23.6
51.1
52.5
7.2
8.9
74.4
62.6
22.2
31.3
19
103
89
15.9
22.9
8.9
5.7
46.6
46.4
17.5
29.2
65.1
70.3
24.3
24.9
20
98
98
29.7
17.5
12.8
22.6
65.1
73.2
30.3
19.0
61.0
42.4
35.9
48.8
*21
107
10.6
13.1
22.4
19.6
88.9
69.7
5.6
17.7
41.1
53.5
53.9
42.9
22
96
17.8
15.2
19.4
21.0
52.0
76.3
18.4
17.5
77.6
44.6
20.9
48.0
Total
169.8
136.3
160.7
182.7
581.8
557.2
164.8
144.9
641.1
466.50
308.40
369.60
Mean
99.50
98.50
17.0
15.14
16.07
20.30
58.18
61.91
16.48
19.76
64.11
51.83
30.84
41.06
Note:
The observation data reported in Tables 11 and 12 were gathered in October 1971 and May 1972.
The results of examining May TAI scores and observation data are suggestive of potential concurrent validity.
The intervention program that was conducted during the school year makes it impossible to estimate predictive
validity from September TAI scores and May observation data.
Blanks indicate that data were not available.
*The asterisk indicates individuals whom the
experimenter regarded (based on informal observations) as most
representative of Teaching Style Two.
-34-
Problems with validating the TAI. The chief difficulty encountered
in trying to validate a measure of teacher attitude is the same as that
faced by designers of instruments for assessing self-concept or any other
personal attitude--that is, one is limited by the willingness of subjects
to divulge sensitive information accurately. There is no well-defined
construct or universe of criteria to assist the psychologist in evaluating
a measure. To reduce our discomfort with this problem, there has been a
recent emphasis on obtaining behavioral measures to validate self - reports.
This is a worthwhile research route, but psychologists must be aware that
it is a restricted one. Such information can help to answer the questions
raised earlier regarding the accuracy with which TAI scores can predict
teacher behavior. However, it is important to remember that attitude is not
equivalent to behavior, even though a direct relationship between the two
subject characteristics is assumed. If they were equivalent, there would be
no need for the concept of "attitude." When a psychologist measures atti-
tude, he is gaining self-reports from individuals regarding specific feel-
ings, perceptions, or opinions. No one can validate the self-report perfectly
but the respondent. The amount of "error" biasing results will include
many personal factors, such as desire to please or succeed, and social learn-
ing experiences.
The TAI items are constructed around well-known issues in education
that presumably influence decisions regarding teaching methods or style. It
is expected that after years of training and experience, an individual has
internalized an idealized concept of "the perfect teacher." This concept
may be what is reported on the TAI. Actual teaching behavior may not be
so ideal. Behavior may also be influenced by emotional inner conflict in
the teaching role, with the result that a teacher does not successfully
translate her beliefs, values, or principles of good teaching into her
daily behavior in the classroom. Another teacher may achieve a high degree
of congruity between his idealized concept of a good teacher and his teach-
ing style.
In summary, validity data will always be limited, tentative, and sub-
ject to scrutiny for each individual or group whose TAI scores may be used
as a basis for professional judgments. Those limitations on its meaning
-35--
must be remembered, and users of the instrument must seek additional valid-
Ltv data for each group or individual tested. Each administrator of the
inventory must he alert to signs of social desirability in responses and
to the presence of forms with predominantly noncommittal responses ("3").
Each examiner assisting with the further development of this instrument is
urged to encourage respondents, too, to note sources of ambiguity in the
items.
The Practical Value of the TAI for Discriminating Between Groups
Another test of instrument validation is the ability of a measure
to discriminate between groups that are significantly different on a cri-
terion variable. As was previously described, the two teacher samples
were drawn from contrasting districts. Although objective data on teacher
behavior were not obtained from each sample, informal observations and ex-
periences in consultant relationships with both groups clearly suggested
basically dichotomous orientations toward teaching. Teacher behavior in
District One seemed to include more adult control of pupil behavior and
"traditional" methodology, as described by Style One. The teachers in Dis-
trict Tw6 exhibited more behaviors included in Style Two. The research
hypothesis was: Teachers in District One would score significantly lower
on the TAI than teachers in District Two. This hypothesis was stated for
self-reports in the fall, with the hope that differences would be elimi-
nated during the year through the in-service education experiences.
Table 13 reports the results of t tests calculated to test the sig-
nificance of differences between group means, which were in the expected
direction. The null hypothesis was rejected at the .01 level of signifi-
cance for Total, Rigidity, and Controlling scale means. This finding
indicates that the informally observed differences in behavior between
the two groups of teachers did in fact exist, except in relation to Pro-
fessionalism. It is important to note that any tendency toward socialized
rusponses resulting from external pressures in District One was not suffi-
ciently strong to obscure the significant differences between the groups,
unless perhaps on the Professionalism scale.
An equally important finding was verification of the observed differ-
ences between the groups regarding disciplinary control and structure.
The statistics in Table 13 support the hypothesis that teachers in District
-36-
TABLE 13
Means, Variance, and t Values (One-Tailed) on TAI Subscales, by District
Scale FallDistrict One District Two
Value(N = 35)
t(N = 51)
Rigidity R 23.91 25.82 2.54**S2
14.90 7.18
Controlling X2 21.37 24.20 3.63**s2
12.12 13.44
Professionalism R 24.97 25.22 n.s.2
S 5.97 9.53
Individualism R 22.77 24.22 1.84*S2
12.89 12.53
R + C R 45.29 50.02 3.12**2
S 43.74 32.90
P + I R 47.74 49.43 1.44
S2
24.38 34.81
Total R 93.03 99.45 2.78**2
S2 110.67 110.88
Scale SpringDistrict One District Twoa
(N = 34)t Value
(N = 36)
Rigidity R 24.44 25.06 n.s.2
S 11.47 7.94
Controlling R 23.35 24.31 n. s.2
S 14.90 14.79
Professionalism R 25.35 24.22 n. s.2
S 11.14 11.95
Individualism R 23.29 23.67 n. s.2
S 14.28 12.40
R + C R 47.79 49.36 n, s.2
S 37.02 35.72
P + I R 48.65 47.89 n. s.2
S2 37.45 31.88
Total R 96.44 97.25 n.s.2
S2 126.56 107.11
aSpring data were unavailable from the third and most contrasting
school in District Two.
*p < .05
**p < .01
-37-
One were less willing to release control and allow pupil self-direction,
and were more inclined to adhere to rigid procedures and to direct in-
struction to the whole class or at least to large groups. Teachers in
District Two were less concerned with controlling students and following
curriculum guides and were apt to be more responsive to in-service'educa-
tion experiences intended to increase flexibility and innovation on the
part of teachers while developing pupil self-direction.
The above comparisons between districts generated two questions.
Were the greatest differences in attitude between intermediate teachers
in the two districts? Was the third school in District Two (School 5)
riost significantly different from schools in District One?
Examination of the means and standard deviations reported in Table
14 reveals that differences were greatest by far between the intermediate
teachers, as predicted. In fact, the lack of difference between means
for groups of primary teachers was surprising. The means and variances
were almost identical. The kindergarten and primary-grade teachers in
the low-SES community seemed to have beliefs and attitudes similar to
those in the middle-class community. Intermediate teachers in the two
districts seemed to begin the year with significantly different attitudes.
TABLE 14
Comparison of Teachers by Grade Level on Fall TAI
Scales DistrictN = 17
Intermediate1 District
N = 24
t value2 (one-
tailed)
Primary (K-3)District 1 District 2
N = 12 N = 27
t value(one-
tailed)
R + C )7 43.12 50.79 3.85** 49.33 49.33 n. s.
S 2 44.89 32.26 34.46 33.64 n. s.
P + I X 46.82 50.62 2.32* 48.25 48.37 n. s.S2 25.00 29.38 24.80 38.44 n.s.
Total X 89.94 101.42 3.44** 97.58 97.70 n.s.S2 113.85 106.09 107.12 112.57 n. s.
*p < .05**p < .01
-38-
It should be recognized that about one-third (5 out of 17) teachers in
the District One sample (used in Table 6) were black. All of the teachers
in the District Two sample were white. A question for future research
might be whether minority teachers have significantly different attitudes
as measured on the TAI. In this study, there is no evidence that such a
difference might exist, but the hypothesis should be tested.
Table 15 provides an answer to the question regarding School 5. The
reader will recall that School 5 was described as the school most closely
exemplifying Style Two teaching. The teachers had been selected for the
school because of their desire and ability to work effectively in teams
for teaching in round, open-space buildings. Teachers in that school re-
flected a relaxed, flexible manner that encouraged pupil participation in
decision making and allowed much experimentation with methods of "reaching
the kids." If informal observations were accurate, teachers in this
school should have reported significantly higher scores on the TAI.
School 2, in District One, was selected for comparison with School
5, in District Two. By contrast to School 5, School 2 was housed in a
traditional California school building, and teaching styles were closest
to exemplifying Style One. School 2 might be described as "distressed"
(see Whitmore, Crist, & Marx, 1974). This adjective reflects an atmos-
phere of frustration, tension, and conflict f..7r teachers and students.
Control of disruptive and rebellious behavior was the foremost teacher
concern, followed by a desire to "get kids to want to learn and achieve."
The two schools, 2 and 5, were considered to be as dichotomous as Styles
One and Two.
The means reported in Table 15 represent teachers of all grades in
the different faculties. The t tests in Table 16 show that differences
between Schools 2 and 5 are significant. Examination of the means of all
schools included in the study suggests that School 5 is markedly different
from a].1 the others. It should be remembered that the group means for
schools obscure the significant differences between primary and inter-
mediate teachers, as previously discussed.
-39-
TABLE 15
Means and Variance on Fall TAI Subscales, by School
Scale1 2 3 4 5
(N=17) (N =18) (N=13) (N =16) (N=22)
Rigidity 23.00 24.78 25.15 24.94 26.86S2 16.25 12.89 6.81 9.40 4.50
Controlling Tc 20.12 22.56 23.23 23.94 24.96S2 11.99 9.91 7.36 9.80 19.57
Professionalism 5{ 24.59 25.33 23.92 23.44 27.27S2 4.88 7.06 6.58 7.60 5.64
Individualism 22.24 23.28 22.77 23.38 25.68S2 13.69 12.31 9.69 9.05 13.75
Total Score 89.94 95.94 95.08 95.69 104.77S2 113.94 95.59 60.75 90.63 112.10
TABLE 16
Tests of Significance (One-Tailed) Between TAI Means for Schools 2 and 5(Fall Data: df = 38)
Scale t Value Level of Significance
Rigidity 2.17 .05
Controlling 2.00 .05
Professionalism 2.40 .05
Individualism 2.11 .05
Total Score 2.73 .01
-40--
From these preliminary findings, one may tentatively conclude that
the TAI is able to discriminate between groups of teachers differing in
teaching styles and opinions regarding optimal teaching practices. The
results were encouraging, and it is hoped that they will stimulate fur-
ther testing of the instrument.
Limitations of the Field Test
Missing data limited this study rather seriously. From two to five
percent of the data from each teacher group was missing due to omitted
responses and unclear markings. Forty-two subjects, mostly in District Two,
were eliminated from analyses because of missing data, fall or spring. The
total loss of spring data from the third school in the middle-class community
was an unfortunate occurrence, since that school most closely exemplified the
type of learning climate created by Style Two teachers. This observation
was substantiated by the significantly high fall group mean of 105. Only
6 of the 24 teachers in School 5 had a Total score of less than 100.
Another limitation was the restriction on the amount of data that
could be gathered for this segment of the larger research project. Observa-
tions of teacher behavior in District Two were not possible. The most com-
prehensive data were obtained for eight intermediate teachers in District
One--a sample so small that the valuable information obtained could not be
used well. Specifically, the data obtained were measures of student percep-
tions of teachers, pupil freedom to self-direct, and classroom climate. The
group of eight teachers did not include distinctive representatives of both
teaching styles, so the information could not be used in validating the
instrument.
It was expected that the fears of administrative evaluation in the low-
SES black schools would bias the responses of the teachers on the TAI. It is
not clear to what extent this influence may have occurred. Generally, the
participants' responses seemed to the experimenter to be candid even though
names were attached to the forms. In School 5 of District Two, an
unexpected fear was expressed by a few teachers that they would never know
who "might get their hands on the completed questionnaires." The examiner
suggested numerical codes for identification, and the resulting anonymity
seemed to release teachers to respond freely to the items.
-41-
Certainly cross-validation of results is needed based upon a wide
variety of situations and much larger samples. As was mentioned earlier,
testing about two months apart in winter seems advisable to obtain sta-
bility coefficients. It would also be desirable to involve teachers from
more minority groups and different parts of the country.
Potential Uses of the TAI
In Research
The TAI may be helpful in defining problem situations within dis-
tricts or schools by providing profiles of teacher opinions regarding
basic issues. It may also be valuable as a measure of the effectiveness
of in-service education programs, indicating the degree of attitude
change over time.
By Districts
Administrative leaders or in-service personnel may use information
provided by TAI scores to assess the position of individuals or groups
of teachers in relation to the two styles of teaching and the attitude
toward programs of in-service education. Mean scores for large groups
obtained at different times might be valuable measures of trends or
changes.
By Principals
TAI scores might assist principals in matching teacher assignments
to compatible styles; e.g., team teaching in an open classroom setting
requires a high degree of flexibility and ability to individualize. The
principal might also use the questionnaire to stimulate faculty discus-
sions on selected items and to guide him in counseling individuals who
are directed toward professional growth. The TAI should be only one
source of information about the teacher.
By Teachers
Teachers may wish to use the TAI to examine their own beliefs and
positions on issues--especially to gain insight regarding the discrep-
ancies between beliefs and actions that may be sources of frustration, a
sense of failure, or job dissatisfaction. This use of the TAI could he
accomplished in small discussion groups or in private counseling.
-42-
Cautions
The potential uses of the instrument mentioned above are intended
to stimulate interest in the inventory and to guide the researchers who
may further its development. At this stage, there is not enough evidence
of the reliability and validity of the instrument for its use to be ex-
tended beyond that of qualified researchers desiring to obtain more data.
Others interested in field testing the instrument and putting their re-
sults to practical use in schools may contact the author for permission.2
Conclusions
The concluding statements that can be made based upon this prelimi-
nary study are as follows:
-The instrument appears worthy of further testing and development.
-There is moderate evidence that the TAI is capable of being
substantially reliable and valid.
--Cross-validation in a wide variety of situations with large
numbers of teachers is desirable, along with observations of classroom
behavior for validity data.
--Norms and standard errors of measurement need to be obtained
based on large, heterogeneous samples.
2Dr. J. R. Whitmore, Department of Psychology, Box 512, Peabody
College for Teachers, Nashville, Tennessee 37203.
-43-/
References
Dixon, W. J. (Ed.) BMD: Biomedical computer programs, X-seriessupplement. Berkeley, Ca.: University of California Press, 1972.
Kerlinger, F. N., & Kaya, Esin. The predictive validity of scalesconstructed to measure attitudes toward education. Educationaland Psychological Measurement, 1959, 19, 305-317.
Kreitlos, B., & Dreier, W. A scale for measuring teachers' beliefsabout children, schools, and teaching. The Elementary SchoolJournal, 1955, 55, 325-329.
Sears, P. S., Bloch, M., Hubner, J., Gamble, J., Adenubi, M., &Crist, J. L. Effective reinforcement for achievement behaviorsin disadvantaged children: The first year. (Stanford Center for
Research and Development in Teaching, Technical Report No. 30),Stanford University, 1972. (ED 067 4421
Sears, P. S., Crist, J. L. , & Marx, R. W. The teacher behavior observa-
tion schedule: An instrument for coding teachers' T.lassroom inter-action. Stanford Center for Research and Development in Teaching,forthcoming.
Welding, L. J., & Charters, W. W. Dimensions of teacher beliefs aboutthe teaching process. American Educational Research Journal, 1969,6, (7), 7-30.
Whitmore, J. R., Crist, J. L., & Marx, R. W. An experim...ntal in-service
teacher education program for distressed elementary schools.(Stanford Center for Research and Development in Teaching, R&DMemorandum No. 117), Stanford University, 1974.
Zwirner, W., Cronbach, L. J.., Gage, N. L., & Beck, W. Pup .l perceptions
of teachers: A factor analysis of "About My Teacher." The Western
Psychologist, 1972, 3, (3-4), 78-98.
Name
Appendix I
TEACHER ATTITUDE INVENTORY, 1974(Revised Form)
Grade teaching
School
Date
Instructions
The following pairs of statements have been chosen to illustratesome real questions about the teaching role. The purpose of the inven-tory is to obtain a clearer picture of the attitudes and feelings teach-ers have regarding these controversial issues. Individual responses tothe questionnaire will not be .disclosed, but group results will be madeavailable to you.
Please consider the two statements given beside each number. Askyourself, "Where do I generally stand regarding these contrasting posi-tions in relationship to teaching my grade level?" Then, mark one "X"on the continuum indicating how you most often would respond, thoughexceptions often occur.
A mark in Column "1" represents strong agreement with thefirst statement.
A mark in Column "2" indicates mild agreement with thefirst statement.
A mark in the center column will indicate no preference, orthat both statements seem equally valid to you.
A mark in Columns "4" or "5" shows mild or strong agreementwith the second statement.
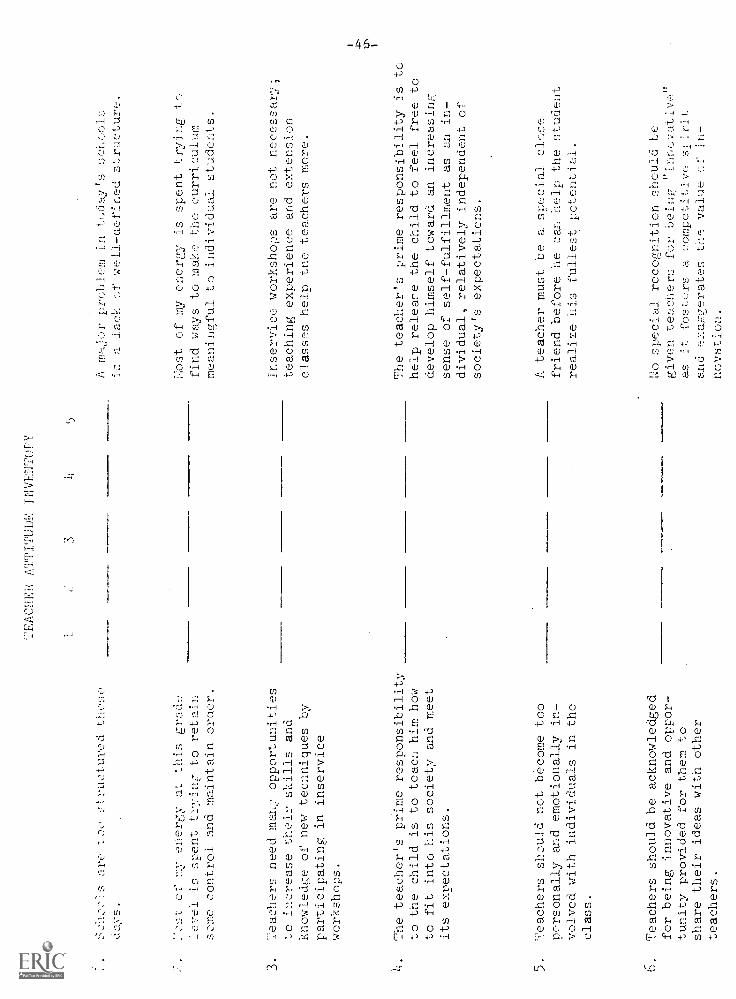
s are too
ril,!tured these
aays. t of my energy at this grade
ievei is spent trying to retain
some control and maintain order.
3.
Mashers need many opportunities
to increase their skills and
knowledge of new tecnniques by
participating in inservice
workshops.
4.
The teacher's prime responsibility
to the child is to teach him how
to fit into his society and meet
its expectations.
5.
Teachers shsuld not become too
personally and emotionally in-
volved with individuals in the
class.
6.
Teachers should be acknowledged
for being innovative and oppor-
tunity provided for them to
share their ideas with other
teachers.
TEACHE
ATTITUDE INVENTOPY
3
A major problem in today's schrJols
ia lack of well-dbfined structure.
:ost of my energy is spent trying to
find ways to make the curriculum
meaningful to individaal students.
Inservice workshops are not necessary;
teaching experience and extension
classes help tne teachers more.
The teacher's prime responsibility is to
help relear.e the child to feel free to
develop himself toward an increasing
sense of self-fulfillment as an in-
dividual, relatively independent of
society's expectations.
A teacher must be a special close
friend before he can help the student
realize his fullest potential.
No special recognition should be
given teaoners for being "innc,yativen
as it fosters a ,2ompetitive, s:irit
and e:,..aFerates toe value
in-
novation.
Some ohi.Ldren
be motivated
1.-e cause o: other environmental
influenos.
B.
The teaching style (methodology)
and curriculum should be consis-
tent with a school and relatively
consistent within a district or
a nation.
9.
Some form of individualized
instruction is generally more
effective than group instruc-
tion for my grade level.
10.
Faculty meetings should expose
teachers to new ideas, mate-
rial and approaches; memos
can communicate technical-
clerical information.
11.
Children cannot learn well
in a noisy room full of move-
ment.
A teacher sholdd be free to
test any idea of a new
technique in teaching.
II
[here is no child who cannot be
motivated to learn.
Every teacher should be free to
modify the curriculum or implement
any method that helps her accomlisn
district or nationally defined
objectives for the grade.
Group instruction is still the most
practical and effective method cf
teaching for my grade level.
Faculty meetings should be very
brief and confined to essential
"business."
Children should be allowed to talk
and to leave their seats or the
room freely any time to accomplish
work.
Experimentation should occur only
under the close suservision of
administrative staff.
:encher
influence the attitudes and
values of children even from
a "culturally derived
home
and social environment.
Yost children in the grade
that I teach are capable
of increasing responsibility
for self-evaluation and self-
discipline as individuals
and as a group.
15.
There is too much exper-
imentation in our schools
and too little respect for
traditional approaches.
16.
Individual pupil conferences
with all students are very
seldom possible in classes'
of 25 or more.
17.
Teaching staffs should be
more involved in the de-
velopment and evaluation
of their programs.
18.
Group discussions in class are
usually a waste of time.
It
A Leacher cah do very little to
motivate chi_:.dren from a
culturally deprived" home and
social environment.
Pupils cannot be expected to assume
responsibility for self - discipline
and evaluation before the secondary
level; until then the teacher must
assume most responsibility for
discipline and evaluation.
Teachers must be willing to exper-
iment with new approaches because
our schools are in need of many
changes before they will successfully
do their job.
A teacher can and should make time
for frequent conferences with in-
dividual pupils on personal and
academic matterc.
Development and evaluation of pro-
grams can best be carried out by
administrative staffs.
Group dialogue and exploration of
ideas are useful educational tech-
niques.
shonio
,-.)ymy
a;rroacri or techhi,lue that
t.ritute toward
t he
._'.,-,v,ilopmtmL of the iot-ential
for uni,:lueness, creativity,
and individuality in each child.
20.
Teachers are not intended to
be psychologists and there-
fore should confine their ef-
forts to teaching subject
matter and academic skills.
21.
Students should be encouraged
to become increasingly involved
in planning and evaluating.
22.
Too much flexibility and
pupil planning in a clais-
room creates feelings of in-
security and confusion.
23.
It is most effective for a
teacher to gain the respect
of his pupils as a close
personal friend.
24.
Teaci.er
should helt each other
evaluate au;proaches, identify
problems or weaknesses and de-
sign methods of correcting the
prcblems.
3
The teacher is most effective
when he or she confines
her
his methods to standard ones
uch as those suggested in cur-
riculum guides which are designed
to be suitable to most children.
Teachers must apply the vrincipies
and theories of social psychology
and child development to most ef-
fectively provide for learning and
socio-emotional needs of each child.
Students may be involved only to
a very limited extent regarding
planning and evaluating; the final
decisions must be those of the
teacher.
Flexibility and spontaneity in a
classroom are vital because such
conditions foster creativity and
enthusiasm.
It is important for a teacher to
demand the respect of his pupils
by maintaining a proper amount of
distance.
Evaluation should be a personal
matter, involving only the
teacher and principal.
Teacher:
-50
TAI SCOR1:';',; SHEET_
School:
Date of Administration: (;rade Teaching:
ITEM SCORE Rigidity I
. Controlling Professional individualism
1 R *
''*
3K *
4r
*
5 *
6K_._
*
7 *
8 *
9K_ *
10 R_*
11 *
17 R *
13 R_ *
14 R *
15 *
16 *
17 R_ *
18 *
19 R *
70 *
21 R *
22 *
23 R. _
*
74 R *
TOTAL
No. Items 24 6 6 6 6
Average
-51-
Appendix II
ITEMS EXCLUDED FROM TAI(See text pp. 13-14.)
1. Teaching is most rewardingbecause of the variety ofindividuals I enjoy workingwith as students.
6. Pupils have it too easy inthe modern school.
10. For effective learning tooccur, the teacher mustfirst establish firm groupcontrol which later may berelaxed somewhat.
14. A teacher should accept asa fact that some learningdifficulties cannot becompletely corrected.
17. The first concern of ateacher should be to gainknowledge of each indi-vidual child as a person.
18. Teachers should not berequired to take classesor to attend workshops;there is enough to doteaching a class.
19. A great amount of flexi-bility is necessary to moti-vate children and teacheffectively.
20. Children are usually more pro-ductive and happier workerswhen the teacher exercisesstrict control.
21. In helping an under- or non-achiever, the teacher mustfirst come to understand theindividual's self-concept andto work towards its positivec:evelopment.
Teaching is most rewardingwhen my class accomplishesgreat gains in subject areas.
Some pupil freedom makes theschool day more productive.
For effective learning tooccur, the teacher must firstfind ways of motivating indi-viduals in her class.
All learning difficulties canbe helped significantly withthe appropriate approaches.
The first concern of a teachershould be to establish andmaintain an efficient organi-zation of time and control ofpupil behavior.
School districts should requireregular professional incrementsthrough classes or workshops ofa high quality provided by thedistrict.
A great amount of regularityand consistency from day today is essential to effectiveteaching.
Children are usually more pro-ductive and happier workerswhen they are exercising con-trol over themselves individu-ally and as a group.
In helping an under- or non-achiever, the teacher mustcarefully plan an approachwhich will correct thedeficiency.
-52-
22. Children at the grade level Iteach need a great deal ofopportunity for self-selectionand self-direction in classroomwork.
23. Assuming you have 30 or morepupils, heterogeneous groupingis definitely best for thechild and probably for theteacher in the long run.
24. Knov.ledge of subject matterand skills in methods of teach-ing it to groups are far moreimportant to successful teachingthan is an understanding ofsocial psychology.
25. Children should be allowed tomake many choices regardingcurriculum or procedures.
26. In-service workshops generallyare a waste of time unlessefficiently organized andclearly structured by strongleaders.
32. It is best to always teach aconcept by employing severaldifferent approaches ratherthan using just one previouslysuccessful method.
36. A teacher cannot be accuratelyevaluated even by the mostcompetent administrators.
Children at the grade level Iteach need well-defined struc-ture and expectations whichmake clear what they shoulddo during each period.
Assuming you have 30 or morepupils, some form of homo-geneous grouping is definitelythe only way a teacher caneffectively teach.
The ability to implement avariety of methods adapted toindividual learning styles ismore important than mastery ofsubject matter for effectiveteaching.
Children are usually not verycapabU? at making choiceseffectively as to work orprocedure.
In-service workshops generallyare a waste of time becausethey are not flexibly plannedso that teachers largelydetermine the content.
It is best to always teacha concept by using one methodthat has been successful andhas produced results.
Teachers need competent helpin evaluating how they canimprove.
-53-
Appendix III
OUTLINE OFTEACHER BEHAVIOR OBSERVATION SCHEDULE
Direction
InitiatesResponse, active
a. Response, on-goingb. Response, new
Response, passivea. Listensh. Watches
Noncommunicative
Object.
Single childSmall groupWhole groupHimself
Publicity
Very publiclyPubliclyPrivately
a. Interaction, object only5. Interaction, intended
for object onlyindeterminate
v,ehavior
Provides informationApproving
a. Simple, approving statementL. Moderate, personalized
reinforcementc. Strong reinforcementd. Noncritical approval
Develops student idea, conceptRecognizes abilities, interestsRecognizes improvementRecognizes effort, encouragementRecognizes feelingsPerognizes individual initiative
a. Expression of acceptanceh. Accepts child's suggestion,
acts on itQuestioning
a. Simpleh. Divergentc. Answers own question
Behavior (continued)
Offers choicesAsks student to develop idea
a. Academic ideasb. Non-academic ideas
Suggests equalitya. Cognitiveb. Affective
Gives directionsa. Explicitb. Cuec. Pupil recall
Controls (toward behavior)a. Minimal cuesb. Moderatec. Strong, but indirect control
Controls, harsh (toward behavior)Controls, corporal (toward behavior)Short criticism (toward performance)
a. Academicb. Simple disapproval, non-
academicCriticism with explanationHarsh criticismEvaluatingTransition behaviorIndeterminate
Content
Subject matterPerformance goalsRoutine proceduresBehavior, negativeBehavior, positivePersonal qualitiesHuman relationsIndeterminate
Atteation
UndividedDivided
Note: The Teacher Behavior Observation Schedule was developed atSCRIa as part of the project in which the TAI was used. A report on the
instrument will appear in Sears, Crist, & Marx (forthcoming). What is
presented here is merely a list of the TBOS categories.
Appt..ndix IV
!,IEANS AND S'rANDARD DFV1ATIONS For TEACHERS GROUPLD
M SCHOOL AND GRAM f.1-!'El.
School and
Grade Level
rigidity
XSD
Controlling
XSi)
Prof.
XSD
Indiv.
XSD
R + C
XSD
P + I
XSD
Total
XSI)
1Int.
17
23.00
4.03
20.12
3.46
24.59
2.21
22.24
3.70
43.12
6.70
46.82
5.00
89.94
10.67
15
24.73
3.22
24.00
4.34
26.13
2.95
24.80
3.86
48.73
6.52
50.93
6.12
99.67
12.01
2 Pri.
12
26.00
3.49
23.33
3.11
24.67
2.93
23.58
2.91
49.33
5.87
48.25
4.98
97.58
10.35
14
24.86
3.55
23.00
3.88
24.79
3.94
22.71
3.62
47.86
6.22
47.50
6.15
95.36
10.90
2 Int.
622.33
2.50
21.00
2.83
26.67
1.37
22.67
4.76
43.33
4.27
49.33
4.97
92.67
8.36
522.40
3.36
22.40
2.19
24.60
2.61
20.40
1.67
44.80
4.02
45.00
3.74
89.80
7.40
3, 4, 5 Pri.
27
25.82
2.50
23.52
3.83
24.48
3.20
23.89
3.79
49.33
5.80
48.37
6.20
97.70
10.61
19
25.10
2.75
24.84
3.10
23.32
3.93
24.32
3.51
49.95
5.29
49.63
6.74
97.58
11.01
3, 4, 5 Int.
24
25.83
2.93
24.96
3.39
26.04
2.79
24.58
3.28
50.70
5.68
50.62
5.42
101.42
10.30
17
25.00
2.98
23.71
4.57
25.24
2.59
22.94
3.49
48.71
6.77
48.18
4.30
96.88
9.88
Administrators
725.86
1.46
26.29
2.81
25.71
6.26
24.29
3.04
52.14
3.85
50.00
8.29
102.14
11.51
427.00
2.58
22.00
6.68
28.25
1.26
27.25
2.75
49.00
9.13
55.50
3.42
104.50
8.81