Embed Size (px)
Citation preview

8/8/2019 Doc1-RadioNetworkPlanning and Engineering
http://slidepdf.com/reader/full/doc1-radionetworkplanning-and-engineering 1/60
1
Radio network planningRadio network planning
andand engineringenginering
Sami TabbaneSami Tabbane
Damascus - Syria, 27-29 July 2009
ITU/BDT Arab Regional Workshop on
“ ICT Applications for Rural Communications”
2
CellularCellular
networksnetworksfundamentalsfundamentals

8/8/2019 Doc1-RadioNetworkPlanning and Engineering
http://slidepdf.com/reader/full/doc1-radionetworkplanning-and-engineering 2/60
2
3
Cellular network fundamentalsCellular network fundamentals
• Main issue: How accommodate the maximum number of
mobile subscribers with a limited resource of bad quality
and out of control?
4
44 propagation basic phenomenaspropagation basic phenomenas
Réflexion Réfraction
Diffraction
DiffusionScattering
ReflectionRefraction
Diffraction

8/8/2019 Doc1-RadioNetworkPlanning and Engineering
http://slidepdf.com/reader/full/doc1-radionetworkplanning-and-engineering 3/60
3
5
3D Rayleigh environment3D Rayleigh environment
6
Cellular architectureCellular architecture
• Frequency reuse:
- More capacity,
- More coverage.
.. < > ^ ... . . .
.. < > ^ ... . . .
.. < > ^ ... . . .
. . .
C I
1
I 2 I 3
f 1
f 1
f 1
f 1
.. < > ^ ... . . .

8/8/2019 Doc1-RadioNetworkPlanning and Engineering
http://slidepdf.com/reader/full/doc1-radionetworkplanning-and-engineering 4/60
4
7
EngineeringEngineering
• Problem:
How to design /tune/optimise the network to:
1. Vehiculate the maximummaximum volume of
traffic,
2. To fullfil the QoS contraintes,3. While minimisingminimising the investments ?
8
Multiple access methodsMultiple access methods
• FDMA and TDMA: Concentration of the interference on
some channels.
• CDMA: interference is
spread over all the channels.
Fréquences
Temps
Codes/Puissance
f
t
f1
.
.
.
fi
f
t
f1
.
.
.
fj
1 2 3 4 5 6 1 2 3 4 5 Trame TDMA
Intervalle de temps ou time slot Time slot
Power/Code
Time slot
Time
Frequencies

8/8/2019 Doc1-RadioNetworkPlanning and Engineering
http://slidepdf.com/reader/full/doc1-radionetworkplanning-and-engineering 5/60
5
9
Cellular systemsCellular systemsspecificitiesspecificities
• Subscribers mobility
management,
• Radio interface management.
10
Mobility managementMobility management
Active mobile (dedicated mode):
Handover
Inactive mobile (idle mode): twoprocesses
Cells selection/re-selection
Location management (roaming).

8/8/2019 Doc1-RadioNetworkPlanning and Engineering
http://slidepdf.com/reader/full/doc1-radionetworkplanning-and-engineering 6/60

8/8/2019 Doc1-RadioNetworkPlanning and Engineering
http://slidepdf.com/reader/full/doc1-radionetworkplanning-and-engineering 7/60
7
13
Frequency reuse (1)Frequency reuse (1) Definition: frequency reuse is the use of the same
radio channels to cover different areas separatedfrom each-others by distances high enough sothat the co-channel interference is not too high.
Mobile
Site C
Site B Site A
.. < > ^ ... . . .
C
I I’
f 1
f 1
f 1
14
Frequency reuseFrequency reuse (2)(2)
Channel
15
Channel
6
Channel
15
SNmin = 9 dB

8/8/2019 Doc1-RadioNetworkPlanning and Engineering
http://slidepdf.com/reader/full/doc1-radionetworkplanning-and-engineering 8/60
8
15
ClusterCluster
1st case: R = 10 km with N = 7 frequencies. 7 simultaneous communications.
2nd case: r = 5 0 0 m
(R/r)2 = 400 therefore 400.1 = 400 simultaneouscommunications.
∆ f5
f1
∆ f2
∆f3∆ f7
∆ f4
Zone A Zone A
R
r
F∆
∆
∆ f6
F =∆ ∆ f1 +∆ f2 +∆ f3 +∆ f4 +∆ f5 + f6 + f7
Cluster
∆ ∆
16
Number of cells per cluster (1)Number of cells per cluster (1) Given a cluster of hexagonal shape.
N : cells number per cluster,
a ( A): cell area (whole cluster),
R: hexagon side.
Distance between two co-cells = D, Radius (side)of the cluster (supposed hexagonal) =(D/2)/cos(π /6) = D/
233
2 Ra =
3
A
D D
= =
°
3 31
23
2
22
230cos

8/8/2019 Doc1-RadioNetworkPlanning and Engineering
http://slidepdf.com/reader/full/doc1-radionetworkplanning-and-engineering 9/60
9
17
Number of cells per clusterNumber of cells per cluster (2)(2)
Thus and: ,a
A N = N D
R=
2
23.
D
R N = 3
C1
(2)C
1
(3)
C1(1)
C1
(6)
C1
(5)
C1
(4) C 1
Cluster
Pôle
Cellule
18
Example: 4/12 and 3/9 size clustersExample: 4/12 and 3/9 size clusters
9 cells cluster: 3 BTSs with 3 sectors per BTS,
12 cells cluster: 4 BTSs with 3 sectors per BTS,
D1
D2D
3
A1
A2A
3
B1
B2B
3
C1
C2C3
A1
A2
A3
B1
B2B
3
C1
C2C
3
Motif 4/12
Motif 3/9

8/8/2019 Doc1-RadioNetworkPlanning and Engineering
http://slidepdf.com/reader/full/doc1-radionetworkplanning-and-engineering 10/60
10
19
Reuse Partitioning Reuse Partitioning
12
34
1' 2'
3'4'
1' 2'
3'4'
1' 2'
3'4'
1' 2'
3'4'
1'
3'
4
5 41 2
1 2
3
7
6
6
6
57
57
3
3
1, 2, 3, 4, 5, 6, 7 : Cellules du motif à 7 (1)
1', 2', 3', 4' : Cellules du motif à 4 (2)
20
Reuse cluster: TDMA/FDMA andReuse cluster: TDMA/FDMA and
CDMACDMA
frequencyfrequencyfrequencyfrequency
TDMATDMA DSDS--CDMACDMA

8/8/2019 Doc1-RadioNetworkPlanning and Engineering
http://slidepdf.com/reader/full/doc1-radionetworkplanning-and-engineering 11/60
11
21
CDMA reuse cluster: multipleCDMA reuse cluster: multiple
access interferenceaccess interference
TDMATDMA DSDS--CDMACDMA
Downlink Downlink
22
D/R and C/I relationshipD/R and C/I relationship
q = D/R: co-channel reuse ratio.
High q low potential interference level.
q co-channel interference .
D: function of K I
(nbr of co-channel cells in the
first ring) and of C/I .
with C proportional to R-γ and
I proportional to D-γ .
C
I
C
k k
I I K
=
=
∑1
( )
C
I
R
Dk k k
I K
k q I K
= =
−
−
=
−
=
∑ ∑
γ
γ γ
1 1
1

8/8/2019 Doc1-RadioNetworkPlanning and Engineering
http://slidepdf.com/reader/full/doc1-radionetworkplanning-and-engineering 12/60
12
23
The cellThe cell
Geographic area which limits aredetermined by:
1. The transmitted power and the receiverssensibility,
2. C/I ratio fixed by the system,
3. Capacity to managed the maximumnumber of communications on theallocated are with the required QoS,
4. Integration of the cell in its environment
24
Relations between cellsRelations between cells
Service area
Cross-coverage
Co-channel interference

8/8/2019 Doc1-RadioNetworkPlanning and Engineering
http://slidepdf.com/reader/full/doc1-radionetworkplanning-and-engineering 13/60
13
25
1. UMTS main1. UMTS main
proceduresprocedures
UMTS Radio Functionalities (1)UMTS Radio Functionalities (1)
The UE scans all RF channels in
WCDMA and searches for the
strongest cell signal on each
carrier.
The UE displays those PLMNs
that are allowed as well as those
that are not allowed based on the
strongest signal cell on each
frequency.
The user can select a PLMN
manually from the list
2. Manual mode
3.
1.
f1
f2
•
•
fn
Strongest cell
0 .2 0 .4 0 .6 0 .8 1 1 .2 1 .4 1 .6 1 .8x107
-40
-20
0
20
40
60
80
Frequency
P o w e r S p e c t r u m M a g n i t u d e ( d B )
PLMN APLMN BPLMN DPLMN E
2.
Idle mode: PLMN selection
26

8/8/2019 Doc1-RadioNetworkPlanning and Engineering
http://slidepdf.com/reader/full/doc1-radionetworkplanning-and-engineering 14/60
14
Initiate Cell Synchronization
P-CCPCH
(PSC + SSC + BCH)
UE monitors Primary SCH code, detects peak in matched filter output
Slot Synchronization Determined ------>
UE monitors Secondary SCH code, detects SCG and frame start time offset
Frame Synchronization and Code Group Determined ------>
UE determines Scrambling Code by correlating all possible codes in group
Scrambling Code Determined ------>
UE monitors and decodes BCH data
BCH data, Super-frame synchronization determined ------>
UE adjusts transmit timing to match timing of BS + 1.5 Chips
Cell Synchronization complete
Idle mode: search process
Idle mode behavior: Cell search procedure27
UMTS Radio Functionalities (2)UMTS Radio Functionalities (2)
Squal = Qqualmeas- qQualMin > 0
Srxlev = Qrxlevmeas – qRxLevMin – Pcompensation > 0
Where Pcompensation = max(maxTxPowerul – P;0)
qQualmin: sent in the broadcast information and indicates the
minimum required quality value. The UE measures the received
quality, “Qqualmeas”; on the CPICH (CPICH Ec/N0) and
calculates Squal.
qRxLevMin: sent in the system information and indicates the
minimum required signal strength. The UE measures the received
signal Code Power (CPICH RSCP) and obtains Srxlev
Cell selection process
28
UMTS Radio Functionalities (3)UMTS Radio Functionalities (3)

8/8/2019 Doc1-RadioNetworkPlanning and Engineering
http://slidepdf.com/reader/full/doc1-radionetworkplanning-and-engineering 15/60
15
• Qqualmeas
• Qrxlevmeas P-CCPCH
CPICH
• qQualmin
• qRxLevMin
• maxPowerul
maxTxPowerful: the maximum transmission power during
random access on the RACH. Value sent in the system
information.
P: the UE maximum output power according to its class
Cell selection process
Idle mode behavior: Cell selection process 29
UMTS Radio Functionalities (4)UMTS Radio Functionalities (4)
S q u a l > 0 ( on l y W C D M A c e lls )
S rx le v > 0
In order to always camp on the best cell the UE performs the cell
reselection procedure in the following cases:
When the cell on which it is camping is no longer suitable.
When the UE, in “camped normally” state, has found a better
neighboring cell than the cell on which it is camping.
When the UE is in limited service state on an acceptable cell.
When the UE triggers a cell reselection evaluation process, it
performs ranking of cells that fulfill the following criteria:
Cell reselection process
30
UMTS Radio Functionalities (5)UMTS Radio Functionalities (5)

8/8/2019 Doc1-RadioNetworkPlanning and Engineering
http://slidepdf.com/reader/full/doc1-radionetworkplanning-and-engineering 16/60
16
Cells are ranked according to the R criteria:
R(serving) =Qmeas(s) + qHyst(s)
R(neighbor) = Qmeas(n) - qoffset(s,n)
Qmeas is the quality value of the received signal.
Qmeas may be derived from the averaged CPICH Ec/No or
CPICH RSCP for WCDMA cells.
Qmeas uses the averaged received signal level for GSM cells.
CPICH RSCP is always used as a measurement quantity when
WCDMA cells are compared with GSM cells. 31
Cell reselection process
UMTS Radio Functionalities (6)UMTS Radio Functionalities (6)
Qmeas(n)
Qmeas(s)
qoffset(s)
qHyst(s)
R(s)
R(n)
treSelection
Cell reselection
time
Quality
Idle mode behavior: Cell reselection procedure
32
Cell reselection process
UMTS Radio Functionalities (7)UMTS Radio Functionalities (7)

8/8/2019 Doc1-RadioNetworkPlanning and Engineering
http://slidepdf.com/reader/full/doc1-radionetworkplanning-and-engineering 17/60
17
Cell reselection criteria are used for intra-frequency, inter-frequency
and inter-RAT cells.
Decision on when measurements on intra-frequencies should be
performed is made using the parameter sIntraSearch in relation to
Squal.
If Squal > sIntraSearch the UE does not need to perform
intrafrequency measurements.
If Squal ≤ sIntraSearch the UE performs intrafrequencymeasurements.
If the sIntraSearch is not sent to the serving cell, the UEperforms intrafrequency measurements.
33
Cell reselection process
UMTS Radio Functionalities (8)UMTS Radio Functionalities (8)
The decision on when measurements on GSM frequencies should
be performed is made using the parameter sRATSearch.
If Squal > sRATSearch the UE does not need to performmeasurements on GSM cells.
If Squal ≤ sRATSearch the UE performs measurements onGSM cells.
If sRATSearch is not sent for the serving cell, the UE performsmeasurements on GSM cells.
34
Cell reselection process
UMTS Radio Functionalities (9)UMTS Radio Functionalities (9)

8/8/2019 Doc1-RadioNetworkPlanning and Engineering
http://slidepdf.com/reader/full/doc1-radionetworkplanning-and-engineering 18/60
18
The UE is also supposed to be able to measure on inter-
frequency cells. The decision on when measurements on inter-
frequencies should be performed is made using the parameter
sInterSearch in relation to Squal.
If Squal > sInterSearch the UE does not need to perform
interfrequency measurements.
If Squal ≤ sInterSearch the UE performs interfrequencymeasurements.
If the sInterSearch is not sent for the serving cell, the UE
performs interfrequency measurements.
35
Cell reselection process
UMTS Radio Functionalities (10)UMTS Radio Functionalities (10)
Frame withPI Indicator
Associated
S-CCPCH frame• • •
• • • • • •
• • •
PICH
S-CCPCH
τPICH= 2ms = 3 TS
When the UE is in Idle mode, two different physical channels are
used in order to deliver proper information from the WCDMA
RAN to the UE: the PICH and the S-CCPCH (carries the PCH).
The PICH is used to indicate to the UE when it should read the S-
CCPCH and the PCH is used to carry the RRC message “pagingtype 1”, which contains the actual paging information
Idle mode: Paging
36
UMTS Radio Functionalities (11)UMTS Radio Functionalities (11)

8/8/2019 Doc1-RadioNetworkPlanning and Engineering
http://slidepdf.com/reader/full/doc1-radionetworkplanning-and-engineering 19/60
19
MasterInformation
Block
SystemInformation
Block 1
SystemInformation
Block 2
SystemInformation
Block 3
The System Information elements are broadcast in System
Information Blocks (SIBs). A SIB groups together System
Information elements related to the same kind of activity controls.
Different types of SIB exist, and each type contains a specific
collection of information.
A Master Information Block (MIB) gives reference to a number of
SIBs.
Idle mode behavior: system information grouping
System information
37
UMTS Radio Functionalities (12)UMTS Radio Functionalities (12)
x
SIB12
x
x
SIB11
x
MIB
x
x
x
SIB1
x
SIB3
x
SIB5
Location and routingupdating
xPower Control oncommon channel
Timers and counters inIdle mode
Cell and commonchannel configuration
Measurementmanagement
Paging parameters
Cell selection andreselection parameters
PLMN Identity
SIB7Contents
Idle mode behavior: system information details 38
System information
UMTS Radio Functionalities (13)UMTS Radio Functionalities (13)

8/8/2019 Doc1-RadioNetworkPlanning and Engineering
http://slidepdf.com/reader/full/doc1-radionetworkplanning-and-engineering 20/60
20
39
RRM algorithms implementationRRM algorithms implementation
- Power control
- Quality measurements
- Measurement report
- Packet scheduling
- Load control
- Fast power control
- Rate adaptation
- H-ARQ, MIMO
- Admission control
- Load control- HO control
- Outer loop power
control
UEUE Node BNode B RNCRNC
4 types of HO:
Soft handover : between 2 (or more) cells in two
different sites
Softer handover : between 2 cells belonging to same site
Inter-frequency handover : between 2 WCDMA
frequencies
IRAT handover : GSM UMTS or UMTS GSM
40
Handover
UMTS Radio Functionalities (14)UMTS Radio Functionalities (14)

8/8/2019 Doc1-RadioNetworkPlanning and Engineering
http://slidepdf.com/reader/full/doc1-radionetworkplanning-and-engineering 21/60
21
SRNC CNGood block
Block in error
Decrease BLER = Increase the end user perceived throughput:
Rp = (1-BLER)*R
41
Soft Handover
UMTS Radio Functionalities (15)UMTS Radio Functionalities (15)
RBS
Sector 2
Sector 1
Handover: softer handover
42
Softer Handover
UMTS Radio Functionalities (16)UMTS Radio Functionalities (16)

8/8/2019 Doc1-RadioNetworkPlanning and Engineering
http://slidepdf.com/reader/full/doc1-radionetworkplanning-and-engineering 22/60
22
Content Description
Measurement type Intra-frequency, inter-frequency or IRAT HO
Measurement Identity number To reference measurement reports in UL
Measurement command Setup, modify or release
Measurement objects Measured cells (GSM + UMTS)
Measurement quantity CPICH RSCP or Ec/N0
Measurement reporting criteriaThe triggering for measurement report (event
1a ….)
Measurement reporting mode Use acknowledge or unacknowledged mode
43
Softer Handover process
UMTS Radio Functionalities (17)UMTS Radio Functionalities (17)
From the UE point of view, the WCDMA cells are divided into Active,
Monitored , and Detected Sets.
i. The Active Set : The radio links involved in the handover
ii. The Monitored Set : The neighbors of the Active Set cells, areexplicitly measured for handover (can contain both intra-frequency
and GSM neighboring cells).
iii. The Detected Set : The UE is also required to detect intra-frequency
cells that are not in the Active or Monitored Sets
The active set size is configured by operator using
“maxActiveSet” parameter (from 2 4 cells) 44
Softer Handover process
UMTS Radio Functionalities (18)UMTS Radio Functionalities (18)
8/8/2019 Doc1-RadioNetworkPlanning and Engineering
http://slidepdf.com/reader/full/doc1-radionetworkplanning-and-engineering 23/60
23
reportingRange1a
Measurement
quantity
time
P_CPICH best cell
Reportingevent 1b
reportingRange1b
Reportingevent 1a
P_CPICH 2
Soft HO procedure: Add / remove of radio link45
Softer Handover process
UMTS Radio Functionalities (19)UMTS Radio Functionalities (19)
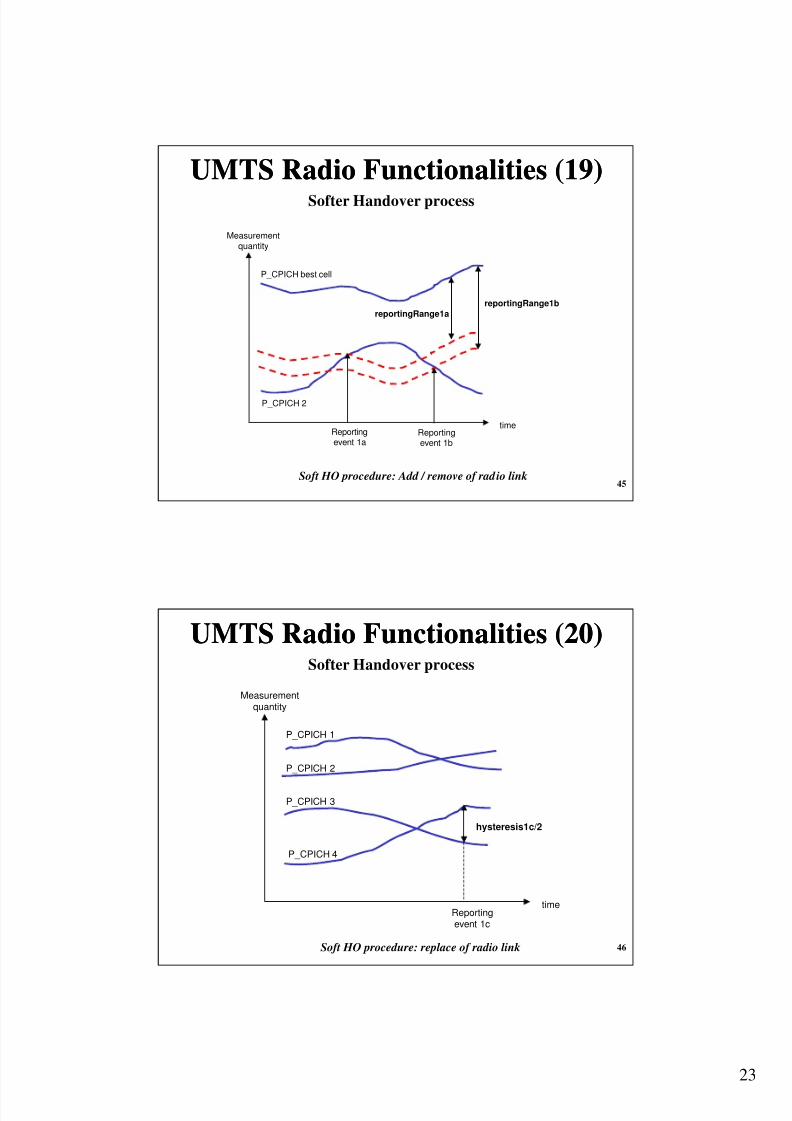
hysteresis1c/2
Measurementquantity
time
P_CPICH 1
Reportingevent 1c
P_CPICH 2
P_CPICH 3
P_CPICH 4
Soft HO procedure: replace of radio link 46
Softer Handover process
UMTS Radio Functionalities (20)UMTS Radio Functionalities (20)

8/8/2019 Doc1-RadioNetworkPlanning and Engineering
http://slidepdf.com/reader/full/doc1-radionetworkplanning-and-engineering 24/60
24
hysteresis1d/2
Measurement
quantity
time
P_CPICH 1
Reportingevent 1d
P_CPICH 2
P_CPICH 3
Soft HO procedure: change of the best cell 47
Softer Handover process
UMTS Radio Functionalities (21)UMTS Radio Functionalities (21)
MeasurementQuantity
(Ec/No and RSSI)
UMTS Cell
GSM Cell
usedFreqTresh2f
usedFreqTresh2dhysteresis2d/2
hysteresis2f/2
hysteresis2d/2
utranTresh3a
gsmTresh3ahysteresis3a/2
hysteresis3a/2
Reporting
event 2d
Reporting
event 2dReporting
event 2f
Reporting
event 3a
Start measurement on
GSM cells
Stop measurement on
GSM cells
Perform HO to GSM
cell
IRAT handover: thresholds and hysteresis 48
IRAT Handover
UMTS Radio Functionalities (22)UMTS Radio Functionalities (22)

8/8/2019 Doc1-RadioNetworkPlanning and Engineering
http://slidepdf.com/reader/full/doc1-radionetworkplanning-and-engineering 25/60
25
1…………1
5
1 2 3 4 12 13 1………..1514 15Gap of 7 slots
Normal frame (SF =16) Normal frame (SF=16)Compressed frame (SF = 8)
UE performs measurement on other frequencies
(IF or IRAT handover) RBS Total
power
RNC CPU
load
38 dbm 41 dbm 38 dbm
60 % 65 % 60 %
Lost codes = 16 codes of SF = 256
IRAT handover: compressed mode algorithm
49
Compressed mode
UMTS Radio Functionalities (23)UMTS Radio Functionalities (23)
UE RBS RNC MSC BSS
Measurement report
Compressed mode control
Measurement control
Measurement report
Evaluation of MR
Evaluation of MRRelocation required
Relocation command
GSM: HO request
GSM: HO ack Handover from UTRAN command
GSM: HO access + HO complete
GSM: HO completeIu connection release
RRC release
50
IRAT Handover process
UMTS Radio Functionalities (24)UMTS Radio Functionalities (24)

8/8/2019 Doc1-RadioNetworkPlanning and Engineering
http://slidepdf.com/reader/full/doc1-radionetworkplanning-and-engineering 26/60
26
IRAT HO: from WCDMA to GSM (CS mode)
IRAT CC : IRAT Cell Change is from WCDMA to GPRS (PS mode)
The only difference is that in IRAT HO, the RRC connection remains
between UE and WCDMA RAN (also Iu connection) until receiving
a successful HO message from BSS (to RNC)
In case of a HO failure (WCDMA GSM) UE may return to
WCDMA system.
However, in IRATCC, the Iu connection (also RRC) would be
released since the send of “Cell change order message “ from SRNC
(include GSM cell details)
UE will not be ever connected to WCDMA system51
IRAT HO Cell Change
UMTS Radio Functionalities (25)UMTS Radio Functionalities (25)
UE RBS RNC MSC BSS
Measurement report
Compressed mode control
Measurement control
Measurement report
Evaluation of MR
Evaluation of MR
Cell change order from WCDMA RAN
GSM RA update
RRC release
Stop DL transmissionIu release command
Iu release complete
52
IRAT Handover process
UMTS Radio Functionalities (26)UMTS Radio Functionalities (26)

8/8/2019 Doc1-RadioNetworkPlanning and Engineering
http://slidepdf.com/reader/full/doc1-radionetworkplanning-and-engineering 27/60
27
Algorithm for IRATCC to WCDMA controlled by the network via
parameters FDDQMIN and FDDQOFF
MeasurementQuantity
FDDQMIN
FDDQOFF
CPICH Ec/No
GSM RLA
CPICH RSCP
t
5 seconds
IRATCC toWCDMA
CPICH Ec/No> FDDQMIN CPICH RSCP >
GSM RLA+ FDDQOFF
IRAT CC GPRS UMTS
IRAT Cell Change: GPRS to WCDMA53
UMTS Radio Functionalities (27)UMTS Radio Functionalities (27)
o FDDQMIN is the minimum quality of a WCDMA cell for cell
reselection.
It provides a sufficient quality of the candidate WCDMA cell.
o FDDQOFF is the key parameter to control the behavior of the
IRATCC.
It defines an offset between signal quality of WCDMA and GSM
cells.
CPICH E c /N o > FDDQMIN
&
CPICH RSCP > RLA (serving +neighboring GSM cells) + FDDQOFF
(period time of 5 seconds)
RLA ( Received Level Average): average of the received signal levels
measured in dBm for all monitored GSM frequencies in the BA list
IRAT CC GPRS UMTS
54
UMTS Radio Functionalities (28)UMTS Radio Functionalities (28)

8/8/2019 Doc1-RadioNetworkPlanning and Engineering
http://slidepdf.com/reader/full/doc1-radionetworkplanning-and-engineering 28/60
28
o Percentage of idle TCH in the serving cell ≤ ISHOLEV
o CPICH Ec/No > MRSL
Filtering
Allocation reply
Inter System Handoveralgorithm
ISHOLEV = 20 %
Organizing the list
Urgency condition
Basic ranking
Radio Network functions
evaluations
Sending the list
WCDMA Cellmeasurement
Traffic load
TTTTSTB
% idle TS: 1/6 ≈ 16, 7%
Add WCDMA cell
to candidate list
% idle TS
≤ ISHOLEV
Ec/No
> MRSL
IRAT HO GSM UMTS
IRAT Handover: GSM to WCDMA55
UMTS Radio Functionalities (29)UMTS Radio Functionalities (29)
RBS
1: Ensure that Eb>Ebmin
2: Modify Ebmin to ensure that BLER < BLERmaxRNC
UEPower control frequency = 1500 per second (at each TS)
Power Control
Power Control: Inner & Outer loop power control 56
UMTS Radio Functionalities (30)UMTS Radio Functionalities (30)

8/8/2019 Doc1-RadioNetworkPlanning and Engineering
http://slidepdf.com/reader/full/doc1-radionetworkplanning-and-engineering 29/60
29
Admission control: controls system load to maintain a sufficient
resources for urgent requirements and an acceptable service quality
for connected users .
It’s based on following inputs:
Downlink transmit carrier power
Air-interface Speech Equivalent (ASE) usage in uplink and
downlink Spreading Factor usage
Code tree usage
Number of Compressed Mode radio links
Admission Control
57
UMTS Radio Functionalities (31)UMTS Radio Functionalities (31)
speech)factor(activity
link)radiofactor(activity
speech)link radio(maxrate
link)radio(maxrate⋅= ASE
ASE of a radio link = relative value, defined as the air-
interface load relative to a speech radio link (12.2kbps,
50% activity).
A radio link with an ASE of 3 in DL, is expected togenerate as much interference in downlink as 3 speech
radio links in the cell.
General method of estimating ASE value for a specific
service:
58
Admission Control
UMTS Radio Functionalities (32)UMTS Radio Functionalities (32)

8/8/2019 Doc1-RadioNetworkPlanning and Engineering
http://slidepdf.com/reader/full/doc1-radionetworkplanning-and-engineering 30/60
30
ASE value for AMR: not equal to one due to the control
signaling (3.4 kbps) which contributes with 0.6 ASE
Admission control: ASE for different RABs
59
Admission Control
UMTS Radio Functionalities (33)UMTS Radio Functionalities (33)
DL transmit carrier power : to keep sufficient power for UE’s in
CM or experiencing a poor service quality due to fading
SF usage: Provides details about the number of codes of a certain
length that are in use. Limit the number of users of a certain SF. Code tree usage: Provides a measure for code tree usage in the
downlink. Monitoring of this dedicated resource based on the
tracking of the fraction on the downlink code tree in use
Compressed mode radio links: Indication of the processor load
that the Compressed mode radio links causes in the RBS. Important
due to hardware limitations in the RBS
60
Admission Control
UMTS Radio Functionalities (34)UMTS Radio Functionalities (34)

8/8/2019 Doc1-RadioNetworkPlanning and Engineering
http://slidepdf.com/reader/full/doc1-radionetworkplanning-and-engineering 31/60
31
Resource request Is admission blockedby Congestion Control?Is admission blocked
by Congestion Control?
Yes,thenblock
Check if the requestedASE UL + estimated ASE UL
>aseUlAdm
Check if the requestedASE UL + estimated ASE UL
>aseUlAdm
No
Yes,thenblock
Check if the requestedDL Pwr + estimated Pwr
>pwrAdm
Check if the requestedDL Pwr + estimated Pwr
>pwrAdm
No
Yes, then block
Check if the requested +estimated # compressed mode RL
>compModeAdm
Check if the requested +estimated # compressed mode RL
>compModeAdm
No
Yes,thenblock
No, thenaccept
Check if the requestedASE DL + estimated DL ASE
>aseDlAdm
Check if the requestedASE DL + estimated DL ASE
>aseDlAdm
No
Yes,thenblock
Yes,then
block
Check if the requestedcode usage + estimated code usage
>
dLCodeAdm
Check if the requestedcode usage + estimated code usage
>dLCodeAdm
No
No
Yes,thenblock
Check if the requestedDL SF + estimated DL SF
>sfXAdm *
Check if the requestedDL SF + estimated DL SF
>sfXAdm *
Only checked if
BE-service requests
* X = 8 or X = 32
Admission control workflow61
Admission Control
UMTS Radio Functionalities (35)UMTS Radio Functionalities (35)
Main goal of the Congestion Control function = provide the ability to
solve overload situations.
Overloads occur due to a natural process caused by fluctuations in the
downlink power. Factors like fading, inter-cell interference, and
variations in the traffic on individual connections can cause thesefluctuations.
Congestion Control is triggered only in the case of (near) overload in
a cell
Congestion control based on 3 consecutive steps:
1. Restricts admission
2. Delay packet transmission, by reducing the packet bit rate
3. If this does not solve the congested situation, it releases radio links
until congestion ceases 62
Congestion Control
UMTS Radio Functionalities (36)UMTS Radio Functionalities (36)

8/8/2019 Doc1-RadioNetworkPlanning and Engineering
http://slidepdf.com/reader/full/doc1-radionetworkplanning-and-engineering 32/60
32
Time
DL Power
pwrAdm +pwrAdmOffset
= pwrHyst
75ms 100ms
= tmCongAction
StartreleaseAseDl
StartreleaseAseDl
100ms
= pwrHyst
pwrOffset
StoppreleaseAseDl
< pwrHyst
200ms
Congestion Congestionsolved
Congestion control handling 63
Congestion Control
UMTS Radio Functionalities (39)UMTS Radio Functionalities (39)
Core Network
SRNC&
DRNC
Iu
Iur
over Iur:
SRNC
Iu
over Iu:
1. Best Effort users in HOBest Effort users
3. CS users in HOCS users
5. Speech users in HOSpeech users
2. Best Effort users in HOBest Effort users
4. CS users in HOCS users
6. Speech users in HOSpeech users
Congestion control: ASE release order 64
Congestion Control
UMTS Radio Functionalities (40)UMTS Radio Functionalities (40)

8/8/2019 Doc1-RadioNetworkPlanning and Engineering
http://slidepdf.com/reader/full/doc1-radionetworkplanning-and-engineering 33/60
33
2. UMTS2. UMTS
CHANNELSCHANNELS
65
66
Codes, physical and logical channels (1)Codes, physical and logical channels (1)
2 spreading codes used in UMTS:
– Channelisation codes: derived from the OVSF
(Orthogonal Variable Spreading Factor ) tree. Vary
the spreading factor to keep codes orthogonality.
In the same cell: OVSF codes can not be all used
together.
– Scrambling codes: each cell has its own code.
Allow to differentiate neighboring cells. Chosen
among 512 (reuse pattern = 512). For the mobiles:
224 different codes. Random allocation.

8/8/2019 Doc1-RadioNetworkPlanning and Engineering
http://slidepdf.com/reader/full/doc1-radionetworkplanning-and-engineering 34/60

8/8/2019 Doc1-RadioNetworkPlanning and Engineering
http://slidepdf.com/reader/full/doc1-radionetworkplanning-and-engineering 35/60

8/8/2019 Doc1-RadioNetworkPlanning and Engineering
http://slidepdf.com/reader/full/doc1-radionetworkplanning-and-engineering 36/60
36
71
WCDMA systems specificities (1)WCDMA systems specificities (1)
• Main features and constraints:− Node B power: shared among the N connected mobiles,
− Noise maximum power: 10 dB,
− Transmission power: between 6 and 10 dB,
− Transmission power on each level: depends on propagationconditions and activated service,
− Mobiles distribution in the cell: if the mobiles are close to theNode B, capacity can be up to 10 times that of when the mobileare far from the Node B,
− Cell breathing: access management achieved by call admission
control based on the noise rise and load control,
− Power control is fundamental for the UL: outer loop to adjustthe target power according to the BER estimation and fast power control against fast fading. Fast power control continuoustransmission on the radio interface, packet transmission at layer 2.
72
Relation between power and service bitrate
Pr
Voice service
Pr
Email service
Pr Video service
Pe
Power
level of the
signals
received by
the mobiles
Power transmitted by
the Node B
WCDMA systems specificities (2)WCDMA systems specificities (2)

8/8/2019 Doc1-RadioNetworkPlanning and Engineering
http://slidepdf.com/reader/full/doc1-radionetworkplanning-and-engineering 37/60
37
73
3. UMTS networks3. UMTS networks
planningplanning processprocess
74
UMTS planning processUMTS planning processMultiservice
offered traffic
Traffic analysis
WCDMA link budget
Cell number
Required channel number for theconsidered configuration
Maximum cell range
Number of carriers per cell

8/8/2019 Doc1-RadioNetworkPlanning and Engineering
http://slidepdf.com/reader/full/doc1-radionetworkplanning-and-engineering 38/60
38
Nominal PlanningNominal PlanningNominal PlanningNominal Planning Based on the result of network dimension, preliminary design
present Information of theoretical sites including following:
Site coordinates.
Engineering parameters such as Antenna height, azimuths and tilts.
Radio parameters such as scrambling code ,transmit power of
different channels , etc.
75
• Simulation
– Unlike GSM network, in CDMA coverage and capacity are too inter-
related to be predicted accurately. Monte Carlo simulation is used to
evaluate the performance of a radio network.
– Monte Carlo is a static simulation
During Monte Carlo simulation, the performance of the network is analyzed over
various instances in time (snapshot), where UEs are in statistically determined
places with the given traffic model. The ability of each terminal to make its
connection to the network is calculated through an iterative process.
WCDMA simulationWCDMA simulation

8/8/2019 Doc1-RadioNetworkPlanning and Engineering
http://slidepdf.com/reader/full/doc1-radionetworkplanning-and-engineering 39/60
39
SetupSetup
networknetwork
DesignDesign
Run PilotRun Pilot
FieldField
StrengthStrength
PredictionPrediction
PilotPilot
LevelLevel
OK?OK?
RunRun
UMTSUMTS
TrafficTraffic
simulationsimulation
Make predictionsMake predictions
(Services)(Services)
PerformancePerformance
RequirementsRequirements
Fulfilled?Fulfilled?
NeighborsNeighbors
planning&planning&
Scrambling codeScrambling code
allocationallocation
RNP Input &RNP Input &
EquipmentEquipment
configurationconfiguration
NeighborhoodNeighborhood
planning criteriaplanning criteria
Scrambling codeScrambling code
allocation criteriaallocation criteria
OutputOutput
parametersparameters
YESYES
NONO
YESYES
NONO
Traffic modelTraffic model
& forecast& forecast
Simulation flowSimulation flow--chartchart
77
Simulation outputSimulation output
• Simulation output:– Pilot coverage (Ec, Ec/Io) in the
target areas
– Best server plot
– Coverage probability distribution of each service
– Access failure distribution andstatistic of each service
– Continuous coverage areas of eachservice
– Cell load distribution of downlink and uplink
– Pilot pollution distribution
– Soft handover areas statistic of eachservice

8/8/2019 Doc1-RadioNetworkPlanning and Engineering
http://slidepdf.com/reader/full/doc1-radionetworkplanning-and-engineering 40/60
40
• For each theoretical site, a physical site will be acquired in this phase
through following steps:
Define search areas
Site ranking
Identify candidate sites
Site acquisition
Site SurveySite Survey
A suitable physical site
Give adequate radio coverage.
Have connectivity into the transmission network.
Be politically acceptable to the local community.
Have power nearby, good access and a co-operative owner.
A3rd
D1st
C2nd B - Unsuitable
79
Verification by system simulationVerification by system simulation
• It is an iterative process to
verify the final design until all
the requirements are fulfilled
Coverage prediction
RNP
Planning
results
Are requirements
Fulfilled?
Traffic distributionSystem simulation
80

8/8/2019 Doc1-RadioNetworkPlanning and Engineering
http://slidepdf.com/reader/full/doc1-radionetworkplanning-and-engineering 41/60
41
81
4. CDMA link4. CDMA link
budgetbudget
UL dimensioningUL dimensioning
Lpmax = PUE – SRBS – BIUL - Bpc - BLNF - LBL - LBPL - LJ + Ga
BIUL = 10*Log ( )1
1 - QUL
QUL = M ((for 1 cell) / Mpole
QUL = M / (3 *N *Mpole) N1 =3* Mpole * QUL
MCapacity
Lpmax = a + b*log(R)
Sc (cell area) = 9/8√3 * R2 N2 =
S (total area )
Sc (cell area)Coverage
82

8/8/2019 Doc1-RadioNetworkPlanning and Engineering
http://slidepdf.com/reader/full/doc1-radionetworkplanning-and-engineering 42/60
42
DL dimensioningDL dimensioning
Lsa = Lpmax + Bpc + BLNF +LBL + LBPL + LJ - Ga
Ptot =
PCCH + H *
Lsa 1 - QDL
Lpmax = Ptot – SUE – BIDL - Bpc - BLNF - LBL - LBPL - LJ + Ga
Lsa = Ptot – SUE – BIDL
BIDL = 1 + K *Ptot
Lsa
1
2
3
4
1
3 4
2
?
83
84
Link budgetLink budget
First dimensioning realized according to
the coverage: compute cell size for the
most constraining services.
- Uplink : MAPL, cell size determination,
- Downlink : Link budget balancing to
determine the BS power. BS power shared
by all the channels (common and traffic).

8/8/2019 Doc1-RadioNetworkPlanning and Engineering
http://slidepdf.com/reader/full/doc1-radionetworkplanning-and-engineering 43/60
43
85
NodeNode B transmission powerB transmission power
- 37 dBm (5 W): low capacity and extended
coverage,
- 40 dBm (10 W): good coverage and medium
capacity,
- 43 dBm (20 W): good coverage and large
capacity per carrier,
- 46 dBm (40 W): large capacity and wide
coverage.
86
Power classesPower classes
EIRP (dBm)
Node BUE Macro Micro Pico
[40, 43] [30, 43] [20, 43] [10, 33]

8/8/2019 Doc1-RadioNetworkPlanning and Engineering
http://slidepdf.com/reader/full/doc1-radionetworkplanning-and-engineering 44/60

8/8/2019 Doc1-RadioNetworkPlanning and Engineering
http://slidepdf.com/reader/full/doc1-radionetworkplanning-and-engineering 45/60
45
89
L p (dB) = Pt (dBm) + Gt (dBi) – Pr (dBm) + Gr (dBi)
= EIRP (dBm) – Pr (dBm) + Gr (dBi)
EIRP depends on the UL or DL.
UL/DL link budgetUL/DL link budget
Uplink (UL) Downlink (DL)
EIRP (dBm) =
PTx (dBm) – Lu (dB) + Gt (dBi)
EIRP (dBm) =
PTx (dBm) – Lc (dB) + Gt (dBi)
PTx: transmission power,
Gt : antenna gain, Lu: body loss (voice: [3, 10],
data: [0, 3]).
PTx: transmission power,
Gt : antenna gain, Lc: feeder losses.
90
Noise rise versus number of subscribers per cell
Link Budget parameters (3)Link Budget parameters (3)
0
2
4
6
8
10
12
0 10 20 30 40 50 60
Nombre d'abonnés / cellule
N o i s e R i s e
( d B )
Number of subscribers per cell

8/8/2019 Doc1-RadioNetworkPlanning and Engineering
http://slidepdf.com/reader/full/doc1-radionetworkplanning-and-engineering 46/60
46
91
Planning/Dimensioning of thePlanning/Dimensioning of the
cell for the ULcell for the UL
RTraffic assumptions
Code/channel number required for the maximum estimated traffic
Noise rise value (statistical approach based on a mix traffic)
Link budget computation (Uplink)
MAPL computation
R’: Maximum radius of the cell determined with a propagation model
- If R’ > R and Noise Rise < Max( Noise Rise) => New iteration with R’’> R
- Otherwise, add capacity (new carrier or new station) and repeat with new configuration
92
DL analysis (1)DL analysis (1)
(a) Area of radius R.
(b) Traffic models Mean potential traffic in the area.
(c) Estimated traffic Compute the number of required
channels.
(d) For each user, estimate the required power for each link.(e) Distribution of users in the cell and soft handover or not
compute BS power transmission.
(f) Link budget established to determine the MAPL in the
cell.
(g) The process repeats in (a) until BS power value is lower
or equal to its maximum power.

8/8/2019 Doc1-RadioNetworkPlanning and Engineering
http://slidepdf.com/reader/full/doc1-radionetworkplanning-and-engineering 47/60
47
93
Steps:− BS total power = summ of the powers of all the
established links taking into account the mobilessensitivities and propagation losses (estimated with apropagation model). Additional power for controlchannels. If no BS power is above its maximumpower, no link is deleted and the CIR value iscomputed for each mobile.
− After determination of total BS power: distributionof the power among the various channels (pilotchannel, synchronisation channel, traffic channel).
Simulations stop: Most used criterium: powerfluctuations.
DL analysis (2)DL analysis (2)
94
UL power budget (example for 144 kb/s data service)UL power budget (example for 144 kb/s data service)
Value Formula
Transmitter
P: MS Tx Power (dBm) 23
MAG: MS TxAntenna Gain (dBi) 0
BL: Body Loss (dB) 3
PIRE: MS EIRP (dBm) 20 EIRP= P+MAG-BL
Receiver
FM: Fade Margin (dB) 5,4 FM = 0,675*SD (RC=90%, SD=8dB)
IM: Interference Margin (dB) 3 IM = 10log(1/1-loading)
PL: Pathloss (dB) 0 Dense Urban = 20 dB
BAG: BTS Antenna Gain (dBi) 16
BCL: BTS Cable Loss (dB) 3
SHG: Soft HO Gain (dB) 2
TM: Total Margin (dB) -6,6 TM=FM+IM+PL-BAG+BCL-SHG
S: BTS Rx Sensitivity (dBm) -115
UL_PL: UpLink Path Loss (dB) 141,6 UP_PL = EIRP-TM-S

8/8/2019 Doc1-RadioNetworkPlanning and Engineering
http://slidepdf.com/reader/full/doc1-radionetworkplanning-and-engineering 48/60
48
95
DLDL linklink budgetbudgetValue Formula
Transmitter
P: BTS Tx Power (dBm) 29 Power allocated to the pilot channel
BAG: BTS Tx Antenna Gain (dBi) 16
BCL: BTS Cable Loss (dB) 3
PIRE: BTS EIRP (dBm) 42 PIRE = P+BAG-BCL
Receiver
FM: Fade Margin (dB) 5,4 FM = 0,675*SD (RC=90%, SD=8dB)
IM: Interference Margin (dB) 3 IM = 10log(1/1-loading)
PL: penetration loss (dB) 0 Dense urban = 20 dB
MAG: MS Antenna Gain (dBi) 0
SHG: Soft HO Gain (dB) 2
TM: Total Margin (dB) 9,4 TM=FM+IM+PL-MAG+BL-SHG
S: MS Rx Sensitivity (dBm) -110
DL_PL: DownLink Path Loss (dB) 142,6 UP_PL = PIRE-TM-S
96
5.5. LoadLoad factor andfactor and
noise noise rise rise

8/8/2019 Doc1-RadioNetworkPlanning and Engineering
http://slidepdf.com/reader/full/doc1-radionetworkplanning-and-engineering 49/60
49
Uplink limited capacity: uplink Mpole values
Uplink: M pole
97
Pole capacityPole capacity
Uplink: Noise Rise
Uplink interference degrade the RBS sensitivity with a
margin of BIUL ,calculated as following
Where Q is the system load: Q = + +M1
Mpole
M2
Mpole
Mn
Mpole
M1,…. Mn are the number of users on services 1 … n
98
Noise riseNoise rise

8/8/2019 Doc1-RadioNetworkPlanning and Engineering
http://slidepdf.com/reader/full/doc1-radionetworkplanning-and-engineering 50/60
50
Uplink: Noise RiseUplink: Noise RiseRB S S e n s i t i vi t y
System load (Q)
100 %
99
Downlink: MDownlink: Mpolepole
γ : Downlink C/I targetε: C/I compensation term for fast fading
α: Non orthogonality factor
nAS: Typical size set
b: Number of active links
κ : Fraction of user in soft/softer handover
GSHO: Soft HO gain
GDTX: DTX gain 100

8/8/2019 Doc1-RadioNetworkPlanning and Engineering
http://slidepdf.com/reader/full/doc1-radionetworkplanning-and-engineering 51/60
51
Downlink limited capacity: Downlink Mpole values
Downlink: MDownlink: Mpolepole
101
102
Load factor on the UL (1)Load factor on the UL (1)
W : chip rate (3,84 Mchip/second),
ρ i: E b /N 0 (QoS) required for service i (or for the correspondingservice of user j),
i = inter-cell interference/ inner-cell interference. i depends on theenvironment, the type of the cell (i = 55 % in case of omnidirectional cells) and the type antenna,
R j: user j rate, depends on the used service,
u j: user j activity factor at physical layer level (67 % for voice and100 % for data),
N s: number of sectors,
ζ: sectorization gain.
( )∑ +
+
=k
sk
k k
/ N .i1.u
R.W 1
1 ζ
ρ
η

8/8/2019 Doc1-RadioNetworkPlanning and Engineering
http://slidepdf.com/reader/full/doc1-radionetworkplanning-and-engineering 52/60
52
103
Load factor on the UL (2)Load factor on the UL (2)
W : chip rate (3,84 Mchip/second),
R j: j user bitrate, depends on the service,
u j: user j activity factor at physical layer level (67 % for
voice and 100 % for data),
N : number of subscribers in each cell.
The higher the load, the lower the radius.
Cell breathing.
∑
++=
=
N
1 j j
j
j0
b
UL u.
R. N
E
W 11)i1(n
104
Noise RiseNoise Rise• Noise Rise = - 10log
10(1 – n
ul).
• Value used as interference margin in the calculationof the link budget. Increases with transmissionbitrate and the number of communications.
Capacity of the system defined by the pole capacity.
C orresponds to the case where nul reaches1.Pole capacity never reached as it assumes infinite
mobile transmission powers.
In practice: Maximum WCDMA cell load between40 and 70 %.
Example: Load between 20 and 50 % noise rise =2 dB.

8/8/2019 Doc1-RadioNetworkPlanning and Engineering
http://slidepdf.com/reader/full/doc1-radionetworkplanning-and-engineering 53/60
53
Downlink: Noise Rise Downlink: Noise Rise
Downlink interference degrade the UE sensitivity
with a margin of BIDL ,calculated as following ;
Lsa
= Lpmax
+ Bpc
+ BLNF
+ LBL
+ LBPL
+ L j
– Ga
Nt: thermal noise power density (-174 dbm/Hz)
Nf : Noise figure
Where
105
Cell breathingCell breathing
Cell breathing phenomena
RBS
Q = Qmax = 60 %
Q = 0 % (no traffic)
106

8/8/2019 Doc1-RadioNetworkPlanning and Engineering
http://slidepdf.com/reader/full/doc1-radionetworkplanning-and-engineering 54/60
54
107
Cell breathing phenomenaCell breathing phenomena
Case 1: 10 users Case 2: 20 users
-10 < C/I < -5 dB -15 < C/I < -10 dB
-15 < C/I < -50 dB cells
108
Capacity, cell radius andCapacity, cell radius and noise rise noise rise
R
Charge de la cellule = 20 % de
la capacité maximum
Niveau d’inter férence = y dB
RR’
Charge de la cellule = 50 % de
la capacité maximum
Noise Rise = 2 dB
Niveau d’inter férence = y + 2 dB
R
R et R’ sont les rayons descellules dans les deux
situations de charge
Cell load = 20% of the
maximum capacity
Interference level = y dB
R and R’: cellradiuses in the 2 load
conditions
Cell load = 50% of the
maximum capacity
Interference level = y + 2 dB

8/8/2019 Doc1-RadioNetworkPlanning and Engineering
http://slidepdf.com/reader/full/doc1-radionetworkplanning-and-engineering 55/60

8/8/2019 Doc1-RadioNetworkPlanning and Engineering
http://slidepdf.com/reader/full/doc1-radionetworkplanning-and-engineering 56/60
56
111
6. Coverage and6. Coverage and
servicesservices
112
Coverage and services (1)Coverage and services (1)Link budget Service throughput
Relation between coverage and service throughput
Yellow = 12.2 kbps – Orange = 64 kbps - Red= 384 kbps

8/8/2019 Doc1-RadioNetworkPlanning and Engineering
http://slidepdf.com/reader/full/doc1-radionetworkplanning-and-engineering 57/60
57
113Blue = 144 kbps – Red = 384 kbps
Coverage and services (2)Coverage and services (2)
114
Traffic location and BS capacityTraffic location and BS capacity
..
< >^
...
. ....
< >^
...
. ..
..
< >^
...
. ..
..
< >^
...
. ..
..
< >^
...
. ..
..
< >^
...
. ..
..
< >^
...
. ..
..
< >^
...
. ..
..
< >^
...
. ..

8/8/2019 Doc1-RadioNetworkPlanning and Engineering
http://slidepdf.com/reader/full/doc1-radionetworkplanning-and-engineering 58/60
58
115
Benefits for locating the sites close toBenefits for locating the sites close to hot spots hot spots
− Minimises the power on downlink channels;
− Reduction in the number of mobiles in soft handover and increase in the BS averagecapacity;
− Reduction of the interference on the uplink ;
− Increase of BS capacity: terminals close to theBS require less power and thus minimise the DLinterference. Furthermore, mobiles connected toneighbour base stations de base being far fromcurrent one, inter-cell interference is low, andthus increasing the capacity of the neighbour BSon the UL.
116
Coverage/capacity versus distance (1)Coverage/capacity versus distance (1)− High bitrates = high power,
− High transmission bitrates only available close
to the base station.

8/8/2019 Doc1-RadioNetworkPlanning and Engineering
http://slidepdf.com/reader/full/doc1-radionetworkplanning-and-engineering 59/60
59
117
Coverage/capacity versus distance (2)Coverage/capacity versus distance (2)
HSDPA capacity limitsHSDPA capacity limits
118

8/8/2019 Doc1-RadioNetworkPlanning and Engineering
http://slidepdf.com/reader/full/doc1-radionetworkplanning-and-engineering 60/60