Embed Size (px)
Citation preview

Do Risk Disclosures Matter When It Counts? Evidence from the Swiss Franc Shock*
Luzi Hail University of Pennsylvania, The Wharton School
Maximilian Muhn Humboldt University of Berlin
David Oesch University of Zurich
November 2017
Abstract We examine the long-term transparency effects of past risk disclosures following an exogenous shock to macroeconomic risk. In 2015 the Swiss National Bank (SNB) abruptly announced it would discontinue the longstanding minimum euro-Swiss franc exchange rate. We show that firms with more transparent disclosures regarding their foreign exchange risk exposure ex ante exhibit significantly lower information asymmetry ex post. The gap in bid-ask spreads appears within 30 minutes of the SNB announcement and persists for two weeks. We confirm the informational role of past risk disclosures with a field survey of three groups of market participants: (1) Sell-side analysts emphasize existing disclosures to evaluate the translational and transactional effects of the currency shock. (2) Lending banks’ credit officers rely on past disclosures as the primary resource available for smaller unlisted firms in the immediate aftermath of the shock. (3) Investor-relations managers use existing financial filings as a key internal information source when communicating with external stakeholders. In sum, the results imply that risk disclosures continue to attenuate information asymmetry and the costs of adverse selection well beyond their initial publication date.
JEL classification: F31, G12, G14, G15, G30, M41 Key Words: Risk disclosures, historical information, liquidity, information asymmetry,
exchange rates, archival studies, surveys
* We appreciate the helpful comments of Ray Ball, Phil Berger, Jeremy Bertomeu, Siddharth Bhambhwani, Matthias Breuer, Donal Byard, Vedran Capkun, John Gallemore, Joachim Gassen, Christian Hofmann, Christian Leuz, Miao Liu, Maximilian Müller, Martin Nienhaus, Thorsten Sellhorn, and workshop participants at the 2017 American Accounting Association meeting, Baruch College, University of Chicago, Humboldt University of Berlin, Ludwig Maximilian University of Munich, Stockholm School of Economics, and WHU. We thank Conrad Meyer and Michèle Schnyder for their help in putting us in touch with the right people for our interviews and surveys. Maximilian Muhn gratefully acknowledges the support by the German Research Foundation through the Collaborative Research Center 649 “Economic Risk” at the Humboldt University of Berlin.

1
“The Swiss franc rocketed beyond parity with the euro on Thursday after Switzerland’s
central bank stunned markets by scrapping its long-standing cap on the strength of the
currency. The euro dropped around 30% against the franc, ending more than three years
of calm in Swiss foreign-exchange markets.” Wall Street Journal, January 15, 2015.
1. Introduction
How do market participants cope with unexpected events that affect a firm’s prospects, and
what role does existing financial statement information play in this process? In standard
economic theory, when new information arrives, it is immediately processed by economic agents
and affects their behavior. Thereafter the news content of the information becomes stale and no
longer influences agents’ decisions. In accounting terms, when a firm releases its financial
reports, previously private information about future expected cash flows enters the public
domain, and it quickly is reflected in stock prices and investors’ trading patterns (e.g., Beaver
1968; Asthana et al. 2004; Li and Ramesh 2009; De Franco et al. 2011; Rogers et al. 2017).
After the initial publication, financial statement disclosures lose their news element, and only
affect investors’ priors if they help contextualize and condition the advent of new information
(e.g., Blacconiere and Patten 1994; Drake et al. 2016). In this study, we analyze an exogenous
shock to macroeconomic risk that allows us to evaluate the long-term transparency effects of risk
disclosures released in a firm’s annual report. We show that the market reacts to the exogenous
shock in a way consistent with past risk disclosures allowing investors to process and interpret
new information. We confirm this role of past disclosures by surveying financial analysts, credit
officers in lending banks, and investor-relations managers at affected firms.
On January 15, 2015, at 10:30 in the morning, the Swiss National Bank (SNB) announced it
would discontinue the minimum exchange rate between the euro (EUR) and the Swiss franc
(CHF) without further notice. The SNB introduced the exchange-rate peg in 2011 to counter the

2
ongoing pressure on the Swiss franc to act as a “safe haven” amid the turmoil in global financial
markets. By increasing the supply of francs relative to the euro, the SNB managed to maintain
the target exchange rate of 1.20 EUR-CHF. The announcement to abandon the exchange rate
peg caught the market by surprise. It had an immediate and large impact: the EUR-CHF
exchange rate dropped close to parity and Swiss stock markets lost more than 10 percent.
The SNB announcement provides an ideal setting to analyze the long-term transparency
effects of past risk disclosures. First, the unpegging of the Swiss franc represents an exogenous
shock, whose timing is random and not influenced by either firms or investors. Second, the drop
in exchange rates is economically significant and has the potential to affect the expected cash
flows of many Swiss firms because exports of goods and services make up about 70 percent of
Swiss GDP at the time. Yet, the effect is not uniform but reflects a firm’s business model and
exposure to the euro. This private information is inherently difficult to observe and requires
disclosures by the firm. Third, the initial market reaction occurs within minutes of the event,
which is too short a time span for the firm to prepare and release new disclosures, so external
stakeholders must rely on existing financial information. Thus, we believe that in our setting
variation in a firm’s past disclosures about the currency exposure of its business is a plausible
path to explain variation in the market reaction to the SNB announcement. At the same time, the
informational role of past risk disclosures is not obvious, because the already published
information is stale, has little relevance for the new situation, or requires special expertise to be
processed. Moreover, competing information sources could be more accurate and timely.
To test our research question, we first conduct an archival event study of changes in
information asymmetry following the Swiss franc shock conditional on the precision of past risk
disclosures in firms’ annual reports. For each of our 151 sample firms listed on the SIX Swiss

3
Exchange (equal to 98 percent of market capitalization), we construct a risk disclosure score.
The score ranges from 0 to 7 and captures the quality of a firm’s disclosure policy regarding its
foreign exchange risk exposure (not the actual risk). It reflects items like revenues generated
abroad, the currency distribution of liquid assets and liabilities, or the sensitivity of net income to
exchange rate fluctuations. A higher score indicates more common knowledge for investors to
interpret the subsequent shock, which should manifest in lower information asymmetry.
We show that in the initial three days after the SNB announcement information asymmetry
among investors dramatically increases. Bid-ask spreads, on average, jump by 21 basis points or
44 percent relative to the 30-day period leading up to the event. However, systematic
heterogeneity exists. Firms with risk disclosure scores higher by one standard deviation exhibit
significantly lower increases in bid-ask spreads by about 7 basis points. The gap in spreads
appears within 30 minutes after the announcement by the SNB and persists for two weeks. The
results are robust to the inclusion of firm and industry-by-day fixed effects or, in an intraday
analysis, the inclusion of fixed effects for each 30-minute trading interval. They also hold when
we control for firms’ general information environment and their actual currency risk exposure.
The results imply that past risk disclosures help investors contextualize the new information
from the unexpected change in risk, and that it takes firms about two weeks to close this
information gap. Because we do not observe a differential stock price reaction across firms with
high and low risk disclosure scores, the results point to the quality of past risk disclosures (not
actual risk) as the likely mechanism of the change in information asymmetry.
In the second part of the study, we confirm the informational role of past risk disclosures by
incorporating field data from users of financial statement information into the analysis. Such
circumstantial evidence helps validate the plausibility of the inferences we draw from the

4
archival tests, and increases our confidence in the causality of the established relations (Soltes
2014; Bernstein et al. 2016). We conduct surveys and structured interviews with three groups of
market participants affected by the SNB announcement: (1) sell-side analysts covering the firms
listed on SIX, (2) credit officers of lending banks to listed and unlisted Swiss firms, and (3)
investor-relations managers employed at the affected firms.
Based on 77 survey responses (9.4 percent response rate), we show that only 3 percent of
financial analysts anticipated such a surprising move by the SNB within the next three months.
Analysts expected the change in the currency regime to negatively impact the average firm, and
they reassessed the prospects of almost their entire portfolio within the first two days. In most
cases, such a reassessment led to material adjustments of the quantitative inputs in the valuation
models that analysts use to derive their earnings forecasts and stock recommendations. More to
the point, existing annual reports and financial filings served as a key information resource in the
immediate aftermath of the event, on par with private communication with management, and
ranked only behind analysts’ personal experience and industry knowledge. This role declined in
the days that followed, as ad hoc announcements gained importance. The main use of existing
financial statement information was to better contextualize and interpret the translational and
transactional currency risk exposure of the firm and to assess the effectiveness of the hedging
strategy in place. Differences in reporting quality were perceived as one of the main reasons for
difficulties to compare the impact of the Swiss franc shock across firms.
We next conducted a series of structured interviews with credit officers from four large
Swiss banks. Lending institutions enjoy privileged access and closer ties to their clients (e.g.,
Rajan 1992; Agarwal and Hauswald 2010), and given their longer horizon, they face less time
pressure to respond to unexpected changes in risk. Immediately after the SNB announcement
5
(within one week for listed firms, two to four weeks for the rest), all banks reviewed their loan
portfolios and classified firms into different risk categories depending on the materiality and
perceived impact of the shock. The main, and for non-listed firms only, information source for
this triage were existing financial disclosures including annual reports submitted during the
periodic loan review. High risk cases underwent a more detailed review over the following
months and loan officers often engaged in direct discourse with their clients to gather additional
information on the impact of the currency shock, particularly for large corporate borrowers. Two
banks indicated that they had tightened their clients’ reporting requirements and frequency as a
response to the event, but none mentioned adjustments to the credit risk rating system.
Finally, based on 39 replies to a survey of investor-relations managers (26 percent response
rate), we show that firms were surprised by the currency shock, and anticipated negative effects
on future sales and earnings. Close to 50 percent of the firms started communicating with
external stakeholders on the day of the event, primarily through private channels with financial
analysts and institutional investors. The interactions were both proactive and a reaction to
outside demand, and the main goals were to reassure existing investors, reduce uncertainty, and
build trust in the firm’s reporting strategy. Consultation with key management, existing
contingency plans, and past annual reports and financial filings served as primary information
sources in the preparation of the external communication. As time went by, the communication
shifted towards regular financial filings and pre-scheduled investor events.
Our study contributes to the literature in several ways. We focus on the informational value
of already published financial disclosures in the advent of new information about the
fundamentals of the firm. We show that past risk disclosures explain systematic variation in
information asymmetry well beyond their initial publication date. Put differently, disclosures not

6
only have the ability to reduce information asymmetry upon release (e.g., Brown et al. 2009;
Shroff et al. 2013), but can also mitigate adverse selection in the future. This channel is different
from having credibly committed in the past to transparent reporting in the future (Leuz and
Verrecchia 2000; Verrecchia 2001; Francis et al. 2008; Daske et al. 2013), or to provide future
disclosures that serve as ex post truth unraveling mechanism for today’s disclosures (e.g., Ball et
al. 2012). In both cases, we would predict a persistent effect on current information asymmetry.
In our setting, the effect is transitory and relies on the quality of past disclosures interacting with
the new information. In that sense, our study is related to Blacconiere and Patten (1994) who
look at the differential market reaction conditional on a firm’s environmental risk exposure (not
the disclosure quality) following a leak in a chemical plant in Bhopal, India, and Bonetti et al.
(2015) who examine the long-term cost of capital effects of environmental disclosures following
the Fukushima nuclear disaster in Japan. This perspective is different from studies investigating
the change in (voluntary) disclosures upon the arrival of fundamental news (e.g., Leuz and
Schrand 2009; Balakrishnan et al. 2014).
We also contribute to the literature on how investors use financial reports. By combining
archival and survey methods, we provide a richer picture of the extent to which investors,
analysts, lenders, and employees rely on financial statement information. Our evidence from the
field corroborates the notion of a causal link between unexpected changes in firm fundamentals
and information asymmetry among investors through the means of past risk disclosures. This
finding complements evidence by Drake et al. (2015; 2016) who show that investors make more
use of the SEC EDGAR database when financial statements are complex, firms report negative
or largely discretionary earnings, and there is a negative shock to firm value. In contrast, we
zoom in on one particular type of disclosures and one specific (exogenous) event, both dealing
7
with a firm’s business risk. This focus allows us to open the black box of how past disclosures
provide a channel through which they might affect information asymmetry and, ultimately, firm
value. The finding also speaks to the ongoing debate about potential disclosure overload (e.g.,
Beatty et al. 2015; Dyer et al. 2016). Information that appears immaterial or irrelevant at the
time of public release, might again become useful to decision-makers in the future.
Finally, our study contributes to the literature on corporate risk disclosures (e.g., Jorion
2002; Kravet and Muslu 2013; Campbell et al. 2014; Hope et al. 2016; Harris and Rajgopal
2017). Prior studies examine the market reaction to risk disclosures or assess their ability to
predict future risk. We test whether (past) risk disclosures help investors gauge the impact of a
sudden realization of risk. In broader terms, our findings speak to the role of extant disclosures
to interpret new information beyond just risk, for instance, if a competitor announces a new
product, new regulation is proposed, or a large corporate merger in the industry takes place.
Section 2 contains the hypothesis development and describes the institutional setting. In
Section 3, we discuss the research design, sample, and the results of the archival tests. Section 4
presents the findings from the field analysis. Section 5 concludes. In the appendix, we provide
details on the risk disclosure score and the surveys of analysts and investor-relations managers.
2. Hypothesis Development and Institutional Setting
2.1. Conceptual Underpinnings for the Informational Value of Past Risk Disclosures
In this study, we analyze the informational role of past risk disclosures. Prior archival
research mostly focuses on the information content of newly released disclosures; that is, whether
the information contained in these new disclosures changes investors’ beliefs about future returns
or prices (e.g., Beaver 1968). The new information signal transfers previously unknown or
8
private information into the public domain and is expected to immediately affect investors’
trading behavior. Thus, the release of the information and the market reaction occur at the same
time. After the release, the information content of the new disclosures is typically assumed to
become stale and have no more effect on investors’ future decisions.
However, the view that financial disclosures are only useful at the time of their release
might be too short-sighted (e.g., Ball and Shivakumar 2008). They might interact with future
(public or private) information signals plus reflect on the usefulness of prior (public or private)
information. In our setting, we examine whether past public announcements complement
current public information signals. Specifically, we argue that past risk disclosures become
useful again once the underlying risk suddenly changes. The arrival of unexpected news about
the state of the firm (i.e., the currency shock) increases uncertainty among investors. As market
participants scramble to assess the economic consequences of the news, past disclosures about
how the firm handles currency risk help investors contextualize and interpret the new situation
and reduce some of the uncertainty. Our setting is related to Kim and Verrecchia (1994; 1997).
In their models past private information interacts with a new public signal, thereby exacerbating
the informational disadvantage of the uninformed investors. In contrast, we study variation in
the precision of past information, which is public knowledge, while holding the distribution of
private information among investors constant. Thus, we expect firms with more precise past
disclosures about risk to suffer less of an increase in information asymmetry upon the arrival of
the sudden news (i.e., leaving investors without private knowledge at less of an informational
disadvantage).1 The area of risk disclosures seems particularly receptive to the argument of an
interaction between past and current public information because risk disclosures, by definition,
1 We would obtain the same prediction if sophisticated investors saw more value in acquiring additional private information for low-quality disclosure firms upon the arrival of the sudden news (i.e., high-quality risk disclosures crowd out private information acquisition by sophisticated investors).

9
contain information on future adverse scenarios. If those risks materialize, investors can rely on
past scenarios to assess the firm-specific outcomes.
Our information structure is distinct from other mechanisms examined in the literature. For
instance, by credibly committing to disclose information regardless of the future outcome, a firm
can reduce information asymmetry in a persistent manner (e.g., Diamond and Verrecchia 1991;
Baiman and Verrecchia 1996; Leuz and Verrecchia 2000). The commitment occurs in the past,
and because it imposes a cost (e.g., review of the financial statements by better quality auditors),
it renders current public announcements more precise. In our setting, the initial disclosure is in
the past, but from thereon forward the information is available to all market participants and
remains available to them regardless of future outcomes (see e.g., Li et al. 2017). Even if the
disclosure originally was a voluntary decision, its availability is no longer a firm choice ex post.
Yet, we require two separate information signals at different points in time, while a credible
commitment works for all future public announcements individually. Moreover, the effect of
past risk disclosures is likely transitory as firms can make up for them with new public
announcements, and investors have incentives to gather more information. Another channel to
reduce information asymmetry ex ante is the knowledge that there exists an independent
verification (e.g., Ball et al. 2012; Li and Yang 2016). The public announcement occurs today
(e.g., voluntary disclosure), but it will be reinforced with a credible disclosure in the future (e.g.,
through the release of audited financial statements). We focus on the ongoing relevance of past
risk disclosures, and because we consider a random shock instead of an anticipated event, we do
not observe the disciplining effects of future (mandatory) disclosures.
The informational role of past risk disclosures is not obvious. First, by definition, already
published disclosures contain information that is stale and potentially outdated. The disclosures

10
might have little practical relevance for investors when a firm faces a new situation. Second,
while past risk disclosures are available to the public, they might require special knowledge and
expertise to be processed. For instance, only sophisticated users such as financial analysts or
institutional investors might have the ability to interpret and contextualize the new event against
the backdrop of past information. In this case, the availability of past disclosures would intensify
the comparative disadvantage for the uninformed investor (Indjejikian 1991; Kim and Verrecchia
1994). Third, a firm cannot foresee or it is too costly for the firm to provide information for
every contingency ex ante. Thus, past risk disclosures contain, at best, indirect information
about the impact of a change in the firm environment. Other information sources are more
accurate and timely, and firms can quickly react and bridge an information gap with new ad hoc
disclosures.
2.2. Institutional Setting of the Swiss Franc Shock
The Swiss franc has a long tradition of acting as a safe-haven currency for investors when
global financial markets are in turmoil. In 2011, fueled by the looming sovereign debt crisis in
Europe and the near-failure of the debt-ceiling negotiations in the U.S., the Swiss franc strongly
appreciated against the euro (by up to 17 percent) and the U.S. dollar (by up to 22 percent). This
currency appreciation put a strain on the many export-reliant industries in Switzerland and
increased the deflationary pressure. At this point, the SNB had already intervened multiple times
in the capital markets by broadening the monetary base and acquiring foreign currencies. In
August, the SNB declared that it would take additional steps against the strong Swiss franc (SNB
2011a). These efforts culminated in a stunning announcement on September 6, 2011, when the
SNB set a currency floor of CHF 1.20 per EUR and insisted that it would “enforce this minimum
rate with the utmost determination” as it was committed “to buy foreign currency in unlimited
11
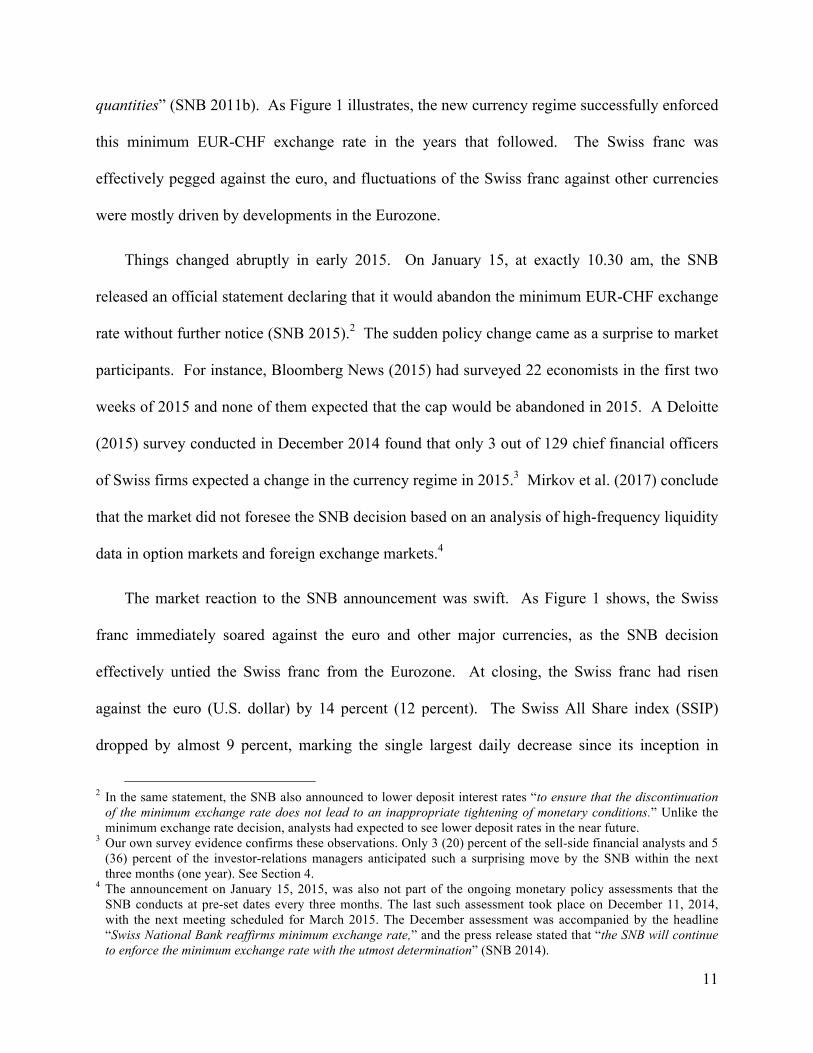
quantities” (SNB 2011b). As Figure 1 illustrates, the new currency regime successfully enforced
this minimum EUR-CHF exchange rate in the years that followed. The Swiss franc was
effectively pegged against the euro, and fluctuations of the Swiss franc against other currencies
were mostly driven by developments in the Eurozone.
Things changed abruptly in early 2015. On January 15, at exactly 10.30 am, the SNB
released an official statement declaring that it would abandon the minimum EUR-CHF exchange
rate without further notice (SNB 2015).2 The sudden policy change came as a surprise to market
participants. For instance, Bloomberg News (2015) had surveyed 22 economists in the first two
weeks of 2015 and none of them expected that the cap would be abandoned in 2015. A Deloitte
(2015) survey conducted in December 2014 found that only 3 out of 129 chief financial officers
of Swiss firms expected a change in the currency regime in 2015.3 Mirkov et al. (2017) conclude
that the market did not foresee the SNB decision based on an analysis of high-frequency liquidity
data in option markets and foreign exchange markets.4
The market reaction to the SNB announcement was swift. As Figure 1 shows, the Swiss
franc immediately soared against the euro and other major currencies, as the SNB decision
effectively untied the Swiss franc from the Eurozone. At closing, the Swiss franc had risen
against the euro (U.S. dollar) by 14 percent (12 percent). The Swiss All Share index (SSIP)
dropped by almost 9 percent, marking the single largest daily decrease since its inception in
2 In the same statement, the SNB also announced to lower deposit interest rates “to ensure that the discontinuation
of the minimum exchange rate does not lead to an inappropriate tightening of monetary conditions.” Unlike the minimum exchange rate decision, analysts had expected to see lower deposit rates in the near future.
3 Our own survey evidence confirms these observations. Only 3 (20) percent of the sell-side financial analysts and 5 (36) percent of the investor-relations managers anticipated such a surprising move by the SNB within the next three months (one year). See Section 4.
4 The announcement on January 15, 2015, was also not part of the ongoing monetary policy assessments that the SNB conducts at pre-set dates every three months. The last such assessment took place on December 11, 2014, with the next meeting scheduled for March 2015. The December assessment was accompanied by the headline “Swiss National Bank reaffirms minimum exchange rate,” and the press release stated that “the SNB will continue to enforce the minimum exchange rate with the utmost determination” (SNB 2014).

12
1998. The economic consequences did not stop there. Efing et al. (2016) find that the negative
wealth effects of the Swiss franc shock were stronger for export oriented firms with a heavy
reliance on domestic production. They show that these firms experienced larger reductions in
profitability and sales over the next year than their domestically oriented peers. Bonadio et al.
(2016) analyze daily transaction-level data from the Swiss Customs Administration and find that
cross-border import prices adjusted either instantaneously (if invoiced in EUR) or within a few
working days (if invoiced in CHF), indicating a quick exchange-rate pass-through.
The Swiss franc shock has several desirable features from a researcher’s perspective. First,
the unpegging of the Swiss franc represents an exogenous shock, whose timing is random and
not influenced by either firms or investors. Second, the gain in value of the Swiss franc affects
the fundamentals of many Swiss firms, but the impact likely varies by a firm’s business model
and its exposure to the euro. This information is inherently difficult to observe, and requires firm
disclosures to let investors assess the future cash flow implications. Third, the initial market
reaction occurs within minutes of the event, which is too short a time span for firms to prepare
and release new disclosures, leaving stakeholders with only past financial disclosures to provide
context and interpret the news. We exploit these institutional features in our empirical tests.
3. Archival Analysis of Past Risk Disclosures and Information Asymmetry
3.1. Research Design
To test the informational role of past risk disclosures around the Swiss franc shock, we
examine changes in daily bid-ask spreads around the event conditional on the quality of a firm’s
risk disclosures. Figure 2 illustrates the timeline of events. Notably, the measurement of the

13
cross-sectional partitioning variable occurs before the event. Based on this timeline, we estimate
the following ordinary least squares (OLS) regression model:
Log(Bid-Ask Spreadi,t) = !0 + !1 Post_SNBt + !2 Post_SNBt ! FXRisk_Disci +
" !j Control Variablesi,t-1 + " !k Fixed Effectsi,t + #i,t. (1)
The dependent variable, Bid-Ask Spread, is the mean value of intraday minute-by-minute
differences between bid and ask quotes (divided by the mid-point) for firm i on trading day t.
Post_SNB is a binary indicator that takes on the value of ‘1’ beginning on day t = 0 of the SNB
announcement (January 15, 2015), and ‘0’ beforehand. The sample period comprises the 33
trading days surrounding the SNB announcement, with t ! [0; +2] serving as the event window
and t ! [-30; -1] as benchmark period. Post_SNB captures the mean incremental change in bid-
ask spreads following the event. We predict this coefficient to be positive, indicating a sudden
increase in information asymmetry regarding future EUR-CHF exchange rate fluctuations.
The primary test variable, FXRisk_Disc, is a proxy for the quality of foreign exchange risk
disclosures of firm i as reported in the most recent annual report before the event (i.e., for fiscal
year 2013).5 We rely on annual reports because they represent by far the most comprehensive
source for currency risk information.6 We construct FXRisk_Disc by scoring seven items: (i)
revenues, (ii) assets, and (iii) costs/profits generated and held outside of Switzerland; (iv) the
currency distribution of short-term monetary assets and liabilities; (v) the exposure and (vi) the
hedging strategy regarding foreign currency risk; and (vii) the sensitivity of net income/equity to
changes in foreign exchange rates. Each disclosure item receives a score of 1 (quantitative and
5 Over 90 percent of the sample firms end their fiscal year on December 31, and publish the annual report within
two to four months. Most of the remaining firms have fiscal-year ends of March 31. Thus, none of the sample firms had released its 2014 annual report at the time of the SNB announcement.
6 We checked a random sample of quarterly and half-year reports as well as other financial filings occurring over the course of the fiscal year, but could not identify additional relevant risk information in those interim disclosures.

14
qualitative information), 0.5 (qualitative information), or 0 points (no or boilerplate disclosures),
and the variable FXRisk_Disc equals the sum of points, ranging from 0 (worst) to 7 (best). For
ease of interpretation, we standardize the raw scores to a mean of zero and a standard deviation
of one for use in the regression analysis. In Appendix A, we provide details on the construction
of this variable together with illustrative examples.
The idea underlying the FXRisk_Disc score is to gauge the quality of the information, not
the actual risk exposure of the firm. More precise past risk disclosures should allow investors to
better assess the future cash flow implications of the currency shock, ceteris paribus, and
translate into lower information asymmetry. We expect the interaction term between Post_SNB
and FXRisk_Disc to exhibit a negative sign. Because we include firm fixed effects in the model,
the main effect of FXRisk_Disc does not appear in Eq. (1). Similarly, when we control for daily
trends in the data, the day fixed effects subsume the main effect of Post_SNB. In this case, the
interaction term is defined of the within-day, between-firm variation in spreads.
In terms of firm-level Control Variables, we follow prior literature (Chordia et al. 2000;
Leuz and Verrecchia 2000; Christensen et al. 2013), and include in our main specification firm
size using the Market Value of equity at the end of each trading day, daily Share Turnover, and
Return Variability equal to the standard deviation of half-hourly stock returns over the trading
hours of the day. Depending on the specification, we include firm, day, or one-digit SIC
industry-by-day Fixed Effects in the model to account for the average bid-ask spread along these
dimensions. We estimate Eq. (1) in a log-linear form using the natural logarithm of bid-ask
spreads and the control variables, and lag the control variables by one day. We draw statistical
inferences based on two-way clustered standard errors by firm and trading day.
15
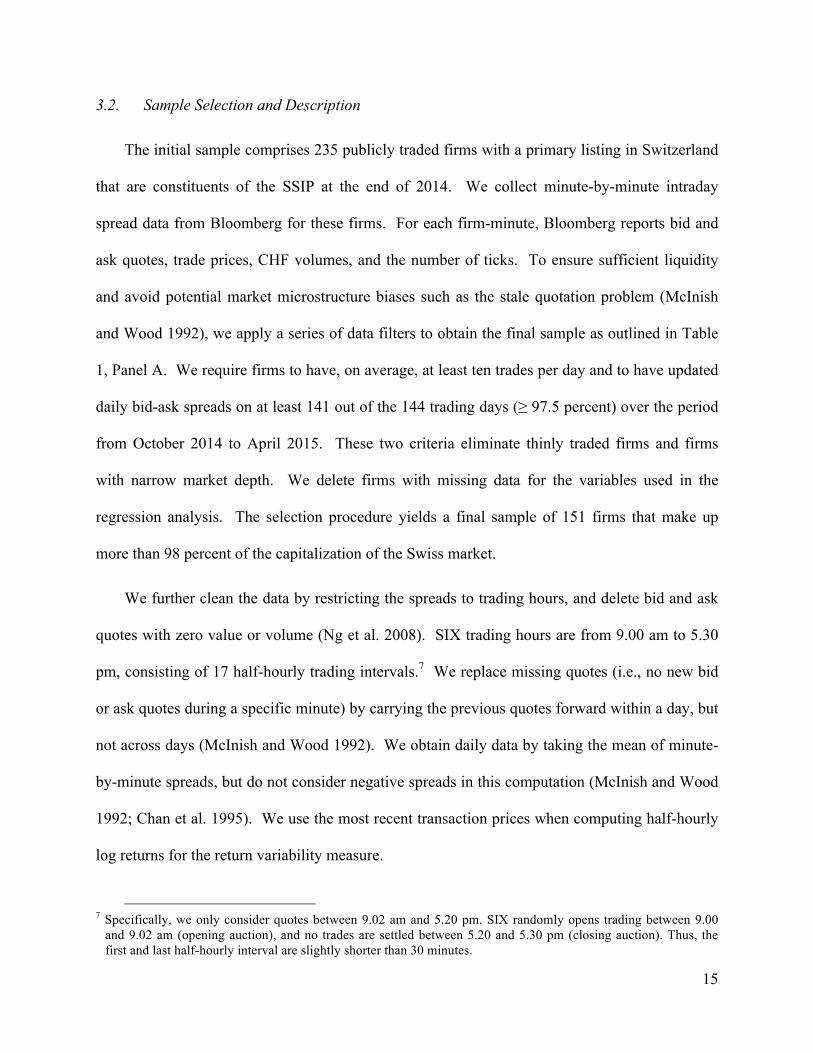
3.2. Sample Selection and Description
The initial sample comprises 235 publicly traded firms with a primary listing in Switzerland
that are constituents of the SSIP at the end of 2014. We collect minute-by-minute intraday
spread data from Bloomberg for these firms. For each firm-minute, Bloomberg reports bid and
ask quotes, trade prices, CHF volumes, and the number of ticks. To ensure sufficient liquidity
and avoid potential market microstructure biases such as the stale quotation problem (McInish
and Wood 1992), we apply a series of data filters to obtain the final sample as outlined in Table
1, Panel A. We require firms to have, on average, at least ten trades per day and to have updated
daily bid-ask spreads on at least 141 out of the 144 trading days (" 97.5 percent) over the period
from October 2014 to April 2015. These two criteria eliminate thinly traded firms and firms
with narrow market depth. We delete firms with missing data for the variables used in the
regression analysis. The selection procedure yields a final sample of 151 firms that make up
more than 98 percent of the capitalization of the Swiss market.
We further clean the data by restricting the spreads to trading hours, and delete bid and ask
quotes with zero value or volume (Ng et al. 2008). SIX trading hours are from 9.00 am to 5.30
pm, consisting of 17 half-hourly trading intervals.7 We replace missing quotes (i.e., no new bid
or ask quotes during a specific minute) by carrying the previous quotes forward within a day, but
not across days (McInish and Wood 1992). We obtain daily data by taking the mean of minute-
by-minute spreads, but do not consider negative spreads in this computation (McInish and Wood
1992; Chan et al. 1995). We use the most recent transaction prices when computing half-hourly
log returns for the return variability measure.
7 Specifically, we only consider quotes between 9.02 am and 5.20 pm. SIX randomly opens trading between 9.00
and 9.02 am (opening auction), and no trades are settled between 5.20 and 5.30 pm (closing auction). Thus, the first and last half-hourly interval are slightly shorter than 30 minutes.

16
Panel B of Table 1 provides descriptive statistics for the variables used in the daily bid-ask
spread regressions. The mean Bid-Ask Spread is 48 basis points, which is smaller than the values
reported for broader samples (e.g., Christensen et al. 2013), and consistent with our firms being
highly traded and liquid. The mean and median values of the FXRisk_Disc score are 4 points out
of 7 possible. The interquartile range of 2 points indicates that the variable offers ample
variation. Aside from the main control variables, the panel also reports descriptive statistics for
additional variables that we use in the sensitivity tests. Int_Sales is the percentage of sales
generated abroad as shown in the most recent annual report.8 When exact data are missing (32
cases), we infer international sales from textual and other disclosures in the annual report.
Total_Disc is a score, ranging from 1 (worst) to 6 (best), ranking the overall disclosure quality of
a firm’s annual report. This score is published annually by the Institute for Banking and Finance
of the University of Zurich. We take the ratings that correspond with the fiscal year 2013.
Num_Analysts is the number of analysts in I/B/E/S that cover a firm in the week before the SNB
announcement. If missing, we set the variable to zero. Free Float is the percentage of shares
available to ordinary investors at the end of the most recent fiscal year (source: Datastream).
We compute daily Stock Return as the natural logarithm of price at the end of trading over price
at the end of the previous day. We do not winsorize or truncate any of the data.9
The median sample firm is covered by four analysts, has a free float of 69 percent, and a
market capitalization of CHF 1.26 bn. Thus, these firms are large and visible. On average, firms
generate two thirds of their sales outside of Switzerland, suggesting a heavy reliance on exports
8 Using Worldscope data (item no. 08731) instead of hand-collected data, and coding missing values as zero (Daske
et al. 2008) leaves our results virtually unchanged. 9 When we winsorize or truncate all the continuous variables in Eq. (1) at the first and 99th percentile (not tabulated),
the results are unaffected and none of the inferences change.

17
and a potentially substantive exposure to risks from foreign currency fluctuations. However,
there exists large variation in this measure.
3.3. Changes in Information Asymmetry Following the Swiss Franc Shock
We begin with plotting the mean daily bid-ask spreads over the 40 trading days surrounding
the event and report results in Figure 3, Panel A. The solid line represents firms with high-
quality past risk disclosures (i.e., FXRisk_Disc greater than the sample median). The dashed line
stands for a synthetic control group (Abadie and Gardeazabal 2003; Abadie et al. 2010).
Following Cavallo et al. (2013) and Acemoglu et al. (2016), we match each high-quality
disclosure firm to a combination of all firms with an FXRisk_Disc score at or below the median
(benchmark pool) using a convex weighting matrix that minimizes the Euclidean differences in
the outcome variable on each trading day over the [-20;-1] pre-event period. By construction,
the differences in bid-ask spreads between the two groups are not significant before the event.
Spreads rise dramatically on the day of the SNB announcement, remain at high levels for the
initial days, and then steadily decrease to pre-announcement levels. The pattern indicates that
the currency shock gives rise to high uncertainty in the market. However, the reaction is much
stronger for the control firms than the firms with high-quality risk disclosures. Visually, the gap
in spreads persists until about 15 trading days after the event. This graphical evidence is
consistent with more precise information about the potential impact of the currency shock
mitigating information asymmetry among investors for otherwise identical firms.
In Table 2, we report coefficients and t-statistics from estimating Eq. (1) using daily bid-ask
spreads as the dependent variable. The model in Column (1) contains the basic liquidity controls
plus firm fixed effects. The significantly positive coefficient on Post_SNB indicates that relative
to the pre-event level bid-ask spreads for the average firm increased by about 21 basis points or

18
44 percent (e0.367 – 1) after the Swiss franc shock. This impact is economically important.
However, the effect is mitigated for firms with more informative past risk disclosures. The
negative and significant coefficient on the interaction term between Post_SNB and FXRisk_Disc
suggests that a one standard deviation increase in the risk disclosure score is associated with a
jump in bid-ask spreads of 30 percent (e[0.367–0.103] – 1), which is about 7 basis points or almost a
third lower than the average reaction. The control variables are all significant and have the
predicted signs.10 We add fixed effects for each trading day in Column (2) and for each industry-
trading day combination in Column (3). These additions subsume the Post_SNB main effect and
allow for the possibility that the Swiss franc shock impacted some industries more than others.
The interaction Post_SNB ! FXRisk_Disc remains virtually unchanged in terms of coefficient
magnitude and statistical significance.
In Column (4), we control for additional firm attributes that might be related to a reduced
market reaction at the SNB announcement. Specifically, we control for a firm’s actual exposure
to currency risk using the proportion of international sales as a proxy (IntSales). Firms with
more currency risk likely exhibit higher uncertainty immediately after the event. We also control
for the overall quality of a firm’s annual report (Total_Disc) and its information environment as
proxied by the number of analysts following the firm (Num_Analysts). Firms with transparent
annual reports likely have more informative risk disclosures. Analysts are sophisticated users of
firm information and often possess private communication channels with management
(Frederickson and Miller 2004; Call et al. 2013; Brown et al. 2015). Thus, they might put their
superior information capabilities to use at the advent of unexpected news. Finally, we control for
ownership structure (Free Float). The lower the proportion of corporate insiders, the less afraid
10 When we include additional interaction terms between the time-variant liquidity controls and the Post_SNB
indicator variable, the results are not materially affected (not tabulated).

19
corporate outsiders should be of trading with a better-informed party. Because none of these
additional controls vary at the firm level, only the interactions with Post_SNB are identified. The
inclusion of the additional controls in the model leaves the Post_SNB ! FXRisk_Disc interaction
largely unaffected (and only the Num_Analysts term is significant and negative).
In Column (5), we include concurrent daily stock returns and its interaction with Post_SNB
as another way of controlling for a firm’s actual risk exposure. Firms with large negative price
reactions (and, hence, a higher exposure to the currency shock) likely face more uncertainties
about the future. As expected, we find that contemporaneous stock returns are negatively related
to bid-ask spreads. The relation is more pronounced after the event (but not statistically
significant). Yet, the Post_SNB ! FXRisk_Disc term is largely unaffected by the inclusion of the
market reaction, suggesting that a firm’s exposure to currency (or other) risks does not act as
confounding factor. This conclusion is further supported by Figure 3, Panel B. The graph plots
mean daily stock returns for firms with high-quality risk disclosures (i.e., FXRisk_Disc greater
than the sample median) and a synthetic control group in the 40 days surrounding the event. By
construction, the two groups behave the same in the pre-event period. However, the stock price
reaction also shows no differences after the currency shock. This finding is inconsistent with
high FXRisk_Disc scores capturing a firm’s actual currency risk or degree of risk management,
which should result in stronger and weaker stock price reactions to the SNB announcement,
respectively. In Column (6) of Table 2, we use Return Variability as the dependent variable. The
results for this alternative proxy of information asymmetry are very similar and the interaction
between Post_SNB and FXRisk_Disc is negative and significant.
To further mitigate concerns that the quality of past risk disclosures is endogenous, we
conduct the following additional sensitivity tests (not tabulated): We proxy for a firm’s exposure

20
to the Swiss franc shock using the foreign currency translation adjustments as disclosed in the
annual report (source: Worldscope) divided by total assets or the historical correlation between
weekly stock returns and CHF-EUR exchange rates measured over the three years prior to the
establishment of the currency peg by the SNB (i.e., September 2008 to September 2011). We
also include an indicator set equal to ‘1’ for firms following international accounting standards
(IFRS or U.S. GAAP) and ‘0’ for firms with local standards. International standards prescribe
more extensive risk disclosures, and might proxy for a more transparent information
environment. In all three cases, the interaction of the variables with Post_SNB is insignificant
and leaves the main coefficient of interest, Post_SNBt ! FXRisk_Disc, negative and significant.
Moreover, when we separately estimate the base model in Column (2) of Table 2 for firms
following local GAAP (33 firms) or international standards (118 firms), the significantly
negative results for the interaction term Post_SNBt ! FXRisk_Disc pertain to both groups, but
they are more pronounced for local GAAP firms.11
Next, we examine the persistence of the differential bid-ask spread reaction observed in
Table 2. We estimate a variant of the model in Column 2 over a [-30;+20] window, in which we
include a set of indicator variables, Post_SNBt, for each day t ! [0; 20]. Figure 4 plots the
individual Post_SNBt ! FXRisk_Disc interaction terms (together with the 95 percent confidence
intervals). The graph shows that the mitigating effect of past risk disclosures on information
asymmetry is largest on the day of the SNB announcement (-0.127). It drops to -0.030 on day t =
11 To assess the potentially confounding effects of new public disclosures released immediately after the event, we
collect firms’ short-term responses, form an indicator (set to ‘1’ for ad-hoc announcements, press releases, or the participation at pre-scheduled investor conferences within the first three days of the event), and interact it with Post_SNB. The results are not affected by the inclusion of this additional control variable.

21
+4, and hovers around -0.05 until trading day t = +10, before it dissipates. Thus, it takes about
two weeks for the differences in bid-ask spreads to disappear.12
In our second set of archival tests, we conduct an intraday analysis. We estimate a version
of Eq. (1), in which we replace the Post_SNB indicator with 17 separate time indicator variables
for each 30-minute interval during trading hours of the event day (i.e., from 9 am to 5:30 pm).
For instance, the 11:30-12:00 Dummy represents the 30 minutes from 11:30 am to noon. We
then interact these time indicators with FXRisk_Disc to estimate the differential bid-ask spread
reaction conditional on the quality of past risk disclosures over the course of the event day. The
SNB announcement took place at 10:30 am. Thus, we expect markets to react from this point on
but not beforehand. All variables are computed similarly as before, but with respect to
30-minute instead of daily trading intervals. The regression contains firm and/or time-of-day
fixed effects, and we assess the statistical significance based on robust standard errors with two-
way clustering by firm and trading interval. Table 3 reports the results.
In Column (1), we combine the day of the SNB announcement with the benchmark period
(i.e., t ! [-30; 0]), and include both firm and time-of-day fixed effects. The series of interaction
terms is defined by the within-trading interval, between-firm variation in spreads. The main
effects of the time dummies are small and only marginally significant before 10:30 am,
suggesting no abnormal activity relative to the benchmark period. Beginning with the 10:30 to
11:00 am interval, the main effects become positive and significant. The coefficient magnitudes
suggest substantive increases in bid-ask spreads ranging from 148 percent (12.00 to 12.30 pm) to
36 percent (5.00 to 5.30 pm), consistent with dramatic increases in uncertainty in the hours after
the SNB announcement. The interaction terms with FXRisk_Disc are not significant before
12 The two-week time frame is consistent with the survey answers of sell-side analysts (see Section 4.1 and Table 4).

22
10:30 am, but then quickly turn negative and become significant from 11:00 am onwards. They
remain significant throughout the day. Within 30 minutes of the announcement, firms with
better quality risk disclosures experience a reduced effect on information asymmetry on the order
of -19 percent (12.30 to 1.00 pm) to -6 percent (3.00 to 3.30 pm).
We repeat the analysis with event-day observations (t = 0) and report results in Column (2).
The time-of-day fixed effects subsume the main effects of the time dummies.13 The results are
very similar to Column (1). While firms with higher quality risk disclosures have no information
advantage in the trading hours before the event, a significant gap in bid-ask spreads appears
within minutes of the unexpected announcement and persists for the remainder of the day. The
intraday results provide strong support for the stipulated link between the advent of fundamental
news and information asymmetry through the channel of a firm’s past disclosures. The reaction
was simply too quick for firms and analysts to release new information at such short notice.14
4. Field Analysis of the Use of Past Risk Disclosures by Various Stakeholders
In this section, we discuss various stakeholders’ use of financial statement information.
Specifically, we surveyed (1) sell-side financial analysts, (2) credit officers at lending banks, and
(3) investor-relations managers working at firms affected by the Swiss franc shock. The purpose
of collecting this data in the field is to provide context for the informational role of past risk
disclosures, validate the inferences drawn from the archival tests, and ultimately increase our
confidence in the causality of the stipulated relations (Soltes 2014; Bernstein et al. 2016).
13 We do not include firm fixed effects in this specification as they would subsume one of the interaction terms with
FXRisk_Disc and render the interpretation of the remaining interactions relative to this base period. 14 When we use trade-size to infer whether trades were executed by retail or institutional investors (e.g., Lee 1992),
we find that the fraction of small trades (< CHF 7,500) sharply and significantly decreases directly after the SNB announcement (not tabulated). This drop occurs within the first 30 minutes of the announcement and applies to all firms, consistent with the notion that mostly sophisticated investors gain an informational advantage after the shock (both sell-side analysts and investor-relations managers confirm in the answers to our survey that they communicated mainly with institutional investors immediately after the event).

23
4.1. Reaction of Sell-Side Financial Analysts to Swiss Franc Shock
Sell-side analysts are an important information intermediary between firms and investors,
and they should be among the first to assess the impact of the currency shock on firms’ future
expected cash flows. Our survey attempts to better understand their information processing and
to examine their use of past financial statement information in the wake of this exogenous event.
We develop the survey after an extensive review of the related literature (Graham et al. 2005;
Dichev et al. 2013; Nelson and Skinner 2013; Brown et al. 2015; 2016), and pre-test it with
several academics and practitioners. The survey comprises 15 questions, divided into the four
sections (1) general information about the Swiss franc shock, (2) timeliness and motivation of
reaction to the event, (3) information sources employed, and (4) methodological approach to
incorporate the information in earnings forecasts and stock recommendations. A series of
demographic questions concludes. When we administered the survey, we briefly explained the
general purpose, but did not mention that we were studying the usefulness of financial statement
disclosures for the assessment of the Swiss franc shock. Appendix B provides more details on
the survey together with all the results not explicitly tabulated in the main body of the study. We
cross-reference the respective survey question (Q) when discussing the results in the text.
Our pool of suitable survey subjects comprises all the sell-side analysts covering at least one
of the 151 sample firms during the SNB announcement. We receive 77 completed surveys,
resulting in a response rate of 9.4 percent.15 The median analyst in our sample covers 10 to 15
firms from up to three different industries. Firms domiciled in Switzerland make up about 25
percent of the average analyst portfolio. However, a quarter of the respondents exclusively cover
Swiss firms in their research. Analysts, on average, are between 30 and 50 years old, hold a
15 The response rate is comparable to other surveys of executives (8.4 percent in Graham et al. 2005), chief financial officers (5.4 percent in Dichev et al. 2013), and financial analysts (10.9 or 7.1 percent in Brown et al. 2015, 2016).

24
master’s degree, and have close to 10 years of experience. They work at large brokerage houses
with more than 25 sell-side analysts. About 40 percent each work for employers headquartered
in Switzerland or the rest of Europe. See Table B1 in the Appendix for details.
The Swiss franc shock caught financial analysts by surprise. Only 3 percent of the
respondents anticipated such a move by the SNB within the next three months and only 20
percent within a year (Q2). This evidence corresponds with the archival findings in Figure 1,
and points to the randomness of the event. The currency shock had a big impact on firm
fundamentals. 85 percent of the respondents thought that almost all of the Swiss firms in their
portfolios were impacted by the event (Q3), and in all cases the effect was expected to be
negative (Q4). The Swiss franc shock recalibrated analysts’ stance towards currency risk.
Before the event, only 36 percent considered a typical firm’s currency risk exposure important
information when forming earnings forecasts or stock recommendations (Q1). This number
soared to 52 percent after the event (Q15), which is significantly higher than before.
The Swiss franc shock triggered a swift reaction from sell-side analysts. They reassessed
the prospects of almost their entire portfolio within the first two days of the SNB announcement
(Q5.1). For about 80 percent of the firms, the reassessment led to a material adjustment of the
qualitative inputs (40 percent) and/or quantitative inputs (70 percent) in the valuation models that
analysts use to derive their earnings forecasts and stock recommendations (Q5.2). The main
drivers behind the rapid response were the increased information needs and, hence, demand from
clients as well as the presumed exposure of the firm to the currency shock (Q6). This answer
already points to the potential importance of risk disclosures for analysts’ decision-making in the
immediate aftermath of the event. Analysts continued to evaluate the impact of the Swiss franc
shock after the initial response. More than 60 percent of the analysts reviewed the prospects of

25
their entire portfolio in more detail in the two to three weeks that followed (Q7). This time
pattern nicely corresponds with the drift we observe in the archival tests. As Figure 4 illustrates,
it took markets about two weeks to fully bridge the gap in bid-ask spreads.
We next explore the role of financial statement information in the decision process. Table 4
lists the survey answers to the questions about the importance of various information sources for
the assessment of the Swiss franc shock of a typical firm immediately after the announcement by
the SNB (Q8) and within the following two to three weeks (Q9). We list the answers in
decreasing order of importance.16 As Panel A shows, personal experience/industry knowledge
and private communication with firm management were considered extremely important during
the advent of the fundamental news. Existing annual reports or other financial filings rank third,
not statistically distinguishable from private communication or ad hoc announcements by the
firm, but more important than market sources, media coverage, or peer information. Thus, not
only did analysts consult annual reports to gather additional insights on the economic
consequences of the currency shock, but this resource also ranked highest in terms of publicly
available information. Our finding contrasts with the information sources that analysts use under
“normal” circumstances. As Brown et al. (2015) show, industry knowledge and private
communication with management are always considered important (see their Table 1). Yet,
annual reports or other financial filings are relatively less important and rank substantially lower.
Panel B of Table 4 provides insights into the dynamics of the information processing by financial
analysts. In the two to three weeks that follow the SNB announcement, existing annual reports
and other filings lose ground (albeit not statistically significant), while private communication
and ad hoc announcements by the firms gain importance. These answers are consistent with
16 When we administered the survey, we presented the options in random order to the subjects to avoid any order
bias (Nelson and Skinner 2013).

26
newer, updated information substituting for past disclosures, which in the short-run were used to
complement the advent of news.
Asked directly what they use financial statement information for (Q10), analysts provided
the responses listed in Table 5, Panel A. The main use of past disclosures was to better
contextualize and interpret the translational and transactional currency risk exposure of the firm
and, to a lesser degree, assess the effectiveness of the hedging strategy in place. These stated
purposes map into the construction of our FXRisk_Disc score that we use in the archival
analyses. Thus, when searching the annual report for relevant disclosures, analysts likely
considered items included in our empirical proxy. Panel B of Table 5 indicates that a firm’s
business complexity together with variation in the quality of past disclosures pose the main
obstacles in assessing the consequences of the currency shock (Q12). About half of the
respondents considered assessing the impact of the event substantively more difficult for some
firms than others (Q11). In terms of how analysts incorporated the new information into their
valuation models, 75 percent responded that they have made quantitative input adjustments,
while about 40 percent reconsidered the entire situation of the firm (including strategic responses
by management) or adjusted the valuation parameters (Q14).
Overall, the results from our survey of sell-side analysts underscore the importance of past
disclosures during the advent of new information and corroborate the findings from the archival
analyses in Section 3. Past financial reports seem to matter if put into context, even though the
information they contain viewed independently might be obsolete. This complementary role is
stronger in the immediate aftermath of the event and attenuates as other information becomes
available. The quality of past disclosures is also important when it comes to contextualize and
condition the new information.

27
4.2. Reaction of Lending Banks to Swiss Franc Shock
Lending banks represent another group of stakeholders affected by the Swiss franc shock,
especially if their borrowers conduct business abroad. Banks enjoy privileged access and closer
ties to their clients (e.g., Rajan 1992; Agarwal and Hauswald 2010), and given their longer
horizon than equity investors, they face less time pressure to respond to unexpected changes in
risk. We conducted a series of in-depth structured interviews with senior credit officers and risk
managers of the four largest commercial banks in Switzerland.17 The interviews lasted about an
hour. In the first part, the bank representatives explained how they handled the events of January
15. In the second part, we guided them through a questionnaire similar in structure and length to
the analyst/investor-relations manager survey. As the sample size of the interviews does not lend
itself to statistical analysis, we provide a qualitative summary of these conversations.
After the SNB announcement (within one week for listed firms, two to four weeks for the
rest), all four banks reviewed their relevant loan portfolio, and classified it into different risk
categories depending on the materiality and perceived impact of the currency shock. As time
was of the essence for this initial assessment, banks incorporated any information available to
them. The main, and for non-listed firms only, information source for this triage were existing
financial disclosures including annual reports submitted during the periodic loan review (e.g.,
2013 annual reports, 2014 quarterly reports, budgets for 2015). Only in rare instances and for
large (listed) clients, loan officers established a direct communication with the borrower during
the initial period of uncertainty. Managers at one bank mentioned that they were prepared for
such an event in that they had constructed a so-called heat map (i.e., risk profile) of their
customer base after the initial pegging of the Swiss franc to the euro in September 2011.
17 We conducted five interviews in total, as one of the banks divides its credit office into publicly listed and privately held clients, and we interviewed senior management at both divisions.

28
The triage typically resulted in three categories of clients: (1) borrowers heavily affected by
the Swiss franc shock, (2) borrowers without material consequences, and (3) the firms
considered somewhere in between. The first group was small (sometimes only a handful of all
corporate clients), and the consensus among our interview partners was that the Swiss franc
shock might have been the tipping point, but rarely the root cause of the financial problems for
these firms. Sometimes, these clients were handed over to the recovery division within the bank.
The second group, without material impact, was surprisingly large (up to 80 percent in some
cases) and consisted primarily of smaller, private clients with a strong focus on domestic
markets. No immediate action was taken for these firms. The third group of firms, potentially
risky cases, underwent a more detailed review over the following months, and loan officers often
engaged in direct discourse with their clients to gather additional information on the impact of
the currency shock. In some cases, this information gathering was standardized using a
questionnaire. Lending banks found that larger companies, particularly when listed on an
exchange, were easier to evaluate because more (and better) information is available and the
information is more recent. At the same time, lenders considered larger firms to be less affected
by the Swiss franc shock due to natural currency hedges by means of their business model and
their superior ability of dealing with exchange rate fluctuations (e.g., by derivative hedging).18
With respect to the usefulness of existing financial filings, our interviews yielded the
following insights. First, while lending banks typically have closer ties with their borrowers and
less time pressure to react than investors, they still relied on this information source to evaluate
the impact of the Swiss franc shock. In fact, their timing pattern is comparable to the sell-side
18 In that sense, relative to the universe of public and private firms, the results of our archival tests and the analyst
survey might understate the impact of the Swiss franc shock on firm fundamentals and overstate the usefulness of risk disclosures. Prior literature shows that publicly listed firms (e.g., Burgstahler et al. 2006) and firms with analyst coverage (e.g., Lang and Lundholm 1996) have a more transparent information environment to begin with.

29
analysts. In the days immediately after the SNB announcement, past disclosures were a valuable
source of information. As time went by, banks replaced “hard” information from existing
financial filings with “soft” information from personal exchanges with the client. Second, two of
the four banks indicated that they had tightened their clients’ reporting requirements and
frequency as a response to the event. This tightening could take the form of requiring half-yearly
or quarterly reporting, and suggests that existing financial disclosure practices were not
considered informative enough in the advent of sudden news. No interview partner mentioned
that the bank adjusted its credit risk rating system following the Swiss franc shock.
4.3. Reaction of Investor-Relations Managers to Swiss Franc Shock
In our third field analysis, we shift the focus away from market participants, and survey
investor-relations (IR) managers working at the affected firms. The goal is to understand the
external communication needs after the Swiss franc shock, and the role that existing financial
statements might have played in this interaction. We develop a survey comprising 15 questions
and pre-test it with several academics and practitioners. The survey is divided into four parts: (1)
general information about the event, (2) timeliness of and motivation for communication with
external stakeholders, (3) means of communication, and (4) stakeholders’ information needs. A
simple demographic question concludes. When we administered the survey, we did not mention
that we were studying the usefulness of financial statement disclosures for the assessment of the
Swiss franc shock. Appendix C provides more details on the survey together with all the results
not explicitly tabulated in the main body of the study. We cross-reference the respective survey
question (Q) when discussing the results in the text.

30
We sent the survey to IR representatives at 149 of the 151 sample firms.19 The response rate
is 26.2 percent or 39 completed surveys. 68 percent of the respondents carry either the title of
head of IR, (senior) IR manager, or head of communications; 18 percent hold the position of
chief financial officer. The respondent firms are a good representation of the sample. On
average, they do not differ significantly from non-respondent firms in terms of the firm
characteristics used in the archival tests as well as with regard to the FXRisk_Disc score. IR
managers working at Swiss firms in January 2015 were surprised by the SNB proclamation.
Only 5 percent expected such a move within the next three months, 35 percent within a year
(Q2). 60 percent of the respondents expected a negative impact on the firm’s future expected
cash flows, only 8 percent foresaw a positive effect (Q3). At many firms, information about the
firm’s foreign currency exposure always belonged to the communication with external
stakeholders (Q1). While its role did not shift for firms that considered it an integral part of their
communication strategy, currency risks received more prominent coverage after the event by
firms that used to largely ignore this issue in the past (Q15).
Firms quickly reached out to external stakeholders following the event. 46 percent of IR
departments communicated with investors, analysts, etc. on the day of the SNB announcement,
64 percent within the first week (Q4). The interactions were typically both proactive and a
reaction to outside demand (Q7). The main goals were to reassure existing investors, reduce
uncertainty in the market place, build reputation, and promote trust in the firm’s reporting
strategy (Q11). Table 6, Panel A, lists the answers to the question about the internal and external
recipients of the communication (Q5). Financial analysts were the primary target group for
information about the currency shock, followed by institutional investors, and management or
19 We could not identify valid email addresses of investor-relations managers at two of the sample firms.

31
other internal departments. Communication with lending banks, retail investors, and the external
audit firm rank significantly lower. This ordering is consistent with the answers in the analyst
and bank surveys, and maps into the bid-ask spread pattern that we observe in the archival tests
(see Panel A of Figure 3 and Figure 4). The uncertainty in the markets was highest shortly after
the event, but sophisticated investors and knowledgeable information intermediaries could
presumably distinguish between firms with more and less precise disclosures.
Panel B of Table 6 shows the information sources used by the IR departments in preparation
of the external communication (Q6). Consultation with key management is ranked highest,
trailed by existing internal reports, and past annual financial statements or other financial filings.
Only 3 percent of the respondents did not deem the latter information source important. Next,
we examine the use of different communication channels. Table 7, Panel A, reports the answers.
Private communication with analysts and investors were the preferred means of communication
in the days immediately after the SNB announcement (Q8). Ad hoc disclosures and press
releases were only rarely used. This finding is consistent with the answers from the sell-side
analysts (see Table 4, Panel A), and suggests that sophisticated market participants were seeking
and IR departments fulfilling the need for non-formalized ways of conveying information that
goes beyond past disclosures. In the two to three weeks that followed, communication at already
pre-scheduled events gained importance (e.g., investor days or conference calls), but private
communication retained its role as key information source (Q9).
Table 7, Panel B, shows reasons why firms did not pursue a more proactive communication
strategy (Q10). No clear rank order emerges. 44 percent of respondents indicated that upcoming
regular financial filings (e.g., the imminent release of the 2014 annual report) or pre-scheduled
events were important. Fears of disclosing proprietary data or setting a disclosure precedent did

32
not receive much weight, even though Graham et al. (2005) list them as the two primary reasons
limiting firms’ voluntary disclosure behavior (see their Table 12).
Finally, we investigate how IR managers perceived the external information needs.
Corporate outsiders were eager to obtain more information about the currency shock. Web
traffic, emails, and phone calls were above normal levels registered during the release of the
firm’s most recent quarterly or annual earnings (Q12). Information about the firm’s transactional
and translational exposure, followed by the nature and extent of the hedging strategy, were in
particularly high demand (Q13). These perceptions nicely map into what sell-side analysts
considered important information drawn from existing financial statements (see Table 5, Panel
A). Asked more directly, 26 (67) percent of IR professionals believed that information in past
disclosures was extremely (at least somewhat) important to outside stakeholders when assessing
the immediate consequences of the Swiss franc shock (Q14). This favorable impression broadly
confirms the findings presented throughout our study.
5. Conclusion
The question of how market participants cope with the advent of unexpected news that
affect a firm’s prospects, and what role existing financial statement information plays in this
process is at the heart of financial accounting. To shed light on this issue, we use the Swiss franc
shock as an ideal setting to analyze the long-term transparency effects of risk disclosures. In
archival analyses, we find that firms with relatively better past risk disclosures experience a
substantially mitigated increase in information asymmetry following the currency shock. This
gap in bid-ask spreads appears within 30 minutes of the SNB announcement and persists for
about two weeks. We confirm the informational role of risk disclosures with data from the field.
Surveying sell-side analysts, lending banks, and IR managers at affected firms shows that

33
existing disclosures are key to evaluate the translational and transactional effects of the currency
shock, and sometimes (e.g., for smaller, unlisted firms) are the only resource available at short
notice. These results imply that risk disclosures continue to attenuate information asymmetry
and the costs of adverse selection well beyond their initial publication date.
One implication of our study is that being transparent has benefits beyond simply providing
useful information at the initial release date. The same set of disclosures might be relevant in the
future as it provides contextual information in case the firm’s information environment changes.
The potential benefits of reduced uncertainty in posterior trading are highest for firms with a
high level of current disclosures. This insight is important as it points to reduced costs of
adverse selection that could arise from selling shares in the future. Our finding of the
complementary role of past risk disclosures adds to prior literature that shows how the
commitment to future high-quality disclosures or the promise to provide credible ex post
verification can sustainably reduce information asymmetry (e.g., Leuz and Verrecchia 2000; Ball
et al. 2012).
On a more fundamental level, our results highlight that managers should care about the long-
term consequences of their disclosure decisions. Even if information appears irrelevant now, it
might become useful later. Thus, preparers, regulators and practitioners should not only consider
the current decision usefulness of a certain disclosure, but also whether this information could
become relevant at some point. This insight contributes to the ongoing debate about information
overload due to the disclosure of immaterial information. Our evidence suggests that materiality
should be assessed with an eye on the future in case a firm’s circumstances change.

34
References
Abadie, A., A. Diamond, and J. Hainmueller. 2010. Synthetic Control Methods for Comparative Case Studies: Estimating the Effect of California’s Tobacco Control Program. Journal of the American Statistical Association 105 (490): 493-505.
Abadie, A., and J. Gardeazabal. 2003. The Economic Costs of Conflict: A Case Study of the Basque Country. American Economic Review 93 (1): 113-132.
Acemoglu, D., S. Johnson, A. Kermani, J. Kwak, and T. Mitton. 2016. The Value of Connections in Turbulent Times: Evidence from the United States. Journal of Financial Economics 121 (2): 368-391.
Agarwal, S., and R. Hauswald. 2010. Distance and Private Information in Lending. Review of Financial Studies 23 (7): 2757-2788.
Asthana, S., S. Balsam, and S. Sankaraguruswamy. 2004. Differential Response of Small Versus Large Investors to 10-K Filings on EDGAR. The Accounting Review 79 (3): 571-589.
Baiman, S., and R.E. Verrecchia. 1996. The Relation among Capital Markets, Financial Disclosure, Production Efficiency, and Insider Trading. Journal of Accounting Research 34 (1): 1-22.
Balakrishnan, K., M.B. Billings, B. Kelly, and A. Ljungqvist. 2014. Shaping Liquidity: On the Causal Effects of Voluntary Disclosure. Journal of Finance 69 (5): 2237-2278.
Ball, R., S. Jayaraman, and L. Shivakumar. 2012. Audited Financial Reporting and Voluntary Disclosure as Complements: A Test of the Confirmation Hypothesis. Journal of Accounting and Economics 53 (1–2): 136-166.
Ball, R.A.Y., and L. Shivakumar. 2008. How Much New Information Is There in Earnings? Journal of Accounting Research 46 (5): 975-1016.
Beatty, A., L. Cheng, and H. Zhang. 2015. Sometimes Less Is More: Evidence from Financial Constraints Risk Factor Disclosures. Working Paper, Ohio State University.
Beaver, W.H. 1968. The Information Content of Annual Earnings Announcements. Journal of Accounting Research: 67-92.
Bernstein, S., X. Giroud, and R.R. Townsend. 2016. The Impact of Venture Capital Monitoring. Journal of Finance 71 (4): 1591-1622.
Blacconiere, W.G., and D.M. Patten. 1994. Environmental Disclosures, Regulatory Costs, and Changes in Firm Value. Journal of Accounting and Economics 18 (3): 357-377.
Bloomberg News. 2015. SNB Unexpectedly Gives up Cap on Franc, Lowers Deposit Rate, published on January 15, 2015 [retrieved March 9, 2015]. Available from http://www.bloomberg.com/news/articles/2015-01-15/snb-unexpectedly-gives-up-cap-on-franc-lowers-deposit-rate.
Bonadio, B., A.M. Fischer, and P. Saure. 2016. The Speed of Exchange Rate Pass-Through. Working Paper, Federal Reserve Bank of Dallas.
Bonetti, P., C.H. Cho, and G. Michelon. 2015. Environmental Disclosure and the Cost of Capital: Evidence from the Fukushima Nuclear Disaster. Working Paper, University of Exeter.
Brown, L.D., A.C. Call, M.B. Clement, and N.Y. Sharp. 2015. Inside the “Black Box” of Sell-Side Financial Analysts. Journal of Accounting Research 53 (1): 1-47.
Brown, L.D., A.C. Call, M.B. Clement, and N.Y. Sharp. 2016. The Activities of Buy-Side Analysts and the Determinants of Their Stock Recommendations. Journal of Accounting and Economics 62 (1): 139-156.
Brown, S., S.A. Hillegeist, and K. Lo. 2009. The Effect of Earnings Surprises on Information Asymmetry. Journal of Accounting and Economics 47 (3): 208-225.
Burgstahler, D.C., L. Hail, and C. Leuz. 2006. The Importance of Reporting Incentives: Earnings Management in European Private and Public Firms. Accounting Review 81 (5): 983-1016.
Call, A.C., S. Chen, and Y.H. Tong. 2013. Are Analysts' Cash Flow Forecasts Naïve Extensions of Their Own Earnings Forecasts? Contemporary Accounting Research 30 (2): 438-465.

35
Campbell, J.L., H. Chen, D.S. Dhaliwal, H.-m. Lu, and L.B. Steele. 2014. The Information Content of Mandatory Risk Factor Disclosures in Corporate Filings. Review of Accounting Studies 19 (1): 396-455.
Cavallo, E., S. Galiani, I. Noy, and J. Pantano. 2013. Catastrophic Natural Disasters and Economic Growth. Review of Economics and Statistics 95 (5): 1549-1561.
Chan, K., Y.P. Chung, and H. Johnson. 1995. The Intraday Behavior of Bid-Ask Spreads for NYSE Stocks and CBOE Options. Journal of Financial and Quantitative Analysis 30 (3): 329-346.
Chordia, T., R. Roll, and A. Subrahmanyam. 2000. Commonality in Liquidity. Journal of Financial Economics 56 (1): 3-28.
Christensen, H.B., L. Hail, and C. Leuz. 2013. Mandatory IFRS Reporting and Changes in Enforcement. Journal of Accounting and Economics 56 (2-3): 147-177.
Daske, H., L. Hail, C. Leuz, and R. Verdi. 2008. Mandatory IFRS Reporting around the World: Early Evidence on the Economic Consequences. Journal of Accounting Research 46 (5): 1085-1142.
———. 2013. Adopting a Label: Heterogeneity in the Economic Consequences around IAS/IFRS Adoptions. Journal of Accounting Research 51 (3): 495-547.
De Franco, G., M.F. Wong, and Y. Zhou. 2011. Accounting Adjustments and the Valuation of Financial Statement Note Information in 10-K Filings. The Accounting Review 86 (5): 1577-1604.
Deloitte. 2015. The Deloitte CFO Survey: A Chill Wind Blows Q4 2014 Results. Zurich, Switzerland. Diamond, D.W., and R.E. Verrecchia. 1991. Disclosure, Liquidity, and the Cost of Capital. Journal of
Finance 46 (4): 1325-1359. Dichev, I.D., J.R. Graham, C.R. Harvey, and S. Rajgopal. 2013. Earnings Quality: Evidence from the
Field. Journal of Accounting and Economics 56 (2-3): 1-33. Drake, M.S., D.T. Roulstone, and J.R. Thornock. 2015. The Determinants and Consequences of
Information Acquisition via EDGAR. Contemporary Accounting Research 32 (3): 1128-1161. Drake, M.S., D.T. Roulstone, and J.R. Thornock. 2016. The Usefulness of Historical Accounting Reports.
Journal of Accounting and Economics 61 (2-3): 448-464. Dyer, T., M. Lang, and L. Stice-Lawrence. 2016. The Evolution of 10-K Textual Disclosure: Evidence
from Latent Dirichlet Allocation. Working Paper, University of North Carolina. Efing, M., R. Fahlenbrach, C. Herpfer, and P. Krüger. 2016. How Do Investors and Firms React to an
Unexpected Currency Appreciation Shock? Working Paper, Swiss Finance Institute. Francis, J., D. Nanda, and P.E.R. Olsson. 2008. Voluntary Disclosure, Earnings Quality, and Cost of
Capital. Journal of Accounting Research 46 (1): 53-99. Frederickson, J.R., and J.S. Miller. 2004. The Effects of Pro Forma Earnings Disclosures on Analysts' and
Nonprofessional Investors' Equity Valuation Judgments. The Accounting Review 79 (3): 667-686. Graham, J.R., C.R. Harvey, and S. Rajgopal. 2005. The Economic Implications of Corporate Financial
Reporting. Journal of Accounting and Economics 40 (1-3): 3-73. Harris, T.S., and S. Rajgopal. 2017. Foreign Currency: Accounting, Communication and Management of
Risks. Working Paper. Hope, O.-K., D. Hu, and H. Lu. 2016. The Benefits of Specific Risk-Factor Disclosures. Review of
Accounting Studies 21 (4): 1005-1045. Indjejikian, R.J. 1991. The Impact of Costly Information Interpretation on Firm Disclosure Decisions.
Journal of Accounting Research 29 (2): 277-301. Jorion, P. 2002. How Informative Are Value-at-Risk Disclosures? The Accounting Review 77 (4): 911-
931. Kim, O., and R.E. Verrecchia. 1994. Market Liquidity and Volume around Earnings Announcements.
Journal of Accounting and Economics 17 (1-2): 41-67. Kim, O., and R.E. Verrecchia. 1997. Pre-Announcement and Event-Period Private Information. Journal
of Accounting and Economics 24 (3): 395-419. Kravet, T., and V. Muslu. 2013. Textual Risk Disclosures and Investors’ Risk Perceptions. Review of
Accounting Studies 18 (4): 1088-1122.

36
Lang, M.H., and R.J. Lundholm. 1996. Corporate Disclosure Policy and Analyst Behavior. Accounting Review: 467-492.
Lee, C.M. 1992. Earnings News and Small Traders: An Intraday Analysis. Journal of Accounting and Economics 15 (2): 265-302.
Leuz, C., and C. Schrand. 2009. Disclosure and the Cost of Capital: Evidence from Firms' Responses to the Enron Shock. NBER Working Paper No. 14897.
Leuz, C., and R.E. Verrecchia. 2000. The Economic Consequences of Increased Disclosure. Journal of Accounting Research 38 (Supplement): 91-124.
Li, E.X., and K. Ramesh. 2009. Market Reaction Surrounding the Filing of Periodic SEC Reports. The Accounting Review 84 (4): 1171-1208.
Li, X., and H. Yang. 2016. Mandatory Financial Reporting and Voluntary Disclosure: The Effect of Mandatory IFRS Adoption on Management Forecasts. The Accounting Review 91 (3): 933-953.
Li, Y., Y. Lin, and L. Zhang. 2017. Trade Secrets Law and Corporate Disclosure: Causal Evidence on the Proprietary Cost Hypothesis. Journal of Accounting Research Forthcoming.
McInish, T.H., and R.A. Wood. 1992. An Analysis of Intraday Patterns in Bid Ask Spreads for NYSE Stocks. Journal of Finance 47 (2): 753-764.
Mirkov, N., I. Pozdeev, and P. Söderlind. 2017. Toward Removal of the Swiss Franc Cap: Market Expectations and Verbal Interventions. Working Paper, University of St. Gallen.
Nelson, M.W., and D.J. Skinner. 2013. How Should We Think About Earnings Quality? A Discussion of “Earnings Quality: Evidence from the Field”. Journal of Accounting and Economics 56 (2-3): 34-41.
Ng, J., T.O. Rusticus, and R.S. Verdi. 2008. Implications of Transaction Costs for the Post–Earnings Announcement Drift. Journal of Accounting Research 46 (3): 661-696.
Rajan, R.G. 1992. Insiders and Outsiders: The Choice between Informed and Arm's-Length Debt. Journal of Finance 47 (4): 1367-1400.
Rogers, J.L., D.J. Skinner, and S.L. Zechman. 2017. Run EDGAR Run: SEC Dissemination in a High-Frequency World. Journal of Accounting Research Forthcoming.
Shroff, N., A.X. Sun, H.D. White, and W. Zhang. 2013. Voluntary Disclosure and Information Asymmetry: Evidence from the 2005 Securities Offering Reform. Journal of Accounting Research 51 (5): 1299-1345.
SNB. 2011a. Swiss National Bank Takes Measures against Strong Swiss Franc, published on August 3, 2011 [retrieved September 9, 2015]. Available from http://www.snb.ch/en/mmr/reference/pre_20110803/source/pre_20110803.en.pdf.
———. 2011b. Swiss National Bank Sets Minimum Exchange Rate at CHF 1.20 Per Euro, published on September 6, 2011 [retrieved September 9, 2015]. Available from http://www.snb.ch/en/mmr/reference/pre_20110906/source/pre_20110906.en.pdf.
———. 2014. Swiss National Bank Introduces Negative Interest Rates, published on September 15, 2015 [retrieved September 9, 2015]. Available from http://www.snb.ch/en/mmr/reference/pre_20150115/source/pre_20150115.en.pdf.
———. 2015. Swiss National Bank Discontinues Minimum Exchange Rate and Lowers Interest Rate to -0.75%, published on September 15, 2015 [retrieved September 9, 2015]. Available from http://www.snb.ch/en/mmr/reference/pre_20150115/source/pre_20150115.en.pdf.
Soltes, E. 2014. Incorporating Field Data into Archival Research. Journal of Accounting Research 52 (2): 521-540.
Verrecchia, R.E. 2001. Essays on Disclosure. Journal of Accounting and Economics 32 (1): 97-180.

Figure 1: Euro-Swiss Franc Exchange Rates and Swiss All Share Index Over 2011 to 2015 Period
The figure plots the euro to Swiss franc (EUR-CHF) exchange rates (left-hand scale) and the Swiss All Share Index (symbol: SSIP; right-hand scale) over the years 2011 to 2015. The SSIP includes all shares of companies listed on the Swiss exchange SIX. Exchange rates and index values are from Datastream. The graph also indicates the dates when the Swiss National Bank (SNB) established the minimum exchange rate of CHF 1.20 per euro on September 6, 2011, and subsequently abandoned this lower threshold on January 15, 2015.
September 6, 2011 January 15, 2015
4,00
06,
000
8,00
010
,000
SS
IP S
wis
s Al
l Sha
re In
dex
1.0
1.1
1.2
1.3
EUR
-CH
F Ex
chan
ge R
ate
2011 2012 2013 2014 2015
EUR-CHF Exchange Rate SSIP Swiss All Share Index

Figure 2: Timeline of Events and Overview of Research Design for Archival Analysis
The figure illustrates our research design for the archival part of the analysis. In the regression analyses, we compare bid-ask spreads during the event window to the benchmark period using the Post_SNB indicator variable. We then test for cross-sectional differences in bid-ask spreads between firms with high and low foreign exchange risk disclosure scores (FXRisk_Disc). We construct FXRisk_Disc by scoring seven disclosure items that capture a firm’s exposure to foreign exchange risk as reported in the most recent annual report before the event (see Appendix A for details).
!"#$
!"#$%&'()*+,#-.+%&'()*+,-.+/0+,12
/0"#1*+,#-.+%&'()*+.+/0+34256'7"'89$*+!"#$%&'( :
2"'34("&"#1*.5*6'(1,1,.#,#7*0'(,'89"!7';)<'7$;=(+0>+>07$"?;+$@=A';?$+7")B+&")=90)C7$)8')$&+0;+';;C'9+7$<07/)+56'7"'89$*+)*+,#-%.,#/ :
/0"#1*-'1":*;'#4'(<*=>?*@A=>?*
=A:BA*'&DEF+&")=0;/";C$)+
#";"#C#+GHI,JKL+$@=A';?$+7'/$
C"8(4'(<?*2'($%?*'#-*D6(,9*@A=>
MC89"='/"0;+0>+';;C'9+7$<07/+>07+LNG+4.1O
E"$"&8"(*B=?*@A=B
E"$"&8"(*B=?*@A=F
L")='9+($'7+$;&+5LNG:+4.1O
L")='9+($'7+$;&+5LNG:+4.1-
C"8(4'(<?*2'($%?*'#-*D6(,9*@A=F
MC89"='/"0;+0>+';;C'9+7$<07/+>07+LNG+4.1-

Figure 3: Market Reactions to Swiss Franc Shock Conditional on Quality of Exchange Risk Disclosures Panel A: Mean Daily Bid-Ask Spreads
Panel B: Mean Daily Stock Returns
The figure maps out changes in information asymmetry as measured by bid-ask spreads (Panel A) and in market performance as measured by stock returns (Panel B) in the 40 trading days (i.e., days -20 to +20) surrounding the SNB announcement to discontinue the minimum EUR-CHF exchange rate on January 15, 2015 (day 0). The sample comprises 151 firms listed on SIX. In both panels, we plot the daily mean values conditional on the quality of foreign exchange risk disclosures. That is, we compare the sample firms with an above median value of the foreign exchange risk disclosure score (FXRisk_Disc) to a (synthetic) control group. We construct the control groups by matching each firm with an above median value of FXRisk_Disc to a combination of all firms with a score at or below the median (benchmark pool) using a weighting matrix that minimizes the differences in the outcome variables during the pre-event period. Thus, by construction, the differences in bid-ask spreads and stock returns between the two groups are not significant before the event. For details on the sample composition and variable measurement see Table 1.
-1.4
-1.2
-1-.8
-.6
Aver
age
Log(
Bid-
Ask
Spre
ad)
-20 -10 0 10 20
Trading Day
High FXRisk_Disc FirmsControl Firms
-8-6
-4-2
02
Aver
age
Ret
urn
(%)
-20 -10 0 10 20
Trading Day
High FXRisk_Disc FirmsControl Firms

Figure 4: Persistence of Information Asymmetry Effects for High Quality Exchange Risk Disclosure Firms
The figure maps out the persistence of the information asymmetry advantages for the firms with high quality foreign exchange risk disclosure scores (FXRisk_Disc) following the SNB announcement to discontinue the minimum EUR-CHF exchange rate. We estimate a bid-ask spread model similar to the base specification (see column 2 in Table 2) over a [-30;+20] window, and plot the coefficient estimates of the interaction terms between Post_SNBt and FXRisk_Disc in the figure. Post_SNBt is a set of indicator variables separately marking each day of the post period [0;+20]. The graph also shows 95% confidence intervals comparing the coefficients to zero (based on robust standard errors clustered by firm and day). For details on the sample composition and variable measurement see Table 1.
-.15
-.1-.0
50
.05
.1
Even
t Day
x F
XRis
c_D
isc
Coe
ffici
ents
0 1 2 3 4 5 6 7 8 9 10 11 12 13 14 15 16 17 18 19 20
Event Day

Table 1: Sample Selection and Descriptive Statistics for Archival Analysis Panel A: Sample Selection Procedure
Data Requirements Number of Firms Members of the Swiss All Share Index as published by the Swiss exchange SIX on 31.12.2014 (symbol: SSIP) 235
– thinly traded firms (i.e., firms with, on average, less than ten trades per day over the period October 2014 to April 2015) -62
– firms with narrow market depth (i.e., firms whose bid-ask spreads were not updated on more than 97.5% of trading days over the period October 2014 to April 2015)
-14
– firms with missing data for variables used in the regression analysis -8 Final sample 151
Panel B: Descriptive Statistics for Variables Used in Daily Information Asymmetry Regressions [Days: -30 to +3]
(N = 4,949) Mean Std. Dev. P1 P25 Median P75 P99 Dependent Variable: Bid-Ask Spreadt 0.482 1.107 0.050 0.144 0.264 0.471 3.774 Independent Variables: Post_SNBt 0.091 0.288 0 0 0 0 1 FXRisk_DiscAR 4.027 1.425 1 3 4 5 7 Market Valuet-1 8,870 32,488 26 444 1,263 4,569 232,508 Share Turnovert-1 0.230 0.772 0.002 0.042 0.114 0.242 1.967 Return Variabilityt-1 0.520 0.677 0.069 0.233 0.343 0.530 3.636 Int_SalesAR 0.654 0.386 0.000 0.285 0.876 0.980 1.000 Total_DiscAR 3.665 0.747 2.037 3.180 3.632 4.173 5.102 Num_Analysts 7.743 8.533 0 2 4 11 32 Free FloatAR 0.663 0.249 0.110 0.450 0.690 0.890 1.000 Stock Returnt -0.256 2.737 -11.083 -0.894 0.000 0.831 5.500
The table presents details on the sample selection (Panel A) and descriptive statistics for the variables used in the daily information asymmetry regressions (Panel B). The final sample of 151 firms gives rise to 4,949 firm-day observations over the [-30;+2] day period surrounding the SNB announcement to discontinue the minimum EUR-CHF exchange rate. We measure daily Bid-Ask Spreads as the mean of minute-by-minute intraday differences between bid and ask quotes (divided by the mid-point). Post_SNB is a binary indicator that takes on the value of ‘1’ beginning on day t = 0 of the SNB announcement (January 15, 2015). To measure the quality of a firm’s foreign exchange risk disclosures, we construct FXRisk_Disc by scoring the following seven items as reported in the most recent annual report before the event (as indicated by the subscript AR): (i) revenues, (ii) assets, and (iii) costs and profits generated and held outside of Switzerland; (iv) the currency distribution of short-term monetary assets and liabilities; (v) the exposure to and (vi) the hedging strategy with regard to foreign currency risk; (vii) the sensitivity of net income or equity to changes in foreign exchange rates. We standardize the raw scores, ranging from 0 (worst) to 7 (best), for use in the regression analysis. See Appendix A for details. Market Value is the number of shares outstanding times the stock price at the end of each trading day (in CHF million). Share Turnover is the daily CHF trading volume divided by the market value at the end of the previous trading day. We compute Return Variability as the standard deviation of stock returns over half-hourly intervals on a given trading day. Int_Sales is the percentage of sales generated outside of Switzerland as shown in the most recent annual report. When exact data were missing (32 cases), we infer international sales from textual and other disclosures in the annual report. Total_Disc is a score, ranging from 1 (worst) to 6 (best), ranking the overall quality of a firm’s annual report taken from the 2014 rating as published by the Institute for Banking and Finance of the University of Zurich. Num_Analysts is the number of analysts in I/B/E/S that cover the firm (i.e., provide a one-year-ahead earnings per share forecast) before the SNB announcement. If analyst data are missing, we set the variable to zero. Free Float is the percentage of shares available to ordinary investors at the end of the most recent fiscal year (source: Datastream). We compute daily Stock Return as the natural logarithm of price at the end of trading over price at the end of the previous day. Stock price, spread, and volume data are from Bloomberg. For expositional purposes, we multiply bid-ask spreads, share turnover, return variability, and stock returns by 100, expressing them in basis points. We do not winsorize or truncate the data.

Table 2: Analysis of Daily Changes in Information Asymmetry around Swiss Franc Shock
(N = 4,949) [Days: -30 to +2]
(1) Log(Bid-Ask
Spread)
(2) Log(Bid-Ask
Spread)
(3) Log(Bid-Ask
Spread)
(4) Log(Bid-Ask
Spread)
(5) Log(Bid-Ask
Spread)
(6) Return
Variability Test Variables: Post_SNB 0.367*** – – – – – (3.30) Post_SNB ! FXRisk_Disc -0.103*** -0.105*** -0.113*** -0.104*** -0.105*** -0.125*** (-5.36) (-5.01) (-5.49) (-4.37) (-4.24) (-3.33) Control Variables: Log(Market Valuet-1) -0.243*** -0.293*** -0.277*** -0.288*** -0.299*** -0.197 (-3.94) (-4.79) (-5.10) (-4.76) (-4.27) (-1.43) Log(Share Turnovert-1) -0.028*** -0.022** -0.023** -0.023** -0.023** 0.018** (-3.00) (-2.52) (-2.56) (-2.57) (-2.53) (2.47) Log(Return Variabilityt-1) 0.061** 0.088*** 0.085*** 0.089*** 0.089*** 0.040** (2.49) (7.38) (7.03) (7.35) (7.50) (2.47) Post_SNB ! Int_Sales – – – 0.003 -0.018 – (0.05) (-0.28) Post_SNB ! Total_Disc – – – 0.006 0.006 – (0.17) (0.16) Post_SNB ! Num_Analysts – – – -0.005** -0.005** – (-2.29) (-2.32) Post_SNB ! Free Float – – – -0.154 -0.157 – (-1.26) (-1.39) Stock Returnt – – – – -0.005** – (-2.58) Post_SNB ! Stock Returnt – – – – -0.004 – (-1.19) Fixed Effects Firm Firm &
Day Firm &
Industry-Day Firm &
Industry-Day Firm &
Industry-Day Firm &
Day Adjusted R2 0.924 0.928 0.928 0.928 0.928 0.593
The sample comprises 151 firms that give rise to 4,949 firm-day observations over the [-30;+2] day period surrounding the SNB announcement to discontinue the minimum EUR-CHF exchange rate. We use the daily Bid-Ask Spread (Return Variability in column 6) as the dependent variable. We define Post_SNB as a binary indicator that takes on the value of ‘1’ beginning on day t = 0 of the SNB announcement (January 15, 2015). To measure the quality of a firm’s foreign exchange risk disclosures, we construct FXRisk_Disc by scoring seven disclosure items as reported in the most recent annual report before the event. For details on the remaining variables see Table 1. We include firm, day, or one-digit SIC industry-day fixed effects in the regressions, but do not report the coefficients. If indicated, we use the natural log of the raw values, and lag the variables by one day. The table reports OLS coefficient estimates and (in parentheses) t-statistics based on robust standard errors clustered by firm and day. ***, **, and * indicate statistical significance at the 1%, 5%, and 10% levels (two-tailed).

Table 3: Analysis of Intraday Changes in Information Asymmetry around Swiss Franc Shock
Log(Bid-Ask Spread) as Dependent Variable
(1) [Days: -30 to 0] (2)
[Days: 0] Test Variables: 09:00-09:30 Dummy -0.025* (-1.73) – 09:00-09:30 Dummy ! FXRisk_Disc -0.005 (-0.23) -0.022 (-1.00) 09:30-10:00 Dummy 0.022 (1.49) – 09:30-10:00 Dummy ! FXRisk_Disc -0.037 (-1.63) -0.045 (-1.52) 10:00-10:30 Dummy 0.030** (2.00) – 10:00-10:30 Dummy ! FXRisk_Disc 0.006 (0.45) -0.003 (-0.14) 10:30-11:00 Dummy 0.701*** (22.71) – 10:30-11:00 Dummy ! FXRisk_Disc -0.057 (-1.55) -0.079* (-1.92) 11:00-11:30 Dummy 0.902*** (27.17) – 11:00-11:30 Dummy ! FXRisk_Disc -0.122*** (-3.06) -0.159*** (-3.86) 11:30-12:00 Dummy 0.753*** (26.34) – 11:30-12:00 Dummy ! FXRisk_Disc -0.074*** (-2.63) -0.107** (-2.91) 12:00-12:30 Dummy 0.836*** (25.05) – 12:00-12:30 Dummy ! FXRisk_Disc -0.146*** (-3.95) -0.164*** (-4.23) 12:30-13:00 Dummy 0.911*** (26.78) – 12:30-13:00 Dummy ! FXRisk_Disc -0.206*** (-6.10) -0.197*** (-6.21) 13:00-13:30 Dummy 0.730*** (20.12) – 13:00-13:30 Dummy ! FXRisk_Disc -0.183*** (-5.14) -0.202*** (-4.66) 13:30-14:00 Dummy 0.693*** (19.99) – 13:30-14:00 Dummy ! FXRisk_Disc -0.169*** (-5.12) -0.179*** (-4.73) 14:00-14:30 Dummy 0.615*** (22.62) – 14:00-14:30 Dummy ! FXRisk_Disc -0.137*** (-4.76) -0.142*** (-4.10) 14:30-15:00 Dummy 0.486*** (22.85) – 14:30-15:00 Dummy ! FXRisk_Disc -0.117*** (-4.94) -0.131*** (-4.26) 15:00-15:30 Dummy 0.426*** (18.61) – 15:00-15:30 Dummy ! FXRisk_Disc -0.061** (-2.15) -0.072* (-2.12) 15:30-16:00 Dummy 0.373*** (16.51) – 15:30-16:00 Dummy ! FXRisk_Disc -0.072*** (-2.76) -0.080** (-2.40) 16:00-16:30 Dummy 0.328*** (13.80) – 16:00-16:30 Dummy ! FXRisk_Disc -0.096*** (-4.08) -0.133*** (-3.94) 16:30-17:00 Dummy 0.386*** (15.05) – 16:30-17:00 Dummy ! FXRisk_Disc -0.127*** (-4.92) -0.151*** (-4.08) 17:00-17:30 Dummy 0.309*** (14.14) – 17:00-17:30 Dummy ! FXRisk_Disc -0.139*** (-6.29) -0.172*** (-5.02) Control Variables Included Included Fixed Effects Firm & Time-of-Day Time-of-Day Adjusted R2 0.850 0.650 N 64,012 2,112
The sample comprises 151 firms that give rise to 64,012 (2,112) firm-intraday observations over the [-30;0] day period leading up to (on day t = 0 of) the SNB announcement to discontinue the minimum EUR-CHF exchange rate. The announcement took place at 10:30 am on January 15, 2015. We use the intraday Bid-Ask Spread as dependent variable (log transformed), and compute it as the mean of minute-by-minute differences between bid and ask quotes (divided by the mid-point) over 30-minute intervals. For each 30-minute interval i during trading hours (i.e., from 9 am to 5:30 pm) we construct a binary indicator that takes on the value of ‘1’ during that time slot. For instance, the 11:30-12:00 Dummy represents the 30 minutes from 11:30 am to noon. Technically, the first time slot of the day only comprises 28 minutes as SIX opens trade in each share at random within the first two minutes; the last slot of the day only comprises 20 minutes before the closing auction begins. To measure the quality of a firm’s foreign exchange risk disclosures, we construct FXRisk_Disc by scoring seven disclosure items as reported in the most recent annual report before the event. We include the natural logs of Market Value, Share Turnover, and Return Variability (computed similarly as in Table 1, but at the end of each trading interval i) as control variables, each lagged by 17 trading intervals, as well as firm and time-of-day fixed effects in the regressions, but do not report the coefficients. The table reports OLS coefficient estimates and (in parentheses) t-statistics based on robust standard errors clustered by firm and trading interval. ***, **, and * indicate statistical significance at the 1%, 5%, and 10% levels (two-tailed).

Table 4: Survey of Sell-Side Analysts – Information Sources to Assess Economic Impact of Swiss Franc Shock Panel A: Short-term Information Sources
Question 8: Immediately after the SNB announcement (i.e., within the first one or two days), how important were the following information sources for your assessment of the impact of the Swiss franc shock on a typical firm you followed? [7-point Likert Scale: 1 to 7]
Responses (Maximum possible N = 76)
Significantly Different Than [4 = Neutral]
% of Respondents Who Answered
Average Rating
Significantly Different Than
Extremely Important [6 or 7]
Not at all Important [1 or 2]
(1) Personal experience including company/industry knowledge 5.84 *** 3-9 72.00 5.33 (2) Private communication with management or investor relations 5.61 *** 4-9 68.42 10.53 (3) Existing annual reports or other financial filings 5.35 *** 1 and 5-9 57.33 9.33 (4) Ad hoc information provided by the firm after the shock 4.91 *** 1-3 and 5-9 48.68 18.42 (5) Commercial data providers (e.g., Bloomberg) 4.00 1-4 and 7-9 24.32 24.32 (6) Stock price reactions 3.97 1-4 and 8-9 27.03 29.73 (7) Peer firms (e.g., other firms’ ad hoc information) 3.42 *** 1-6 and 8-9 9.46 35.14 (8) Media coverage (e.g., press articles, TV features) 2.76 *** 1-7 and 9 5.41 54.05 (9) Peer analysts (e.g., other analysts’ forecasts revisions) 2.14 *** 1-8 0.00 67.12
Panel B: Medium-term Information Sources
Question 9: Relative to the previous question, which information sources gained or lost importance in the two to three weeks following the SNB announcement for your assessment of the impact of the Swiss franc shock on a typical firm you followed? [3-point Likert Scale: 1 to 3]
Responses (Maximum possible N = 76)
Significantly Different Than [2 = Similar Importance]
% of Respondents Who Answered
Average Rating
Significantly Different Than
Gained Importance
[3]
Lost Importance
[1] (1) Private communication with management or investor relations 2.37 *** 3-9 44.74 7.89 (2) Ad hoc information provided by the firm after the shock 2.32 *** 3-9 36.00 4.00 (3) Personal experience including company/industry knowledge 2.13 ** 1-2 and 6-9 22.67 9.33 (4) Stock price reactions 2.03 1-2 and 9 24.00 21.33 (5) Peer firms (e.g., other firms’ ad hoc information) 1.97 1-2 and 8-9 14.86 17.57 (6) Existing annual reports or other financial filings 1.89 1-3 13.33 24.00 (7) Commercial data providers (e.g., Bloomberg) 1.86 ** 1-3 6.76 20.27 (8) Peer analysts (e.g., other analysts’ forecasts revisions) 1.80 *** 1-5 6.76 27.03 (9) Media coverage (e.g., press articles, TV features) 1.76 *** 1-5 8.11 32.43
The sample comprises up to 76 answers from respondents to a survey sent to sell-side analysts covering at least one firm listed on SIX during the SNB announcement. The table lists the average ratings (in decreasing order) of the responses to the survey question indicated in the table header as well as the percentages of responses in the two tails of the Likert scale. We also report the results from t-tests comparing the average rating of an item to the mid-point (where ***, **, and * stand for statistical significance at the 1%, 5%, and 10% levels) and to the average ratings of all the other items. For the latter test, we report the item numbers that are statistically different at the 10% level, using Bonferroni-Holm adjusted p-values to correct for multiple pair-wise comparisons.
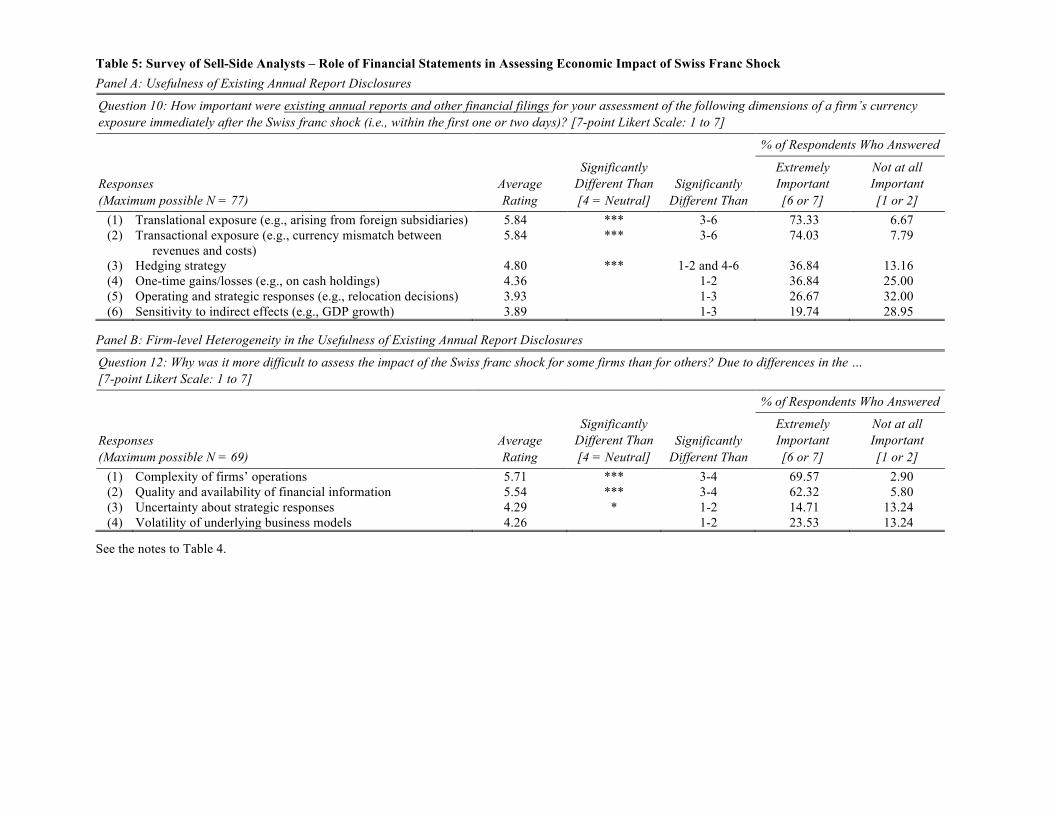
Table 5: Survey of Sell-Side Analysts – Role of Financial Statements in Assessing Economic Impact of Swiss Franc Shock Panel A: Usefulness of Existing Annual Report Disclosures
Question 10: How important were existing annual reports and other financial filings for your assessment of the following dimensions of a firm’s currency exposure immediately after the Swiss franc shock (i.e., within the first one or two days)? [7-point Likert Scale: 1 to 7]
Responses (Maximum possible N = 77)
Significantly Different Than [4 = Neutral]
% of Respondents Who Answered
Average Rating
Significantly Different Than
Extremely Important [6 or 7]
Not at all Important [1 or 2]
(1) Translational exposure (e.g., arising from foreign subsidiaries) 5.84 *** 3-6 73.33 6.67 (2)
Transactional exposure (e.g., currency mismatch between
revenues and costs) 5.84
***
3-6
74.03
7.79
(3) Hedging strategy 4.80 *** 1-2 and 4-6 36.84 13.16 (4) One-time gains/losses (e.g., on cash holdings) 4.36 1-2 36.84 25.00 (5) Operating and strategic responses (e.g., relocation decisions) 3.93 1-3 26.67 32.00 (6) Sensitivity to indirect effects (e.g., GDP growth) 3.89 1-3 19.74 28.95
Panel B: Firm-level Heterogeneity in the Usefulness of Existing Annual Report Disclosures
Question 12: Why was it more difficult to assess the impact of the Swiss franc shock for some firms than for others? Due to differences in the … [7-point Likert Scale: 1 to 7]
Responses (Maximum possible N = 69)
Significantly Different Than [4 = Neutral]
% of Respondents Who Answered
Average Rating
Significantly Different Than
Extremely Important [6 or 7]
Not at all Important [1 or 2]
(1) Complexity of firms’ operations 5.71 *** 3-4 69.57 2.90 (2) Quality and availability of financial information 5.54 *** 3-4 62.32 5.80 (3) Uncertainty about strategic responses 4.29 * 1-2 14.71 13.24 (4) Volatility of underlying business models 4.26 1-2 23.53 13.24
See the notes to Table 4.

Table 6: Survey of Investor Relations Managers – Demand for and Sources of Information on Economic Impact of Swiss Franc Shock Panel A: Recipients of Internal and External Communication
Question 5: How important were the following internal and external stakeholders in your decision to start communicating about the impact of the Swiss franc shock on your firm? [7-point Likert Scale: 1 to 7]
Responses (Maximum possible N = 39)
Significantly Different Than [4 = Neutral]
% of Respondents Who Answered
Average Rating
Significantly Different Than
Extremely Important [6 or 7]
Not at all Important [1 or 2]
(1) Financial analysts (sell-side or buy-side) 6.13 *** 2-8 74.36 0.00 (2) Institutional investors 5.72 *** 1 and 4-8 64.10 5.13 (3) Management or other internal departments (e.g., accounting) 5.38 *** 1 and 5-8 64.10 12.82 (4) Media and financial press 5.08 *** 1-2 and 5-8 38.46 7.69 (5) Suppliers and customers 3.95 1-4 and 7-8 15.38 20.51 (6) Banks and other lending institutions 3.79 1-4 12.82 25.64 (7) Retail investors 3.38 ** 1-4 7.69 35.90 (8) External audit firm 3.23 *** 1-5 10.26 43.59
Panel B: Information Sources for External Communication
Question 6: How important were the following information sources for your own preparation in advance of your communication with external stakeholders about the impact of the Swiss franc shock? [7-point Likert Scale: 1 to 7]
Responses (Maximum possible N = 39)
Significantly Different Than [4 = Neutral]
% of Respondents Who Answered
Average Rating
Significantly Different Than
Extremely Important [6 or 7]
Not at all Important [1 or 2]
(1) Consultation with key management (e.g., CFO) 6.21 *** 2-6 78.95 0.00 (2) Existing internal reports (other than financial statements) 5.10 *** 1 and 4-6 51.28 10.26 (3) Existing annual reports or other financial filings 4.85 *** 1 and 6 30.77 2.56 (4) Newly prepared ad hoc information and reports 4.36 1 and 6 35.90 25.64 (5) Feedback from analysts, the media, or the stock market 4.26 1-3 and 6 28.21 12.82 (6) Consultation with outside experts, auditors, suppliers, etc. 2.95 *** 1-5 5.13 48.72
The sample comprises up to 39 answers from respondents to a survey sent to investor relations managers at firms listed on SIX that were potentially affected by the SNB announcement. The table lists the average ratings (in decreasing order) of the responses to the survey question indicated in the table header as well as the percentages of responses in the two tails of the Likert scale. We also report the results from t-tests comparing the average rating of an item to the mid-point (where ***, **, and * stand for statistical significance at the 1%, 5%, and 10% levels) and to the average ratings of all the other items. For the latter test, we report the item numbers that are statistically different at the 10% level, using Bonferroni-Holm adjusted p-values to correct for multiple pair-wise comparisons.

Table 7: Survey of Investor Relations Managers – Communication with External Stakeholders about Economic Impact of Swiss Franc Shock Panel A: Communication Channels for Initial Response
Question 8: Immediately after the SNB announcement (i.e., within the first one or two days), how important were the following channels for your firm’s communication with external stakeholders about the impact of the Swiss franc shock? [7-point Likert Scale: 1 to 7]
Responses (Maximum possible N = 39)
Significantly Different Than [4 = Neutral]
% of Respondents Who Answered
Average Rating
Significantly Different Than
Extremely Important [6 or 7]
Not at all Important [1 or 2]
(1) Private communication with analysts or investors 5.31 *** 2-4 66.67 15.38 (2)
Presentations and Q&A at already pre-scheduled events (e.g.,
investor days or conference calls) 4.41
4
43.59
30.77
(3) Communication through media and financial press 3.74 1 and 4 17.95 30.77 (4) Ad hoc announcements or press releases 2.36 *** 1-3 5.13 64.10
Panel B: Firm-level Heterogeneity in the Initial Response
Question 10: What motives did prevent you from communicating more proactively with external stakeholders about the impact of the Swiss franc shock? Please indicate the importance of the following motives. [7-point Likert Scale: 1 to 7]
Responses (Maximum possible N = 36)
Significantly Different Than [4 = Neutral]
% of Respondents Who Answered
Average Rating
Significantly Different Than
Extremely Important [6 or 7]
Not at all Important [1 or 2]
(1) Upcoming regular financial filings or pre-scheduled events 4.56 5-8 44.12 20.59 (2) Uncertainty about development of foreign exchange rates 4.34 5-8 20.00 17.14 (3) Limited impact of Swiss franc shock on firm 4.25 8 27.78 22.22 (4)
Little perceived information needs (e.g., existing annual reports
or other financial filings provide accurate picture) 4.15
8
20.59
14.71
(5) Uncertainty about the effect of Swiss franc shock on firm 3.57 1-2 and 8 22.86 40.00 (6) Attracting unwanted scrutiny by investors, lending banks, etc. 3.29 ** 1-2 17.65 44.12 (7)
Fear of setting a disclosure precedent that might be difficult to
maintain or is inconsistent with current policies 3.15
***
1-3
8.82
38.24
(8) Giving away company secrets or harming competitive position 2.80 *** 1-5 2.86 45.71
See the notes to Table 6.

1
Appendix A: Construction of Foreign Exchange Risk Disclosure Score (FXRisk_Disc)
A.1. Components of FXRisk_Disc
We capture the quality of a firm’s exchange risk disclosures with a manually coded score
(FXRisk_Disc), ranging from 0 to 7. Higher values represent better disclosures. FXRisk_Disc
comprises seven items. We award each item either 1, 0.5, or 0 points. We identify these items
by scouring several disclosures that were released after the 2015 SNB announcement to
discontinue the minimum EUR-CHF exchange rate (e.g., the “events after the balance sheet date”
and “outlook” sections of the 2014 annual reports, press releases, or analyst presentations) for a
randomly selected group of firms. We choose this timing because we want to determine – in
hindsight – which disclosure items likely were informative for investors to assess the effect of the
Swiss franc shock, and then check whether firms already provided these items beforehand.
Item I captures the fraction of revenues that are generated outside of Switzerland (“Revenues
Generated Abroad”). The higher a firm’s proportion of international sales, the more sensitive it
should react to currency fluctuations, assuming there is at least some degree of price elasticity.
Item II provides information about the geographical distribution of a firm’s assets and, indirectly,
about its cost structure (“Assets Held Abroad”). If these are monetary assets denominated in
foreign currencies or non-current assets bounded to a specific location (i.e., non-transferable), then
a sudden shock to the exchange rate might reduce their value in CHF. On the flip side, the effects
of currency fluctuations might be mitigated through expenses that are denominated in the same
foreign currencies. Item III reflects the geographical distribution of costs and/or profits (“Costs
Incurred/Profits Generated Abroad”). A shock to CHF exchange rates should have less of an
effect on firms with a larger fraction of their costs incurring abroad. Item IV considers the
currency denominations of short-term financial positions (“Currency Distribution of Short-term
Monetary Assets and Liabilities”). This information allows investors to assess the impact of

2
one-time translational gains and losses on cash and near-cash balance sheet items. Item V
captures the aggregate foreign currency information of the entire balance sheet in all major
currencies (“Foreign Currency Exposure”). Firms sometimes report the non-functional currency
holdings of the group companies and not the aggregate foreign currency positions per se. Item VI
provides information on a firm’s hedging strategy with respect to foreign exchange risk (“Hedging
of Foreign Currency Risk”). Currency hedges should reduce the effects of sudden exchange rate
fluctuations. Item VII provides a direct estimate of the translational effects of a (hypothetical)
percentage change in exchange rates on net income and/or shareholders’ equity (“Sensitivity of Net
Income or Equity to Foreign Exchange Rate Changes”). Table A1 details the coding guidelines
we used to construct the FXRisk_Disc score.
An important feature of the FXRisk_Disc score is that it does not capture the actual currency
risk exposure, but rather the firm’s information policy regarding this risk. For example, we assign
the same score to a firm with no hedging strategy that discloses this fact as to a firm with very
detailed quantitative disclosures on how it is hedging currency risks. Furthermore, there likely
exist interdependencies among the disclosure items. For example, investors might put more
weight on the disclosures of the geographical asset distribution if a cost split by country is missing.
Aggregating multiple items into a single score should help us to capture the overall quality of these
disclosures, and at the same time reduce measurement error.
A.2. Data Collection Process
We start the data collection process by downloading the most recent annual reports for the
sample firms that were available before the SNB announcement (i.e., for the fiscal year 2013).
We use the English language version of the reports if available. For each disclosure item, we
electronically search the respective document using keywords like “currency,” “foreign
exchange,” “Euro,” etc. In addition, we read the potentially relevant sections of the annual
reports (e.g., footnotes on segment reporting and risk disclosures). Once we have identified all

3
the relevant passages with regard to a firm’s foreign currency risk exposure, we apply the coding
guidelines depicted in Table A1. The coding is done through the lens of an investor who tries to
gauge the exposure of a firm to the Swiss franc shock. Table A2 provides illustrative examples
for the seven disclosure items. Each example represents an excerpt from the annual report of a
different firm, which has received a full score for the respective item. Notably, the level of detail
and the format vary substantially across firms. Some firms provide the information in the form of
a textual description (qualitative or quantitative), others in the form of a table or figure.
The data collection concludes with the computation of the aggregate FXRisk_Disc score. In
Table A3, we provide descriptive statistics on the scoring of the seven items for the 151 sample
firms. Disclosures on the geographical distribution of revenues and assets as well as information
on the hedging strategy are by far the most common, with more than 70 percent of the firms
receiving full scores. 59 percent also provide quantitative measures of the economic sensitivities
of currency rate fluctuations. The remaining disclosure items are less widely used with only
about 25 percent of firms receiving full scores.

4
Table A1: Coding Guidelines for Construction of FXRisk_Disc
Disclosure Item Coding Explanation I. Revenues generated
abroad We search for tables, figures, or text explaining revenues generated in Switzerland versus abroad. We award 1 point if the firm separately lists this information among its geographical segment disclosures or we can determine it from comparable sources (e.g., the firm states that it exclusively operates in Switzerland). We award 0.5 points if the firm only provides qualitative information on foreign revenues, or does not report foreign revenues for all of its major segments. We award 0 points otherwise.
II. Assets held abroad We search for tables, figures, or text explaining the portion of non-current, operating, or total assets located in Switzerland versus abroad. We award 1 point if the firm separately lists this information among its geographical segment disclosures or we can determine it from comparable sources (e.g., the firm states that it exclusively operates in Switzerland). We award 0.5 points if the firm only provides qualitative information on foreign assets. We award 0 points otherwise.
III. Costs incurred/profits generated abroad
We search for tables, figures, or text explaining the portion of costs incurred and/or profits generated in Switzerland versus abroad (in CHF versus other currencies). We award 1 point if the firm separately lists this information among its geographical segment disclosures or we can determine it from comparable sources. We also award 1 point if the firm provides information on the sensitivity of its profit margin to currency fluctuations. We award 0.5 points if the firm only provides partial information on the cost and profit distribution by currency (e.g., purchases or sourcing by country). We award 0 points otherwise.
IV. Currency distribution of short-term monetary assets and liabilities
We search for tables, figures, or text explaining the portion of short-term monetary assets and liabilities held in Switzerland versus abroad (in CHF versus other currencies). We award 1 point (0.5 points) if the firm lists this information for at least two (one) of the following items: cash and cash-equivalents, accounts receivables, or accounts payables. We award 0 points otherwise.
V. Foreign currency exposure
We search for tables, figures, or text explaining the (net) currency exposure of the firm, either on the aggregate group level or on the level of the individual group companies if non-functional currency holdings are shown. We award 1 point if the firm details its currency exposure by (major) balance sheet item. We award 0.5 points if the firm provides aggregate information on its currency exposure. We award 0 points otherwise.
VI. Hedging of foreign currency risk
We search for tables, figures, or text explaining the firm’s strategy of hedging foreign currency risk. We award 1 point if the firm provides quantitative information on its hedging strategy (e.g., a table showing currency forwards). The firm also receives 1 point if it indicates that it does not hedge its foreign currency exposure. We award 0.5 points if the firm provides qualitative (or incomplete) information on its hedging strategy. We award 0 points for missing or boilerplate disclosures.
VII. Sensitivity of net income or equity to foreign exchange rate changes
We search for tables, figures, or text explaining the sensitivity of net income and/or shareholders’ equity to changes in CHF exchange rates. We award 1 point if the firm provides information on the (hypothetical) translational effect of a percentage change in exchange rates. We award 0.5 points if the firm only provides qualitative information on exchange rate sensitivity or does not refer to specific percentage changes (e.g., provides the Value-at-Risk of its currency exposure). We award 0 points for missing or boilerplate disclosures (or if the disclosures exclusively relate to non-CHF exchange rates).
The table presents details on the scoring instructions for the seven items that make up the variable FXRisk_Disc, which we use to measure the quality of a firm’s foreign exchange risk disclosures. Each disclosure item receives a score of 1, 0.5, or 0 points. FXRisk_Disc is the sum of points assigned to the seven items.

5
Table A2: Illustrative Examples of Company Disclosures for Components of FXRisk_Disc Panel A: Item I – Revenues generated abroad
Source: Bell, Annual Report 2013, p. 33
Panel B: Item II – Assets held abroad
Source: Nobel Biocare, Annual Report 2013, p. 97
Panel C: Item III – Costs incurred/profits generated abroad
Source: Clariant, Annual Report 2013, p. 80
(Continued)
Sales by country
Switzerland � ��� ��� � ��� ���
Germany ��� ��� ��� ���
France ��� ��� ��� ���
Spain, Benelux �� ��� �� ���
Eastern Europe ��� ��� ��� ���
Sales by country � ��� ��� �.� � � ��� ���
!"#$%&&'(%)*'+$',$%--#)-$*-$.%-#/$'+$)"#*0$1#'10%2"*(%&$&'(%)*'+$%+/$*-$%-$,'&&'3-4$
*+$567$)"'8-%+/- ! "#$%$ ! "#$"$
! $ ! &'()*)'+$
6+*)#/$9)%)#- $ :;<=>?$ $ ;@<ABC$
D-0%#& $ A;<>;E$ $ AA<B@:$
93#/#+ $ B=<?@E$ $ BE<?@E$
$ B;<?AE$ $ B:<:;>$
F)"#0$('8+)0*#- $ B@<C>@$ $ =:<AEA$
! ",-.#/%$ ! "0/./"-$
$ B<>;>$ $ B<E=C$
G#,#00#/$)%H$%--#)- $ ?B<;:C$ $ ?:<:>E$
! "0$."$,$ ! "12."1%$
$
$ $ $ $ $
$ $ ! $ ! $
! $ ! $
$ $ $ $
$ $ $ $
$ $ $ $
$ $ $ $
$ $ $ $
! $ ! $
$ $ ! $ ! $
! $ ! $
$ $ $ $ $ $ $
$ $ $ $ $ $ $
$ $ $ $ $ $ $
$ $ $ $ $ $ $
$ $ $ $ $
! $ ! $
$ $ $ $ $ $ $ $ $ $ $ $ $ $ $ $ $ $ $$ $ $ $ $ $ $ $ $ $ $ $ $ $ $ $ $ $ $ $$ $ $ $ $ $ $ $ $ $ $ $ $ $
� �
�
� �
� � � �� �
� � �
� �
� �
� �
� � � � �
� �
� � � � �
�
�
�
�
COST�STRUCTURE�BY�CURRENCY������in %
Euro ��
US�dollar ��
Japanese�yen �
Swiss�franc �
Emerging�markets ��
�
�
� �
�
�
� �

6
Table A2 (continued) Panel D: Item IV – Currency distribution of short-term monetary assets and liabilities
Source: Calida, Annual Report 2013, p. 34 and p. 39
Panel E: Item V – Foreign currency exposure
Source: Belimo, Annual Report 2013, p. 72
Panel F: Item VI – Hedging of foreign currency risk
Source: Cembra Money Bank, Annual Report 2013, p. 53
(Continued)
The following table shows the foreign exchange risks from financial instruments whose currency differs from the functional currency of the Group company holding them.
in CHF 1 000 AUD CAD CHF EUR GBP HKD PLN USD
At December 31, 2013
Cash and cash equivalents 3 381 10 688 343 15 238 1 268 94 744 6 137
Trade accounts receivable 570 2 829 441 13 134 1 969 2 023 2 491 14 160
Other receivables 9 6 130
Financial assets 35
Trade accounts payable – 5 766 – 2 283 – 1 349
Other payables – 111 – 847 – 245 – 772
Current financial liabilities – 1 264
Currency exposure 3 951 13 406 – 5 829 24 588 3 237 2 123 3 235 18 340
The Group borrows and lends exclusively
in Swiss francs. Its exposure to FX fluc-
tuations is limited to that derived from
supplier invoices denominated in foreign
currencies. The Group monitors such FX
exposure closely, and takes immediate
action if it exceeds internally set trig-
gers. As at 31 December 2013, the Group
does not use hedging instruments to
manage its FX risk.

7
Table A2 (continued) Panel G: Item VII – Sensitivity of net income or equity to foreign exchange rate changes
Source: Cicor, Annual Report 2013, p. 73
The table presents examples taken from firms’ annual reports for each of the seven items that make up the variable FXRisk_Disc. Each illustrative disclosure item shown in the panels received a score of 1 point (out of 1, 0.5, or 0 points). FXRisk_Disc is the sum of points assigned to the seven items.
A 5 % strengthening of a certain currency would have increased the currency gain or loss on the basis of the foreign currency balances as of 31 December in the listed way. This analysis assumes that all other variables remain unchanged:
2013 in CHF 1 000 currency loss currency gain
5 % revaluation of EUR vs. CHF – 1855 % revaluation of EUR vs. RON 37 –5 % revaluation of RON vs. CHF 3 –5 % revaluation of USD vs. CHF 135 –5 % revaluation of USD vs. RON 72 –5 % revaluation of USD vs. SGD – 248

8
Table A3: Descriptive Statistics of Components of FXRisk_Disc
Disclosure Item (N = 151)
Scoring Totals (in %) Mean
1 point 0.5 points 0 points I. Revenues generated abroad 78.81 % 12.58 % 8.61 % 0.85 II. Assets held abroad 73.51 % 4.64 % 21.85 % 0.76 III. Costs incurred/profits generated abroad 15.89 % 8.60 % 75.50 % 0.20 IV. Currency distribution of short-term
monetary assets and liabilities 25.17 % 22.52 % 52.32 % 0.36
V. Foreign currency exposure 24.50 % 9.93 % 65.56 % 0.29 VI. Hedging of foreign currency risk 84.11 % 7.95 % 7.95 % 0.88 VII. Sensitivity of net income or equity to foreign
exchange rate changes 58.94 % 15.89 % 25.17 % 0.67
The table presents descriptive statistics on the scoring of the seven items that make up the variable FXRisk_Disc. Each disclosure item receives a score of 1, 0.5, or 0 points. FXRisk_Disc is the sum of points assigned to the seven items. The sample comprises 151 firms listed on the Swiss exchange (SIX) during the SNB announcement to discontinue the minimum EUR-CHF exchange rate on January 15, 2015.

9
Appendix B: Sell-Side Analysts Survey
We developed our initial draft of the sell-side analyst survey after an extensive review of the
related literature (e.g., Brown et al. 2015, 2016; Dichev et al. 2013; Nelson and Skinner 2013;
Graham et al. 2005). We circulated the draft among several academics and practitioners to gain
feedback, and implemented the revised version of the survey in Qualtrics, an online survey tool.
The survey comprises 15 questions, divided into four topical sections, and is followed by a number
of demographical questions. We display each survey section en bloc, but respondents have the
possibility to skip certain questions and/or answers and can exit the survey at any point in time.1
Wherever possible, we randomize the order of the answering choices. However, we do not
randomize the order of the questions to not interrupt the logical flow of the survey.2
To identify a pool of suitable survey subjects we collect the names and contact information of
all sell-side analysts covering at least one sample firm during the event period. We search the
following four information sources: (1) companies’ investor relations websites; (2) analyst
coverage information as provided by S&P Capital IQ; (3) analyst coverage information as
provided on the website of the Swiss Exchange (SIX); and (4) author information from actual
analyst reports collected from Investext. The first two sources do not provide historical data, and
hence yield coverage information as of February and March 2016 (i.e., the time of data collection).
The latter two sources allow us to identify analyst coverage as of a specific point in time. We use
the SIX website to extract the names of all analysts who issued an opinion on a specific firm in the
60 days following the event date (January 15, 2015). In addition, we scour the analyst reports on
Investext that were issued over the same time frame for information on authorship (including
analyst team members). We then update analysts’ contact information based on the more recent
data from S&P Capital IQ and company websites, and discard analysts who left the profession in
1 In addition, we split the third section of the survey into two screens (i.e., Questions 8 and 9 are displayed together and separately from Question 10) to avoid any focus on “existing annual reports,” which is the topic of Question 10. 2 The survey instrument is available upon request from the authors.

10
the interim or vanished from the database. We further exclude analysts working for one of the
three major banks in Switzerland, because we approach them using a slightly different method
(described below). This procedure allowed us to identify 773 sell-side analysts who covered a
sample firm during the event, of which 743 turned out to have a valid e-mail address. We use the
latter number to calculate the response rate for this group.
We sent out a personalized e-mail with a survey link to the subjects on April 12, 2016. The
e-mail explained why we address them and the general purpose of the survey, however, we did not
mention that we were examining the usefulness of financial statement information for the
assessment of the Swiss franc shock. The e-mail also indicated the length of the survey and the
confidentiality of the responses. We sent out a reminder to non-responders after one week and
again after four weeks, but only if they were working for brokerage houses whose policy was not
to disallow survey participation or if they were covering multiple Swiss firms. We received a
total of 66 responses until the end of May 2016, giving rise to a response rate of 8.9%. This
number is rather conservative as our pool of subjects contains many analysts who were only
tangentially affected by the Swiss franc shock (e.g., analysts from U.S. brokerage houses that only
covered one single large-cap Swiss firm such as Nestlé).
For the analysts at the three major Swiss banks, we relied on personal contacts (i.e., senior
analysts or analyst team leaders) to forward the original e-mail to the people on our subjects’ list.
These e-mails were sent in April and May 2016, and were followed up with two reminders. We
received 11 responses out of 72 possible, yielding a response rate of 15.3% for this subset. In
what follows, we report the demographics of all the 77 respondents to our sell-side analyst survey
(Table B1) together with the responses to the survey questions not tabulated in the main text
(Tables B2 to B4).

11
Table B1: Demographics of the Respondents to the Sell-Side Analysts Survey
(Maximum possible N = 77) Sample % Sample % Primary Industries Covered Age of Analyst
Retail/Wholesale 10.34 <30 12.99 Construction 6.03 30 – 39 33.77 Chemicals 4.31 40 – 49 37.66 Software/Technology 6.03 50 – 59 14.29 Health care/Pharmaceuticals/
Biotechnology 6.03 60+ 1.30
Telecommunications/Media 4.31 Insurance 7.76 Education of Analyst Real estate 3.45 Bachelor’s degree 15.58 Banks and other Finance 8.62 Master’s degree 54.55 Manufacturing consumer goods 11.21 CPA, CFA, or AZEK degree* 23.38 Manufacturing industrials 17.24 Ph.D./doctoral degree 2.60 Consulting/Business services 3.45 Other 3.90 Transportation/Energy/Utilities 8.62 Other 2.59 Years as Sell-Side Analysts
<4 years 19.48 Number of Industries Covered 4 – 9 years 31.17
1 40.26 10+ years 49.35 2 – 3 49.35 4+ 10.39 Size of Current Employer
One sell-side analyst 0.00 Number of Firms Covered 2 – 4 sell-side analysts 6.49
1 2.60 5 – 10 sell-side analysts 7.79 2 – 4 7.79 11 – 25 sell-side analysts 29.87 5 – 9 23.38 26 – 50 sell-side analysts 12.99 10 – 15 49.35 More than 50 sell-side analysts 42.86 16 – 25 12.99 25+ 3.90 Headquarter of Current Employer
Switzerland 40.26 % of Swiss Firms Covered Rest of Europe 42.86
0 % 0.00 USA 11.69 1 – 24 % 46.75 Rest of World 5.19 25 – 49 % 14.29 50 – 74 % 6.49 75 – 99 % 7.70 100 % 24.68
* CPA = Certified Public Accountant; CFA = Chartered Financial Analyst; AZEK = Degree of the Swiss Training Center for Investment Professionals. The table lists the demographic information of the participants in the survey sent to sell-side analysts covering at least one firm listed on SIX during the SNB announcement (77 answers).

12
Table B2: General Information About Analysts’ Perception of the Swiss Franc Shock Panel A: Importance of Foreign Currency Exposure Before Swiss Franc Shock
Question 1: Before the Swiss franc shock, how important was the foreign currency exposure of a typical Swiss firm you followed for your earnings forecasts and stock recommendations? [7-point Likert Scale: 1 to 7]
Responses (N = 77)
Average Rating
Significantly Different Than [4 = Neutral]
Not at all Important [1 or 2]
Neutral [3 to 5]
Extremely Important [6 or 7]
% of respondents who answered 4.88 *** 10.39 53.24 36.36
Panel B: Expectations about Occurrence of Swiss Franc Shock in the Future
Question 2: As of the beginning of January 2015 (i.e., directly before the Swiss franc shock), when did you expect that the Swiss National Bank would most likely abandon the minimum Euro exchange rate, if at all? [Multiple Choice]
Responses (N = 77)
Within the Next Not in the Foreseeable
Future 3 Months 3 to 6 Months 6 to 12 Months 12 to 24 Months
% of respondents who answered 2.60 2.60 14.29 22.08 58.44
Panel C: Percentage of Covered Firms Affected by Swiss Franc Shock
Question 3: What percentage of Swiss firms you followed was at least somewhat affected by the SNB announcement (positively or negatively)? [0 – 100 %]
Responses (N = 77) 0 – 24 % 25 – 49 % 50 – 74 % 75 – 99 % 100 %
% of respondents who answered 7.80 2.60 3.90 15.59 70.13
Panel D: Impact of Swiss Franc Shock on Typical Firm
Question 4: How has the Swiss franc shock affected the typical Swiss firm in your portfolio? [5-point Likert Scale: 1 to 5]
Responses (N = 77)
Average Rating
Significantly Different Than [3 = Neutral]
Negatively [1 or 2]
Neutral [3]
Positively [4 or 5]
% of respondents who answered 1.94 *** 84.42 15.58 0.00
(Continued)

13
Table B2 (continued) Panel E: Importance of Foreign Currency Exposure After Swiss Franc Shock
Question 15: After the Swiss franc shock, how important is the foreign currency exposure of a typical Swiss firm you follow for your earnings forecasts and stock recommendations? [7-point Likert Scale: 1 to 7]
Responses (N = 77)
Average Rating
Significantly Different Than [4 = Neutral]
Not at all Important [1 or 2]
Neutral [3 to 5]
Extremely Important [6 or 7]
% of respondents who answered 5.52 *** 1.30 46.76 51.95
The sample comprises up to 77 answers from respondents to a survey sent to sell-side analysts covering at least one firm listed on SIX during the SNB announcement. The panels list the average ratings of the responses to the survey question indicated in the panel header as well as the percentages of responses in various bins of the Likert scale (or any other scale mentioned in the question). If applicable, we report the results from t-tests comparing the average rating of an item to the mid-point (where ***, **, and * stand for statistical significance at the 1%, 5%, and 10% levels). If multiple selections are available, we also compare the average rating of an item to the average ratings of all the other items, using Bonferroni-Holm adjusted p-values at the 10% level for the comparison.

14
Table B3: Timeliness of and Motivation for Analysts’ Reaction to the Swiss Franc Shock Panel A: Initial Response to Swiss Franc Shock for Firms Covered
Question 5.1: What is the percentage of Swiss firms you followed for which you individually assessed the impact of the SNB announcement immediately thereafter (i.e., within the first one or two days)? (Note: Alternatives must add up to 100 %) [0 – 100 %]
Responses (N = 77)
Firms Assessed Firms Not Assessed No Material Effect Material Effect
% of respondents who answered 17.68 77.26 5.06
Question 5.2: Of those firms with a material effect (as indicated in question 5.1), how often did your assessment result in one of the following adjustments? (Note: Multiple adjustments are possible per firm) [0 – 100 %]
Responses (N = 77)
Qualitative Adjustment
Quantitative Adjustment
Change in Earnings Forecast/Stock Recommendation
% of respondents who answered 40.38 69.51 63.22
Panel B: Motivation for Initial Response to Swiss Franc Shock for Firms Covered
Question 6: What was the motivation to provide a quantitative or qualitative assessment of the effect of the SNB announcement on firms you followed immediately after the Swiss franc shock (i.e., within the first one or two days)? [7-point Likert Scale: 1 to 7]
Responses (Maximum possible N = 76)
Significantly Different Than [4 = Neutral]
% of Respondents Who Answered
Average Rating
Significantly Different Than
Extremely Important [6 or 7]
Not at all Important [1 or 2]
(1) Demand from clients (e.g., institutional or retail investors) 6.13 *** 3-9 77.63 5.26 (2) Likely exposure of the firm to the currency shock 5.89 *** 3-9 74.32 6.76 (3) Demand from internal departments (e.g., trading desk, risk
management) 4.93 *** 1-2 and 5-9 57.53 21.92
(4) Relative importance of the firm (e.g., size or liquidity) 4.67 *** 1-2 and 7-9 38.36 17.81 (5) Availability of firm-specific information 4.18 1-3 and 9 26.39 20.83 (6) Personal job description or performance evaluation 4.08 1-2 34.25 31.51 (7) Peer pressure (from analysts inside or outside your firm) 3.82 1-4 23.29 30.14 (8) Reputation with management of the companies you follow 3.66 1-4 23.29 34.25 (9) Complexity of a firm’s operations 3.56 * 1-5 15.49 33.80
(Continued)

15
Table B3 (continued) Panel C: Medium-term Response to Swiss Franc Shock for Firms Covered
Question 7: What is the percentage of Swiss firms you followed for which you individually (re-)assessed the impact of the SNB announcement in the two to three weeks after the Swiss franc shock?
Responses (N = 77) 0 – 24 % 25 – 49 % 50 – 74 % 75 – 99 % 100 %
% of respondents who answered 20.78 2.60 9.10 5.20 62.34
See the notes to Table B2.

16
Table B4: Methodology of Assessing Impact of the Swiss Franc Shock for Firms Covered Panel A: Heterogeneity in Valuation Approach
Question 11: Assessing the impact of the Swiss franc shock (quantitatively and/or qualitatively) was … [Multiple choice]
Responses (N = 77)
Very Similar for All Firms
Relatively Similar for Most Firms
Considerably More Difficult for Some Firms Than Others
% of respondents who answered 7.79 45.45 46.75
Panel B: (Re-)Assessment of Economic Outlook for Firms Covered
Question 14: Which of the following techniques did you apply to incorporate the impact of the Swiss franc shock on a typical firm you followed in your earnings forecasts or stock recommendations? [7-point Likert Scale: 1 to 7]
Responses (Maximum possible N = 75)
Significantly Different Than
[4 = Sometimes]
% of Respondents Who Answered
Average Rating
Significantly Different Than
Always [6 or 7]
Never [1 or 2]
(1) Use of existing models with adjustment of quantitative inputs for individual firms (e.g., sales and margins figures)
5.93 *** 2-5 74.76 5.33
(2)
Re-assessment of entire situation of the individual firm (including strategic responses like relocation decisions)
4.29 1 and 5 38.67 25.33
(3) Adjustment of existing models (e.g., adjustment of weights or introduction of a new currency risk category)
4.27 1 and 5 43.24 32.43
(4) Use of existing models with adjustment of qualitative inputs for individual firms (e.g., market risk assessment)
3.75 1 and 5 22.67 37.33
(5) Switching to new valuation models 2.05 *** 1-4 6.76 72.97
See the notes to Table B2. We do not report the answers to Question 13 “please indicate the ticker symbol of the three firms you followed for which the assessment of the impact of the Swiss franc shock was most and least difficult,” because of its potentially confidential nature.

17
Appendix C: Investor Relations Survey
We developed the survey of firms’ investor-relations reaction to the Swiss franc shock
similarly to the sell-side analyst survey (see Appendix B). After receiving feedback from
academics and practitioners on the initial draft, we implemented the survey in Qualtrics. The
survey comprises 15 questions, divided into four topical sections, and is followed by a few
demographical questions. We display each survey section en bloc, but respondents have the
possibility to skip certain questions and/or answers and can exit the survey at any point in time.
Wherever possible, we randomize the order of the answering choices. However, we do not
randomize the order of the questions to not interrupt the logical flow of the survey.3
Our subject pool comprises the 151 sample firms. For each firm, we identify the name and
contact information of the person responsible for investor relations. Our primary data sources are
the company’s website and firm information provided on the website of the Swiss Exchange (SIX).
Because not all firms have a dedicated investor relations department or a designated head of
investor relations, we search the company functions using the following algorithm: (1) head of
investor relations, (2) (senior) investor relations manager, (3) head of communications, (4)
assistant to chief financial officer, (5) investor relations team (e.g., e-mail addresses that start with
info@, ir@, or investors@), (6) chief financial officer, and (7) chief executive officer. This way
we were able to identify 149 valid e-mail addresses, which we use as the denominator in the
calculation of the response rate. 4 Table C1, Panel B, shows the job titles of the survey
respondents, and indicates that about 70% of the participants were either head of investor relations,
head of communications, or senior investor relations managers.
3 The survey instrument is available upon request from the authors. 4 We sent out our survey to 148 of the 149 people identified in the search because one firm volunteered to pre-test the survey at an earlier stage and provided us with feedback on the questions.

18
To maximize turnout, we proceeded like follows: first, we contacted the Swiss Society for
Investor Relations (an association of leading investor relations professionals), and asked them to
send out the survey to their member firms on our behalf. 49 sample companies are represented
among their members. Second, we directly contacted the remaining subjects through e-mail. In
both cases, the initial survey request was administered at the end of May 2016. We sent out a
personalized e-mail with a survey link to the subjects. The e-mail explained the general purpose
of the survey, however, we did not mention that we were examining the usefulness of financial
statement information for the assessment of the Swiss franc shock. The e-mail also indicated the
length of the survey and the confidentiality of the responses. We sent out a reminder to
non-responders after one week and again after four weeks, and made sure that the Swiss Society for
Investor Relations reminded its members once. We received a total of 39 responses until the end
of July 2016, giving rise to a response rate of 26.2%. This number seems high, but it is part of
investor relations managers’ job to reply to external information requests.
In what follows, we report the demographics of the 39 respondents to our investor relations
survey (Table C1) together with the responses to the survey questions not tabulated in the main
text (Tables C2 to C4).

19
Table C1: Demographics of the Respondents to the Investor Relations Survey Panel A: Characteristics of Respondent Firms
Full Sample (N = 151) Respondent Firms (N = 37) Mean Std. Dev. Mean Std. Dev. Bid-Ask Spreadt 0.515 1.249 0.386 0.407 FXRisk_DiscAR 4.020 1.434 4.054 1.229 Market Valuet-1 8,790 32,369 5,032 8,702 Share Turnovert-1 0.233 0.332 0.205 0.189 Return Variabilityt-1 0.545 0.558 0.476 0.178 Int_SalesAR 0.655 0.387 0.606 0.391 Total_DiscAR 3.662 0.750 3.835 0.717 Num_Analysts 7.715 8.553 8.649 8.169 Free FloatAR 0.663 0.249 0.647 0.252 Stock Returnt -0.254 0.325 -0.328 0.325
Panel B: Job Titles of Survey Participants
Job Title (N = 38) N % Head of Investor Relations 12 31.58 % (Senior) Investor Relations Manager 9 23.68 % Chief Financial Officer 7 18.42 % Head of Communications 5 13.16 % Treasury or Accounting 3 7.89 % Other 2 5.26 %
Panel A lists descriptive statistics of several firm attributes for the full sample and the 37 firms that self-identified and responded to the survey sent to investor relations managers at firms listed on SIX during the SNB announcement (two firms did not provide a ticker symbol). The panel reports means and standard deviations for the variables used in the daily information asymmetry regressions (see Table 1 for details). For each firm, we take the mean variable value over the [-30;+2] day period surrounding the SNB announcement to compute the sample distribution. None of the differences in means across samples is significant at conventional levels using t-tests. In Panel B, we report the job titles of the survey respondents (one respondent did not provide a job title).
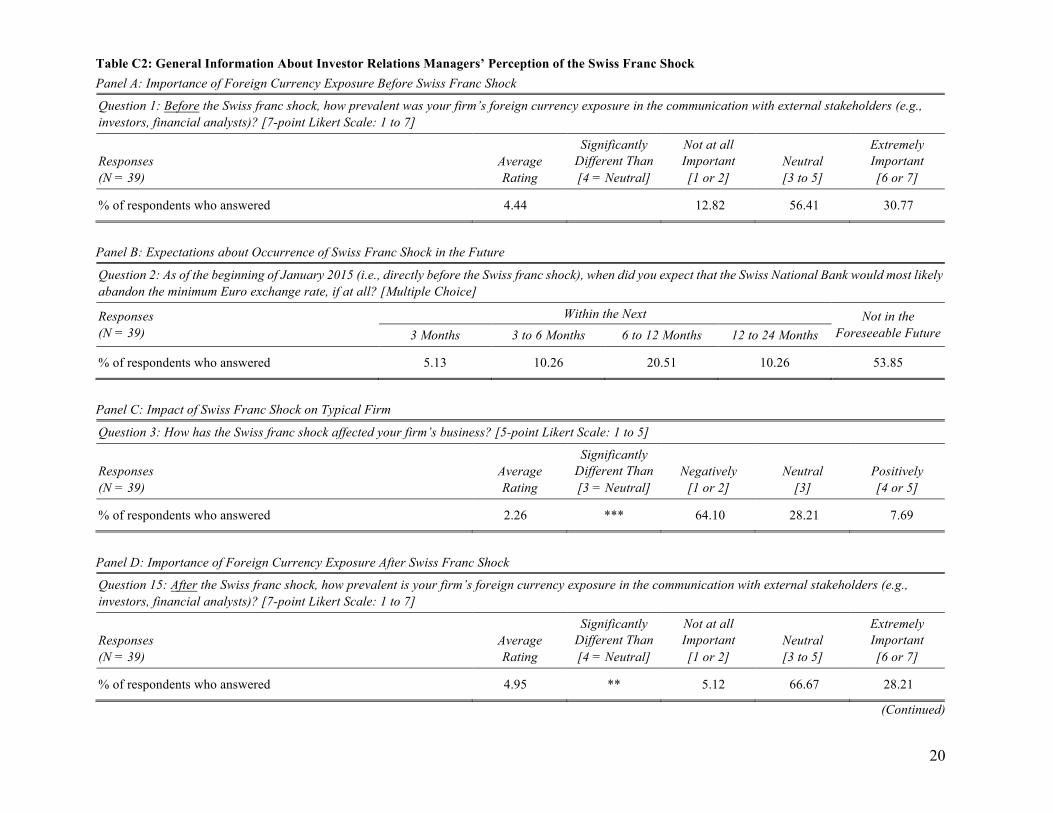
20
Table C2: General Information About Investor Relations Managers’ Perception of the Swiss Franc Shock Panel A: Importance of Foreign Currency Exposure Before Swiss Franc Shock
Question 1: Before the Swiss franc shock, how prevalent was your firm’s foreign currency exposure in the communication with external stakeholders (e.g., investors, financial analysts)? [7-point Likert Scale: 1 to 7]
Responses (N = 39)
Average Rating
Significantly Different Than [4 = Neutral]
Not at all Important [1 or 2]
Neutral [3 to 5]
Extremely Important [6 or 7]
% of respondents who answered 4.44 12.82 56.41 30.77
Panel B: Expectations about Occurrence of Swiss Franc Shock in the Future
Question 2: As of the beginning of January 2015 (i.e., directly before the Swiss franc shock), when did you expect that the Swiss National Bank would most likely abandon the minimum Euro exchange rate, if at all? [Multiple Choice]
Responses (N = 39)
Within the Next Not in the Foreseeable Future 3 Months 3 to 6 Months 6 to 12 Months 12 to 24 Months
% of respondents who answered 5.13 10.26 20.51 10.26 53.85
Panel C: Impact of Swiss Franc Shock on Typical Firm
Question 3: How has the Swiss franc shock affected your firm’s business? [5-point Likert Scale: 1 to 5]
Responses (N = 39)
Average Rating
Significantly Different Than [3 = Neutral]
Negatively [1 or 2]
Neutral [3]
Positively [4 or 5]
% of respondents who answered 2.26 *** 64.10 28.21 7.69
Panel D: Importance of Foreign Currency Exposure After Swiss Franc Shock
Question 15: After the Swiss franc shock, how prevalent is your firm’s foreign currency exposure in the communication with external stakeholders (e.g., investors, financial analysts)? [7-point Likert Scale: 1 to 7]
Responses (N = 39)
Average Rating
Significantly Different Than [4 = Neutral]
Not at all Important [1 or 2]
Neutral [3 to 5]
Extremely Important [6 or 7]
% of respondents who answered 4.95 ** 5.12 66.67 28.21
(Continued)

21
Table C2 (continued) The sample comprises up to 39 answers from respondents to a survey sent to investor relations managers at firms listed on SIX during the SNB announcement. The panels list the average ratings of the responses to the survey question indicated in the panel header as well as the percentages of responses in various bins of the Likert scale (or any other scale mentioned in the question). If applicable, we report the results from t-tests comparing the average rating of an item to the mid-point (where ***, **, and * stand for statistical significance at the 1%, 5%, and 10% levels). If multiple selections are available, we also compare the average rating of an item to the average ratings of all the other items, using Bonferroni-Holm adjusted p-values at the 10% level for the comparison.

22
Table C3: Timeliness and Means of External Communication About the Swiss Franc Shock by Investor Relations Managers Panel A: Timeliness of Initial Response
Question 4: At what point in time did you start communicating with external stakeholders (e.g., investors, financial analysts, etc.) about the qualitative and/or quantitative impact of the Swiss franc shock on your firm? [Multiple Choice]
Responses (N = 39)
Within ... of the SNB Announcement More Than Three Months 1 Day 1 Week 1 Month 3 Months
% of respondents who answered 46.15 17.95 25.64 5.13 5.13
Panel B: Nature of Initial Response
Question 7: Immediately after the SNB announcement (i.e., within the first one or two days), would you describe your firm’s communication with external stakeholders about the impact of the Swiss franc shock as rather reactive or proactive? [7-point Likert Scale: 1 to 7]
Responses (N = 39)
Average Rating
Significantly Different Than
[4 = Both]
Mostly Reactive [1 or 2]
Both Reactive and Proactive
[3 to 5]
Mostly Proactive [6 or 7]
% of respondents who answered 4.15 23.08 53.84 23.07
Panel C: Medium-term Communication Channels
Question 9: Relative to Question 8, which information channels gained or lost importance in the two to three weeks following the SNB announcement? [3-point Likert Scale: 1 to 3]
Responses (Maximum possible N = 39)
Significantly Different Than [2 = Similar Importance]
% of Respondents Who Answered
Average Rating
Significantly Different Than
Gained Importance
[3]
Lost Importance
[1] (1) Presentations and Q&A at already pre-scheduled events (e.g.,
investor days or conference calls) 2.41 *** 3-4 43.59 2.56
(2) Private communication with analysts or investors 2.23 ** 4 28.21 5.13 (3) Communication through media and financial press 2.13 1 and 4 25.64 12.82 (4) Ad hoc announcements or press releases 1.92 1-3 7.89 15.79
(Continued)

23
Table C3 (continued) Panel D: Goals of External Communication
Question 11: What were the most important goals of your communication with external stakeholders about the impact of the Swiss franc shock? Please indicate the importance of the following goals. [7-point Likert Scale: 1 to 7]
Responses (Maximum possible N = 38)
Significantly Different Than [4 = Neutral]
% of Respondents Who Answered
Average Rating
Significantly Different Than
Extremely Important [6 or 7]
Not at all Important [1 or 2]
(1) Reassure existing investor base 5.82 *** 3-9 60.53 0.00 (2) Reduce uncertainty and the “information risk” that investors
place on your company 5.65 *** 6-9 59.46 2.70
(3) Promote reputation for transparent reporting 5.26 *** 1 and 6-9 50.00 5.26 (4) Build confidence in firm’s reporting strategy 5.18 *** 1 and 6-9 42.11 7.89 (5) Build confidence in firm’s operating strategy 5.18 *** 6-9 47.37 7.89 (6) Correct/prevent undervaluation of the stock price 4.11 1-5 and 8-9 21.05 15.79 (7) Level the playing field between different types of investors 3.95 1-5 and 8-9 21.62 21.62 (8) Increase stock liquidity and/or reduce stock volatility 3.26 *** 1-7 7.89 34.21 (9) Attract new investors and increase general awareness of firm 3.26 *** 1-7 7.89 36.84
See the notes to Table C2.

24
Table C4: Information Needs of External Stakeholders After the Swiss Franc Shock Panel A: Communication Channels for Information Requests
Question 12: Compared to your firm’s last earnings announcement, how many more or less information requests through the various channels did you receive from external stakeholders after the SNB announcement? [5-point Likert Scale: 1 to 5]
Responses (Maximum possible N = 39)
Significantly Different Than
[3 = Same]
% of Respondents Who Answered
Average Rating
Significantly Different Than
Much More [5]
Much Less [1]
(1) Phone calls 3.87 *** 2-4 28.95 0.00 (2) E-mails 3.72 *** 1 and 3-4 25.64 2.56 (3) Website hits 3.26 ** 1-2 3.23 0.00 (4) Downloads of financial reports or other company documents 3.25 *** 1-2 0.00 0.00
Panel B: Nature of Information Requests
Question 13: Based on your impression, what type of information was particularly relevant to external stakeholders in their assessment of the Swiss franc shock for your firm? Firm-specific information about … [7-point Likert Scale: 1 to 7]
Responses (Maximum possible N = 38)
Significantly Different Than [4 = Neutral]
% of Respondents Who Answered
Average Rating
Significantly Different Than
Extremely Important [6 or 7]
Not at all Important [1 or 2]
(1) Transactional exposure (e.g., currency mismatch between revenues and costs)
5.13 *** 5-6 57.89 18.42
(2) Translational exposure (e.g., arising from foreign subsidiaries) 5.05 *** 52.63 13.16 (3) Hedging strategy 4.97 *** 50.00 13.16 (4) Sensitivity to indirect effects (e.g., GDP growth) 4.53 ** 21.05 7.89 (5) One-time gains/losses (e.g., on cash holdings) 4.43 1 29.73 13.51 (6) Operating and strategic responses (e.g., relocation decisions) 4.14 1-3 21.62 21.62
Panel C: Usefulness of Existing Annual Report Disclosures
Question 14: Based on your impression, how relevant was the information provided in the existing annual report and financial filings to external stakeholders in their assessment of the Swiss franc shock immediately after the SNB announcement (i.e., within the first one or two days)? [7-point Likert Scale: 1 to 7]
Responses (N = 39)
Average Rating
Significantly Different Than [4 = Neutral]
Not at all Important [1 or 2]
Neutral [3 to 5]
Extremely Important [6 or 7]
% of respondents who answered 4.74 *** 7.69 66.67 25.64
See the notes to Table C2.