Embed Size (px)
Citation preview

Do institutional investors mitigate social costs ofprivatization? Evidence from prisons
Eyub Yegen∗
November 2020
Abstract
This paper examines whether institutional investors mitigate social costs that arisewhen government services are outsourced to private enterprises. Using hand-collecteddata on U.S. prisons, I find that privatization is associated with an increase in prisonersuicides by up to 39%. However, institutional investors of public companies managingprivate prisons decrease suicide rates by one third. These effects are stronger for long-term institutional investors since failing to internalize social externalities negativelyimpacts the long-term success of portfolio firms. Evidence from a tax reform thatexogenously increases institutional ownership of prison management companies suggeststhat the relationship between ownership and social outcomes is causal. To explain theseresults, I show that institutional investors have incentives to be socially responsible dueto litigation and reputation risks.
Keywords: Institutional Investors, Corporate Social Responsibility, Social Welfare
JEL: A13, G23, G32, H11, L33
∗Rotman School of Management, University of Toronto. E-mail: [email protected]. I wouldlike to express my gratitude to Pat Akey, Susan Christoffersen, Craig Doidge, Ray Fisman, and Mike Simutinfor their invaluable guidance and support. I also want to thank Anat Admati, Matthew Baron, MarianneBertrand, Matilde Bombardini, Mahfuz Chy, Peter Cziraki, Alexander Dyck, David Goldreich, Todd Gorm-ley, Denis Gromb, Oliver Hart, Camille Hebert, Charles Martineau, Paola Sapienza, Denis Sosyura, MatthewShaffer, Ana-Maria Tenekedjieva (discussant), Karamfil Todorov, Francesco Trebbi, Abhishek Varma (discus-sant), Hannes Wagner (discussant), Irene Yi, Luigi Zingales and participants at the Chicago Booth PoliticalEconomy of Finance conference, Columbia GRASFI conference, Conference on Green and Ethical Finance atSMU, FMA Annual Meetings, and Bank of Canada for fruitful discussions. The Clarkson Centre for BusinessEthics provided generous funding to support this project.

1 Introduction
Over the past three decades, outsourcing government services to the private sector has
become a popular tool for policymakers worldwide due to the benefits of privatization [Meg-
ginson and Netter (2001), Kamerman and Kahn (2014)]. Although there may be noticeable
efficiency gains of privatizing government services, a large body of literature in economics
suggests that privatization may impose social costs.1 Prior studies highlight the trade-off
that private enterprises have incentives to cut on costs, which may sacrifice quality [Hart,
Shleifer, and Vishny (1997)]. Reducing spending on resources that impact the quality of
outsourced government services may also harm individuals who rely on these services.
Despite the potential for private prison management companies to maximize profits by
neglecting to offer adequate resources to inmates, the United States government has increas-
ingly relied on private companies to provide prison services.2 In particular, from 2000 to 2016
the number of inmates in private prisons (immigration detention centers) increased by 47%
(442%), whereas the total number of prisoners rose by only 10% [Gotsch and Basti (2018)].
During the same period, the ownership structure of public companies that manage private
prisons has also changed dramatically; institutional ownership in these public companies has
risen by over 60%. The interest of institutional investors in prisons even went to the point
that delegated asset managers, such as BlackRock, have purchased their own prisons.3
In this paper, I examine a previously unstudied mechanism through which social costs
of privatization may be mitigated by shareholders of public companies that manage private
prisons in the United States. Recent theoretical studies highlight that the role of shareholders
may be instrumental in determining whether managerial decisions internalize social exter-
nalities [e.g., Benabou and Tirole (2010); Hart and Zingales (2017)]. Also, recent empirical
studies find that institutional investors may drive corporate social responsibility outcomes
[e.g., Dyck, Lins, Roth, and Wagner (2019); Chen, Dong, and Lin (2020)]. However, relatively
less is known whether institutional investors have a direct impact on social welfare.
1See, for example, Hart, Shleifer, and Vishny (1997), Lopez-de Silanes, Shleifer, and Vishny (1997),Shleifer (1998), Besley and Ghatak (2001), Baland and Francois (2005), Hart (2017).
2The New York Times article titled “Inside a Private Prison: Blood, Suicide and Poorly Paid Guards”summarizes the inadequate conditions in private prisons.
3For details, see the Reuters article titled “BlackRock-owned Mexican prison opens in Coahuila.”
1

To examine whether the poor prison conditions due to privatization are affected by insti-
tutional ownership, I have compiled a novel dataset on U.S. prisons by filing 51 state-specific
Freedom of Information Act requests and by hand-collecting other information from various
government documents.4 Without taking the ownership structure of the prison management
companies into account, I first empirically examine the main theoretical prediction of Hart,
Shleifer, and Vishny (1997) on whether prison privatization leads to a rise in social costs.
In particular, when the contract between the government and private prison operator
is incomplete, owners of the private enterprise have the residual right to make decisions
on the non-contracted dimensions. Due to an incentive to maximize profits, Hart, Shleifer,
and Vishny (1997) predict that private operators have incentives to cut on costs on the
non-contracted dimensions by ignoring to take negative externalities into account. These
externalities are more severe in less competitive industries, such as the prison industry, where
cutting on the quality of resources may have a detrimental impact on the lives of prisoners.
Consistent with Hart, Shleifer, and Vishny (1997), I find empirical evidence that privati-
zation of prisons is associated with an increase in inmate suicides, by up to 39%, even after
including prison fixed effects. As in Fisman and Wang (2015, 2017), I use mortality rates as
a proxy for social costs. Mortality rates are difficult to monitor, and the government does
not specify an upper limit on mortality rates in contracts signed with prison management
companies. Another reason for using this proxy is that if prisons are well managed and of-
fer adequate rehabilitation services, the probability of committing suicide may also decrease
[see, e.g., Hayes (1995); Cramer, Wechsler, Miller, and Yenne (2017); Fazel, Ramesh, and
Hawton (2017)]. However, the results are not sensitive to the choice of the outcome variable,
and I derive similar conclusions when I use alternative proxies, such as unexpected deaths,
total deaths, total rehabilitation programs offered in prisons, and the number of correctional
officers hired per inmate.
To examine my main question of whether institutional investors mitigate social costs of
privatization (when the government fails to write complete contracts), I take into account
the ownership structure of publicly traded companies that manage prisons. After controlling
4Washington D.C. has its own department of corrections and a D.C.-specific Freedom of InformationAct. After exchanging over 830 emails and contacting numerous senior state officials, such as governors andlegislators, I have obtained data on prisons from all states, except the state of Hawaii.
2

for an increasingly demanding set of fixed effects, including prison fixed effects, and time-
varying demographic factors that may impact the ex-ante likelihood of prisoners committing
suicide, I find a statistically significant negative association between institutional ownership
and suicides. In particular, a 1% increase in institutional ownership is associated with a
reduction in suicides by up to 1.2%. These magnitudes are economically significant since
they offset one third of the social costs that are observed in private prisons.
Building on Hart and Zingales (2017), I examine whether different types of institutional
investors pay more attention to social outcomes by breaking down institutional ownership
into more granular levels. Institutional investors with a long-term holding horizon pay more
attention to the long-term success of the firm and have incentives to internalize social exter-
nalities, whereas short-term investors may not have such incentives [Brochet, Loumioti, and
Serafeim (2015)]. Benabou and Tirole (2010) highlight the importance of long-term investors
by stating that corporate social responsibility “is about taking a long-term perspective to
maximizing profits” and “socially responsible investors should position themselves as long-
term investors who monitor management and exert voice to correct short-termism.”
Given that cutting costs may boost short-term profits, institutional investors with a short-
term holding horizon have an incentive to influence managers to implement cost reductions.
Such cost reductions that boost short-term profits, however, are likely to negatively impact
the overall prison conditions, leading to a rise in social costs. As well, institutional investors
with a long-term holding horizon pay more attention to long-term firm value [see, e.g., Bushee
(2001); Brochet, Loumioti, and Serafeim (2015)]. Hence, long-term investors are more likely
to monitor firms to ensure managers do not overly focus on short-term profits and take actions
to boost long-term firm value. Managers who are not overly focused on the short-term are
more likely to internalize consequences of cost reductions that impact prison conditions since
a drastic increase in suicides (or other social outcomes) may impact the renewal of long-term
prison contracts, and therefore negatively impacting long-term firm value.
Consistent with this argument, I find a statistically significant negative (positive) rela-
tionship between ownership by long-term (short-term) institutional investors and suicides
in prisons. In particular, I find that a 1% increase in long-term (short-term) ownership is
associated with a decrease in suicides by 1.2% to 1.5% (increase in suicides by 1.8% to 1.9%),
3
with the results being the strongest in the within-prison tests.
Given that holding duration is not randomly assigned to investors, I use an alternative
proxy for long-term and short-term ownership in addition to a novel identification strategy.
Prior studies [e.g., Bushee (1998, 2001); Gutierrez and Philippon (2018)] find that transients
and quasi-indexers have short and long holding horizons, respectively.5 Using this alternative
proxy for holding horizon, I find that a 1% rise in quasi-indexer (transient) ownership is
associated with a decrease in suicides by 2.5% to 2.7% (rise in suicides by 1.1% to 1.5%).6
However, within the long-term investor category, there is still a large heterogeneity in
the types of investors. The attentiveness to social outcomes may differ across types of long-
term investors. By using the granular investor types provided by Bushee (2001), I further
break down the long-term ownership levels to capture variation in attentiveness to social
outcomes. This may play a role in explaining why there is a positive relationship between
long-term ownership and improvements in prison conditions. I find that there are differential
effects of long-term ownership on social outcomes depending on the type of investor. The
effects are largest among independent investment advisors and companies, such as mutual
funds. Consistent with this finding, Bushee (2001) documents that ownership by independent
investment advisors and companies is positively associated with long-term firm valuation.
The results in my paper so far highlight the importance of making use of the heterogeneous
investor types to capture the social responsibility of shareholders that may impact prison
outcomes differently. These results, however, do not provide any causal evidence in regard
to the effects of long-term institutional ownership on social outcomes. Identifying the causal
effects of long-term institutional ownership on prison outcomes comes with an empirical
challenge. OLS regressions measure only the association between institutional ownership
and prison outcomes rather than examining a casual relationship. To examine the causal
relationship, I develop a new identification strategy that exogenously increases the exchange-
traded fund (ETF) ownership levels in publicly traded companies managing prisons.
In particular, at the end of 2012, the Internal Revenue Service reclassified publicly traded
5The annual portfolio turnover of quasi-indexers is only 33%, whereas the one of transients is 70%.6Quasi-indexers have incentives to monitor firms that are included in their portfolios due to index tracking
since it may improve firm fundamentals that will also have a positive impact on the value of assets undermanagement [for more details, see Appel, Gormley, and Keim (2016, 2018)].
4

prison management companies as Real Estate Investment Trusts (REIT) since these public
companies met the definition to be legally considered a REIT company. This reclassification
led to doubling ETF ownership levels since these prison management companies entered into
more ETFs that track the real estate sector. I make use of this exogenous increase in the
ETF ownership levels as an identification strategy to draw causal inferences on the possible
direct impacts of long-term institutional ownership on social outcomes. Furthermore, related
to the exclusion restriction, the tax reform is unlikely to be implemented to have a positive
impact on prison outcomes, but rather the improved prison conditions are more likely to be
driven by exogenous changes in long-term institutional ownership.
Using an instrumental variable (IV) approach, where I instrument the ETF ownership
levels by the exogenous increase in ETF ownership due to the REIT reclassification, I find that
long-term ownership has a causal negative impact on suicides. The economic magnitudes are
similar to the uninstrumented results. Using alternative outcome variables in lieu of mortality
rates, I confirm that long-term ownership leads to improvements in prison conditions.
Next, I examine why institutional investors may have an incentive to monitor prison man-
agement companies. Arena and Julio (2015) provide empirical evidence that the litigation
environment in the United States plays an important role for decisions made by firms and
shareholders. Corporate litigation is costly to firms and shareholders both from a valuation
and reputation perspective. Institutional investors are more likely to be attentive to social
outcomes if prisons harm the reputation of the institution, and have an indirect impact on
fund flows. For example, various social advocacy groups urge citizens to contact institu-
tional investors that manage their retirement plans, which include prison stocks, to be more
socially responsible with their investments. Otherwise, these advocacy groups urge that cit-
izens should opt to different providers. These calls typically rise when there are lawsuits
against prisons. Hence, if institutional investors indeed partially offset the social costs of
prison privatization, they are more likely to act when there are higher litigation risks.
Following this argument, I first examine whether the long-term ownership effects are
stronger in prisons which are located in states with judicial systems that make it easier for
plaintiffs to successfully sue corporations. As in Colonnello and Herpfer (2019), I use a state-
level proxy for litigation risk by obtaining data from the U.S. Chamber Institute for Legal
5

Reform. This institution publishes an annual ranking of the friendliness of a given state’s law
system to corporations. Using this proxy for litigation risk, I show that the ownership results
are strongest for prisons in states with higher litigation risks (i.e., prisons in plaintiff-friendly
states). I also show that the litigation risk results are robust to using the litigation risk proxy
of Arena and Julio (2015) (i.e., using lawsuits of peer prisons).
Given that the litigation and reputation risk results make use of endogenous ownership
levels, I use the REIT reclassification as an exogenous source of variation in long-term own-
ership levels and interact it with the 2012 state litigation rankings. It is unlikely that the
litigation risk proxies are impacted by the REIT reclassification in 2012 since this ownership
shock is completely unrelated to a state’s litigation ranking (i.e., rankings are orthogonal to
the ownership shock). Using an IV approach, I show that there is a monotonically increas-
ing, negative effect of long-term ownership on suicides in prisons that are located in more
plaintiff-friendly states. This suggests that long-term investors are more attentive to monitor
when there are higher litigation risks. Therefore, litigation risk provides a possible explana-
tion on why long-term investors have an incentive to internalize social costs since not taking
social outcomes into account is costly both from a valuation and reputation perspective.
My paper contributes to two bodies of literatures. First, I contribute to the literature
that examines the role of institutional ownership in corporate social responsibility (CSR)
outcomes. Prior studies [e.g., Starks, Venkat, and Zhu (2017); Dyck et al. (2019); Krueger,
Sautner, and Starks (2020)] find a positive association between institutional ownership and
CSR outcomes.7 Complementing Chen et al. (2020) that provides empirical evidence on the
casual effect of institutional ownership on CSR outcomes, I show that a particular set of
institutional investors drives CSR outcomes. Not all types of institutional investors, such
as short-term investors, positively impact CSR outcomes. Consistent with the theoretical
prediction of Benabou and Tirole (2010), I find that long-term institutional investors have an
incentive to positively impact CSR outcomes. Therefore, I contribute to the CSR literature
by raising the importance of using granular investor classifications to capture heterogeneity in
7Relevant studies in the institutional investors literature include Aghion, Van Reenen, and Zingales (2013),Schmidt and Fahlenbrach (2017), Bebchuk and Hirst (2019), Crane, Michenaud, and Weston (2016); Crane,Koch, and Michenaud (2019), Chattopadhyay, Shaffer, and Wang (2020), and in the CSR literature includeMcguire, Sundgren, and Schneeweis (1988), Fisman, Heal, and Nair (2005), Shiller (2013), Bartling, Weber,and Yao (2015), Lins, Servaes, and Tamayo (2017), Liang and Renneboog (2017).
6

shareholders’ attentiveness to social outcomes, as highlighted by Benabou and Tirole (2010)
and Hart and Zingales (2017), to study the effects of ownership on CSR outcomes. To the
best of my knowledge, this paper is also the first study to provide causal evidence on the
direct effects of institutional ownership on society (in the form of human costs).
Second, I add to the literature on privatization. Prior studies, starting with the seminal
theoretical work by Hart, Shleifer, and Vishny (1997) as well as Lopez-de Silanes, Shleifer,
and Vishny (1997), Shleifer (1998), Besley and Ghatak (2001), Hart (2017) provide evidence
that there may be negative consequences of privatization. However, none of the prior studies
take into account whether the private enterprises’ ownership structure may mitigate the so-
cial costs of privatization. For instance, Banerjee, Hanna, Kyle, Olken, and Sumarto (2019)
experimentally examines the success of privatizing subsidized food distributions in Indone-
sia. Although they find that privatization leads to positive outcomes without the sacrifice of
quality (given that the non-contracted dimensions do not impact social costs), the ownership
structure of the private firms is not taken into account. Eaton, Howell, and Yannelis (2019)
find that private equity buyouts in private secondary schools lead to negative effects on con-
sumers.8 However, none of the prior studies examine whether the public ownership structure
may mitigate social costs of privatization. I fill in the gap in this literature by highlighting
the importance of the ownership structure of private firms, especially in less competitive
industries where the quality of non-contracted outcomes may impact social outcomes.
2 Sample and summary statistics
2.1 Data sources and sample construction
I construct a novel panel of prison-level data on inmate deaths (i.e., suicides, unexpected
deaths, and total deaths), programs offered in prisons (e.g., suicide-prevention programs,
educational programs, health programs), number of correctional officers hired per inmate,
institutional ownership in prisons, and other prison-specific information. My starting point is
the entire set of prisons in the United States of America between 2000 to 2018. To construct
this dataset, I have filed state-specific Freedom of Information Act (FOIA) requests to obtain
8Other relevant studies include Bayer, Hjalmarsson, and Pozen (2009) and Mukherjee (2020).
7
various information about prisons. The information I requested from each state is identical
to ensure comparability of data that each state provides.
To obtain the prison data, I have exchanged over 830 emails with state officials, paid fees
to fulfill my FOIA requests, and had to file complaints with certain states’ commissioner,
governor, and/or legislator. Information on annual mortality data for each specific prison
were obtained from all states, except of the state of Hawaii.9
With this data in hand, I analyze various official reports and databases provided on
each department of corrections’ website to identify whether the given prison was privately
managed and identify the prison management company. In addition, I analyze 10-K files
of prison management companies that are publicly-traded to verify the list of prisons that
are managed by these private enterprises. Similarly, I go over thousands of various official
reports and datasets provided by the department of corrections to hand collect the data
that is needed to construct the control variables.10 The definition of each control variable
is provided in Table 1. The information on various programs offered in the prisons are
also collected in the same manner although some of the department of corrections provided
directly information on programs offered in prisons (e.g., California).
For information on ownership, I use data from the Center for Research in Stock Prices
(CRSP), SEC Edgar, Thomson Reuters, and WRDS SEC Analytics. To construct the in-
stitutional onwership measures, I use 13-F holdings that are required to be disclosed by
institutional investors with at least $100 million assets under management. To obtain the
missing 13-F institutional holdings during the post-2012 period in Thomson Reuters, I fol-
low Ben-David, Franzoni, Moussawi, and Sedunov (2020) and Yegen (2019).11 As well, given
that the 13-F holdings are disaggregated, I follow the approach suggested by Lewellen and
Lewellen (2018) to aggregate the holdings to the parent-level. Following that, I aggregate the
13-F holdings to the annual-level and use outstanding shares from CRSP to construct the
fraction of shares held by various institutional investor types in a given firm that manages
private prisons. To define the fraction of shares held by short-term versus long-term investors,
9The exclusion of Hawaii does not affect substantially the sample size since it has only four prisons. Also,to focus on the within and across state variation, I exclude immigration detention centers and federal prisons.
10I do not automate this process since most reports are provided in varying formats across states and time.11I also verify that no institutional holdings data are missing by using institutional ownership data from
the Bloomberg Terminal.
8

I use the holding duration measure of Lan, Moneta, and Wermers (2019) and the investor
classification data provided by Bushee (1998, 2001) (i.e., transients and quasi-indexers). To
be precise, I use the following definition to construct the various institutional ownership
measures:
Institutional Ownershipi,j,t =
J∑j=1
vi,j,t × AUMj,t
Market Capitalizationi,t
(1)
where j stands for the institutional investor (of the given investor classification type)
that has ownership in the given publicly-traded prison management company i, vi,j,t is the
weight of the given stock in the portfolio of institutional investor j (i.e.,Holding V aluei,j,t
AUMj,t),
AUMj,t stands for given institutional investor j’s total assets under management (AUM),
and Market Capitalizationi,t is the market capitalization of prison management company i.
The average of the quarterly institutional ownership measures are then taken to obtain an
annual ownership number since the prison-level variables are provided at the annual-level.
Similarly, to construct the exchange-traded fund (ETF) ownership variables, I use data
from CRSP, ETF Global, and Thomson Reuters. Following Ben-David, Franzoni, and Mous-
sawi (2018) and Azim (2019), I start by identifying the ETFs in CRSP. By using the CRSP
Mutual Fund database, I obtain all ETF that have an ETF flag and drop ETFs that have a
regional description that is outside of North America using the Lipper Class Name. Follow-
ing that, I use the CRSP Portfolio Holdings database to obtain the holdings data for each
ETF. To ensure that no holdings data is missing, following Azim (2019), I link the CRSP
ETF data with Thompson Reuters Mutual Fund Holdings using the Mutual Fund linkages.
Then, I obtain all of the holdings from Thomson Reuters for each ETF that is identified from
the CRSP database. Following Ben-David, Franzoni, and Moussawi (2018), for each prison
management company I construct the following ETF ownership variable which measures the
average fraction of shares of the firm that are being held in ETFs during the given year:
ETF Ownershipi,j,t =
J∑j=1
wi,j,t × AUMj,t
Market Capitalizationi,t
(2)
9

where j stands for the ETF holding stocks in the given prison management company i, wi,j,t
is the weight of the given stock in the given ETF j (i.e.,Holding V aluei,j,t
AUMj,t), AUMj,t stands for
given ETF j’s AUM, and Market Capitalizationi,t is the market capitalization of firm i.
The average of the ETF ownership measure is taken to obtain an annual number since the
prison-level variables are provided at the annual-level.
Given that holdings are missing in the Thomson Reuters data, I use the ETF Global
dataset for the period starting in 2012. The ETF Global dataset focuses only on ETFs and
has a better coverage. Since this dataset only starts in 2012, I use the ETF Global dataset for
the period starting in 2012 and the CRSP-Thomson Reuters dataset prior to 2012. However,
using the CRSP-Thomson Reuters dataset for the entire sample does not significantly impact
the results. I follow the same approach of constructing the ETF ownership variable for the
period starting in 2012.
Lastly, I combine the ETF Ownership data, institutional ownership data, and the prison
data by matching the datasets on the common firm and year identifiers. This final step
yields a dataset that is at the prison level and contains annual information about a prison’s
population, mortality rates, correctional officers hired, and ownership structure.
2.2 Summary statistics
Table 1 provides the descriptive statistics. Approximately, 13% of the distinct 1,453
distinct prisons (12.2% of prison-year observations) that are included in my sample are man-
aged by a private enterprise. Figures 1 and 2 also provide some further information on which
states have at least one private prison at the beginning and end of the sample (i.e, 2000 and
2018), respectively. The average long-term and short-term institutional ownership, which
are defined by the quasi-indexers and transient classifications of Bushee (2001), are 0.028
and 0.016, respectively, whereas the ETF ownership is around 0.013. The average number
of total suicides, unexpected deaths, and all types of deaths that occur during a given year
is 0.673, 1.746, and 3.824, respectively. By scaling the mortality numbers with the average
number of inmates housed in the given prison, I construct alternative mortality measures,
such as suicide rates, unexpected death rates, and total death rates. The average suicide
rates, unexpected death rates, and total death rates are 0.001, 0.002, and 0.006, respectively.
10
As well, the average number of programs that are related to suicide-prevention is 4.379,
whereas the average number of programs offered in prisons is 29.977.
Furthermore, there is a significant difference, both economically and statistically, in out-
comes of prisons that are managed by a non-government institution (i.e., private firm) com-
pared to the ones that are managed by the government. For instance, the total number of
suicides, unexpected deaths, and all types of deaths are higher in privately-managed prisons
by 0.436, 0.576, and 1.007, respectively. This implies that an inmate is more likely to commit
suicide if the prisoner is housed in a privately-managed prison. Similar patterns appear with
the mortality rates when one scales the average number of moralities by the average number
of inmates housed in the given prison.
3 Empirical methodology
3.1 Regression specification
As a starting point, I first empirically examine the theoretical prediction of Hart, Shleifer,
and Vishny (1997) that privatization of prisons may lead to a rise in social costs when con-
tracts are incomplete. As in Fisman and Wang (2015, 2017), I use mortality rates as a
proxy for social costs. Although various outcomes may be specified in the contract between
the government and the private enterprise, putting a limitation (i.e., upper bound) on the
number of suicides, unexpected deaths, and total deaths that occur during the given year is
not feasible due to ethical and legal restrictions (i.e., mortality rates are non-contracted out-
comes).12 Therefore, in the main specifications, I use suicides as a proxy for social outcomes
that are difficult to monitor and are not contracted on.
In addition to using alternative empirical models (e.g., poisson models), I regress the
logarithmic transformation of one plus the number of suicides on whether the prison is
12By examining dozens of contracts I was able to obtain, I am able to confirm that there are no specificstatements being made in contracts that put a specific upper bound or a target number on the numberof suicides, unexpected deaths, or total deaths that may occur in prisons. Due to ethical constrains, it isimplausible to put a specific upper limit to suicides or other types of deaths. However, when prisons aremanaged well, the number of suicides is also likely to decrease as a result of improved prison conditions [see,e.g., Cramer et al. (2017); Fazel et al. (2017)]. Furthermore, the definition of suicides and other mortalityrates is the same across all states, making it easier to compare the number of suicides across states.
11

managed by a private entity after controlling for time-invariant heterogeneity at the state-
level as well as year-level, and time-variant prison-level factors that may impact the mortality
rates.13 For instance, one may claim that private prisons ex-ante select inmates who are less
likely to commit suicide. Therefore, following the literature [e.g., Hayes (1995); Fazel et al.
(2017); Cramer et al. (2017)], I control for time-varying factors that represent the overall
prison population type and are relevant to suicides to address possible concerns that a change
in the overall demographics of the prisoner population may drive the results.14 The regression
specification is as follows:
Log(1 + Suicidesi,t) = β0 + β1 1(Privatei,t) + βvXi,t + βwXi + αt + γs + εi,t (3)
where t indexes year, i indexes the given prison, and s indexes the given state. Furthermore,
Xi,t is a vector of relevant control variables that vary overtime for each prison and may
impact mortality rates, whereas Xi is a vector of control variables at the prison-level that do
not vary overtime (e.g., prison security type), but may have an impact on mortality rates.
Year fixed effects are αt, whereas γs are state fixed effects. Given that actual suicide rates
may be incorrectly classified as non-suicide deaths, I use unexpected deaths and total deaths
as alternative dependent variables.
There may, however, still be some unobservable variation at the prison level that drives
some of the results. I, therefore, run a stricter version of the baseline regression by including
prison fixed effects in addition to time fixed effects. This specification captures the within-
prison effects of privatization on suicides. In particular, by including prison fixed effects
one eliminates the time-invariant heterogeneity at the prison-level [following the argument of
Gormley and Matsa (2014)]. Therefore, by taking away the prison-specific effects on inmate
13The reason why I use the logarithmic transformation of one plus the number of suicides rather than thelogarithmic transformation of the number of suicides is due the fact that prisons with no suicides (i.e., zerosuicides) will be automatically dropped out from the regressions since the log of zero is undefined. However,an annual total number of zero suicides does capture relevant information important to the inference I amseeking to draw. Therefore, I use the one plus suicides logarithmic transformation to include such cases.In robustness tests, I also use poisson and negative bionomial regressions that allow me to capture the zerocases without having to do the logarithmic transformation of one plus suicides.
14Inmates are typically assigned to a given prison the judge or the Department of Corrections. In general,a strategic selection of inmates by the prison operator is less likely to occur.
12
mortalities, I run the following fixed effects regressions:
Log(1 + Suicidesi,t) = β0 + β1 1(Privatei,t) + βvXi,t + αt + θi + εi,t (4)
where the notations are the same as in equation (3) and θi are prison fixed effects.
Furthermore, given that prior studies, such as Hart and Zingales (2017) and Benabou
and Tirole (2010), highlight the role of shareholders, such as institutional investors, who
may impact corporate social responsibility outcomes, I take the ownership structure of prison
management companies into account to capture heterogeneity in shareholders’ attentiveness
to social outcomes in prisons. As well, prior studies that examine the consequences of privati-
zation do not take into account the fact that there may be a different impact of privatization
on social outcomes when one takes the ownership structure of the private operator into ac-
count. Therefore, I first examine whether there is a relationship between total institutional
ownership and prison outcomes, and then break down the institutional ownership levels into
more granular levels. In particular, it is possible that certain types of institutional investors
may play an important monitoring role in mitigating the social costs that arise as a result of
prison privatization, which was raised as a possible concern of prison privatization by Hart,
Shleifer, and Vishny (1997).
To capture such heterogeneity in investors’ attentiveness to social outcomes, I first break
down the total institutional ownership levels to ownership by short-term and long-term in-
vestors. Benabou and Tirole (2010) empathize the important role of long-term investors
by stating that corporate social responsibility “is about taking a long-term perspective to
maximizing profits”, and that “socially responsible investors should position themselves as
long-term investors who monitor management and exert voice to correct short-termism.”
In addition, Bushee (2001) provides empirical evidence that there is a positive relationship
between long-term ownership and long-term firm value, whereas there is a positive associ-
ation between short-term ownership and short-term firm value. It is likely that long-term
investors monitor the prison management company to ensure that long-term firm value is
maximized and managers incorporate social outcomes. Failing to incorporate social out-
comes so may impact the renewal of contracts, and therefore impact the long-term value of
13

the firm. Short-term investors are, however, more likely to influence the prison management
company to implement managerial decisions that increase short-term profits, but may not
take into account the long-term consequences of a rise in social costs due to a reduction
in quality. I define long-term versus short-term ownership by following Lan, Moneta, and
Wermers (2019).
Given that holding duration is not randomly assigned, I use a proxy for holding duration.
In particular, I use the quasi-indexer and transient classification as a proxy for long-term
versus short-term ownership, respectively, since Bushee (2001) finds that quasi-indexers have
a short holding horizon, whereas transients have a short holding horizon. For instance, the
annual portfolio turnover of quasi-indexers is 33%, whereas the annual portfolio turnover of
transients is 70%.
To examine the role of institutional investors, I use the same regression specification
as in equations (3) and (4), except that I include variables that captures the variation in
institutional ownership types in the given prison as follows:
Log(1 + Suicidesi,t) = β0 + β1 1(Privatei,t) + β2 Institutional Ownershipi,t
+ βvXi,t + βwXi + αt + γs + εi,t
(5)
where the indexes are the same as in equation (3). Institutional Ownershipi,t is the aver-
age annual total institutional ownership level (or institutional ownership level by type) in
the private operator that manages the given prison. It is also important to note that I in-
clude 1(Privatei,t) in the regressions since there is a difference between non-publicly traded
privately managed prisons that have no institutional ownership and non-privately managed
prisons (i.e., managed by the government) that needs to be controlled for (which cannot be
distinguished when institutional ownership is zero). In robustness tests, I run a similar spec-
ification by only including private prisons (i.e., by excluding all government prisons) since
the baseline results measure both the extensive and intensive margins.
To examine the impact of institutional ownership on prison outcomes after removing any
time-invariant prison-specific unobservables, I run the following regression with prison fixed
14

effects and include the institutional ownership variable(s) as follows:
Log(1 + Suicidesi,t) = β0 + β1 1(Privatei,t) + β2 Institutional Ownershipi,t
+ βvXi,t + θi + αt + εi,t
(6)
where the indexes are the same as in equation (4).
Given that Benabou and Tirole (2010) theoretically predict that long-term investors may
play a more important role in social outcomes compared to other investors, I further examine
whether there are differences in the attentiveness to social outcomes among long-term investor
types. I break down the long-term institutional ownership levels into more granular investor
types, such as ownership by pension fund or independent investment advisor. Lastly, as I
describe in the next section, since my identifications strategy relies on the exogenous change
in ETF ownership, I run the same regressions of (5) and (6) using ETF ownership levels to
provide the uninstrumented baseline results for comparison.
Similarly, in the robustness test section, I follow the same regression specification as in
equations (5) and (6) when examining the effects of various ownership types on alternative
social outcome variables, such as the total number of rehabilitation programs offered in a
given prison during a given year, correctional officer hired per inmate, or overcrowding in the
prison. I do not re-write the specifications since they are identical to the ones from before
except that I use the aforementioned variables as alternative dependent variables to measure
the overall prison conditions.
3.2 Identification strategy
Identifying the causal effect of long-term institutional ownership on prison outcomes
comes with an empirical challenge. Without an identification strategy, one may not be able
to examine the causal relationship between institutional ownership and social outcomes in
prisons. There are two reasons that may lead to biased results. First, institutional investors
may be self-selecting into prison management companies that run prisons in an ethical man-
ner. Therefore, the relationship between ownership and prison outcomes may be driven by a
self-selection of institutional investors who are able to pick stocks well. Second, there may be
15

an omitted time-varying factor that is correlated with both long-term institutional ownership
and prison outcomes. Not including such an omitted factor may also lead to biased results.
To overcome this empirical challenge, I develop a new identification strategy that ex-
ogenously increased the long-term ownership levels in public companies that manage pris-
ons.15 At the end of 2012, the publicly-traded private prison management companies were
re-classified by the Internal Revenue Agency (IRS) as Real Estate Investment Trusts (REITs)
due to the fact that these private prison management companies were managing and owning
real estates (i.e., the prison facilities).16 The reclassification of private prison management
companies as REITs led to a sudden increase of the ETF ownership levels. This increase
was due to the fact that the publicly-traded prison management companies were included
in ETF that track the real estate industry. Figures 3, 4, and 5 plot ETF ownership levels
and average suicides, unexpected deaths, and suicide rates, respectively. Figures 7 plots the
ETF ownership of prison stocks and non-prison stocks around the REIT reclassification to
illustrate that the sudden increase in ETF ownership levels during the post-2012 period oc-
cur only in prison management companies. These figures show that there was a significant
increase in ETF ownership after the reclassification.
In order to draw a causal link between long-term ownership and social outcomes in pris-
ons, I use the REIT reclassification as an exogenous shock to long-term ownership in prisons
managed by public companies. The reason why this shock is a plausible and reliable identi-
fication strategy is due to the following reason. It is unlikely that the IRS reclassified prison
management companies with the intention to have a positive impact on prison outcomes,
but rather the improved prison conditions are more likely due to the exogenous increase in
long-term institutional ownership levels in public prison management companies (i.e., due to
the monitoring role of long-term investors). The exclusion restriction, therefore, is likely to
be met.
To examine the relevance condition, I analyze whether there is an increase in ETF own-
ership in the treated group due to the REIT reclassification. The treated group contains
15To the best of my knowledge, there are no prior studies that use the REIT reclassification of prisonmanagement companies that are publicly traded as an instrument for ETF ownership.
16See the Forbes article titled “Why Would A Prison Corporation Restructure As A Real Estate Company?”written by Matt Stroud in January 2013 for a discussion of this reclassification.
16

the set of prisons that are managed by a public prison management company prior to the
REIT reclassification of the given public company (i.e., all prisons that are impacted by this
exogenous shock), whereas the control group contains the remaining set of prisons (i.e., all
other prisons that are not managed by publicly-traded companies, and hence not impacted
by the REIT reclassification).17
In particular, I instrument ETF ownership by the treatment effect. The strictest fixed
effects version of the first-stage regression of the instrumental variable approach is as follows:
ETF Ownershipi,t = β0 + β1 1(Treatedi) × 1(Postt) + β2 1(Postt)
+ β3 1(Privatei,t) + βvXi,t + θi + εi,t
(7)
where t indexes year and i indexes the given prison, whereas Xi,t is a vector of relevant
time-varying prison-level control variables that may impact mortality rates and θi represent
prison fixed effects. Since I include prison fixed effects, the treated binary variable cannot
be separately estimated.
After estimating the first-stage regression, I use the estimated values of ETF ownership
in the second-stage regression. In particular, I run the following regression specification:
Log(1 + Suicidesi,t) = β0 + β1 ETF Ownershipi,t + β2 1(Postt)
+ β3 1(Privatei,t) + βvXi,t + θi + εi,t
(8)
where the notations and control variables are the same ones as in the first-stage regression.
4 Results
4.1 Negative consequences of privatization on society
In this section, I explore the relationship between prison privatization and social out-
comes. By controlling for an increasingly demanding set of fixed effects, I first examine the
relationship between privatization and suicides in Table 3. Consistent with the theoretical
17The treated prisons have a non-zero ETF ownership level prior to the REIT reclassification, but the ETFownership levels in these prisons doubles during the post-period due to the exogenous shock.
17

prediction of Hart, Shleifer, and Vishny (1997) that prison privatization may lead to poor
prison conditions due to incomplete contracts (i.e., mortality is difficult to contract on), I
find that there is a positive association between prison privatization and suicides.
The point estimates are statistically significant in each specification at the 1% level and
range from 0.276 to 0.387. Although the economic magnitudes are large in general, the
effects are especially stronger when prison fixed effects are included [i.e., columns (3) and
(6)]. This suggests that the impact of privatization on suicides is much larger when there
is a switch of management from the government to the private entity (or vice versa). As
well, the coefficients of the control variables are also consistent with prior studies [e.g., Hayes
(1995); Fazel et al. (2017); Cramer et al. (2017)]. It is also important to note that the
binary variables that measure the prison security types, which are time-invariant, cannot be
separately estimated in column 6 since I include prison fixed effects.
4.2 Institutional investors mitigate the negative consequences of
privatization
Although privatization leads to negative social outcomes in prisons, the ownership struc-
ture of the private enterprise may matter given that the owners of the private enterprise
have the residual right to make decisions on the non-contracted dimensions (i.e., social out-
comes) [Hart, Shleifer, and Vishny (1997)]. Benabou and Tirole (2010) and Hart and Zingales
(2017) highlight the importance of shareholders in social outcomes. In addition, prior em-
pirical studies, such as Dyck et al. (2019), find a positive association between institutional
ownership and corporate social responsibility outcomes. Therefore, to examine the role of
institutional investors when social costs arise due to privatization, I first take into account
the public ownership structure of the prison management company.
In Table 4, I document results that are consistent with the theoretical predictions of
Benabou and Tirole (2010) and Hart and Zingales (2017). In particular, there is a negative
relationship between total institutional ownership and social costs, suggesting that the neg-
ative consequences of privatization may be partially mitigated by an increase in institutional
ownership levels. The point estimates of total institutional ownership in Table 4 range be-
18

tween -0.010 and -0.012 where all of the point estimates are statistically significant at the 1%
level. It is also worthwhile to note that the point estimates are the largest when prison fixed
effects are included, suggesting that the results are primarily driven by prisons that had a
switch of management (i.e., from government to private or vice versa).
4.3 The role of long-term versus short-term investors
Benabou and Tirole (2010) raise the importance of long-term investors in corporate so-
cial responsibility outcomes by stating that “socially responsible investors should position
themselves as long-term investors who monitor management and exert voice to correct short-
termism.” To examine whether the role of long-term versus short-term investors is different
in regard to mitigating the negative consequences of privatization, I further break down total
institutional ownership to ownership by long-term versus short-term institutional investors.
In Table 5, I first use the holding duration measure of Lan, Moneta, and Wermers (2019) to
identify long-term versus short-term institutional investors. Given that holding duration is
not randomly assigned to investors, I use an alternative proxy that does not solely rely on
holding duration to identify long-term versus short-term investors.
In particular, the quasi-indexers and transient investors classification of Bushee (2001)
takes holding duration and investment style into account. It is a good proxy for long-term
versus short-term ownership since the annual portfolio turnovers of quasi-indexers is 33%,
whereas the turnover of transient institutional investors is 70%. As well, Bushee (2001) also
provides empirical evidence that there is a positive relationship between ownership by quasi-
indexers and long-term firm value. This is consistent with the fact that quasi-indexers have
a longer holding horizon and have to hold the given firm in its portfolio due to, for instance,
indexing. Hence, it is likely that quasi-indexers will monitor the prison management company
to ensure that long-term firm value is maximized that may also incorporate social outcomes
[since doing so positively impacts the value of assets under management, as raised by Appel,
Gormley, and Keim (2016, 2018)]. This is also consistent with the theoretical predictions
of Benabou and Tirole (2010). Furthermore, transient investors who have a short holding
horizon are more likely to influence the prison management company to implement decisions
that increase short-term profits, but may not have an incentive to take into account the
19

long-term consequences of a rise in social costs.
Consistent with this argument, I document in Tables 5 and 6 that the positive role
of institutional investors in mitigating negative consequences of privatization is primarily
driven by long-term institutional investors. In fact, there is a positive association between
ownership by short-term investors and suicides, suggesting that short-term investors do not
pay much attention to social outcomes (i.e., human costs of short-termism). In particular, in
Table 5, the point estimates of ownership by long-term investors range between -0.012 and
-0.015, whereas the point estimates of short-term ownership range between 0.018 and 0.019.
I document similar results in Table 6 when I use the alternative proxy for long-term versus
short-term ownership levels. Specifically, in Table 6, the point estimates, which are significant
at the 1% significance level, of quasi-indexer (transient) ownership range between -0.025 and
-0.027 (0.012 and 0.015) with the point estimates being the strongest in the within-prison
tests.
These results suggest that holding duration plays an important role in social outcomes.
Lastly, to examine what fraction of the social costs that arise due to privatization are miti-
gated by institutional investors, in Figure 8, I provide the total effects of institutional own-
ership types on suicide rates. On average, institutional investors offset approximately one
third of the social costs that arise as a result of privatizing prisons.
4.4 Heterogeneity of effects across institutional investor types
In this section, I examine whether the type of long-term investor matters for social out-
comes. By making use of the granular investor types provided by Bushee (2001), I document
that the mitigation of negative consequences by long-term institutional investors also varies
by investor types. Bushee (2001) documents that there is a strong positive association be-
tween ownership by independent investment advisors and companies, such as mutual funds,
and long-term firm value. It is likely that these types of investors may be more attentive to
social outcomes given the theoretical predictions of Benabou and Tirole (2010) that long-term
investors may drive corporate social responsibility outcomes.
In Table 7, I provide empirical evidence that long-term independent investment advisors
and companies play the most important role in mitigating the social negative consequences
20
of privatization. The point estimates of the independent investment advisors (companies)
ranges between -0.078 and -0.092 (-0.044 to -0.052) with all being significant at the 1% level.
Ownership by pension funds does not have a large impact on suicides given the small point
estimates (possibly due to the fact that there is not high ownership by these investors due
to public pressure to divest from prison stocks). However, it is important to note that there
is a negative, although small, association between pension fund ownership and suicides.
Given that in the next section I will present the results of an instrumental variable test
that relies on exogenous variation in ETF ownership in prison management companies, I
provide next the uninstrumented results of the relationship between ETF ownership and sui-
cides. In Table 8, I document that there is a negative relationship between ETF ownership
and suicides in prisons. This is consistent with the prior finding that long-term independent
investment advisors and companies, such as mutual funds, play an important role in miti-
gating the negative consequences of privatization. In particular, the point estimates of ETF
ownership range between -0.038 and -0.044 with the point estimates being the strongest in
the within-prison analysis.
4.5 Instrumental Variable Approach
In this section, by using a novel identification strategy, I study the causal relationship
between long-term ownership and suicides. In particular, to examine the causal relation-
ship between ETF ownership and suicides, I instrument the ETF ownership levels by the
treatment effect using an instrumental variable approach. The first-stage regression results
are provided in Table 9, Panel A. The point estimates of the treatment effect are statisti-
cally significant at the 1% level across all specifications. The economic magnitudes are also
large, ranging from 7.578 to 7.626. The first-stage F-statistics on the instrument is also
large (much larger than the conventional benchmark of 10), suggesting that the relevance
condition is met.
Furthermore, Table 9, Panel B provides the estimates of the second-stage regression. The
point estimates are between -0.072% and -0.081%, suggesting that a one percent increase in
ETF ownership reduces the average number of suicides by 7.2% to 8.1%. The magnitudes
are also the largest when prison fixed effects are included. As well, all of the point estimates
21

are statistically significant at the 1% level across all specifications. It is also important to
note that the prison fixed effects absorb the treated binary variable.
Lastly, the point estimates of the second-stage of the instrumental variable approach are
comparable to the point estimates in the baseline results provided in Table 8. Jiang (2017)
states that the economic magnitudes of the instrumental variable estimates of 255 articles
published in leading finance journals is, on average, 9.2 times larger than the magnitudes of
the OLS estimates. The magnitudes in the instrumental variable estimates reported in Table
9, Panel B are only around 1.8 times larger than the magnitudes of the OLS estimates.
5 The Mechanism
In this section, I examine why institutional investors may have an incentive to monitor
prison management firms that are held in their portfolios. In particular, I analyze a possible
channel that may provide a rational explanation on why an increase in the institutional
ownership leads to improvements in the social outcomes of prisons (e.g., reduction in suicides).
Prior studies, such as Arena and Julio (2015), provide empirical evidence that litigation
risk impacts corporate decisions. As well, corporate litigation is costly to firms both from a
valuation and reputation perspective.18 Until Congress passed the Prison Litigation Reform
Act in 1996, the high number of lawsuits against prisons, mostly based on frivolous reasons,
created a crisis in the federal court system [Belbot (2004)]. To resolve this crisis, Congress
engaged in legislative action to make it more challenging (e.g., by increasing administrative
fees) for inmates to sue for irrelevant cases (e.g., the famous case of an inmate filing a lawsuit
for not getting “peanut butter” in prison).19 The lawsuits that have been filed post-1996,
therefore, are more likely to be based on a legitimate reasons, such as poor prison conditions.
Given the endogenous nature of lawsuits (e.g., omitted variable bias), I use a proxy for
litigation risk following Colonnello and Herpfer (2019). The U.S. Chamber Institute for Legal
18Large shareholders of private prison management companies, such as BlackRock and Vanguard, are oftenmentioned in newspapers when the given private enterprise fails to provide humane conditions to inmates.For instance, see the Financial Times article titled “US investors confront home truths about private prisonholdings” published on Feb 26, 2020.
19For more details, see the statement regarding the “Peanut Butter Case” that Senator Dole raises regardingfrivolous prisoner-brought lawsuits in 141 Cong. Rec. S14413 (September 27, 1995).
22
Reform published an annual ranking of state courts in regard to the friendliness of the given
state’s law system to corporations [for more details, see Colonnello and Herpfer (2019)].
I use the ranking provided by the U.S. Chamber Institute for Legal Reform to examine
whether the relationship between institutional ownership and social outcomes are stronger
for prisons that are located in more corporation unfriendly states (i.e., plaintiff friendly
states). The reason of using such a proxy is due to the fact that if a prison is located in a
state in which it is easier to sue corporations, prisoners or their families are more likely to sue
prison management companies for poor prison conditions or negligence by management that
contributed to the success of a suicide. To avoid costly settlements, therefore, institutional
investors have an incentive to monitor private prison management companies to ensure that
management does not cut on important costs that negatively impact prison conditions and
increase the probability of being sued.
As well, institutional investors are more likely to be attentive to social outcomes if prisons
harm the reputation of the institution, and have an indirect impact on fund flows. Various
social advocacy groups, for instance, urge citizens to contact institutional investors that
manage their retirement plans to be more socially responsible with their prison investments.
If institutional investors are not socially responsible, these advocacy groups urge that citizens
should opt to different providers. Such calls typically rise when there are lawsuits against
prisons. Hence, if institutional investors indeed partially offset the social costs of prison
privatization, they are more likely to act when there are higher litigation risks.
Using the litigation proxy, in Table 10, I document that the association between suicides
and long-term ownership, proxied by ETF ownership, is stronger for prisons that are located
in more plaintiff friendly (i.e., business unfriendly) states. The relationship is monotonically
stronger with the litigation ranking. For instance, the point estimates of the interaction term
between ETF ownership and the top 10 most friendly plaintiff state range between -0.025
and -0.030, whereas the interaction between the next highest ranked states (i.e., 11 to 20)
have point estimates ranging between -0.018 and -0.021. As well, I do not include state times
year fixed effects since the litigation ranking is at the state-year level.
Given that the litigation and reputation risk results make use of endogenous ownership
levels, I use the REIT reclassification as an exogenous source of variation in long-term own-
23

ership levels and interact it with the 2012 state litigation rankings. It is unlikely that the
litigation risk proxies are impacted by the REIT reclassification in 2012 since this ownership
shock is completely unrelated to a state’s litigation ranking (i.e., rankings are orthogonal to
the ownership shock). I use an instrumental variable approach by interacting the ETF own-
ership levels with the litigation rankings in 2012 (i.e., pre-period). In particular, in the first
stage regressions, I use the interaction between treatment (as defined before) and the given
ranking quartile (e.g., top 10) as an instrument for the interaction between ETF ownership
and the given ranking quartile. Each of the five first stage regressions have a F-Statistics
greater than 10 across all specifications.
Table 11 presents the second-stage results in which I use the predicted values from the
five first stage regressions in lieu of the interaction between ETF ownership and the litigation
ranking quartilem. The point estimates of the interaction term are monotonically increasing
in the ranking score quartile and the point estimates are two times of magnitude of the
uninstrumented point estimates. These results suggest that the long-term ownership effects
on suicides are much stronger for prisons that are located in states that have a judiciary
system which is more friendly to plaintiffs. In particular, prisons in such states are more
likely to be successfully sued for negligence by management that contributes to the given
inmate committing suicide. Hence, the monitoring effects are larger in such states given that
there is a higher potential monetary and reputation cost. As in Arena and Julio (2015), I
also use an alternative proxy for litigation risk, peer prison litigation, and document similar
results. The findings are provided in Tables A35 and A36 of the Appendix.
6 Robustness
I perform a variety of additional robustness checks for the baseline specification. For
instance, one may be concerned that actual suicides are misclassified as non-suicides. Instead
of using the total number of suicides, I use different dependent variables. In particular, I
use unexpected deaths, which is defined as the sum of the number of suicides, homicides,
accidents, and unnatural deaths, and also total deaths as dependent variables. Tables A2
to A7 of the Appendix provide the results of using alternative definitions of mortality. The
24

results are similar to the ones reported in the main tables.
As well, since the total number of suicides may be correlated with the average number of
inmates housed in a given prison, I use an alternative definition of suicides. Specifically, in
Tables A8 to A10 of the Appendix, the dependent variable is suicide rates, which is defined
as total suicides scaled by the average number of inmates housed in the given prison during
the given year. The results are similar to the baseline results of Tables 3 to 8.
Furthermore, Tables A11 and A12 of the Appendix provides the extensive margin of
long-term ownership and ETF ownership on suicides. In other words, this table examines
the association between having at least some long-term ownership and ETF ownership on
suicides. In Table A11 of the Appendix, the point estimates of long-term ownership effects
range from -0.183 to -0.197, whereas in Table A12 of the Appendix, the point estimates
of ETF ownership range from -0.177 to -0.193. All of the point estimates are statistically
significant at the 1%.
I also use a variety of other outcomes variables that measure the prison conditions. In
Tables A15 and A16 of the Appendix, I use suicide prevention programs, whereas in Tables
A17 and A18, I use the total number of rehabilitation programs offered in prisons. I find
similar results as the baseline findings that long-term ownership and ETF ownership leads
to improvements in prison conditions. I also use an overcrowding outcome variable in Tables
A23, A24, and A27, and use total number of correctional officers hired per inmate in Tables
A25, A26, and A28. Moreover, when I break down long-term ownership and use alternative
outcome variables in Tables A29 to A33, I obtain similar results as the main results that
long-term investment advisors and companies have the strongest positive effects on prison
outcomes. In Table A34, I examine whether the baseline results are robust to excluding the
prisons managed by the government. I document similar results as the baseline findings.
Lastly, I use a Poisson model to estimate the baseline tests. Tables A19 and A20 of the
Appendix are comparable to Tables A5 and A8, respectively, except that I use a Poisson
model rather than an OLS model given the count nature of the dependent variable. In Table
19, the incidental-rate ratios of long-term ownership range between 0.953 and 0.960. An
incidental-rate ratio below one represents a negative relationship between the given indepen-
dent variable and dependent variable. The unreported point estimates of the Poisson (i.e.,
25

the natural logarithmic transformations of the incidental-rate ratios) are similar to the point
estimates of Table 5. The point estimates of Table A20 are also similar to the ones reported
in Table 8.
Similarly, to determine whether a standard Poisson model or a zero-inflated Poisson model
is more appropriate, in unreported tests I compared the Akaike information criterion (AIC)
and Bayesian information criterion (BIC) of the estimations. The standard Poisson model
appears to be the more appropriate model (since both the AIC and BIC are smaller). I
also examined whether there was over dispersion (or under dispersion) since a Poisson would
not be appropriate in such a case, and compared the goodness of fit of Poisson model to
the negative binomial model (another alternative model that works better when there is
dispersion). Again, the standard Poisson model appears to be the better model. Given the
similar point estimates of the Poisson model and baseline results (in regard to economic
magnitudes and statistical significance), therefore, the choice of the empirical model does
not drive the results. Lastly, to ensure that my model estimates are robust given there are
not significantly many private prison management companies, I use a wild bootstrapping
method with 10,000 bootstrap replications and plot the results in Figures A1 and A2.
7 Conclusion
Over the past three decades, with the increasing evidence of the weaknesses of in-house
government service provisions, there has been a shift to privatize important public services,
such as prisons. Prior studies, such as the seminal work by Hart, Shleifer, and Vishny (1997),
suggest that privatizing prisons may lead to a rise in social costs since private operators
may have incentives to reduce costs that negatively impact the qualify of prisoner lives.
None of the prior studies, however, take into account the public ownership structure of the
private enterprise that may play an important role in examining the social consequences of
privatization.
By taking into account the ownership structure of private prisons, I find empirical evidence
that institutional investors play an important role in mitigating the social cost associated
with privatization. The effects of institutional ownership, however, depend on the type of
26
investor since the attentiveness of shareholders to corporate social responsibility outcomes
differs across investor type.
To capture the heterogeneity in the attentiveness of shareholder to social outcomes, I first
break down the ownership levels into one of the most commonly used institutional ownership
categories: ownership by short-term versus long-term investors. I find evidence that the
positive social effects of institutional ownership are primarily driven by long-term investors
given that these investors are more attentive to the long-term value of the firm, providing
empirical evidence to support the theoretical predictions of Hart (2017) and Benabou and
Tirole (2010). To further examine the attentiveness to social outcomes across different long-
term institutional investors, I further break down long-term ownership into ownership by
granular long-term investor types. In particular, I find that the positive social effects of long-
term institutional ownership are primarily driven by investment advisors and companies, such
as mutual funds. I also show that the relationship between social outcomes and ownership
by long-term institutional investors is causal by developing a new identification strategy.
Long-term institutional investors, such as investment advisors and companies, often hold
stocks due to tracking an index. Such institutional investors may not be able to use exit
as a voice if managers of portfolio firms fail to maximize long-term value and act socially
responsibly. In this paper, I find that institutional investors may be able to use their voice
(i.e., monitoring role) to exert influence on managers to ensure that firms operate more
socially responsibly.
Furthermore, in order to determine why institutional investors may have an incentive to
monitor portfolio firms, I find a novel economic mechanism that provides a possible expla-
nation. Given that lawsuits are costly to firms and shareholders, both from a valuation and
reputation perspective, I find that the institutional ownership results are stronger in prisons
that are located in states where it is more likely to successfully sue corporations. By using a
proxy for litigation risk, I find evidence that investors are more attentive to social outcomes
when there is higher litigation risk since failing to do so has a harm to the reputation of the
institutional investors. Failing to be socially responsible may, therefore, impact fund flows.
Overall, my paper highlights the importance of institutional investors in society since they
improve the quality of outsourced government services. Prisons as well as the conditions in
27

which prisoners are rehabilitated play an important role in society and overall welfare. Al-
though privatization of prisons may lead to a rise in social costs due to incomplete contracts,
such social costs are partially mitigated, on average, by factor of one third, by the moni-
toring role of institutional investors. Forcing institutional investors, such as pension funds
or investment advisors, to divest from public prison management companies may lead to
unintended consequences, such as a rise in social costs.
28
References
Aghion, P., J. Van Reenen, and L. Zingales (2013). Innovation and Institutional Ownership. TheAmerican Economic Review 103 (1), 277–304.
Appel, I. R., T. A. Gormley, and D. B. Keim (2016). Passive investors, not passive owners. Journalof Financial Economics 121 (1), 111–141.
Appel, I. R., T. A. Gormley, and D. B. Keim (2018). Standing on the Shoulders of Giants: TheEffect of Passive Investors on Activism. The Review of Financial Studies 32 (7).
Arena, M. and B. Julio (2015). The Effects of Securities Class Action Litigation on CorporateLiquidity and Investment Policy. Journal of Financial and Quantitative Analysis 50 (1-2), 251–275.
Azim, M. (2019). Passive Demand but Active Pay: The Effect of ETF Flows on CEO Stock OptionCompensation. Rotman School of Management Working Paper .
Baland, J.-M. and P. Francois (2005). Commons as insurance and the welfare impact of privatiza-tion. Journal of Public Economics 89 (2), 211–231.
Banerjee, A., R. Hanna, J. Kyle, B. A. Olken, and S. Sumarto (2019). Private outsourcing andcompetition: Subsidized food distribution in Indonesia. Journal of Political Economy 127 (1),101–137.
Bartling, B., R. A. Weber, and L. Yao (2015). Do Markets Erode Social Responsibility. TheQuarterly Journal of Economics 130 (1), 219–266.
Bayer, P., R. Hjalmarsson, and D. Pozen (2009). Building criminal capital behind bars: Peer effectsin juvenile corrections. The Quarterly Journal of Economics 124 (1), 105–147.
Bebchuk, L. A. and S. Hirst (2019). Index funds and the future of corporate governance: Theory,evidence, and policy. Columbia Law Review 119 (8), 2029–2146.
Belbot, B. (2004). Report on the Prison Litigation Reform Act: What have the courts decided sofar? The Prison Journal 84 (3), 290–316.
Ben-David, I., F. Franzoni, and R. Moussawi (2018). Do ETFs Increase Volatility? The Journal ofFinance 73 (6), 2471–2535.
Ben-David, I., F. A. Franzoni, R. Moussawi, and J. Sedunov (2020). The Granular Nature of LargeInstitutional Investors. Managemment Science, forthcoming .
Benabou, R. and J. Tirole (2010). Individual and corporate social responsibility. Econom-ica 77 (305), 1–19.
Besley, T. and M. Ghatak (2001). Government Versus Private Ownership of Public Goods. TheQuarterly Journal of Economics 116 (4), 1343–1372.
Brochet, F., M. Loumioti, and G. Serafeim (2015). Speaking of the Short-Term: Disclosure Horizonand Managerial Myopia. Review of Accounting Studies 20 (3), 1122–1163.
29
Bushee, B. J. (1998). The influence of institutional investors on myopic R&D investment behavior.The Accounting Review 73 (3), 305–333.
Bushee, B. J. (2001). Do Institutional Investors Prefer Near-Term Earnings over Long-Run Value?Contemporary Accounting Research 18 (2), 207–246.
Benabou, R. and J. Tirole (2010). Individual and Corporate Social Responsibility. Econom-ica 77 (305), 1–19.
Chattopadhyay, A., M. Shaffer, and C. Wang (2020). Governance through shame and aspiration:Index creation and corporate behavior. Journal of Financial Economics 135 (3), 704–724.
Chen, T., H. Dong, and C. Lin (2020). Institutional shareholders and corporate social responsibility.Journal of Financial Economics 135 (2), 483–504.
Colonnello, S. and C. Herpfer (2019). Do Courts Matter for Firm Value? Evidence from the U.S.Court System. Emory University Working Paper .
Cramer, R. J., H. J. Wechsler, S. L. Miller, and E. Yenne (2017). Suicide Prevention in CorrectionalSettings: Current Standards and Recommendations for Research, Prevention, and Training.Journal of Correctional Health Care 23 (3), 313–328.
Crane, A. D., A. Koch, and S. Michenaud (2019). Institutional investor cliques and governance.Journal of Financial Economics 133 (1), 175–197.
Crane, A. D., S. Michenaud, and J. P. Weston (2016). The Effect of Institutional Ownershipon Payout Policy: Evidence from Index Thresholds. The Review of Financial Studies 29 (6),1377–1408.
Dyck, A., K. V. Lins, L. Roth, and H. F. Wagner (2019). Do institutional investors drive corporatesocial responsibility? International evidence. Journal of Financial Economics 131 (3), 693–714.
Eaton, C., S. Howell, and C. Yannelis (2019). When Investor Incentives and Consumer InterestsDiverge: Private Equity in Higher Education. The Review of Financial Studies (212).
Fazel, S., T. Ramesh, and K. Hawton (2017). Suicide in prisons: an international study of prevalenceand contributory factors. The Lancet Psychiatry 4 (12), 946–952.
Fisman, R., G. Heal, and V. B. Nair (2005). Corporate Social Responsibility: Doing Well by DoingGood. Columbia University Working Paper .
Fisman, R. and Y. Wang (2015). The Mortality Cost of Political Connections. The Review ofEconomic Studies 82 (4), 1346–1382.
Fisman, R. and Y. Wang (2017). The Distortionary Effects of Incentives in Government: Evidencefrom China’s“Death Ceiling” Program. American Economic Journal: Applied Economics 9 (2),202–218.
Gormley, T. A. and D. A. Matsa (2014). Common errors: How to (and Not to) control for unob-served heterogeneity. The Review of Financial Studies 27 (2), 617–661.
Gotsch, K. and V. Basti (2018). Capitalizing on Mass Incarceration: US Growth in Private Prisons.Sentencing Project .
30

Gutierrez, G. and T. Philippon (2018). Ownership, concentration, and investment. AmericanEconomic Association Papers and Proceedings 108, 432–37.
Hart, O. (2017). Incomplete contracts and control. The American Economic Review 107 (7), 1731–1752.
Hart, O., A. Shleifer, and R. W. Vishny (1997). The proper scope of government: Theory and anapplication to prisons. The Quarterly Journal of Economics 112 (4), 1127–1161.
Hart, O. and L. Zingales (2017). Companies Should Maximize Shareholder Welfare Not MarketValue. Journal of Law, Finance, and Accounting 2 (2).
Hayes, L. M. (1995). Prison suicide: an overview and guide to prevention. The Prison Journal 75 (4),431–456.
Jiang, W. (2017). Have instrumental variables brought US closer to the truth. The Review ofCorporate Finance Studies 6 (2), 127–140.
Kamerman, S. B. and A. J. Kahn (2014). Privatization and the Welfare State. Princeton UniversityPress.
Krueger, P., Z. Sautner, and L. T. Starks (2020). The importance of climate risks for institutionalinvestors. The Review of Financial Studies 33 (3), 1067–1111.
Lan, C., F. Moneta, and R. Wermers (2019). Holding Horizon: A New Measure of Active InvestmentManagement. University of Maryland Working Paper .
Lewellen, J. W. and K. Lewellen (2018). Institutional Investors and Corporate Governance: TheIncentive to Be Engaged. Dartmouth College Working Paper .
Liang, H. and L. Renneboog (2017). On the Foundations of Corporate Social Responsibility. TheJournal of Finance 72 (2), 853–910.
Lins, K. V., H. Servaes, and A. Tamayo (2017). Social Capital, Trust, and Firm Performance:The Value of Corporate Social Responsibility during the Financial Crisis. The Journal of Fi-nance 72 (4), 1785–1824.
Lopez-de Silanes, F., A. Shleifer, and R. W. Vishny (1997). Privatization in the United States.RAND Journal of Economics 28 (3), 447–471.
Mcguire, J. B., A. Sundgren, and T. Schneeweis (1988). Corporate Social Responsibility and FirmFinancial Performance. The Academy of Management Journal 31 (4), 854–872.
Megginson, W. L. and J. M. Netter (2001). From state to market: A survey of empirical studies onprivatization. Journal of Economic Literature 39 (2), 321–389.
Mukherjee, A. (2020). Impacts of Private Prison Contracting on Inmate Time Served and Recidi-vism. American Economic Journal: Economic Policy, forthcoming .
Schmidt, C. and R. Fahlenbrach (2017). Do exogenous changes in passive institutional ownershipaffect corporate governance and firm value? Journal of Financial Economics 124 (2), 285–306.
31

Shiller, R. J. (2013). Reflections on finance and the good society. The American Economic Re-view 103 (3), 402–405.
Shleifer, A. (1998). State versus Private Ownership. Journal of Economic Perspectives 12 (4),133–150.
Starks, L. T., P. Venkat, and Q. Zhu (2017). Corporate ESG profiles and investor horizons. Uni-versity of Texas at Austin Working Paper .
Yegen, E. (2019). Common-Ownership and Portfolio Rebalancing. Rotman School of ManagementWorking Paper .
32

Figure 1: Private Prisons Across the United States in 2000
This figure shows which states had at least one private prison at the beginning of the sample (i.e., 2000). The blue coloured states legallypermit the privatization of prisons, whereas the grey coloured states do not legally permit the privatization of prisons.
33
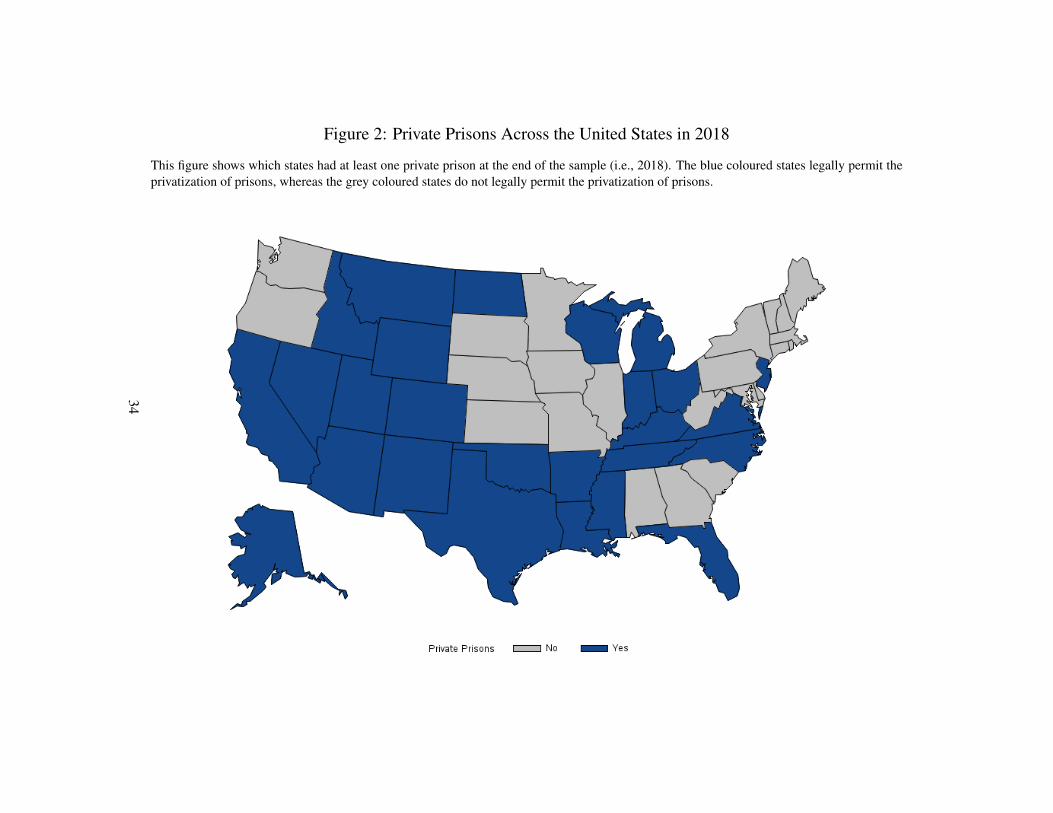
Figure 2: Private Prisons Across the United States in 2018
This figure shows which states had at least one private prison at the end of the sample (i.e., 2018). The blue coloured states legally permit theprivatization of prisons, whereas the grey coloured states do not legally permit the privatization of prisons.
34

Figure 3: Average ETF Ownership and Suicides
This figure shows the publicly traded prison management companies’ average exchange-traded fund (ETF)ownership patterns. Average ETF Ownership is defined as the mean of the fraction of outstanding sharesheld in ETFs. The holdings were aggregated to the year-level. At the end of 2012, prison managementcompany were re-classified by the Internal Revenue Service (IRS) as Real Estate Investment Trust (REIT),which had an impact on the ETF ownership levels. Average Suicides is defines as the mean of the suicidesthat occurred during a given year in a prison that is managed by a prison management company which isincluded in the sample.
35
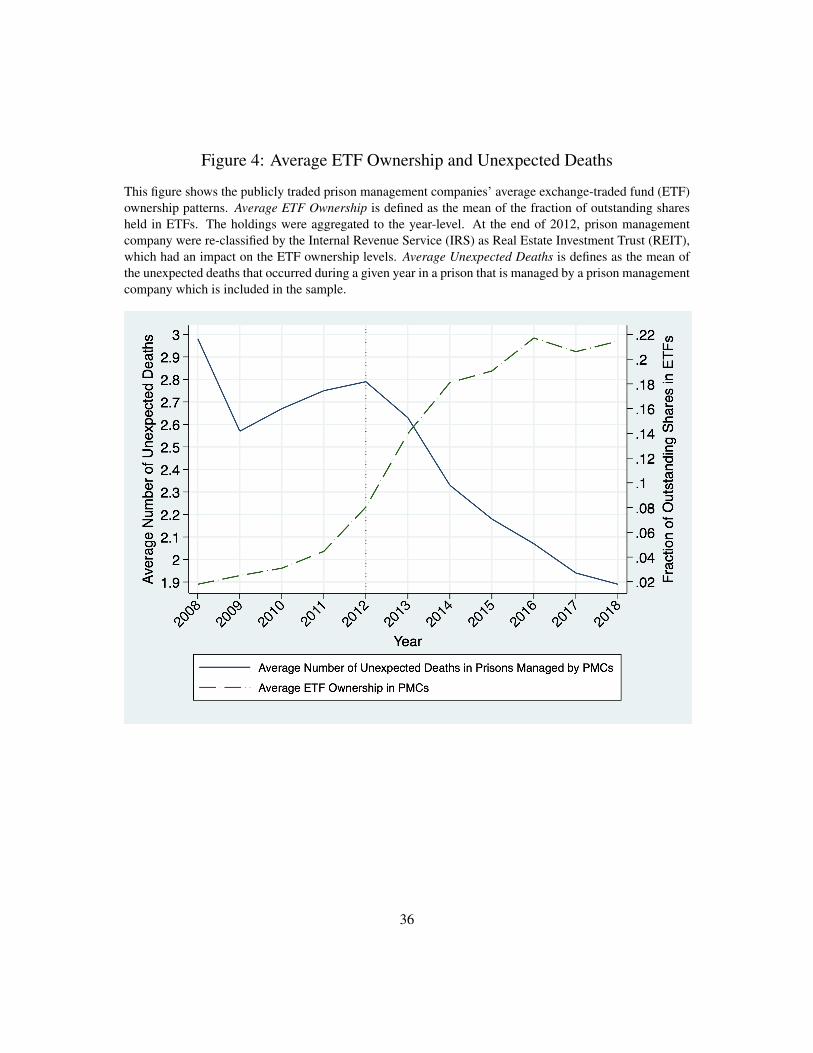
Figure 4: Average ETF Ownership and Unexpected Deaths
This figure shows the publicly traded prison management companies’ average exchange-traded fund (ETF)ownership patterns. Average ETF Ownership is defined as the mean of the fraction of outstanding sharesheld in ETFs. The holdings were aggregated to the year-level. At the end of 2012, prison managementcompany were re-classified by the Internal Revenue Service (IRS) as Real Estate Investment Trust (REIT),which had an impact on the ETF ownership levels. Average Unexpected Deaths is defines as the mean ofthe unexpected deaths that occurred during a given year in a prison that is managed by a prison managementcompany which is included in the sample.
36

Figure 5: Average ETF Ownership and Suicide Rates
This figure shows the publicly traded prison management companies’ average exchange-traded fund (ETF)ownership patterns. Average ETF Ownership is defined as the mean of the fraction of outstanding sharesheld in ETFs. The holdings were aggregated to the year-level. At the end of 2012, prison managementcompany were re-classified by the Internal Revenue Service (IRS) as Real Estate Investment Trust (REIT),which had an impact on the ETF ownership levels. Average Suicide Rate is defines as the mean of thesuicide rates (i.e., total suicides divided by total population) that occurred during a given year in a prisonthat is managed by a prison management company which is included in the sample.
37

Figure 6: ETF ownership of public prison management companies compared toall other companies
This figure shows the patterns of exchange-traded fund (ETF) ownership in publicly traded prisonmanagement companies compared to the ETF ownership in other public companies where ETF owenrshipis defined as the average number of shares held in ETF divided by the average number of outstandingshares. All of the numbers are aggregated to the year-level.
38

Figure 7: Total e↵ects of ownership by various institutional investor types onsuicide rates
This figure plots what fraction of suicide rates are mitigated by various institutional investor types. Forinstance, the first bar plots the total e↵ect of bank trusts, whereas the second bar plots the total e↵ect ofindexers on social costs.
39

Table 1: Summary StatisticsThis table provides the summary statistics. Suicide, Unexpected Death, and Total Death are the number of suicides,unexpected deaths, and deaths that occurred in prisons, respectively. Private is a binary variable that takes the value ofone whenever the prison is managed by a non-government entity. Maximum, Minimum, and All take the value of onewhether a prison is a maximum, minimum, or all security levels prison, respectively. Change Health Provider takesthe value of one whether the prison’s health provider changed during the given year. Race AA [Race W] is the fractionof African American [White] inmates housed in the given prions. The variables Sent. Length measure the fractionof inmates who are sentenced for the given length in the given prison, whereas O↵ense Type measures the fraction ofinmates who have committed crimes that fall into the o↵ense classes (where Class 1 is the most severe o↵enses, suchas homicide). Similarly, the Inmate Age variables are the fraction of total number of inmates that fall into the givenage group. Prison Age and Pop. Turnover measure how old the given prison is and what fraction of the current inmatepopulation is newly admitted, respectively. Suicide Prevention Programs (Total Number of Programs) measures thenumber of programs that are related to suicide prevention (all programs).
Mean Standard Deviation Number of Observations
Private 0.122 0.327 16,195Total Inst. Ownership 0.044 0.193 16,195Short-term Inst. Ownership 0.016 0.075 16,195Long-term Inst. Ownership 0.028 0.145 16,195ETF Ownership 0.013 0.076 16,195All Security 0.115 0.319 16,195Maximum Security 0.207 0.405 16,195Minimum Security 0.302 0.489 16,195Suicide 0.673 0.816 16,195Unexpected Death 1.746 1.702 16,195Total Death 3.823 3.957 16,195Suicide Rate 0.001 0.004 16,166Unexpected Death Rate 0.002 0.011 16,166Total Death Rate 0.006 0.077 16,166Total Capacity 1,055.88 828.35 16,190Total Population 1,039.12 910.11 16,195Capacity Design 0.975 0.990 16,195Change Health Provider 0.039 0.319 16,195Recidivism 0.276 0.177 16,195Sent. Length[1,5] 0.178 0.123 16,195Sent. Length(5,10] 0.252 0.193 16,195Sent. Length(10,20] 0.171 0.117 16,195Sent. Length(20,35] 0.134 0.077 16,195Sent. Length>35 0.176 0.206 16,195O↵ense Class 1 0.070 0.171 16,195O↵ense Class 2 0.177 0.108 16,195O↵ense Class 3 0.237 0.198 16,195O↵ense Class 4 0.161 0.071 16,195O↵ense Class 5 0.275 0.095 16,195Race AA 0.405 0.390 16,195Race W 0.375 0.206 16,195Inmate Age(30,49] 0.635 0.121 16,195Inmate Age>60 0.075 0.271 16,195Prison Age 32.33 32.30 16,195Female 0.086 0.176 15,000Pop. Turnover 0.309 0.229 16,195Suicide Prevention Programs 4.379 1.167 15,961Total Number of Programs 29.977 11.899 15,967
40

Table 2: Di↵erence in means of key variablesThis table provides the di↵erence in means of key variables. The definition of each variable is provided in Table 1.Private contains the set of prisons that are managed by a non-government institution, whereas Non-Private containsthe set of prisons that are managed by the government.
Non-Private Private Di↵erence in means P-value of Di↵erence
Suicide 0.597 1.033 -0.436*** 0.000(0.005) (0.026)
Unexpected Deaths 1.553 2.129 -0.576*** 0.000(0.008) (0.023)
Total Deaths 2.700 3.707 -1.007*** 0.000(0.070) (0.107)
Suicide Rates 0.001 0.002 -0.001*** 0.000(0.000) (0.000)
Unexpected Death Rates 0.001 0.004 -0.003*** 0.000(0.000) (0.000)
Total Death Rates 0.005 0.009 -0.004** 0.020(0.001) (0.001)
Recidivism 0.240 0.280 -0.040*** 0.000(0.001) (0.004)
Maximum Security 0.220 0.104 0.116*** 0.000(0.003) (0.007)
Minimum Security 0.299 0.318 -0.018** 0.043(0.003) (0.010)
All Security 0.121 0.067 0.054*** 0.000(0.003) (0.006)
Prison Age 34.07 15.47 18.597*** 0.000(0.280) (0.314)
Suicide Prevention Programs 4.534 3.261 1.273*** 0.000(0.009) (0.019)
Total Number of Programs 30.351 27.289 3.063*** 0.000(0.103) (0.194)
Total Capacity 1,058.057 1,040.233 17.823 0.815(7.076) (15.941)
Total Population 1,038.485 1,043.674 -5.188 0.406(7.794) (17.029)
Change in Health Provider 0.040 0.039 0.001 0.529(0.001) (0.003)
Overcrowding Ratio 0.963 1.068 -0.106*** 0.000(0.003) (0.061)
Pop. Turnover 0.300 0.310 -0.010 0.681(0.001) (0.005)
41

Table 3: Inmate suicides as a function of prison privatizationThis table shows the relationship between privatization and suicides. The dependent variable is defined as the log-arithmic transformation of one plus total suicides that occurred during a given year and prison. The main variableof interest, (Privatei,t), is a binary variable that takes the value of one whenever the prison is managed by a non-government institution, zero otherwise. All of the control variables are defined in Table 1. Standard errors are reportedin parentheses and are clustered at the prison-level.
Dependent Variable: Log(1+Total Suicidesi,t)
(I) (II) (III) (IV) (V) (VI)
(Privatei,t) 0.278*** 0.276*** 0.387*** 0.304*** 0.304*** 0.382***(0.015) (0.015) (0.036) (0.014) (0.015) (0.036)
(Maximumi) 0.111*** 0.111***(0.015) (0.016)
(Minimumi) �0.010 �0.011(0.010) (0.011)
(Alli) 0.033 0.034(0.020) (0.021)
(� Health Provideri,t) �0.089*** �0.091*** �0.075**(0.031) (0.028) (0.032)
Recidivismi,t 0.012* 0.013* 0.009(0.007) (0.006) (0.007)
Femalei,t �0.046*** �0.045*** �0.011**(0.015) (0.014) (0.005)
Capacity Ratioi,t 0.007 0.006 0.009**(0.004) (0.004) (0.003)
Race AAi,t �0.001*** �0.001** �0.001***(0.000) (0.000) (0.000)
Race Wi,t 0.016 0.012 0.009(0.099) (0.098) (0.132)
Sent. Length[1,5], i,t �0.077 �0.084 �0.074(0.180) (0.177) (0.170)
Sent. Length(5,10], i,t 0.007* 0.004 0.005(0.004) (0.004) (0.003)
Sent. Length(10,20], i,t �0.025* �0.027** �0.023*(0.013) (0.013) (0.014)
Sent. Length(20,35], i,t 0.089** 0.083* 0.082*(0.043) (0.044) (0.045)
Sent. Length>35, i,t �0.007* �0.004 �0.005(0.004) (0.004) (0.003)
O↵ense Class 1i,t 0.023*** 0.018** 0.017***(0.008) (0.009) (0.006)
O↵ense Class 2i,t �0.003 0.044 0.042(0.099) (0.098) (0.085)
continues on the next page
42

Table 3: Inmate suicides as a function of prison privatization (cont.)
Dependent Variable: Log(1+Total Suicidesi,t)
(I) (II) (III) (IV) (V) (VI)
O↵ense Class 3i,t 0.002 0.001 0.002(0.005) (0.005) (0.006)
O↵ense Class 4i,t �0.070 �0.081 �0.040(0.102) (0.101) (0.102)
O↵ense Class 5i,t 0.093 0.09*** 0.075(0.133) (0.011) (0.138)
Inmate Age(30,49], i,t 0.000 0.000 0.001(0.001) (0.001) (0.001)
Inmate Age>60, i,t 0.001 0.001 0.000(0.004) (0.005) (0.004)
Log(Prison Agei,t) 0.029*** 0.028*** 0.016*(0.004) (0.005) (0.009)
Pop. Turnoveri,t 0.073** 0.071** 0.081***(0.032) (0.031) (0.031)
Fixed E↵ectsYear X X X XState X XYear⇥State X XPrison X X
Observations 16,175 16,158 16,059 15,041 15,041 14,941R-squared 0.144 0.193 0.353 0.172 0.205 0.358
43

Table 4: Inmate suicides as a function of total institutional ownershipThis table shows the relationship between total institutional ownership and suicides in prisons. The dependent vari-able is defined as the logarithmic transformation of one plus total suicides that occurred during a given year andprison. Total Inst. Ownershipi,t is defined as total institutional ownership in the given prison management company.
(Privatei,t) is a binary variable that takes the value of one whenever the prison is managed by a private entity. All ofthe control variables are the same ones of Table 3. Standard errors are reported in parentheses and are clustered at theprison-level.
Dependent Variable: Log(1+Total Suicidesi,t)
(I) (II) (III) (IV) (V) (VI)
Total Ins. Ownershipi,t -0.011*** -0.011*** -0.012*** -0.010*** -0.011*** -0.011***(0.002) (0.002) (0.003) (0.003) (0.003) (0.003)
(Privatei,t) 0.331*** 0.330*** 0.363*** 0.355*** 0.358*** 0.369***(0.016) (0.017) (0.048) (0.017) (0.018) (0.049)
Control Variables X X X
Fixed E↵ectsYear X X X XState X XYear⇥State X XPrison X X
Observations 16,175 16,158 16,059 15,041 15,041 14,941R-squared 0.147 0.195 0.353 0.174 0.199 0.358
44
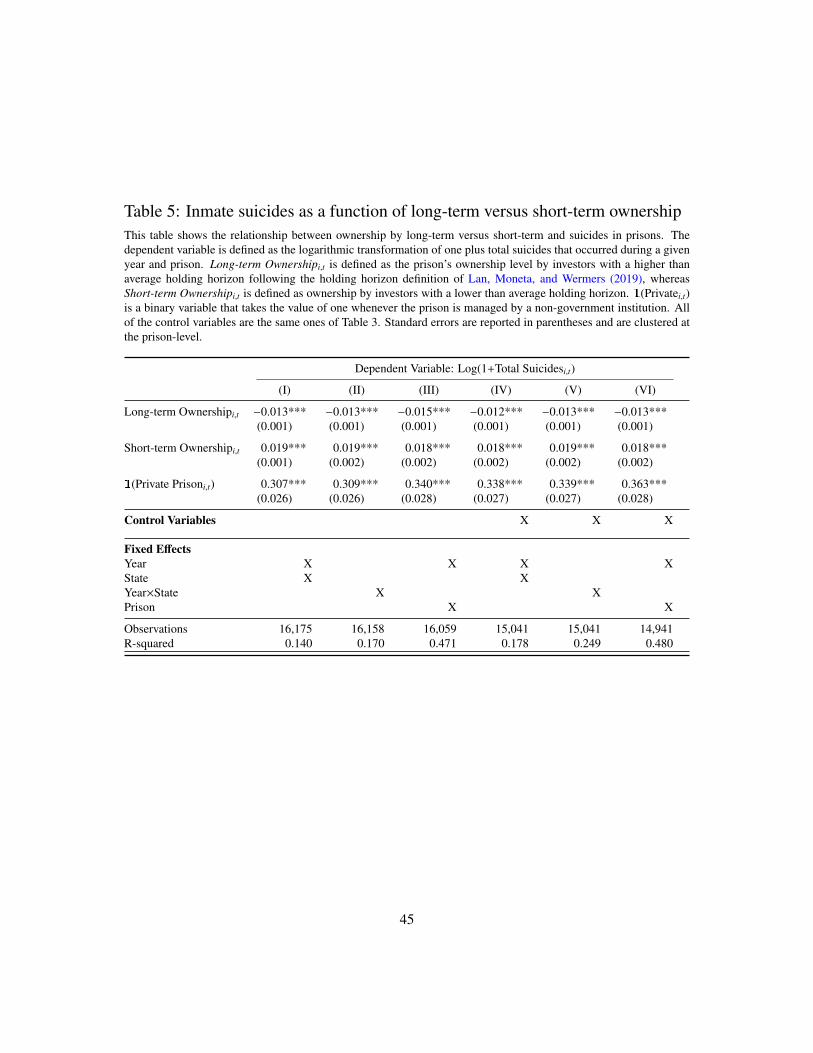
Table 5: Inmate suicides as a function of long-term versus short-term ownershipThis table shows the relationship between ownership by long-term versus short-term and suicides in prisons. Thedependent variable is defined as the logarithmic transformation of one plus total suicides that occurred during a givenyear and prison. Long-term Ownershipi,t is defined as the prison’s ownership level by investors with a higher thanaverage holding horizon following the holding horizon definition of Lan, Moneta, and Wermers (2019), whereasShort-term Ownershipi,t is defined as ownership by investors with a lower than average holding horizon. (Privatei,t)is a binary variable that takes the value of one whenever the prison is managed by a non-government institution. Allof the control variables are the same ones of Table 3. Standard errors are reported in parentheses and are clustered atthe prison-level.
Dependent Variable: Log(1+Total Suicidesi,t)
(I) (II) (III) (IV) (V) (VI)
Long-term Ownershipi,t �0.013*** �0.013*** �0.015*** �0.012*** �0.013*** �0.013***(0.001) (0.001) (0.001) (0.001) (0.001) (0.001)
Short-term Ownershipi,t 0.019*** 0.019*** 0.018*** 0.018*** 0.019*** 0.018***(0.001) (0.002) (0.002) (0.002) (0.002) (0.002)
(Private Prisoni,t) 0.307*** 0.309*** 0.340*** 0.338*** 0.339*** 0.363***(0.026) (0.026) (0.028) (0.027) (0.027) (0.028)
Control Variables X X X
Fixed E↵ectsYear X X X XState X XYear⇥State X XPrison X X
Observations 16,175 16,158 16,059 15,041 15,041 14,941R-squared 0.140 0.170 0.471 0.178 0.249 0.480
45

Table 6: Suicides as a function of a long-term versus short-term ownership proxyThis table shows the relationship between an alternative long-term and short-term institutional ownership proxy andsuicides. In particular, following Bushee (2001), Quasi-Indexer Ownershipi,t is a proxy for long-term ownership,whereas Transient Ownershipi,t is a proxy for short-term ownership given the annual portfolio turnover of 33% versus70%, respectively. The dependent variable is defined as the logarithmic transformation of one plus total suicides thatoccurred during a given year and prison. Quasi-Indexer Ownershipi,t and Transient Ownershipi,t is defined as thegiven prison’s ownership by quasi-indexers and transient institutional investors. (Privatei,t) is a binary variable thattakes the value of one whenever the prison is managed by a non-government institution. All of the control variablesare the same ones of Table 3. Standard errors are reported in parentheses and are clustered at the prison-level.
Dependent Variable: Log(1+Total Suicidesi,t)
(I) (II) (III) (IV) (V) (VI)
Quasi-Indexer Ownershipi,t �0.026*** �0.026*** �0.027*** �0.025*** �0.025*** �0.027***(0.002) (0.002) (0.003) (0.003) (0.003) (0.003)
Transient Ownershipi,t 0.012*** 0.011*** 0.015*** 0.011*** 0.011*** 0.014***(0.004) (0.004) (0.005) (0.004) (0.004) (0.005)
(Privatei,t) 0.320*** 0.320*** 0.377*** 0.343*** 0.346*** 0.385***(0.017) (0.017) (0.027) (0.018) (0.018) (0.029)
Control Variables X X X
Fixed E↵ectsYear X X X XState X XYear⇥State X XPrison X X
Observations 16,175 16,158 16,059 15,041 15,041 14,941R-squared 0.157 0.204 0.372 0.183 0.232 0.367
46

Table 7: Inmate suicides as a function of long-term institutional ownership typesThis table shows the relationship between long-term institutional ownership types and suicides. The dependent vari-able is defined as the logarithmic transformation of one plus total suicides that occurred during a given year and prison.Independent Inv. Advisori,t, Investment Companyi,t, Bank Trust Ownershipi,t, Insurance Companyi,t, and PensionOwnershipi,t is the prison’s ownership level by independent investment advisors, investment companies, bank trusts,insurance company, and pension ownership which are based on the investor type classifications of Bushee (2001).
(Privatei,t) is a binary variable that takes the value of one whenever the prison is managed by a non-governmentinstitution. All of the control variables are the same ones of Table 3. Standard errors are reported in parentheses andare clustered at the prison-level.
Dependent Variable: Log(1+Total Suicidesi,t)
(I) (II) (III) (IV) (V) (VI)
Independent Inv. Advisori,t �0.0888*** �0.0874*** �0.0785*** �0.0907*** �0.0924*** �0.0798***(0.010) (0.011) (0.010) (0.011) (0.011) (0.011)
Investment Companyi,t �0.0456*** �0.0443*** �0.0498*** �0.0462*** �0.0487*** �0.0521***(0.006) (0.007) (0.008) (0.007) (0.007) (0.008)
Bank Trust Ownershipi,t 0.0428*** 0.0410*** 0.0378*** 0.0451*** 0.0461*** 0.0377***(0.007) (0.007) (0.008) (0.008) (0.008) (0.008)
Insurance Companyi,t 0.0029** 0.0033*** 0.0032** 0.0026** 0.0023** 0.0032**(0.001) (0.001) (0.001) (0.001) (0.001) (0.001)
Pension Ownershipi,t �0.005*** �0.004*** �0.005*** �0.006*** �0.005*** �0.006***(0.001) (0.001) (0.002) (0.002) (0.002) (0.002)
(Privatei,t) 0.361*** 0.356*** 0.476*** 0.388*** 0.393*** 0.482***(0.016) (0.016) (0.042) (0.016) (0.017) (0.043)
Control Variables X X X
Fixed E↵ectsYear X X X XState X XYear⇥State X XPrison X X
Observations 16,175 16,158 16,059 15,065 15,065 14,965R-squared 0.174 0.219 0.371 0.201 0.238 0.378
47
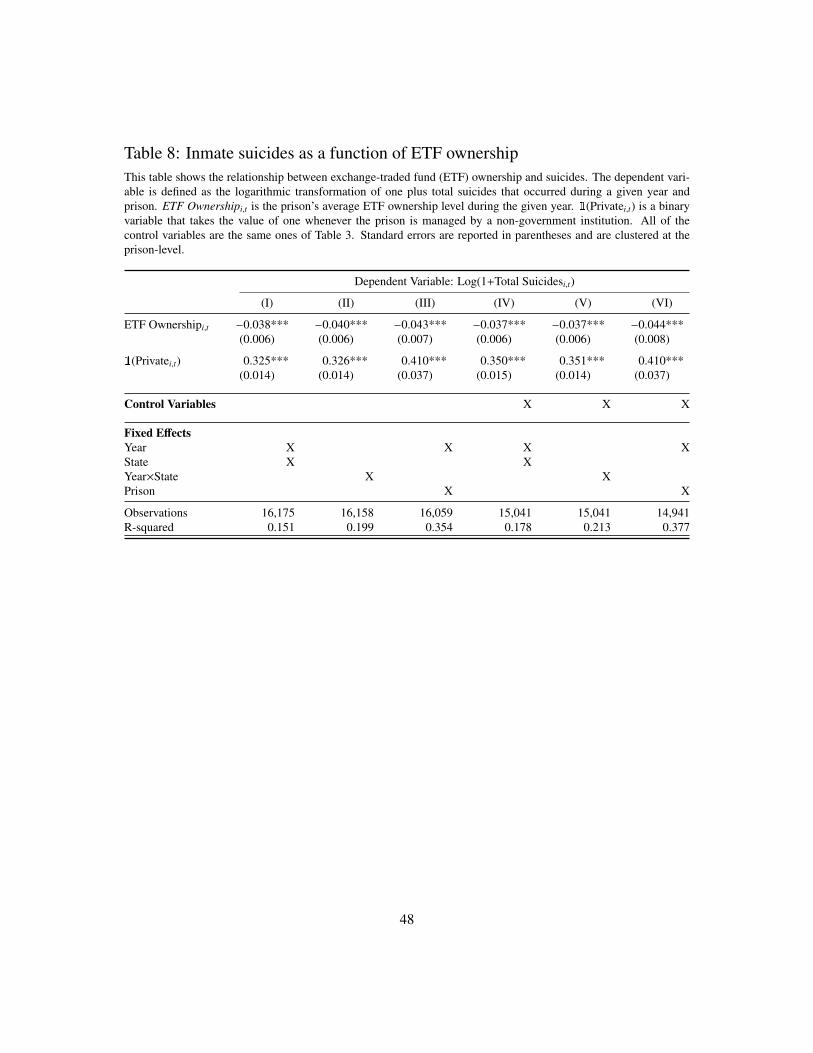
Table 8: Inmate suicides as a function of ETF ownershipThis table shows the relationship between exchange-traded fund (ETF) ownership and suicides. The dependent vari-able is defined as the logarithmic transformation of one plus total suicides that occurred during a given year andprison. ETF Ownershipi,t is the prison’s average ETF ownership level during the given year. (Privatei,t) is a binaryvariable that takes the value of one whenever the prison is managed by a non-government institution. All of thecontrol variables are the same ones of Table 3. Standard errors are reported in parentheses and are clustered at theprison-level.
Dependent Variable: Log(1+Total Suicidesi,t)
(I) (II) (III) (IV) (V) (VI)
ETF Ownershipi,t �0.038*** �0.040*** �0.043*** �0.037*** �0.037*** �0.044***(0.006) (0.006) (0.007) (0.006) (0.006) (0.008)
(Privatei,t) 0.325*** 0.326*** 0.410*** 0.350*** 0.351*** 0.410***(0.014) (0.014) (0.037) (0.015) (0.014) (0.037)
Control Variables X X X
Fixed E↵ectsYear X X X XState X XYear⇥State X XPrison X X
Observations 16,175 16,158 16,059 15,041 15,041 14,941R-squared 0.151 0.199 0.354 0.178 0.213 0.377
48

Table 9: ETF ownership e↵ects on suicides in an instrumental variable settingThis table shows the first stage results of instrumenting exchange-traded fund (ETF) ownership by the treatment e↵ect.The dependent variable is defined as the prison’s average ETF ownership level during the given year. (Treatedi) isa binary variable that takes the value of one if a prison has a non-zero ETF ownership level during the pre-period(i.e., prior to the shock). As well, (Postt) is a binary variable that takes the value of one during the post-period,which covers the years between 2013 and 2018, whereas the pre-period is between 2008 and 2012. (Privatei,t) is abinary variable that takes the value of one whenever the prison is managed by a non-government institution. All ofthe control variables are the same ones of Table 3. Standard errors are reported in parentheses and are clustered at theprison-level.
Panel A: First Stage Regression
Dependent Variable: ETF Ownershipi,t
(I) (II) (III) (IV) (V) (VI)
(Treatedi) ⇥ (Postt) 7.578*** 7.567*** 7.626*** 7.619*** 7.599*** 7.753***(0.172) (0.173) (0.188) (0.172) (0.173) (0.178)
(Postt) 0.028** 0.025** 0.021* 0.020* 0.019 �0.041**(0.013) (0.013) (0.015) (0.014) (0.018) (0.020)
(Treatedi) 1.484*** 1.457*** 1.437*** 1.442***(0.194) (0.202) (0.211) (0.209)
(Privatei,t) 0.263*** 0.289*** 0.733*** 0.276** 0.271** 0.750***(0.111) (0.122) (0.329) (0.132) (0.130) (0.349)
Control Variables X X X
Fixed E↵ectsState X XPrison X X
Observations 11,210 11,210 11,210 10,504 10,504 10,504F-Statistics 63.11 61.33 58.33 56.01 50.93 53.77
continues on the next page
49
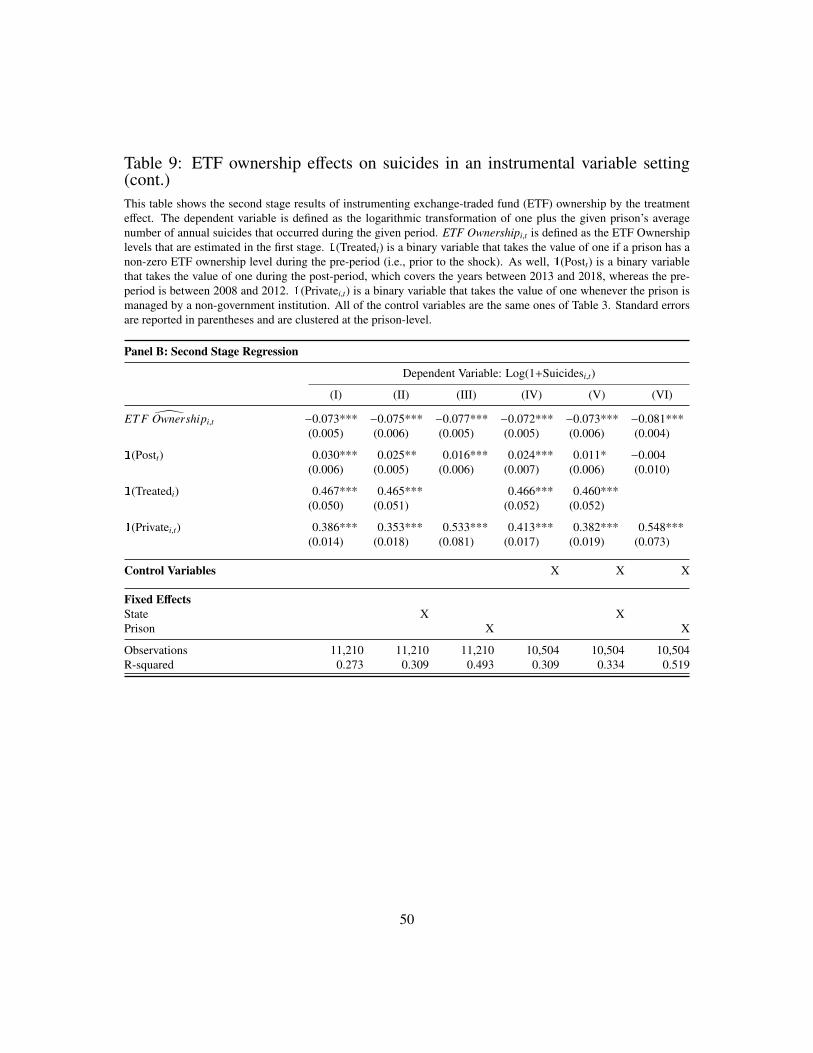
Table 9: ETF ownership e↵ects on suicides in an instrumental variable setting(cont.)This table shows the second stage results of instrumenting exchange-traded fund (ETF) ownership by the treatmente↵ect. The dependent variable is defined as the logarithmic transformation of one plus the given prison’s averagenumber of annual suicides that occurred during the given period. ETF Ownershipi,t is defined as the ETF Ownershiplevels that are estimated in the first stage. (Treatedi) is a binary variable that takes the value of one if a prison has anon-zero ETF ownership level during the pre-period (i.e., prior to the shock). As well, (Postt) is a binary variablethat takes the value of one during the post-period, which covers the years between 2013 and 2018, whereas the pre-period is between 2008 and 2012. (Privatei,t) is a binary variable that takes the value of one whenever the prison ismanaged by a non-government institution. All of the control variables are the same ones of Table 3. Standard errorsare reported in parentheses and are clustered at the prison-level.
Panel B: Second Stage Regression
Dependent Variable: Log(1+Suicidesi,t)
(I) (II) (III) (IV) (V) (VI)
\ET F Ownershipi,t �0.073*** �0.075*** �0.077*** �0.072*** �0.073*** �0.081***(0.005) (0.006) (0.005) (0.005) (0.006) (0.004)
(Postt) 0.030*** 0.025** 0.016*** 0.024*** 0.011* �0.004(0.006) (0.005) (0.006) (0.007) (0.006) (0.010)
(Treatedi) 0.467*** 0.465*** 0.466*** 0.460***(0.050) (0.051) (0.052) (0.052)
(Privatei,t) 0.386*** 0.353*** 0.533*** 0.413*** 0.382*** 0.548***(0.014) (0.018) (0.081) (0.017) (0.019) (0.073)
Control Variables X X X
Fixed E↵ectsState X XPrison X X
Observations 11,210 11,210 11,210 10,504 10,504 10,504R-squared 0.273 0.309 0.493 0.309 0.334 0.519
50
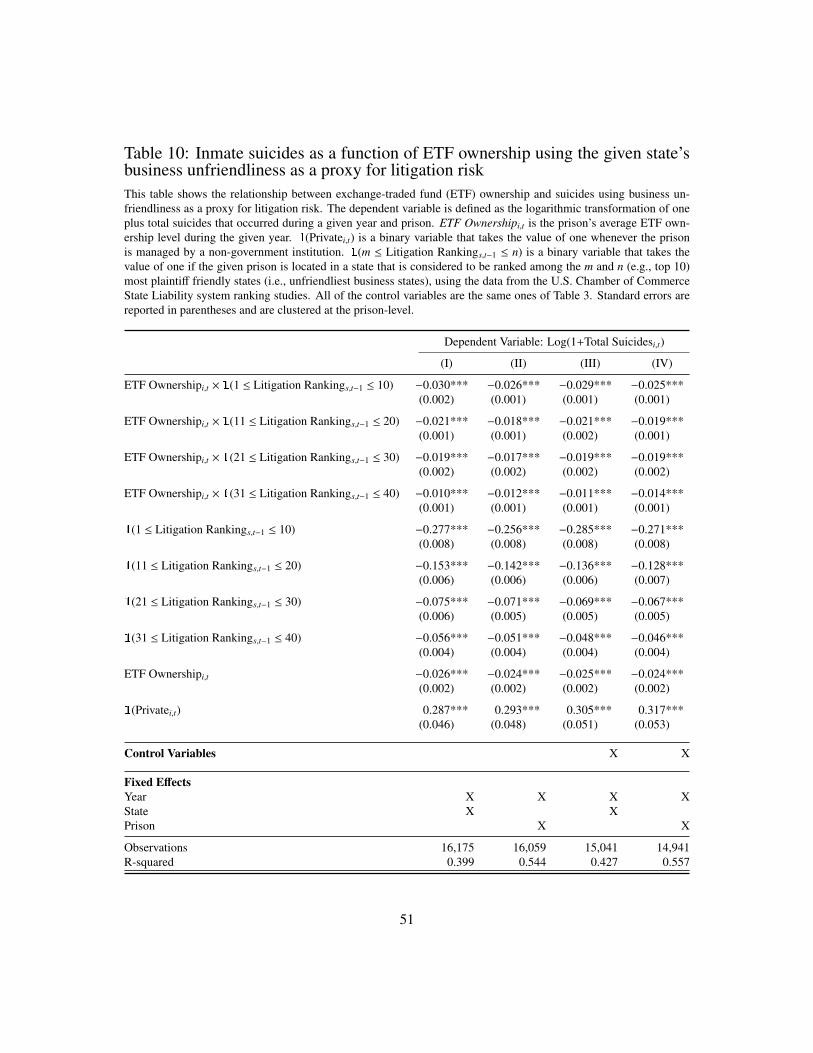
Table 10: Inmate suicides as a function of ETF ownership using the given state’sbusiness unfriendliness as a proxy for litigation riskThis table shows the relationship between exchange-traded fund (ETF) ownership and suicides using business un-friendliness as a proxy for litigation risk. The dependent variable is defined as the logarithmic transformation of oneplus total suicides that occurred during a given year and prison. ETF Ownershipi,t is the prison’s average ETF own-ership level during the given year. (Privatei,t) is a binary variable that takes the value of one whenever the prisonis managed by a non-government institution. (m Litigation Rankings,t�1 n) is a binary variable that takes thevalue of one if the given prison is located in a state that is considered to be ranked among the m and n (e.g., top 10)most plainti↵ friendly states (i.e., unfriendliest business states), using the data from the U.S. Chamber of CommerceState Liability system ranking studies. All of the control variables are the same ones of Table 3. Standard errors arereported in parentheses and are clustered at the prison-level.
Dependent Variable: Log(1+Total Suicidesi,t)
(I) (II) (III) (IV)
ETF Ownershipi,t ⇥ (1 Litigation Rankings,t�1 10) �0.030*** �0.026*** �0.029*** �0.025***(0.002) (0.001) (0.001) (0.001)
ETF Ownershipi,t ⇥ (11 Litigation Rankings,t�1 20) �0.021*** �0.018*** �0.021*** �0.019***(0.001) (0.001) (0.002) (0.001)
ETF Ownershipi,t ⇥ (21 Litigation Rankings,t�1 30) �0.019*** �0.017*** �0.019*** �0.019***(0.002) (0.002) (0.002) (0.002)
ETF Ownershipi,t ⇥ (31 Litigation Rankings,t�1 40) �0.010*** �0.012*** �0.011*** �0.014***(0.001) (0.001) (0.001) (0.001)
(1 Litigation Rankings,t�1 10) �0.277*** �0.256*** �0.285*** �0.271***(0.008) (0.008) (0.008) (0.008)
(11 Litigation Rankings,t�1 20) �0.153*** �0.142*** �0.136*** �0.128***(0.006) (0.006) (0.006) (0.007)
(21 Litigation Rankings,t�1 30) �0.075*** �0.071*** �0.069*** �0.067***(0.006) (0.005) (0.005) (0.005)
(31 Litigation Rankings,t�1 40) �0.056*** �0.051*** �0.048*** �0.046***(0.004) (0.004) (0.004) (0.004)
ETF Ownershipi,t �0.026*** �0.024*** �0.025*** �0.024***(0.002) (0.002) (0.002) (0.002)
(Privatei,t) 0.287*** 0.293*** 0.305*** 0.317***(0.046) (0.048) (0.051) (0.053)
Control Variables X X
Fixed E↵ectsYear X X X XState X XPrison X X
Observations 16,175 16,059 15,041 14,941R-squared 0.399 0.544 0.427 0.557
51

Table 11: ETF ownership e↵ects on suicides in an instrumental variable settingusing the given state’s business unfriendliness as a proxy for litigation riskThis table shows the second stage results of instrumenting exchange-traded fund (ETF) ownership by the treatmente↵ect. The dependent variable is defined as the logarithmic transformation of one plus the given prison’s averagenumber of annual suicides that occurred during the given period. ETF Ownershipi,t is defined as the ETF Ownershiplevels that are estimated in the first stage. (m Litigation Rankings n) is a binary variable that takes the valueof one if the given prison is located in a state that is considered to be ranked among the m and n (e.g., top 10) mostplainti↵ friendly states (i.e., unfriendliest business states) in 2012, using the data from the U.S. Chamber of CommerceState Liability system ranking studies. By interact these variables with ETF Ownershipi,t, I use the estimates from thefirst stage where I use the interaction between treatment and the ranking variable as an instrument for the interactionbetween the ETF ownership level and the ranking variable. (Treatedi) is a binary variable that takes the value ofone if a prison has a non-zero ETF ownership level during the pre-period (i.e., prior to the shock). As well, (Postt)is a binary variable that takes the value of one during the post-period, which covers the years between 2013 and2018, whereas the pre-period is between 2008 and 2012. (Privatei,t) is a binary variable that takes the value of onewhenever the prison is managed by a non-government institution. The F-statistics are all well above 10 in the first-stage regressions. All of the control variables are the same ones of Table 3. Standard errors are reported in parenthesesand are clustered at the prison-level.
Second Stage Regression
Dependent Variable: Log(1+Suicidesi,t)
(I) (II)
\ET F Ownershipi,t �0.062*** �0.071***(0.013) (0.021)
\ET F Ownershipi,t ⇥ (1 Litigation Rankings 10) �0.058*** �0.047***(0.013) (0.019)
\ET F Ownershipi,t ⇥ (11 Litigation Rankings 20) �0.023** �0.021**(0.011) (0.012)
\ET F Ownershipi,t ⇥ (21 Litigation Rankings 30) �0.020** �0.018(0.011) (0.017)
\ET F Ownershipi,t ⇥ (31 Litigation Rankings 40) �0.008 �0.005(0.007) (0.010)
(Treatedi) �0.129*** �0.128***(0.062) (0.063)
(Postt) 0.029*** 0.026***(0.006) (0.006)
(Privatei,t) 0.421*** 0.445***(0.016) (0.021)
Control VariablesX
Observations 11,210 10,504R-squared 0.288 0.306
52
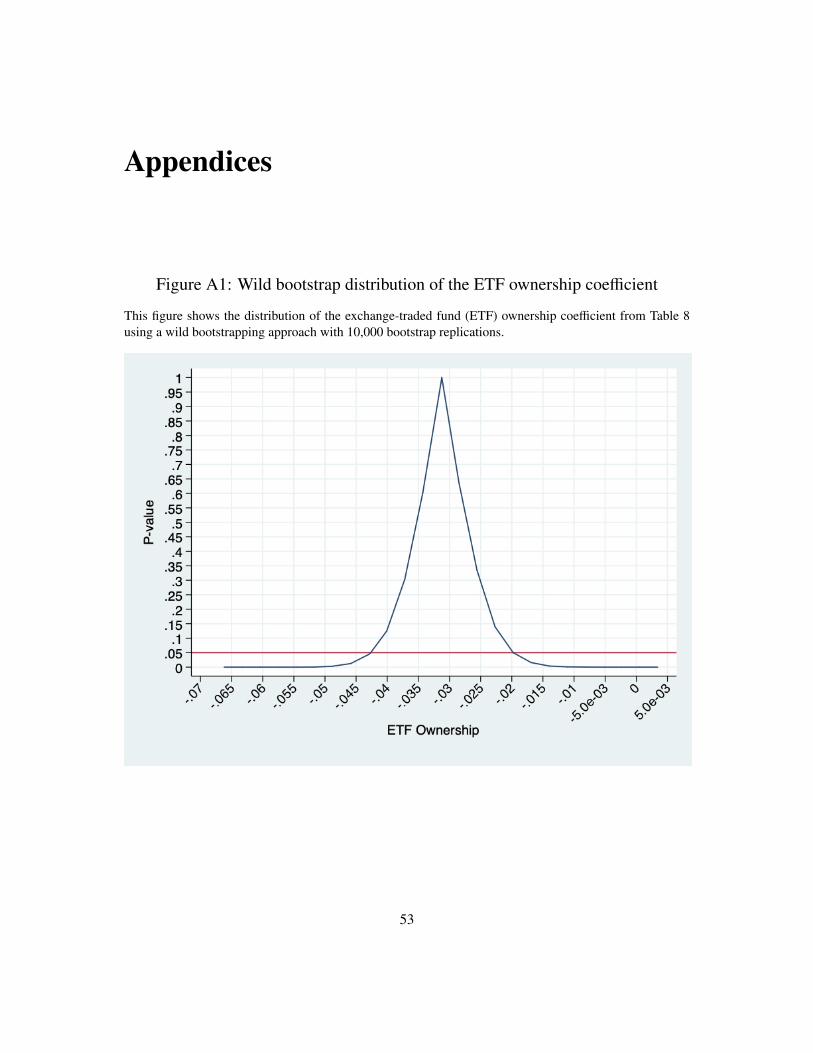
Appendices
Figure A1: Wild bootstrap distribution of the ETF ownership coe�cient
This figure shows the distribution of the exchange-traded fund (ETF) ownership coe�cient from Table 8using a wild bootstrapping approach with 10,000 bootstrap replications.
53
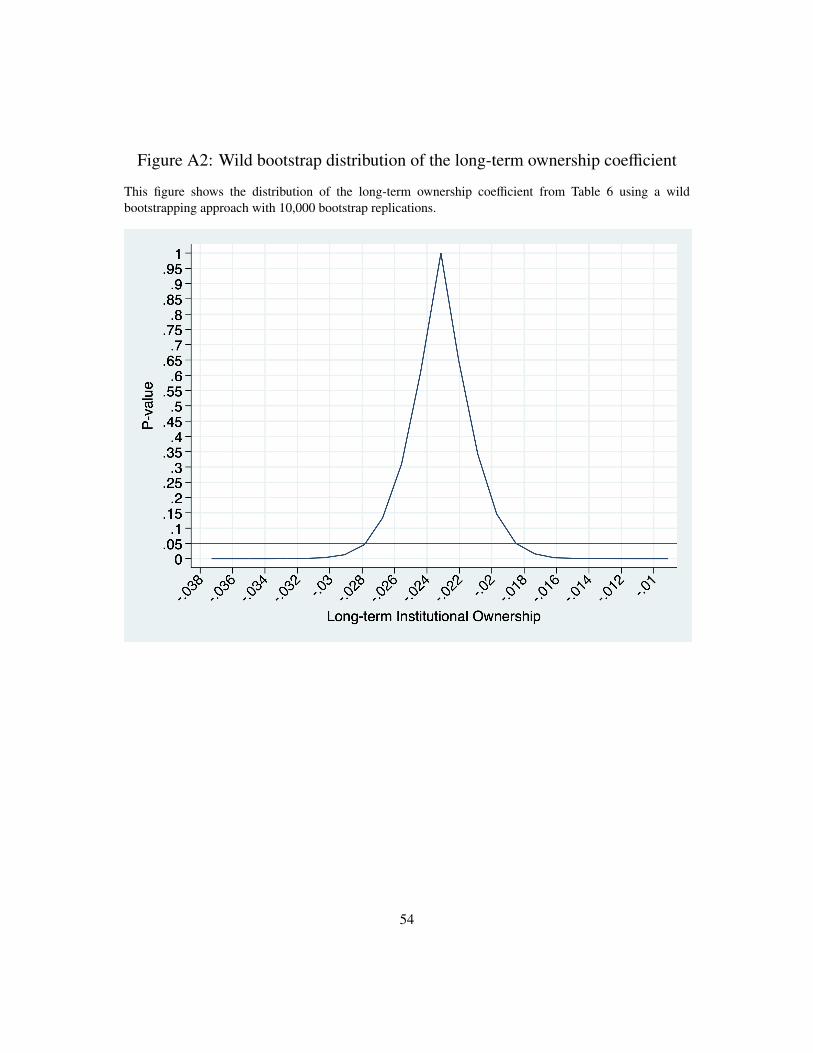
Figure A2: Wild bootstrap distribution of the long-term ownership coe�cient
This figure shows the distribution of the long-term ownership coe�cient from Table 6 using a wildbootstrapping approach with 10,000 bootstrap replications.
54

Table A1: State-level FOIA responses and privatizationThis table shows the relationship between FOIA responses and privatization. (Private j) is a binary variable thattakes the value of one whenever the given state has at least one prison managed by a non-government institution in2019. (Democratic State j) takes the value of one if the given state was a democratic state in the 2016 United Statespresidential election. Log(Length j) is the logarithmic transformation of the number of days it took the given state torespond to the FOIA request. Log( Email j) is is the logarithmic transformation of the number of emails that wereexchanged between the sta↵ of the given state. (Senior j), (Complaint j), and (Fee j) are binary variables that thevalue of one whenever a commissioner or governor was contacted, a complaint was filed for not responding to theFOIA request properly, and a fee was required to be paid, respectively. Standard errors are reported in parenthesesand are clustered at the state-level.
Log(Length j) Log( Email j) (Senior j) (Complaint j) (Fee j) (Private j)
(Private j) 0.765*** 0.307*** 0.253** 0.253** 0.126(0.295) (0.126) (0.109) (0.051) (0.091)
(Democratic State j) �0.230 0.042 0.187 0.094 �0.165* �0.273**(0.309) (0.138) (0.115) (0.009) (0.052) (0.111)
Observations 51 51 51 51 51 51R-squared 0.145 0.117 0.135 0.060 0.049 0.068
55
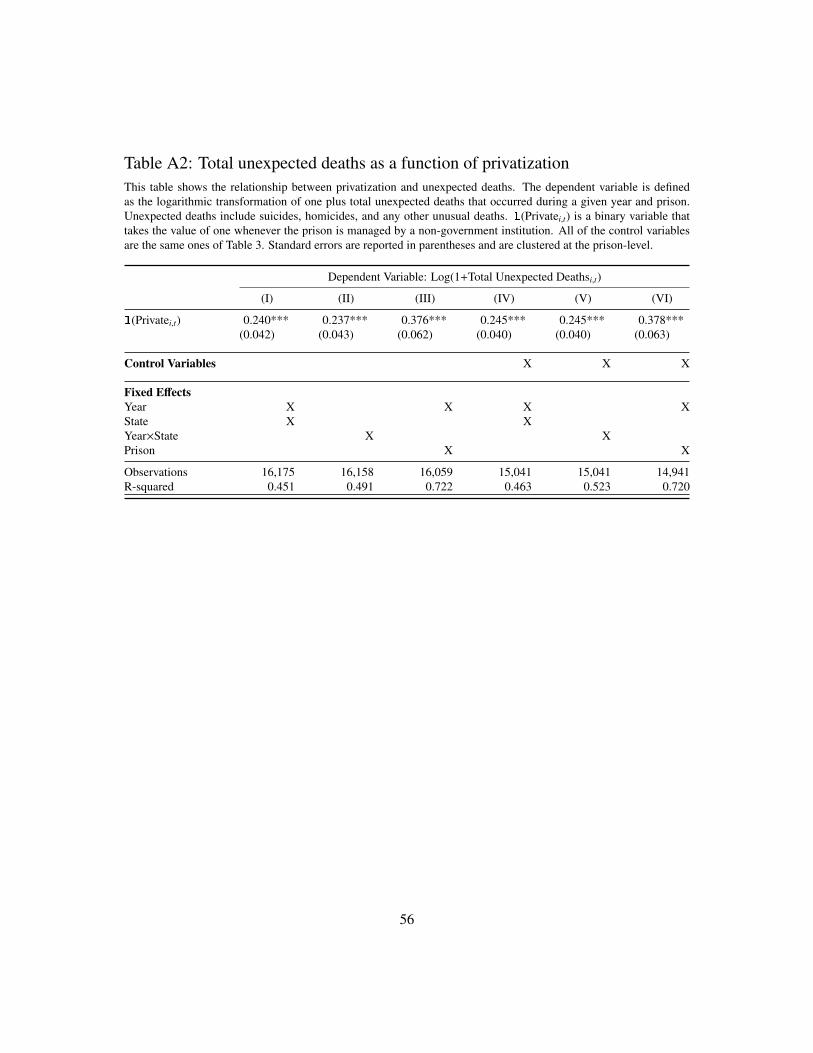
Table A2: Total unexpected deaths as a function of privatizationThis table shows the relationship between privatization and unexpected deaths. The dependent variable is definedas the logarithmic transformation of one plus total unexpected deaths that occurred during a given year and prison.Unexpected deaths include suicides, homicides, and any other unusual deaths. (Privatei,t) is a binary variable thattakes the value of one whenever the prison is managed by a non-government institution. All of the control variablesare the same ones of Table 3. Standard errors are reported in parentheses and are clustered at the prison-level.
Dependent Variable: Log(1+Total Unexpected Deathsi,t)
(I) (II) (III) (IV) (V) (VI)
(Privatei,t) 0.240*** 0.237*** 0.376*** 0.245*** 0.245*** 0.378***(0.042) (0.043) (0.062) (0.040) (0.040) (0.063)
Control Variables X X X
Fixed E↵ectsYear X X X XState X XYear⇥State X XPrison X X
Observations 16,175 16,158 16,059 15,041 15,041 14,941R-squared 0.451 0.491 0.722 0.463 0.523 0.720
56

Table A3: Total unexpected deaths as a function of long-term institutional owner-shipThis table shows the relationship between long-term institutional ownership and unexpected deaths. The dependentvariable is defined as the logarithmic transformation of one plus total unexpected deaths that occurred during a givenyear and prison. Long-term Ownershipi,t is the prison’s long-term institutional ownership, which is the quasi-indexerclassification of Bushee (2001). (Privatei,t) is a binary variable that takes the value of one whenever the prison ismanaged by a non-government institution. All of the control variables are the same ones of Table 3. Standard errorsare reported in parentheses and are clustered at the prison-level.
Dependent Variable: Log(1+Total Unexpected Deathsi,t)
(I) (II) (III) (IV) (V) (VI)
Long-term Ownershipi,t �0.022*** �0.027*** �0.028*** �0.020*** �0.026*** �0.028***(0.007) (0.008) (0.005) (0.007) (0.007) (0.005)
(Privatei,t) 0.401*** 0.411*** 0.433*** 0.404*** 0.403*** 0.443***(0.045) (0.046) (0.064) (0.044) (0.044) (0.065)
Control Variables X X X
Fixed E↵ectsYear X X X XState X XYear⇥State X XPrison X X
Observations 16,175 16,158 16,059 15,041 15,041 14,941R-squared 0.472 0.513 0.724 0.483 0.522 0.732
57

Table A4: Total unexpected deaths as a function of ETF ownershipThis table shows the relationship between exchange-traded fund (ETF) ownership and unexpected deaths. The de-pendent variable is defined as the logarithmic transformation of one plus total unexpected deaths that occurred dur-ing a given year and prison. Unexpected deaths include suicides, homicides, and any other unusual deaths. ETFOwnershipi,t is the prison’s average ETF ownership level during the given year. (Privatei,t) is a binary variable thattakes the value of one whenever the prison is managed by a non-government institution. All of the control variablesare the same ones of Table 3. Standard errors are reported in parentheses and are clustered at the prison-level.
Dependent Variable: Log(1+Total Unexpected Deathsi,t)
(I) (II) (III) (IV) (V) (VI)
ETF Ownershipi,t �0.033*** �0.034*** �0.033** �0.032*** �0.030*** �0.037**(0.014) (0.015) (0.011) (0.014) (0.014) (0.011)
(Privatei,t) 0.342*** 0.353*** 0.401*** 0.348*** 0.346*** 0.409***(0.045) (0.046) (0.063) (0.044) (0.044) (0.065)
Control Variables X X X
Fixed E↵ectsYear X X X XState X XYear⇥State X XPrison X X
Observations 16,175 16,158 16,059 15,041 15,041 14,941R-squared 0.463 0.505 0.722 0.474 0.513 0.733
58

Table A5: Total deaths as a function of privatizationThis table shows the relationship between privatization and total deaths. The dependent variable is defined as thelogarithmic transformation of one plus total deaths that occurred during a given year and prison. (Privatei,t) is abinary variable that takes the value of one whenever the prison is managed by a non-government institution. All ofthe control variables are the same ones of Table 3. Standard errors are reported in parentheses and are clustered at theprison-level.
Dependent Variable: Log(1+Total Deathsi,t)
(I) (II) (III) (IV) (V) (VI)
(Privatei,t) 0.324** 0.316** 0.348*** 0.335*** 0.336*** 0.340***(0.049) (0.051) (0.072) (0.050) (0.051) (0.074)
Control Variables X X X
Fixed E↵ectsYear X X X XState X XYear⇥State X XPrison X X
Observations 16,175 16,158 16,059 15,041 15,041 14,941R-squared 0.309 0.348 0.710 0.347 0.355 0.733
59
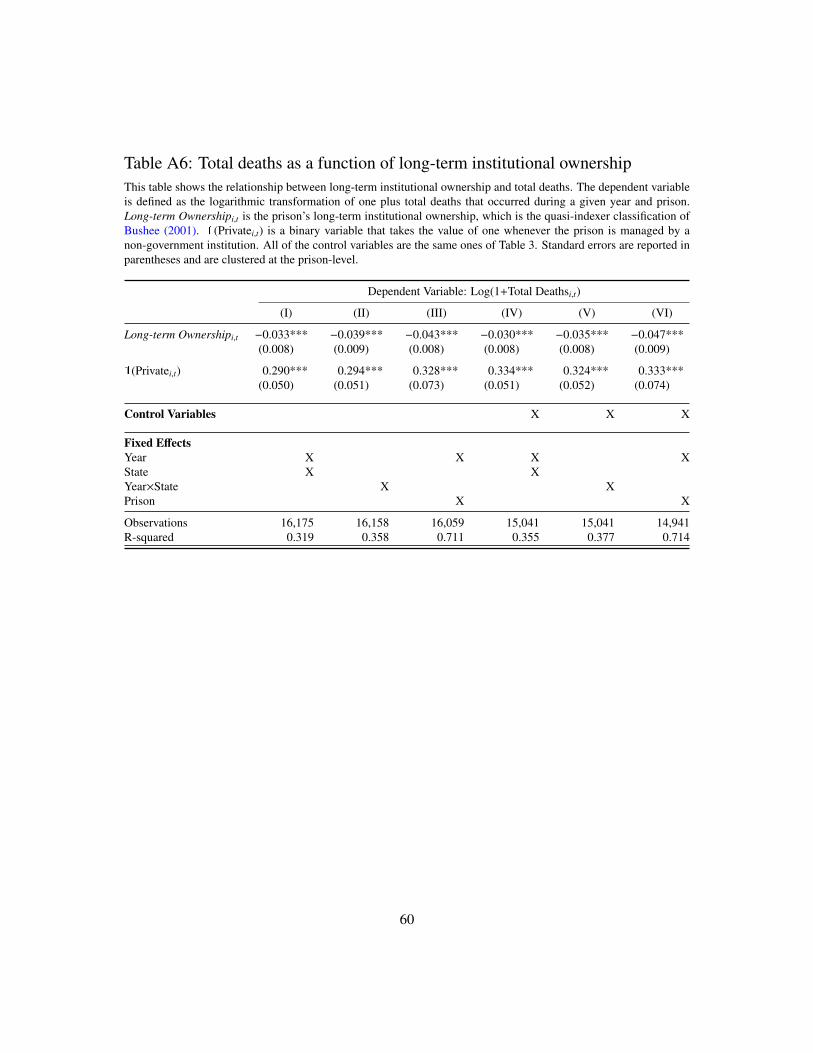
Table A6: Total deaths as a function of long-term institutional ownershipThis table shows the relationship between long-term institutional ownership and total deaths. The dependent variableis defined as the logarithmic transformation of one plus total deaths that occurred during a given year and prison.Long-term Ownershipi,t is the prison’s long-term institutional ownership, which is the quasi-indexer classification ofBushee (2001). (Privatei,t) is a binary variable that takes the value of one whenever the prison is managed by anon-government institution. All of the control variables are the same ones of Table 3. Standard errors are reported inparentheses and are clustered at the prison-level.
Dependent Variable: Log(1+Total Deathsi,t)
(I) (II) (III) (IV) (V) (VI)
Long-term Ownershipi,t �0.033*** �0.039*** �0.043*** �0.030*** �0.035*** �0.047***(0.008) (0.009) (0.008) (0.008) (0.008) (0.009)
(Privatei,t) 0.290*** 0.294*** 0.328*** 0.334*** 0.324*** 0.333***(0.050) (0.051) (0.073) (0.051) (0.052) (0.074)
Control Variables X X X
Fixed E↵ectsYear X X X XState X XYear⇥State X XPrison X X
Observations 16,175 16,158 16,059 15,041 15,041 14,941R-squared 0.319 0.358 0.711 0.355 0.377 0.714
60

Table A7: Total deaths as a function of ETF ownershipThis table shows the relationship between exchange-traded fund (ETF) ownership and total deaths. The dependentvariable is defined as the logarithmic transformation of one plus total deaths that occurred during a given year andprison. ETF Ownershipi,t is the prison’s average ETF ownership level during the given year. (Privatei,t) is a binaryvariable that takes the value of one whenever the prison is managed by a non-government institution. All of thecontrol variables are the same ones of Table 3. Standard errors are reported in parentheses and are clustered at theprison-level.
Dependent Variable: Log(1+Total Deathsi,t)
(I) (II) (III) (IV) (V) (VI)
ETF Ownershipi,t �0.028*** �0.029*** �0.032*** �0.025*** �0.027*** �0.030***(0.015) (0.016) (0.014) (0.015) (0.016) (0.014)
(Privatei,t) 0.320*** 0.327*** 0.359*** 0.350*** 0.362*** 0.363***(0.051) (0.052) (0.072) (0.051) (0.052) (0.073)
Control Variables X X X
Fixed E↵ectsYear X X X XState X XYear⇥State X XPrison X X
Observations 16,175 16,158 16,059 15,041 15,041 14,941R-squared 0.314 0.354 0.710 0.351 0.378 0.713
61

Table A8: Suicide rates as a function of privatizationThis table shows the relationship between privatization and suicide rates. The dependent variable is defined as thesuicide rate of the given prison and year. Suicide rate is the ratio of total suicides to average prison population.
(Privatei,t) is a binary variable that takes the value of one whenever the prison is managed by a non-governmentinstitution. All of the control variables are the same ones of Table 3. Standard errors are reported in parentheses andare clustered at the prison-level.
Dependent Variable: Suicide Ratei,t
(I) (II) (III) (IV) (V) (VI)
(Privatei,t) 0.148*** 0.149*** 0.169*** 0.137*** 0.138*** 0.163**(0.023) (0.023) (0.025) (0.022) (0.022) (0.024)
Control Variables X X X
Fixed E↵ectsYear X X X XState X XYear⇥State X XPrison X X
Observations 16,175 16,158 16,059 15,041 15,041 14,941R-squared 0.067 0.090 0.294 0.078 0.096 0.318
62

Table A9: Suicide rates as a function of long-term institutional ownershipThis table shows the relationship between long-term institutional ownership and suicide rates. The dependent variableis defined as the suicide rate of the given prison and year. Suicide rate is the ratio of total suicides to average prisonpopulation. Long-term Ownershipi,t is the prison’s long-term institutional ownership, which is the quasi-indexerclassification of Bushee (2001). (Privatei,t) is a binary variable that takes the value of one whenever the prison ismanaged by a non-government institution. All of the control variables are the same ones of Table 3. Standard errorsare reported in parentheses and are clustered at the prison-level.
Dependent Variable: Suicide Ratei,t
(I) (II) (III) (IV) (V) (VI)
Long-term Ownershipi,t �0.028*** �0.024*** �0.054*** �0.026*** �0.027*** �0.055***(0.007) (0.006) (0.019) (0.007) (0.007) (0.019)
(Privatei,t) 0.194*** 0.188*** 0.175*** 0.182*** 0.184*** 0.173***(0.032) (0.031) (0.037) (0.032) (0.032) (0.037)
Control Variables X X X
Fixed E↵ectsYear X X X XState X XYear⇥State X XPrison X X
Observations 16,175 16,158 16,059 15,041 15,041 14,941R-squared 0.078 0.304 0.353 0.082 0.091 0.323
63

Table A10: Suicide rates as a function of ETF ownershipThis table shows the relationship between exchange-traded fund (ETF) ownership and suicide rates. The dependentvariable is defined as the suicide rate of the given prison and year. Suicide rate is the ratio of total suicides to averageprison population. ETF Ownershipi,t is the prison’s average ETF ownership level during the given year. (Privatei,t)is a binary variable that takes the value of one whenever the prison is managed by a non-government institution. Allof the control variables are the same ones of Table 3. Standard errors are reported in parentheses and are clustered atthe prison-level.
Dependent Variable: Suicide Ratei,t
(I) (II) (III) (IV) (V) (VI)
ETF Ownershipi,t �0.042*** �0.035*** �0.055** �0.040*** �0.041*** �0.057**(0.010) (0.009) (0.031) (0.010) (0.010) (0.032)
(Privatei,t) 0.180*** 0.176*** 0.141*** 0.169*** 0.171*** 0.148***(0.029) (0.028) (0.033) (0.029) (0.029) (0.032)
Control Variables X X X
Fixed E↵ectsYear X X X XState X XYear⇥State X XPrison X X
Observations 16,175 16,158 16,059 15,041 15,041 14,941R-squared 0.086 0.092 0.301 0.081 0.099 0.320
64

Table A11: Extensive margins: Suicides as a function of long-term institutionalownershipThis table shows the relationship between long-term institutional ownership and suicides. The dependent variableis defined as the logarithmic transformation of one plus total suicides that occurred during a given year and prison.
(Long-term Ownershipi,t) is a binary variable that takes the value of one whenever the given prison has a reasonablehigh (i.e., greater than the mean long-term ownership level) long-term institutional ownership level. Long-term owner-ship is defined as the quasi-indexer, following the classification of Bushee (2001). (Privatei,t) is a binary variable thattakes the value of one whenever the prison is managed by a non-government institution. All of the control variablesare the same ones of Table 3. Standard errors are reported in parentheses and are clustered at the prison-level.
Dependent Variable: Log(1+Total Suicidesi,t)
(I) (II) (III) (IV) (V) (VI)
(Long-term Ownershipi,t) �0.187*** �0.187*** �0.192*** �0.183*** �0.190*** �0.197***(0.029) (0.030) (0.033) (0.030) (0.029) (0.034)
(Privatei,t) 0.331*** 0.328*** 0.420*** 0.355*** 0.358*** 0.420***(0.014) (0.015) (0.037) (0.015) (0.015) (0.037)
Control Variables X X X
Fixed E↵ectsYear X X X XState X XYear⇥State X XPrison X X
Observations 16,175 16,158 16,059 15,041 15,041 14,941R-squared 0.147 0.196 0.353 0.174 0.209 0.358
65

Table A12: Extensive margins: Suicides as a function of ETF ownershipThis table shows the relationship between ETF ownership and suicides. The dependent variable is defined as thelogarithmic transformation of one plus total suicides that occurred during a given year and prison. (ETF Ownershipi,t)is a binary variable that takes the value of one whenever the given prison has a reasonable high (i.e., greater thanthe mean ETF ownership level) ETF ownership level. (Privatei,t) is a binary variable that takes the value of onewhenever the prison is managed by a non-government institution. All of the control variables are the same ones ofTable 3. Standard errors are reported in parentheses and are clustered at the prison-level.
Dependent Variable: Log(1+Total Suicidesi,t)
(I) (II) (III) (IV) (V) (VI)
(ETF Ownershipi,t) �0.178*** �0.177*** �0.193*** �0.178*** �0.186*** �0.191***(0.034) (0.035) (0.038) (0.035) (0.035) (0.039)
(Privatei,t) 0.320*** 0.318*** 0.411*** 0.347*** 0.349*** 0.411***(0.014) (0.015) (0.037) (0.015) (0.015) (0.038)
Control Variables X X X
Fixed E↵ectsYear X X X XState X XYear⇥State X XPrison X X
Observations 16,175 16,158 16,059 15,041 15,041 14,941R-squared 0.143 0.194 0.352 0.172 0.208 0.357
66

Table A13: Inmate suicides as a function of lagged long-term institutional owner-shipThis table shows the relationship between lagged long-term institutional ownership and suicides. The dependentvariable is defined as the logarithmic transformation of one plus total suicides that occurred during a given year andprison. Long-term Ownershipi,t�1 is the prison’s lagged long-term institutional ownership, which is the quasi-indexerclassification of Bushee (2001). (Privatei,t) is a binary variable that takes the value of one whenever the prison ismanaged by a non-government institution. All of the control variables are the same ones of Table 3. Standard errorsare reported in parentheses and are clustered at the prison-level.
Dependent Variable: Log(1+Total Suicidesi,t)
(I) (II) (III) (IV) (V) (VI)
Long-term Ownershipi,t�1 �0.036*** �0.037*** �0.038*** �0.035*** �0.036*** �0.040***(0.002) (0.003) (0.004) (0.002) (0.002) (0.004)
(Privatei,t) 0.356*** 0.360*** 0.418*** 0.380*** 0.382*** 0.424***(0.015) (0.016) (0.042) (0.015) (0.016) (0.043)
Control Variables X X X
Fixed E↵ectsYear X X X XState X XYear⇥State X XPrison X X
Observations 14,723 14,708 14,616 13,740 13,740 13,646R-squared 0.162 0.209 0.371 0.192 0.223 0.381
67

Table A14: Inmate suicides as a function of lagged ETF ownershipThis table shows the relationship between lagged ETF ownership and suicides. The dependent variable is definedas the logarithmic transformation of one plus total suicides that occurred during a given year and prison. ETFOwnershipi,t�1 is the prison’s average ETF ownership level during the previous year. (Privatei,t) is a binary vari-able that takes the value of one whenever the prison is managed by a non-government institution. All of the controlvariables are the same ones of Table 3. Standard errors are reported in parentheses and are clustered at the prison-level.
Dependent Variable: Log(1+Total Suicidesi,t)
(I) (II) (III) (IV) (V) (VI)
ETF Ownershipi,t�1 �0.056*** �0.059*** �0.042*** �0.052*** �0.053*** �0.044***(0.005) (0.005) (0.006) (0.005) (0.005) (0.007)
(Privatei,t) 0.330*** 0.334*** 0.418*** 0.353*** 0.354*** 0.418***(0.016) (0.015) (0.041) (0.015) (0.015) (0.042)
Control Variables X X X
Fixed E↵ectsYear X X X XState X XYear⇥State X XPrison X X
Observations 14,723 14,708 14,616 13,740 13,740 13,646R-squared 0.155 0.202 0.364 0.184 0.223 0.373
68

Table A15: Suicide prevention programs as a function of long-term institutionalownershipThis table shows the relationship between long-term institutional ownership and the total suicide prevention programso↵ered in prisons. The dependent variable is defined as the logarithmic transformation of suicide prevention programsthat are o↵ered in a given prison during a given year. Long-term Ownershipi,t is the prison’s long-term institutionalownership, which is the quasi-indexer classification of Bushee (2001). (Privatei,t) is a binary variable that takes thevalue of one whenever the prison is managed by a non-government institution. All of the control variables are thesame ones of Table 3. Standard errors are reported in parentheses and are clustered at the prison-level.
Dependent Variable: Log(Suicide Prevention Programsi,t)
(I) (II) (III) (IV) (V) (VI)
Long-term Ownershipi,t 0.032*** 0.032*** 0.038*** 0.032*** 0.033*** 0.041***(0.006) (0.007) (0.007) (0.006) (0.006) (0.007)
(Privatei,t) �0.196*** �0.196*** �0.217*** �0.203*** �0.203*** �0.215***(0.016) (0.017) (0.049) (0.016) (0.017) (0.050)
Control Variables X X X
Fixed E↵ectsYear X X X XState X XYear⇥State X XPrison X X
Observations 15,961 15,944 15,841 14,869 14,869 14,767R-squared 0.095 0.134 0.337 0.107 0.137 0.372
69
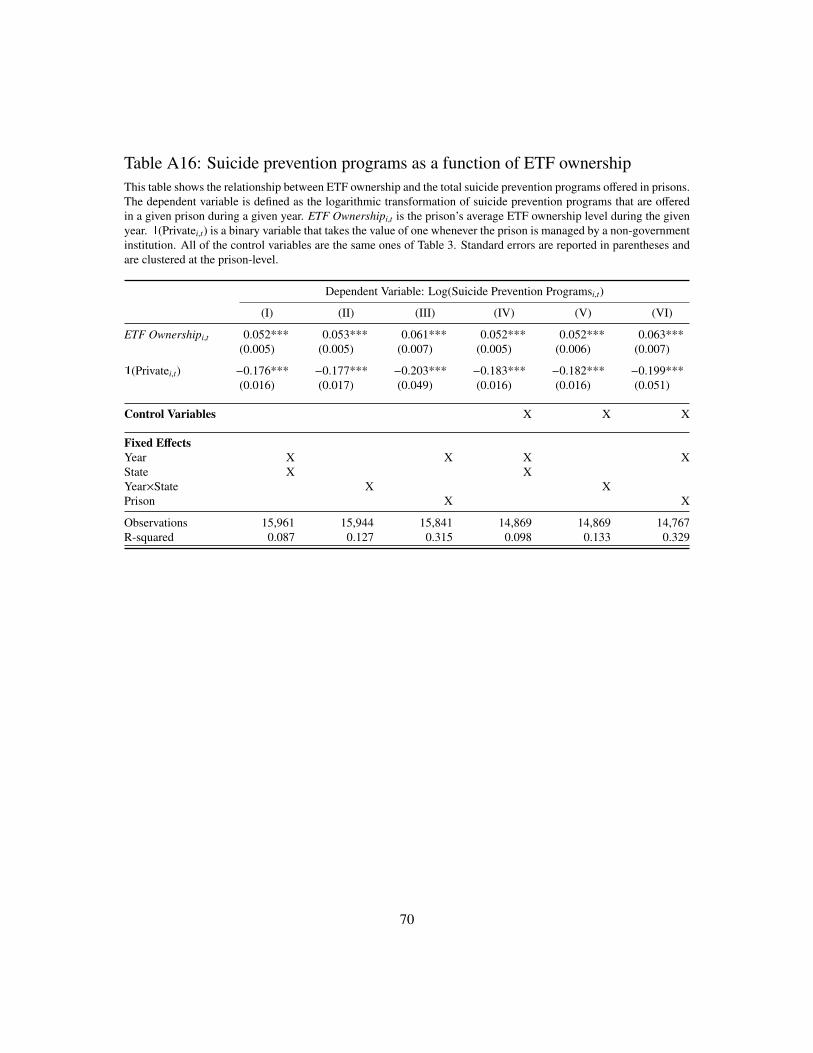
Table A16: Suicide prevention programs as a function of ETF ownershipThis table shows the relationship between ETF ownership and the total suicide prevention programs o↵ered in prisons.The dependent variable is defined as the logarithmic transformation of suicide prevention programs that are o↵eredin a given prison during a given year. ETF Ownershipi,t is the prison’s average ETF ownership level during the givenyear. (Privatei,t) is a binary variable that takes the value of one whenever the prison is managed by a non-governmentinstitution. All of the control variables are the same ones of Table 3. Standard errors are reported in parentheses andare clustered at the prison-level.
Dependent Variable: Log(Suicide Prevention Programsi,t)
(I) (II) (III) (IV) (V) (VI)
ETF Ownershipi,t 0.052*** 0.053*** 0.061*** 0.052*** 0.052*** 0.063***(0.005) (0.005) (0.007) (0.005) (0.006) (0.007)
(Privatei,t) �0.176*** �0.177*** �0.203*** �0.183*** �0.182*** �0.199***(0.016) (0.017) (0.049) (0.016) (0.016) (0.051)
Control Variables X X X
Fixed E↵ectsYear X X X XState X XYear⇥State X XPrison X X
Observations 15,961 15,944 15,841 14,869 14,869 14,767R-squared 0.087 0.127 0.315 0.098 0.133 0.329
70

Table A17: Total number of programs as a function of long-term institutionalownershipThis table shows the relationship between long-term institutional ownership and the total number of programs o↵eredin prisons, such as educational, social, health (e.g., alcohol and drug treatment, therapeutic), religious, spiritual, andcultural program. The dependent variable is defined as the logarithmic transformation of total number of programsthat are o↵ered in a given prison during a given year. Long-term Ownershipi,t is the prison’s long-term institutionalownership, which is the quasi-indexer classification of Bushee (2001). (Privatei,t) is a binary variable that takes thevalue of one whenever the prison is managed by a non-government institution. All of the control variables are thesame ones of Table 3. Standard errors are reported in parentheses and are clustered at the prison-level.
Dependent Variable: Log(Total Number of Programsi,t)
(I) (II) (III) (IV) (V) (VI)
Long-term Ownershipi,t 0.036*** 0.039*** 0.042*** 0.035*** 0.034*** 0.043***(0.002) (0.003) (0.003) (0.003) (0.003) (0.004)
(Privatei,t) �0.145*** �0.152*** �0.161*** �0.150*** �0.147*** �0.163***(0.024) (0.025) (0.047) (0.025) (0.026) (0.049)
Control Variables X X X
Fixed E↵ectsYear X X X X X XState X X X XYear⇥State X XPrison X X
Observations 15,966 15,949 15,846 14,874 14,874 14,772R-squared 0.107 0.135 0.541 0.119 0.143 0.561
71

Table A18: Total number of programs as a function of ETF ownershipThis table shows the relationship between ETF ownership and the total number of programs o↵ered in prisons, suchas educational, social, health (e.g., alcohol and drug treatment, therapeutic), religious, spiritual, and cultural program.The dependent variable is defined as the logarithmic transformation of total number of programs that are o↵ered ina given prison during a given year. ETF Ownershipi,t is the prison’s average ETF ownership level during the givenyear. (Privatei,t) is a binary variable that takes the value of one whenever the prison is managed by a non-governmentinstitution. All of the control variables are the same ones of Table 3. Standard errors are reported in parentheses andare clustered at the prison-level.
Dependent Variable: Log(Total Number of Programsi,t)
(I) (II) (III) (IV) (V) (VI)
ETF Ownershipi,t 0.061*** 0.063*** 0.063*** 0.059*** 0.057*** 0.059***(0.005) (0.005) (0.006) (0.004) (0.005) (0.006)
(Privatei,t) �0.125*** �0.131*** �0.158*** �0.131*** �0.129*** �0.159***(0.024 1) (0.024 5) (0.047 5) (0.025 1) (0.025 2) (0.049 5)
Control Variables X X X
Fixed E↵ectsYear X X X XState X XYear⇥State X XPrison X X
Observations 15,966 15,949 15,846 14,874 14,874 14,772R-squared 0.102 0.130 0.541 0.114 0.142 0.561
72

Table A19: Inmate suicides as a function of long-term institutional ownership us-ing a Poisson modelThis table shows the relationship between long-term institutional ownership and suicides using a Poisson model.The dependent variable is defined as the total suicides that occurred during a given year and prison. Long-termOwnershipi,t is the prison’s long-term institutional ownership, which is the quasi-indexer classification of Bushee(2001). (Privatei,t) is a binary variable that takes the value of one whenever the prison is managed by a non-government institution. All of the control variables are the same ones of Table 3. Standard errors are reported inparentheses and are clustered at the prison-level. The coe�cient reported in the table are incidental-rate ratios. Anincidental-rate ratio above (below) one represents a positive (negative) relationship between the given independentvariable and dependent variable.
Dependent Variable: Total Suicidesi,t
(I) (II) (III) (IV) (V) (VI)
Long-term Ownershipi,t 0.953*** 0.955*** 0.956*** 0.956*** 0.959*** 0.960***(0.019) (0.018) (0.018) (0.019) (0.019) (0.020)
(Privatei,t) 1.571*** 1.556*** 1.645*** 1.627*** 1.636*** 1.667***(0.032) (0.031) (0.033) (0.032) (0.034) (0.043)
Control Variables X X X
Fixed E↵ectsYear X X X XState X XYear⇥State X XPrison X X
Observations 16,175 16,175 16,175 15,065 15,065 15,065Pseudo R-squared 0.121 0.179 0.329 0.153 0.192 0.338
73

Table A20: Inmate suicides as a function of ETF ownership using a Poisson modelThis table shows the relationship between ETF ownership and suicides using a Poisson model. The dependent variableis defined as the total suicides that occurred during a given year and prison. ETF Ownershipi,t is the prison’s averageETF ownership level during the given year. (Privatei,t) is a binary variable that takes the value of one wheneverthe prison is managed by a non-government institution. All of the control variables are the same ones of Table 3.Standard errors are reported in parentheses and are clustered at the prison-level. The coe�cient reported in the tableare incidental-rate ratios. An incidental-rate ratio above (below) one represents a positive (negative) relationshipbetween the given independent variable and dependent variable.
Dependent Variable: Total Suicidesi,t
(I) (II) (III) (IV) (V) (VI)
ETF Ownershipi,t 0.948*** 0.950*** 0.939*** 0.946*** 0.947*** 0.938***(0.017) (0.017) (0.019) (0.017) (0.018) (0.019)
(Privatei,t) 1.519*** 1.511*** 1.542*** 1.647*** 1.621*** 1.663***(0.031) (0.031) (0.035) (0.032) (0.034) (0.037)
Control Variables X X X
Fixed E↵ectsYear X X X XState X XYear⇥State X XPrison X X
Observations 16,175 16,175 16,175 15,065 15,065 15,065Pseudo R-squared 0.117 0.173 0.311 0.149 0.188 0.329
74

Table A21: Inmate suicides as a function of block ownership by short-term versuslong-term ownership typesThis table shows the relationship between suicides and block ownership by active versus long-term ownership types.The dependent variable is defined as the logarithmic transformation of one plus total suicides that occurred during agiven year and prison. Short-terrm (Long-term) Block Ownership is defined as the total fraction of outstanding sharesheld by short-term (long-term) investors who hold at least 5% of the fraction of outstanding shares. (Privatei,t) is abinary variable that takes the value of one whenever the prison is managed by a non-government institution. All ofthe control variables are the same ones of Table 3. Standard errors are reported in parentheses and are clustered at theprison-level.
Dependent Variable: Log(1+Total Suicidesi,t)
(I) (II) (III) (IV) (V) (VI)
Long-term Block Ownershipi,t �0.043*** �0.043*** �0.046*** �0.043*** �0.044*** �0.048***(0.003) (0.003) (0.004) (0.003) (0.003) (0.004)
Short-term Block Ownershipi,t 0.056*** 0.059*** 0.064*** 0.057*** 0.057*** 0.063***(0.012) (0.011) (0.008) (0.013) (0.013) (0.008)
(Privatei,t) 0.364*** 0.362*** 0.459*** 0.390*** 0.392*** 0.463***(0.016) (0.015) (0.039) (0.015) (0.016) (0.039)
Control Variables X X X
Fixed E↵ectsYear X X X XState X XYear⇥State X XPrison X X
Observations 16,175 16,158 16,059 15,041 15,041 14,941R-squared 0.164 0.211 0.366 0.191 0.187 0.373
75

Table A22: Inmate suicides as a function of total dollar value of block holdingsby short-term versus long-term ownership typesThis table shows the relationship between suicides and total dollar value of block holdings by short-term versus long-term ownership types. The dependent variable is defined as the logarithmic transformation of one plus total suicidesthat occurred during a given year and prison. Short-term (Long-term) Block Dollar is defined as the logarithmictransformation of the total dollar value held by short-term (long-term) investors who hold at least 5% of the fractionof outstanding shares. (Privatei,t) is a binary variable that takes the value of one whenever the prison is managed bya non-government institution. All of the control variables are the same ones of Table 3. Standard errors are reportedin parentheses and are clustered at the prison-level.
Dependent Variable: Log(1+Total Suicidesi,t)
(I) (II) (III) (IV) (V) (VI)
Log(Long-term Block Dollari,t) �1.514*** �1.540*** �3.737*** �1.540*** �1.547*** �3.924***(0.177) (0.174) (0.729) (0.184) (0.186) (0.746)
Log(Short-term Block Dollari,t) 0.064 0.103 0.123 0.043 0.143 0.086(0.287) (0.287) (0.311) (0.278) (0.278) (0.306)
(Privatei,t) 0.399*** 0.396*** 0.431*** 0.429*** 0.432*** 0.434***(0.020) (0.019) (0.022) (0.021) (0.022) (0.023)
Control Variables X X X
Fixed E↵ectsYear X X X XState X XYear⇥State X XPrison X X
Observations 16,175 16,158 16,059 15,041 15,041 14,941R-squared 0.157 0.205 0.365 0.184 0.241 0.393
76

Table A23: Overcrowding as a function of long-term institutional ownershipThis table shows the relationship between long-term institutional ownership and overcrowding. The dependent vari-able is defined as the ratio of total number of inmates divided by the maximum number of inmates the given prisonmay house. Long-term Ownershipi,t is the prison’s long-term institutional ownership, which is the quasi-indexerclassification of Bushee (2001). (Privatei,t) is a binary variable that takes the value of one whenever the prison ismanaged by a non-government institution. All of the control variables the ones from Table 1 and are defined in Table1. Standard errors are reported in parentheses and are clustered at the prison-level.
Dependent Variable: Overcrowding Ratioi,t
(I) (II) (III) (IV) (V) (VI)
Long-term Ownershipi,t �0.017*** �0.017*** �0.017*** �0.017*** �0.017*** �0.017***(0.000 4) (0.000 4) (0.001) (0.000 4) (0.000 4) (0.001)
(Privatei,t) 0.148*** 0.148*** 0.156*** 0.153*** 0.153*** 0.156***(0.003) (0.003) (0.011) (0.004) (0.004) (0.012)
Control Variables X X X
Fixed E↵ectsYear X X X XState X XYear⇥State X XPrison X X
Observations 16,164 16,147 16,049 15,065 15,065 14,965R-squared 0.695 0.715 0.809 0.699 0.723 0.827
77

Table A24: Overcrowding as a function of ETF ownershipThis table shows the relationship between ETF ownership and overcrowding. The dependent variable is defined asthe ratio of total number of inmates divided by the maximum number of inmates the given prison may house. ETFOwnershipi,t is the prison’s average ETF ownership level during the given year. (Privatei,t) is a binary variable thattakes the value of one whenever the prison is managed by a non-government institution. All of the control variablesare the ones from Table 1 and are defined in Table 1. Standard errors are reported in parentheses and are clustered atthe prison-level.
Dependent Variable: Overcrowding Ratioi,t
(I) (II) (III) (IV) (V) (VI)
ETF Ownershipi,t �0.027*** �0.027*** �0.023*** �0.028*** �0.028*** �0.023***(0.001) (0.001) (0.001) (0.001) (0.001) (0.001)
(Privatei,t) 0.129*** 0.129*** 0.135*** 0.135*** 0.135*** 0.134***(0.004) (0.004) (0.012) (0.004) (0.004) (0.012)
Control Variables X X X
Fixed E↵ectsYear X X X XState X XYear⇥State X XPrison X X
Observations 16,164 16,147 16,049 15,065 15,065 14,965R-squared 0.587 0.613 0.728 0.595 0.601 0.749
78
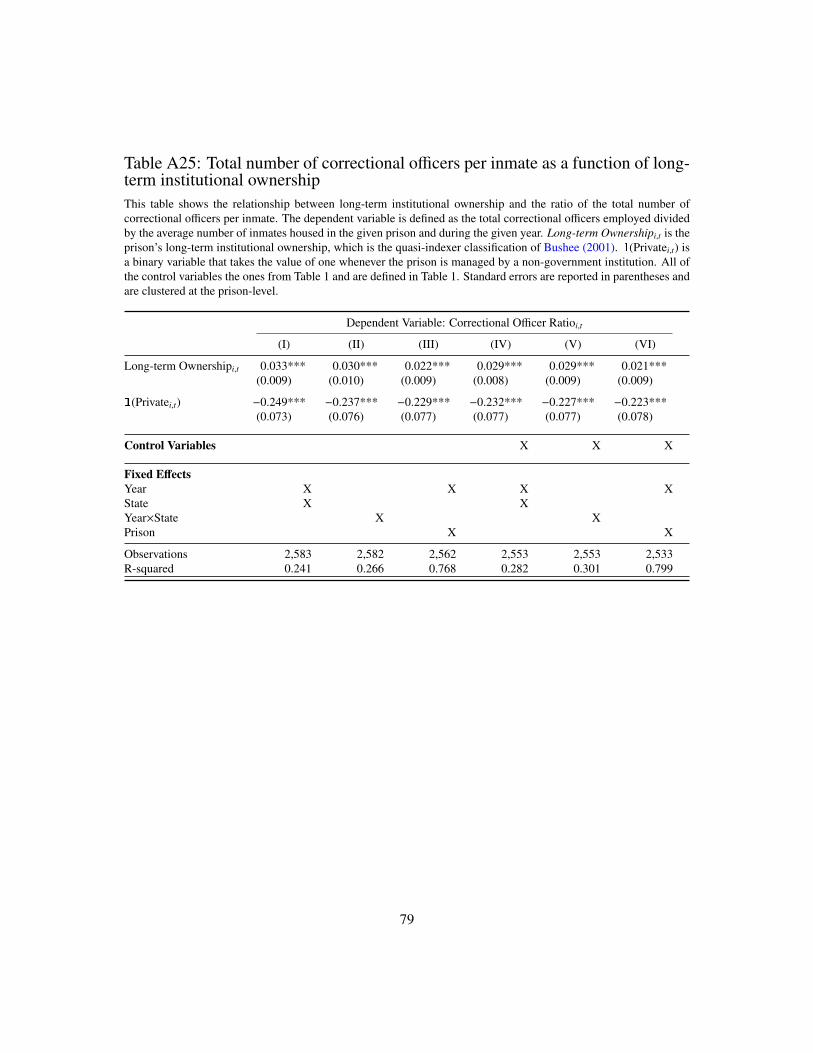
Table A25: Total number of correctional o�cers per inmate as a function of long-term institutional ownershipThis table shows the relationship between long-term institutional ownership and the ratio of the total number ofcorrectional o�cers per inmate. The dependent variable is defined as the total correctional o�cers employed dividedby the average number of inmates housed in the given prison and during the given year. Long-term Ownershipi,t is theprison’s long-term institutional ownership, which is the quasi-indexer classification of Bushee (2001). (Privatei,t) isa binary variable that takes the value of one whenever the prison is managed by a non-government institution. All ofthe control variables the ones from Table 1 and are defined in Table 1. Standard errors are reported in parentheses andare clustered at the prison-level.
Dependent Variable: Correctional O�cer Ratioi,t
(I) (II) (III) (IV) (V) (VI)
Long-term Ownershipi,t 0.033*** 0.030*** 0.022*** 0.029*** 0.029*** 0.021***(0.009) (0.010) (0.009) (0.008) (0.009) (0.009)
(Privatei,t) �0.249*** �0.237*** �0.229*** �0.232*** �0.227*** �0.223***(0.073) (0.076) (0.077) (0.077) (0.077) (0.078)
Control Variables X X X
Fixed E↵ectsYear X X X XState X XYear⇥State X XPrison X X
Observations 2,583 2,582 2,562 2,553 2,553 2,533R-squared 0.241 0.266 0.768 0.282 0.301 0.799
79
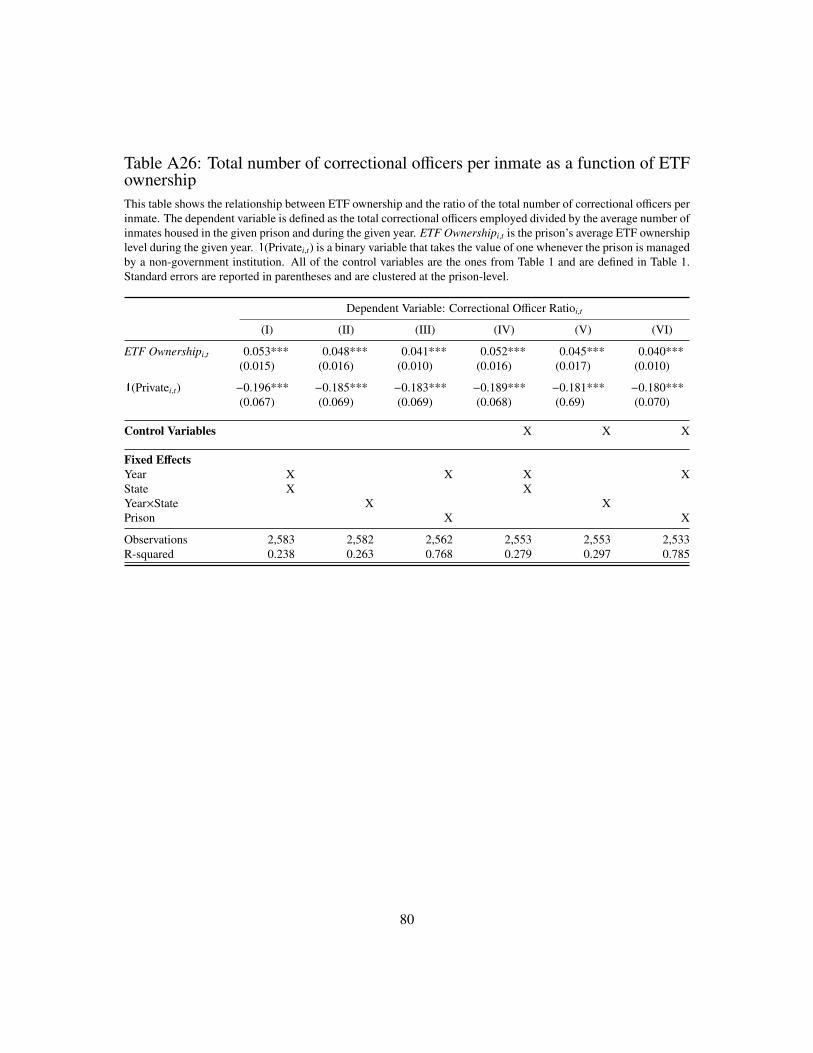
Table A26: Total number of correctional o�cers per inmate as a function of ETFownershipThis table shows the relationship between ETF ownership and the ratio of the total number of correctional o�cers perinmate. The dependent variable is defined as the total correctional o�cers employed divided by the average number ofinmates housed in the given prison and during the given year. ETF Ownershipi,t is the prison’s average ETF ownershiplevel during the given year. (Privatei,t) is a binary variable that takes the value of one whenever the prison is managedby a non-government institution. All of the control variables are the ones from Table 1 and are defined in Table 1.Standard errors are reported in parentheses and are clustered at the prison-level.
Dependent Variable: Correctional O�cer Ratioi,t
(I) (II) (III) (IV) (V) (VI)
ETF Ownershipi,t 0.053*** 0.048*** 0.041*** 0.052*** 0.045*** 0.040***(0.015) (0.016) (0.010) (0.016) (0.017) (0.010)
(Privatei,t) �0.196*** �0.185*** �0.183*** �0.189*** �0.181*** �0.180***(0.067) (0.069) (0.069) (0.068) (0.69) (0.070)
Control Variables X X X
Fixed E↵ectsYear X X X XState X XYear⇥State X XPrison X X
Observations 2,583 2,582 2,562 2,553 2,553 2,533R-squared 0.238 0.263 0.768 0.279 0.297 0.785
80

Table A27: Overcrowding as a function of long-term institutional ownership typesThis table shows the relationship between long-term institutional ownership types and overcrowding. The dependentvariable is defined as the ratio of total number of inmates divided by the maximum number of inmates the given prisonmay house. Independent Inv. Advisori,t, Investment Companyi,t, and Bank Trust Ownershipi,t is the prison’s ownershiplevel by independent investment advisors, investment companies, and bank trusts, which are based on the investortype classifications of Bushee (2001). (Privatei,t) is a binary variable that takes the value of one whenever the prisonis managed by a non-government institution. All of the control variables are the same ones of Table 3. Standard errorsare reported in parentheses and are clustered at the prison-level.
Dependent Variable: Overcrowding Ratioi,t
(I) (II) (III) (IV) (V) (VI)
Independent Inv. Advisori,t �0.029*** �0.030*** �0.026*** �0.026*** �0.026*** �0.023***(0.007) (0.008) (0.007) (0.007) (0.007) (0.007)
Investment Companyi,t �0.013*** �0.014*** �0.010*** �0.014*** �0.014*** �0.011***(0.002) (0.002) (0.003) (0.002) (0.003) (0.003)
Bank Trust Ownershipi,t 0.018*** 0.013*** 0.021*** 0.018*** 0.018*** 0.020***(0.003) (0.003) (0.004) (0.004) (0.004) (0.005)
(Privatei,t) 0.111*** 0.105*** 0.104*** 0.102*** 0.099*** 0.094***(0.029) (0.032) (0.033) (0.029) (0.029) (0.027)
Control Variables X X X
Fixed E↵ectsYear X X X XState X XYear⇥State X XPrison X X
Observations 2,582 2,581 2,561 2,553 2,533 2,533R-squared 0.705 0.730 0.845 0.716 0.739 0.853
81

Table A28: Total number of correctional o�cers per inmate as a function of long-term institutional ownership typesThis table shows the relationship between long-term institutional ownership types and the ratio of the total number ofcorrectional o�cers per inmate. The dependent variable is defined as the total correctional o�cers employed dividedby the average number of inmates housed in the given prison and during the given year. Independent Inv. Advisori,t,Investment Companyi,t, and Bank Trust Ownershipi,t is the prison’s ownership level by independent investment advi-sors, investment companies, and bank trusts, which are based on the investor type classifications of Bushee (2001).
(Privatei,t) is a binary variable that takes the value of one whenever the prison is managed by a non-governmentinstitution. All of the control variables are the same ones of Table 3. Standard errors are reported in parentheses andare clustered at the prison-level.
Dependent Variable: Correctional O�cer Ratioi,t
(I) (II) (III) (IV) (V) (VI)
Independent Inv. Advisori,t 0.049*** 0.051*** 0.040*** 0.049*** 0.049*** 0.040***(0.005) (0.005) (0.006) (0.005) (0.005) (0.006)
Investment Companyi,t 0.031*** 0.031*** 0.020*** 0.030*** 0.031*** 0.020***(0.007) (0.008) (0.005) (0.007) (0.007) (0.005)
Bank Trust Ownershipi,t �0.038*** �0.039*** �0.011** �0.039*** �0.039*** �0.013*(0.009) (0.009) (0.007) (0.009) (0.009) (0.007)
(Privatei,t) �0.186*** �189*** �0.278*** �0.183*** �0.187*** �0.299***(0.033) (0.032) (0.072) (0.032) (0.031) (0.075)
Control Variables X X X
Fixed E↵ectsYear X X X XState X XYear⇥State X XPrison X X
Observations 2,582 2,581 2,561 2,553 2,533 2,533R-squared 0.820 0.827 0.903 0.826 0.833 0.903
82

Table A29: Suicide prevention programs as a function of long-term institutionalownership typesThis table shows the relationship between long-term institutional ownership types and the total suicide preventionprograms o↵ered in prisons. The dependent variable is defined as the logarithmic transformation of suicide preventionprograms that are o↵ered in a given prison during a given year. Independent Inv. Advisori,t, Investment Companyi,t, andBank Trust Ownershipi,t is the prison’s ownership level by independent investment advisors, investment companies,and bank trusts, which are based on the investor type classifications of Bushee (2001). (Privatei,t) is a binary variablethat takes the value of one whenever the prison is managed by a non-government institution. All of the controlvariables are the same ones of Table 3. Standard errors are reported in parentheses and are clustered at the prison-level.
Dependent Variable: Log(Suicide Prevention Programsi,t)
(I) (II) (III) (IV) (V) (VI)
Independent Inv. Advisori,t 0.029*** 0.029*** 0.025*** 0.027*** 0.028*** 0.023***(0.004) (0.004) (0.004) (0.003) (0.004) (0.003)
Investment Companyi,t 0.011*** 0.011*** 0.013*** 0.012*** 0.012*** 0.015***(0.003) (0.002) (0.004) (0.002) (0.003) (0.003)
Bank Trust Ownershipi,t �0.014*** �0.014*** �0.010*** �0.013*** �0.015*** �0.010***(0.002) (0.002) (0.003) (0.003) (0.003) (0.002)
(Privatei,t) �0.210*** �0.208*** �0.228*** �0.204*** �0.204*** �0.230***(0.005) (0.005) (0.020) (0.005) (0.006) (0.021)
Control Variables X X X
Fixed E↵ectsYear X X X XState X XYear⇥State X XPrison X X
Observations 16,175 16,158 16,059 15,065 15,065 14,965R-squared 0.187 0.224 0.261 0.189 0.233 0.258
83

Table A30: Total number of programs as a function of long-term institutionalownership typesThis table shows the relationship between long-term institutional ownership types and the total number of programso↵ered in prisons, such as educational, social, health (e.g., alcohol and drug treatment, therapeutic), religious, spir-itual, and cultural program. The dependent variable is defined as the logarithmic transformation of total number ofprograms that are o↵ered in a given prison during a given year. Independent Inv. Advisori,t, Investment Companyi,t,and Bank Trust Ownershipi,t is the prison’s ownership level by independent investment advisors, investment compa-nies, and bank trusts, which are based on the investor type classifications of Bushee (2001). (Privatei,t) is a binaryvariable that takes the value of one whenever the prison is managed by a non-government institution. All of thecontrol variables are the same ones of Table 3. Standard errors are reported in parentheses and are clustered at theprison-level.
Dependent Variable: Log(Total Number of Programsi,t)
(I) (II) (III) (IV) (V) (VI)
Independent Inv. Advisori,t 0.033*** 0.036*** 0.033*** 0.036*** 0.035*** 0.034**(0.011) (0.012) (0.010) (0.011) (0.011) (0.009)
Investment Companyi,t 0.018*** 0.019*** 0.020*** 0.014*** 0.015*** 0.015**(0.007) (0.008) (0.007) (0.007) (0.007) (0.006)
Bank Trust Ownershipi,t �0.011** �0.011** �0.032* �0.010** �0.092** �0.029*(0.004) (0.005) (0.003) (0.004) (0.004) (0.004)
(Privatei,t) �0.158*** �0.159*** �0.137*** �0.154*** �0.151*** �0.140***(0.028) (0.029) (0.031) (0.029) (0.029) (0.034)
Control Variables X X X
Fixed E↵ectsYear X X X XState X XYear⇥State X XPrison X X
Observations 16,171 16,154 16,055 15,061 15,061 14,961R-squared 0.563 0.577 0.658 0.572 0.581 0.698
84
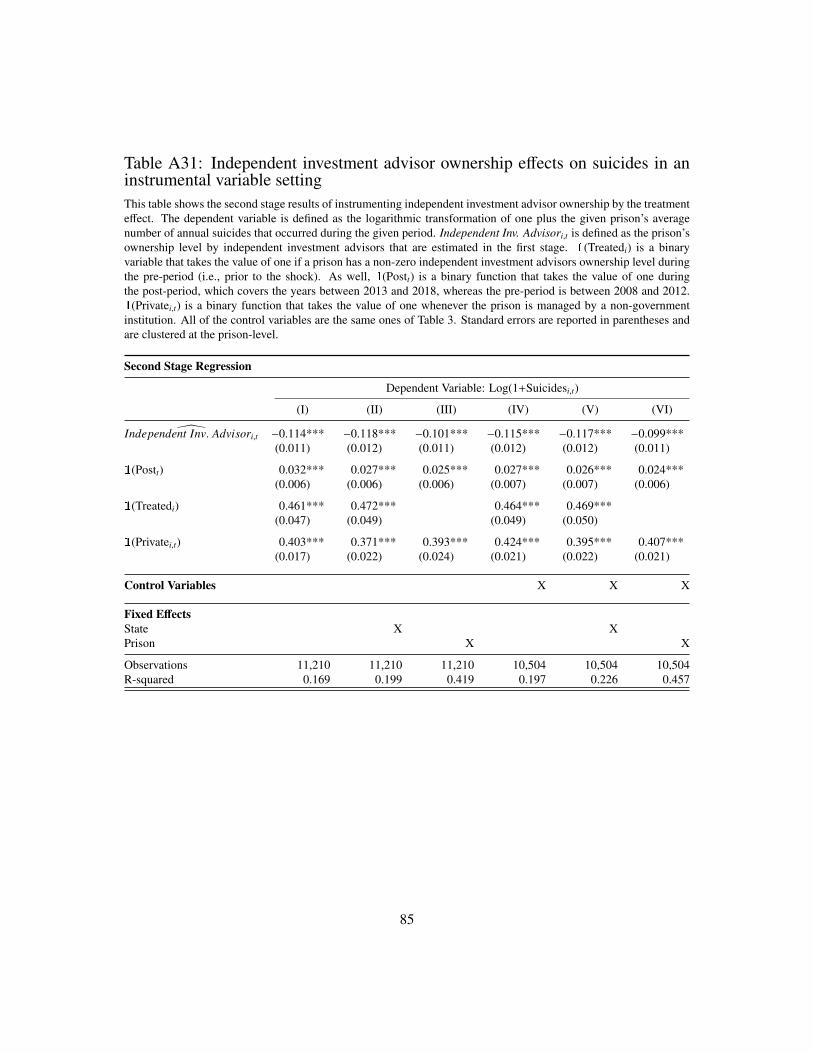
Table A31: Independent investment advisor ownership e↵ects on suicides in aninstrumental variable settingThis table shows the second stage results of instrumenting independent investment advisor ownership by the treatmente↵ect. The dependent variable is defined as the logarithmic transformation of one plus the given prison’s averagenumber of annual suicides that occurred during the given period. Independent Inv. Advisori,t is defined as the prison’sownership level by independent investment advisors that are estimated in the first stage. (Treatedi) is a binaryvariable that takes the value of one if a prison has a non-zero independent investment advisors ownership level duringthe pre-period (i.e., prior to the shock). As well, (Postt) is a binary function that takes the value of one duringthe post-period, which covers the years between 2013 and 2018, whereas the pre-period is between 2008 and 2012.
(Privatei,t) is a binary function that takes the value of one whenever the prison is managed by a non-governmentinstitution. All of the control variables are the same ones of Table 3. Standard errors are reported in parentheses andare clustered at the prison-level.
Second Stage Regression
Dependent Variable: Log(1+Suicidesi,t)
(I) (II) (III) (IV) (V) (VI)
\Independent Inv. Advisori,t �0.114*** �0.118*** �0.101*** �0.115*** �0.117*** �0.099***(0.011) (0.012) (0.011) (0.012) (0.012) (0.011)
(Postt) 0.032*** 0.027*** 0.025*** 0.027*** 0.026*** 0.024***(0.006) (0.006) (0.006) (0.007) (0.007) (0.006)
(Treatedi) 0.461*** 0.472*** 0.464*** 0.469***(0.047) (0.049) (0.049) (0.050)
(Privatei,t) 0.403*** 0.371*** 0.393*** 0.424*** 0.395*** 0.407***(0.017) (0.022) (0.024) (0.021) (0.022) (0.021)
Control Variables X X X
Fixed E↵ectsState X XPrison X X
Observations 11,210 11,210 11,210 10,504 10,504 10,504R-squared 0.169 0.199 0.419 0.197 0.226 0.457
85
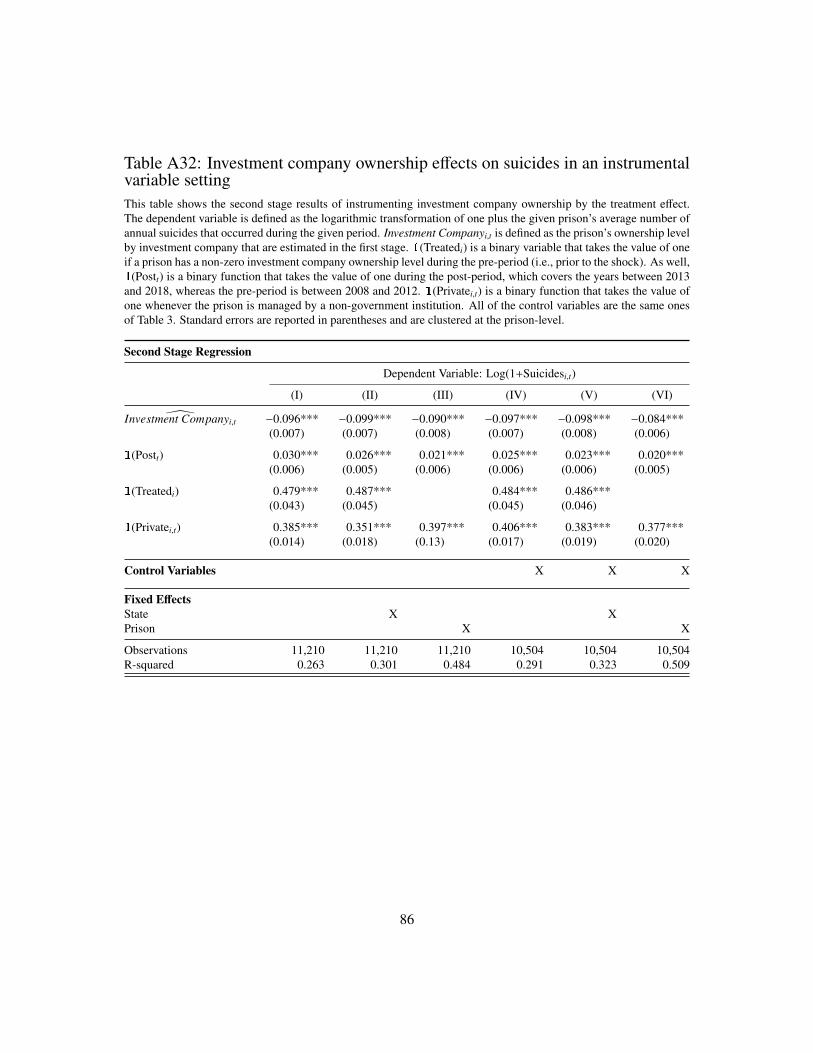
Table A32: Investment company ownership e↵ects on suicides in an instrumentalvariable settingThis table shows the second stage results of instrumenting investment company ownership by the treatment e↵ect.The dependent variable is defined as the logarithmic transformation of one plus the given prison’s average number ofannual suicides that occurred during the given period. Investment Companyi,t is defined as the prison’s ownership levelby investment company that are estimated in the first stage. (Treatedi) is a binary variable that takes the value of oneif a prison has a non-zero investment company ownership level during the pre-period (i.e., prior to the shock). As well,
(Postt) is a binary function that takes the value of one during the post-period, which covers the years between 2013and 2018, whereas the pre-period is between 2008 and 2012. (Privatei,t) is a binary function that takes the value ofone whenever the prison is managed by a non-government institution. All of the control variables are the same onesof Table 3. Standard errors are reported in parentheses and are clustered at the prison-level.
Second Stage Regression
Dependent Variable: Log(1+Suicidesi,t)
(I) (II) (III) (IV) (V) (VI)
\Investment Companyi,t �0.096*** �0.099*** �0.090*** �0.097*** �0.098*** �0.084***(0.007) (0.007) (0.008) (0.007) (0.008) (0.006)
(Postt) 0.030*** 0.026*** 0.021*** 0.025*** 0.023*** 0.020***(0.006) (0.005) (0.006) (0.006) (0.006) (0.005)
(Treatedi) 0.479*** 0.487*** 0.484*** 0.486***(0.043) (0.045) (0.045) (0.046)
(Privatei,t) 0.385*** 0.351*** 0.397*** 0.406*** 0.383*** 0.377***(0.014) (0.018) (0.13) (0.017) (0.019) (0.020)
Control Variables X X X
Fixed E↵ectsState X XPrison X X
Observations 11,210 11,210 11,210 10,504 10,504 10,504R-squared 0.263 0.301 0.484 0.291 0.323 0.509
86
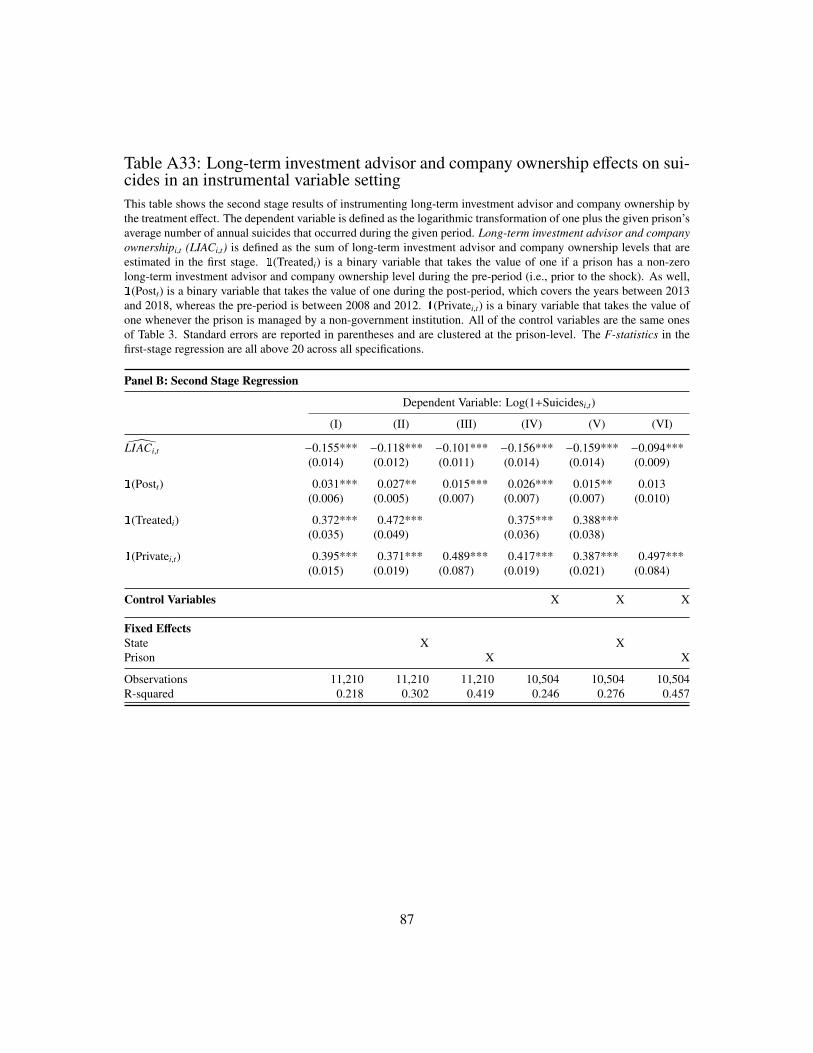
Table A33: Long-term investment advisor and company ownership e↵ects on sui-cides in an instrumental variable settingThis table shows the second stage results of instrumenting long-term investment advisor and company ownership bythe treatment e↵ect. The dependent variable is defined as the logarithmic transformation of one plus the given prison’saverage number of annual suicides that occurred during the given period. Long-term investment advisor and companyownershipi,t (LIACi,t) is defined as the sum of long-term investment advisor and company ownership levels that areestimated in the first stage. (Treatedi) is a binary variable that takes the value of one if a prison has a non-zerolong-term investment advisor and company ownership level during the pre-period (i.e., prior to the shock). As well,
(Postt) is a binary variable that takes the value of one during the post-period, which covers the years between 2013and 2018, whereas the pre-period is between 2008 and 2012. (Privatei,t) is a binary variable that takes the value ofone whenever the prison is managed by a non-government institution. All of the control variables are the same onesof Table 3. Standard errors are reported in parentheses and are clustered at the prison-level. The F-statistics in thefirst-stage regression are all above 20 across all specifications.
Panel B: Second Stage Regression
Dependent Variable: Log(1+Suicidesi,t)
(I) (II) (III) (IV) (V) (VI)
\LIACi,t �0.155*** �0.118*** �0.101*** �0.156*** �0.159*** �0.094***(0.014) (0.012) (0.011) (0.014) (0.014) (0.009)
(Postt) 0.031*** 0.027** 0.015*** 0.026*** 0.015** 0.013(0.006) (0.005) (0.007) (0.007) (0.007) (0.010)
(Treatedi) 0.372*** 0.472*** 0.375*** 0.388***(0.035) (0.049) (0.036) (0.038)
(Privatei,t) 0.395*** 0.371*** 0.489*** 0.417*** 0.387*** 0.497***(0.015) (0.019) (0.087) (0.019) (0.021) (0.084)
Control Variables X X X
Fixed E↵ectsState X XPrison X X
Observations 11,210 11,210 11,210 10,504 10,504 10,504R-squared 0.218 0.302 0.419 0.246 0.276 0.457
87
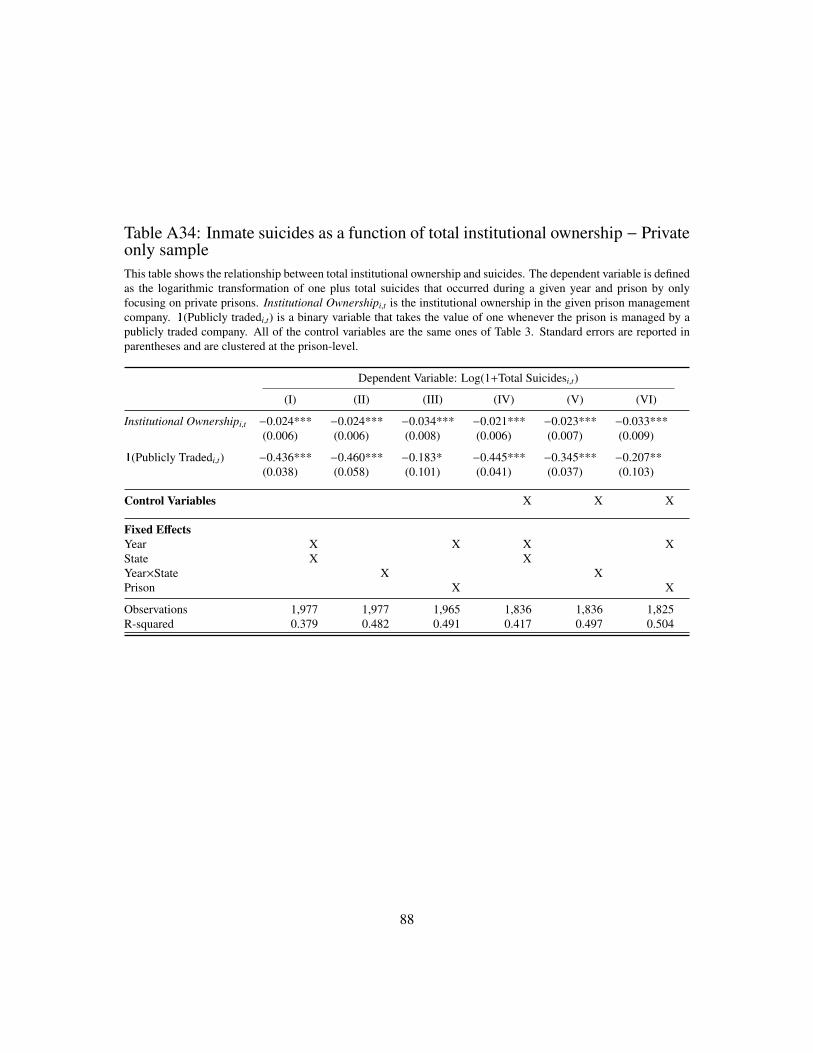
Table A34: Inmate suicides as a function of total institutional ownership � Privateonly sampleThis table shows the relationship between total institutional ownership and suicides. The dependent variable is definedas the logarithmic transformation of one plus total suicides that occurred during a given year and prison by onlyfocusing on private prisons. Institutional Ownershipi,t is the institutional ownership in the given prison managementcompany. (Publicly tradedi,t) is a binary variable that takes the value of one whenever the prison is managed by apublicly traded company. All of the control variables are the same ones of Table 3. Standard errors are reported inparentheses and are clustered at the prison-level.
Dependent Variable: Log(1+Total Suicidesi,t)
(I) (II) (III) (IV) (V) (VI)
Institutional Ownershipi,t �0.024*** �0.024*** �0.034*** �0.021*** �0.023*** �0.033***(0.006) (0.006) (0.008) (0.006) (0.007) (0.009)
(Publicly Tradedi,t) �0.436*** �0.460*** �0.183* �0.445*** �0.345*** �0.207**(0.038) (0.058) (0.101) (0.041) (0.037) (0.103)
Control Variables X X X
Fixed E↵ectsYear X X X XState X XYear⇥State X XPrison X X
Observations 1,977 1,977 1,965 1,836 1,836 1,825R-squared 0.379 0.482 0.491 0.417 0.497 0.504
88
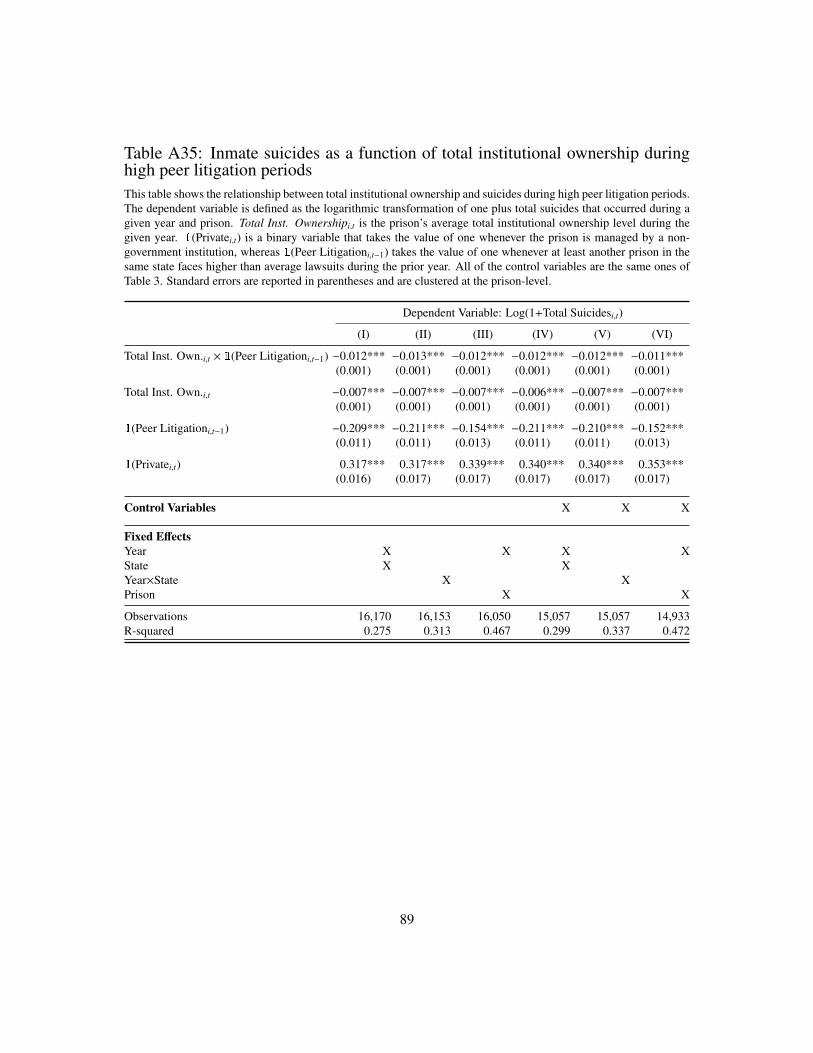
Table A35: Inmate suicides as a function of total institutional ownership duringhigh peer litigation periodsThis table shows the relationship between total institutional ownership and suicides during high peer litigation periods.The dependent variable is defined as the logarithmic transformation of one plus total suicides that occurred during agiven year and prison. Total Inst. Ownershipi,t is the prison’s average total institutional ownership level during thegiven year. (Privatei,t) is a binary variable that takes the value of one whenever the prison is managed by a non-government institution, whereas (Peer Litigationi,t�1) takes the value of one whenever at least another prison in thesame state faces higher than average lawsuits during the prior year. All of the control variables are the same ones ofTable 3. Standard errors are reported in parentheses and are clustered at the prison-level.
Dependent Variable: Log(1+Total Suicidesi,t)
(I) (II) (III) (IV) (V) (VI)
Total Inst. Own.i,t ⇥ (Peer Litigationi,t�1) �0.012*** �0.013*** �0.012*** �0.012*** �0.012*** �0.011***(0.001) (0.001) (0.001) (0.001) (0.001) (0.001)
Total Inst. Own.i,t �0.007*** �0.007*** �0.007*** �0.006*** �0.007*** �0.007***(0.001) (0.001) (0.001) (0.001) (0.001) (0.001)
(Peer Litigationi,t�1) �0.209*** �0.211*** �0.154*** �0.211*** �0.210*** �0.152***(0.011) (0.011) (0.013) (0.011) (0.011) (0.013)
(Privatei,t) 0.317*** 0.317*** 0.339*** 0.340*** 0.340*** 0.353***(0.016) (0.017) (0.017) (0.017) (0.017) (0.017)
Control Variables X X X
Fixed E↵ectsYear X X X XState X XYear⇥State X XPrison X X
Observations 16,170 16,153 16,050 15,057 15,057 14,933R-squared 0.275 0.313 0.467 0.299 0.337 0.472
89

Table A36: Inmate suicides as a function of ETF ownership during high peerlitigation periodsThis table shows the relationship between ETF ownership and suicides during high peer litigation periods. Thedependent variable is defined as the logarithmic transformation of one plus total suicides that occurred during a givenyear and prison. ETF Ownershipi,t is the prison’s average ETF ownership level during the given year. (Privatei,t) is abinary variable that takes the value of one whenever the prison is managed by a non-government institution, whereas
(Peer Litigationi,t�1) takes the value of one whenever at least another prison in the same state faces higher thanaverage lawsuits during the prior year. All of the control variables are the same ones of Table 3. Standard errors arereported in parentheses and are clustered at the prison-level.
Dependent Variable: Log(1+Total Suicidesi,t)
(I) (II) (III) (IV) (V) (VI)
ETF Own.i,t ⇥ (Peer Litigationi,t�1) �0.031*** �0.030*** �0.038*** �0.031*** �0.029*** �0.040***(0.005) (0.006) (0.004) (0.005) (0.005) (0.004)
ETF Own.i,t �0.027*** �0.028*** �0.026*** �0.027*** �0.027*** �0.026***(0.001) (0.001) (0.001) (0.001) (0.001) (0.001)
(Peer Litigationi,t�1) �0.157*** �0.166*** �0.164*** �0.150*** �0.151*** �0.167***(0.015) (0.016) (0.016) (0.016) (0.016) (0.019)
(Privatei,t) 0.286*** 0.294*** 0.273*** 0.308*** 0.307*** 0.277***(0.016) (0.016) (0.023) (0.017) (0.017) (0.024)
Control Variables X X X
Fixed E↵ectsYear X X X XState X XYear⇥State X XPrison X X
Observations 16,170 16,153 16,050 15,057 15,057 14,933R-squared 0.211 0.257 0.413 0.237 0.299 0.443
90