Embed Size (px)
Citation preview
DNB Technology A global long only equity TMT fund
May 2014
Anders Tandberg-Johansen, Portfolio Manager
Sverre Bergland, Portfolio Manager
Erling Thune, Portfolio Manager

DNB Technology
2
• Long-only UCITS global equity fund which invests in
technology, media and telecom sectors
• Strong and consistent performance record
• Dedicated and experienced investment team
• Compliant with DNB Asset Managements SRI policy

Agenda
3
1 DNB Asset Management
3 Investment Process
2 Portfolio Management Team & Track Record
4 Risk Management
5 Fund Facts

DNB Asset Management
4
DNB is among the largest Asset Managers in the Nordic Region
• Specialist approach to investing
• 77 portfolio managers and analysts
• € 58 billion under management
• Offices in Oslo, Bergen, Stockholm, Luxembourg, Hong Kong and Chennai
• 100% owned by Oslo-listed DNB Group
The DNB Group
• DNB is Norway's largest financial services group and one of the largest in the Nordic
region in terms of market capitalization, represented in 21 countries worldwide
• The Group is among the world’s leading banks within shipping, energy and seafood
• The Group offers a full range of financial services, including loans, savings, advisory
services, insurance and pension products for retail and corporate customers and the
public sector

Agenda
5
1 DNB Asset Management
3 Investment Process
2 Portfolio Management Team & Track Record
4 Risk Management
5 Fund Facts

Experienced Team
Anders Tandberg-Johansen – Head of Global Technology
Anders joined DNB Asset Management in 1998 as a portfolio manager being responsible for Norwegian technology portfolios. Since 2002 he serves as Head of Global Technology Equities within the Global Equity team. Between 1996 and 1998 Anders was a technology analyst with Enskilda Securities. He holds a BA in Finance from the Norwegian School of Management (BI).
Sverre Bergland – Portfolio Manager, Software Sverre joined DNB Asset Management in 2001 as a technology equity analyst. He started out his professional
career in 1995, working for ABG Securities as an IT analyst. Sverre holds a BA in Finance from the University of San Francisco, USA.
Erling Thune – Portfolio Manager, Telecom & Media Erling joined DNB Asset Management's global technology team in early 2008 where he is responsible for
global telecommunications companies and media. Erling started his career in 1993 as a financial journalist for the Norwegian Financial Daily. Between 1996 and 2000 he was Senior Vice President and Investor Relations Officer at Elkjøp ASA, Norway's leading retail company, before joining Telenor ASA – Norway's leading Telecom operator – in 2000 where he held the position of the Head of Investor Relations. Erling is a graduate of the Norwegian School of Economics and Business Administration (NHH).
6

7
Best Global TMT fund over the last 5 years
Note: Returns as of May 2014, source morningstar.de out of152 Global Technology funds. Index is "MSCI World TMT" (66% MSCI Global IT, 22% MSCI
Global Telecom Services, 12% MSCI Global Media). Inception of fund is August 16th 2007. Historical performance is no guarantee of future returns.
Future returns will depend on market development, manager skill, portfolio / fund's risk exposure and the costs associated with the management /
investment. The return can at times be negative.
22.7 % 22.0 %
18.9 % 18.9 % 18.7 % 17.9 % 17.7 % 17.7 % 17.5 % 17.4 %
0%
5%
10%
15%
20%
25%

DNB Nordic Technology (NOK)
Massively beating peers over more than 10 years
Global TMT funds – last 10 years (annual)
Note: Inception of DNB Nordic Technology is August 8th 2001. Performance data as of May 2014 (NOK). Peers comparison from Morningstar last 10
years as of January 2014.Historical performance is no guarantee of future returns. Future returns will depend on market development, manager skill,
portfolio / fund's risk exposure and the costs associated with the management / investment. The return can at times be negative.
Acc. net return of 440 % since inception in 2001
8
16.8 %
8.2 %
7.0 % 6.5 %
5.6 % 5.3 % 4.9 %
4.1 % 4.1 % 3.8 %
0%
2%
4%
6%
8%
10%
12%
14%
16%
18%
-100%
0%
100%
200%
300%
400%
500% DNB Nordic Technology Benchmark

Successful Absolute Return strategy
9
Source: Grapht is Morningstar Direct pr April 2014. Performance is net of fees for TMT with gross swap performance only for Global Hedge. Table shows annual Global Hedge performance untli inception of TMT from 2011 until May 13, 2014. Historical performance is no guarantee of future returns. Future returns will depend on market development, manager skill, portfolio / fund's risk exposure and the costs associated with the management / investment. The return can at times be negative.
40
60
80
100
120
140
160
180
200
220
240
DNB TMT Absolute Return NOK ST1X
MSCI World (NOK) Global Hedge TMT Period MSCI TMT Net return*
sep.07 +2.6% 3.0%
2008 -55.1% 21.3%
2009 +61.9% 22.7%
2010 +10.2% -1.6%
2011 +1.4% +10.2%
2012 +12.7% -10.9%
2013 +26.0% +13.2%
2014 YTD +1.7% +0.4%
10
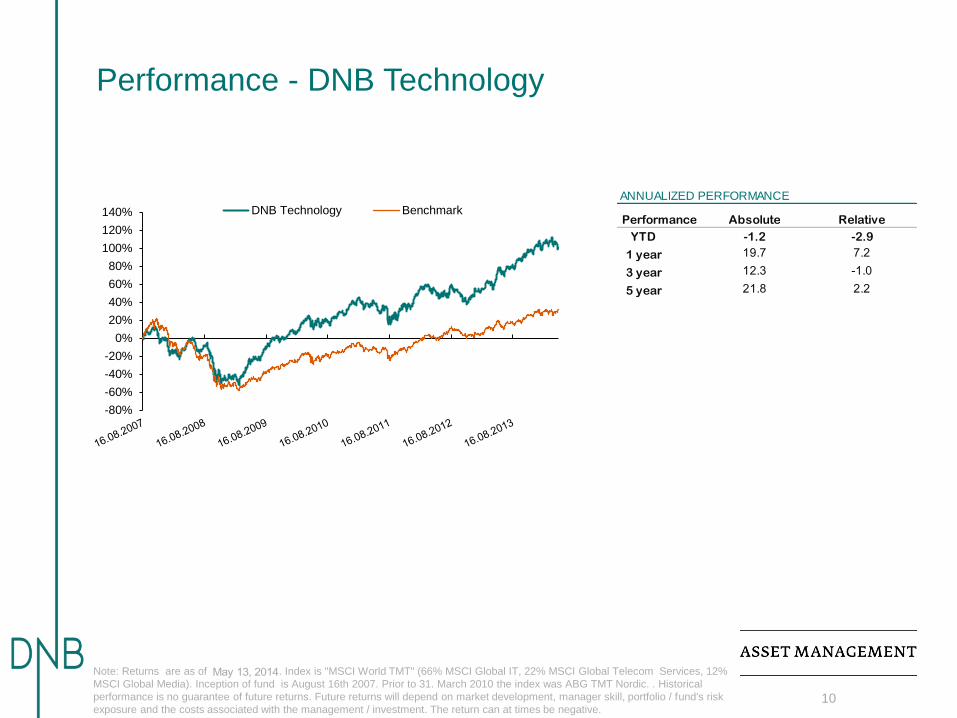
Note: Returns are as of . Index is "MSCI World TMT" (66% MSCI Global IT, 22% MSCI Global Telecom Services, 12%
MSCI Global Media). Inception of fund is August 16th 2007. Prior to 31. March 2010 the index was ABG TMT Nordic. . Historical
performance is no guarantee of future returns. Future returns will depend on market development, manager skill, portfolio / fund's risk
exposure and the costs associated with the management / investment. The return can at times be negative.
May 13, 2014
Performance - DNB Technology
-80%
-60%
-40%
-20%
0%
20%
40%
60%
80%
100%
120%
140% DNB Technology Benchmark
ANNUALIZED PERFORMANCE
YTD
1 year
3 year
5 year
19.7
12.3
7.2
-1.0
Relative
-1.2 -2.9
Performance Absolute
21.8 2.2

11
Performance relative to benchmark YTD - DNB Technology
Note: Returns are as of . Index is "MSCI World TMT" (66% MSCI Global IT, 22% MSCI Global Telecom Services, 12%
MSCI Global Media). Inception of fund is August 16th 2007. Prior to 31. March 2010 the index was ABG TMT Nordic. . Historical
performance is no guarantee of future returns. Future returns will depend on market development, manager skill, portfolio / fund's risk
exposure and the costs associated with the management / investment. The return can at times be negative.
May 13, 2014
Contributors Selection
Ubisoft Entertainment 0.56 %
Oracle Corp 0.49 %
TriQuint Semiconductor Inc 0.45 %
Softbank Corp 0.31 %
Samsung Electronics Co Ltd GDR 0.30 %
Hewlett-Packard Co 0.23 %
F5 Networks Inc 0.22 %
O2micro International Ltd ADR 0.18 %
Cisco Systems Inc 0.18 %
MasterCard Inc 0.17 %
Detractors Selection
Millennial Media Inc -1.08 %
Jds Uniphase Corp -0.92 %
Oclaro Inc -0.63 %
GameLoft SE -0.52 %
King Digital Entertainment Plc -0.25 %
Mellanox Technologies Ltd -0.24 %
Microsoft Corp -0.22 %
eBay Inc -0.21 %
Adva Optical Networking Se -0.20 %
Emc Corp/Ma -0.20 %

12
Tech stocks are cheap and grow faster than the market
Source Bloomberg per March 2014
Sector
PE 2014
Financials 12.7x
Energy 12.8x
Materials 15.5x
Utilities 15.8x
Information Tech 16.0x
Industrials 16.0x
Consumer Staples 17.5x
Telecom Services 17.5x
Health Care 17.7x
Consumer Discret. 18.5x
Sector Forecast EPS
Growth
Consumer Discretionary. 17.0%
Information Tech 13.9%
Health Care 13.2%
Industrials 11.9%
Materials 11.6%
Financials 11.1%
Energy 10.2%
Consumer Staples 9.2%
Telecom Services 4.0%
Utilities 2.6%

13
10 largest holdings
2014 PE of 13 on 8% EPS CAGR
Source: Bloomberg per March 2014
PE' 14 adjusted for net cash/debt
5.3
8.0 9.0 9.5
11.3 12.0
18.0 19.5 19.8
21.5
0
5
10
15
20
25
Estimated eps CAGR next three years
2.2 % 3.5 %
5.1 % 7.1 % 7.5 %
8.7 %
12.9 % 13.0 %
18.5 %
24.8 %
0%
5%
10%
15%
20%
25%
30%

14 Source: Bloomberg per May 2014
«Old tech» is fine…
Share price chg last three months EV/SALES 2014
11%
8%
6%
4% 3%
1% 0%
-4%
-7%
-10%
-15%
-10%
-5%
0%
5%
10%
15%
0.6 0.7 0.7 1.3 2.0 2.1
2.9 3.4 4.5
5.7
0
2
4
6
8
10
12
14
16
18

15 Source: Bloomberg per May 2014
While high multiple/momentum stocks have taken a beating
-64%
-49%
-43% -42% -42% -39%
-35% -35%
-28% -27% -26% -26%
-21% -17%
-70%
-60%
-50%
-40%
-30%
-20%
-10%
0%
Share price chg last three months
16.2
14.0
10.5 9.7
8.1 7.4
6.6 6.0 5.5 5.5 5.0
3.1
1.4 1.0
0
2
4
6
8
10
12
14
16
18
EV/SALES 2014

DNB Technology – Largest positions
DNB Technology
Position
16 Note: As of
APPLE 9.00 %
ORACLE CORP 7.31 %
SAP STAMM 5.51 %
Jds Uniphase Corp 4.49 %
Samsung Electronics Co Ltd GDR 4.41 %
CITRIX SYSTEMS 4.39 %
Netgear Inc 4.31 %
EBAY 3.89 %
EMC CORP 3.27 %
GOOGLE C 2.92 %
May 13, 2014

Agenda
17
1 DNB Asset Management
3 Investment Process
2 Portfolio Management Team & Track Record
4 Risk Management
5 Fund Facts
18
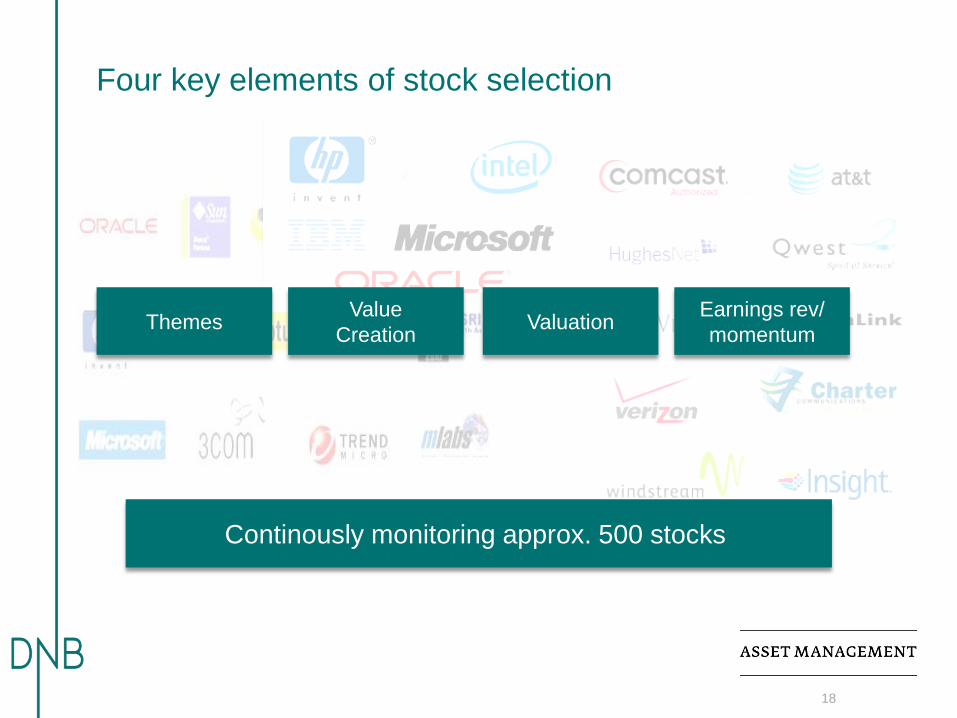
Four key elements of stock selection
Valuation Earnings rev/
momentum
Continously monitoring approx. 500 stocks
Value
Creation Themes

Themes - Six Important Megatrends
Smartphones-growth Services moving to the cloud
From Offline to Online New gaming platforms
The battle for the TV interface
19
Mobile payments

Strong positions and reasonable valuation
Value
Creation
Valuation
Earnings rev/
momentum
Theme
• Totally dominating search
• Strong and visionary management team
• Economies of scale – "The winner takes it all"
• Net cash adjusted P/E of 20 in 2014
• EPS growing by appr 20%
• Above 70% gross margin
• USD 45 billion in net cash
• Inflection point mobile search
• Undervalued other assets such as YouTube
• Facebook-threat overrated
• Winner in transition from Offline to online
• Well positioned in most TMT megatrends
20
Reduce
Buy Buy
Reduce
Buy
Revenues (USD Bn)
EPS (USD)
0
10
20
30
40
50
60
20
03
20
04
20
05
20
06
20
07
20
08
20
09
20
10
20
11
20
12
20
13
Q4
Q3
Q2
Q1
0
5
10
15
20
25
30
35
40
20
04
20
05
20
06
20
07
20
08
20
09
20
10
20
11
20
12
20
13
Q4
Q3
Q2
Q1

eBay
Leader in online payments
Value
Creation
Valuation
Earnings rev/
momentum
Theme
• Dominant position within online payments
• Scalable online shopping mall – no inventories
• Good management
• PayPal at 15x EBITDA (EBITDA CAGR of 20%)
• Marketplaces at 10x EBITDA (EBITDA CAGR of 10%)
• = 30% upside to current share price
• Activist involvement
• Strong indicators from ChannelAdvisor
• Strong growth in eCommerce and online payments
21
Reduce
Buy Buy
Reduce
Buy
Active PayPal users (mill)
Number of payments (mill)
0
20
40
60
80
100
120
140
160
2009 2010 2011 2012 2013
0
500
1000
1500
2000
2500
3000
3500
2009 2010 2011 2012 2013

Gameloft
Explosive growth in addressable market
Value
Creation
Valuation
Earnings rev/
momentum
Theme
• Top line growth and margin expansion
• Broad portfolio – no one hit wonders
• PE of 20 in 2014
• EPS growing by approximately 40%
• Above 80% gross margin
• Smartphone growth in emerging markets will grow faster than most people expect
• Rapid growth in mobile internet devices
22
Reduce
Buy Buy
Reduce
Buy
Global Internet device sales
Revenues (EUR)
-40
10
60
110
160
210
260
2008 2009 2010 2011 2012 2013e 2014e

Samsung
Quality company at a big discount
Value
Creation
Valuation
Earnings rev/
momentum
Theme
• Strong management
• Scale leader in handset and memory
• Uniquely cheap vs. own industry and universe
• Estimates marginally slipping (like the industry), but minor compared to valuation
• Tailwinds from mobility growth and increased storage
23
Reduce
Buy Buy
Reduce
Buy
Dominant in mobile memory
Historical fwd P/E ex cash
51%
25%
22% 1%
Samsung
Hynix
Micron
Other

Netgear
Well positioned - strong management - cheap
Value
Creation
Valuation
Earnings rev/
momentum
Theme
• Strong, commercial and hands on management
• EV/Sales: 0.7
• EV/EBIT: 9
• PE: 13
• Loss of large customer in 2013
• Growth rate will pick up in 2014
• Internet of things
• Increased IPTV-viewing
24
Reduce
Buy Buy
Reduce
Buy
• Extremely good at sourcing and managing retail channels
WiFi extender
Nighthawk WiFi router

Agenda
25
1 DNB Asset Management
3 Investment Process
2 Portfolio Management Team & Track Record
4 Risk Management
5 Fund Facts
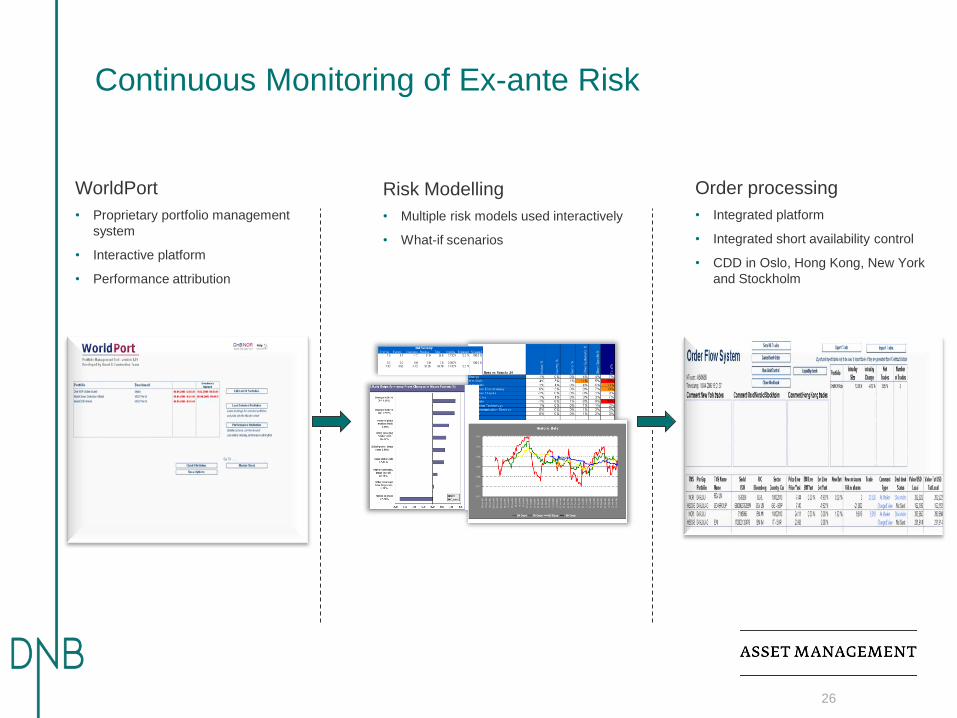
WorldPort
• Proprietary portfolio management
system
• Interactive platform
• Performance attribution
Risk Modelling
• Multiple risk models used interactively
• What-if scenarios
Order processing
• Integrated platform
• Integrated short availability control
• CDD in Oslo, Hong Kong, New York
and Stockholm
Continuous Monitoring of Ex-ante Risk
26

DNB Central Dealing Desk
27
CDD - Execution of equity and derivatives according to SDP
- Operationalization and execution of DNB Life equity derivatives allocations
Risk Models & Analytics - RM & Analytics in accordance to current mandate
Equity Index Products - Construction and execution of Equity Index Products globally
Disclosure - Disclosure of long and short positions for DAM as well as for DNB ASA
Global trading team for equities and related derivative instruments with trading
desks located in Stockholm, Oslo, and Hong-Kong able to serve, execute and
monitor orders around the clock.
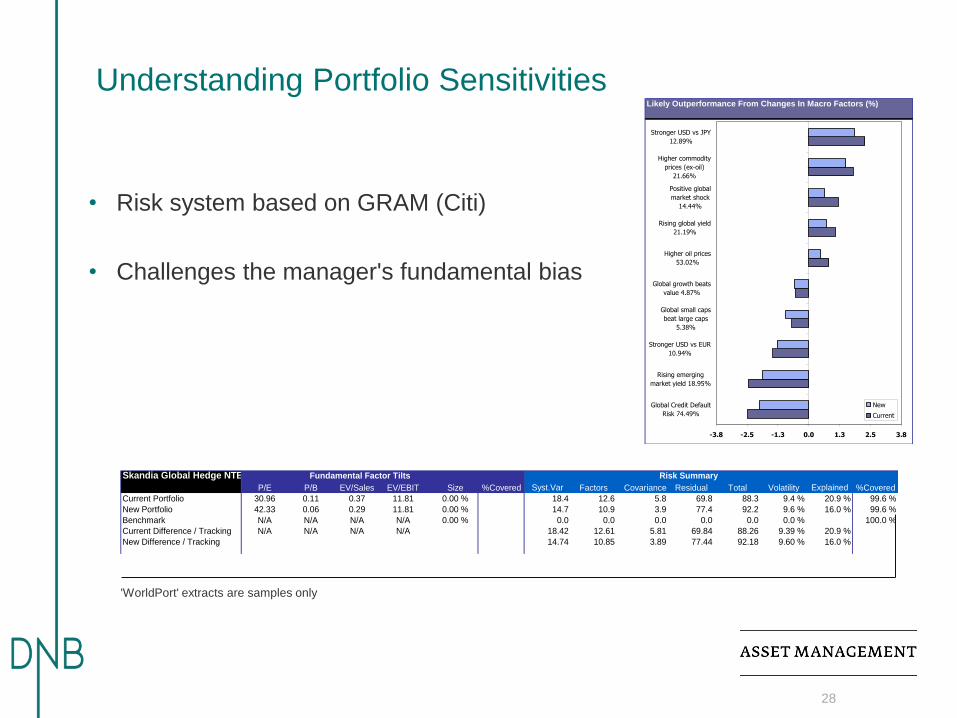
Understanding Portfolio Sensitivities
• Risk system based on GRAM (Citi)
• Challenges the manager's fundamental bias
Likely Outperformance From Changes In Macro Factors (%)
-3.8 -2.5 -1.3 0.0 1.3 2.5 3.8
Global Credit Default
Risk 74.49%
Rising emerging
market yield 18.95%
Stronger USD vs EUR
10.94%
Global small caps
beat large caps
5.38%
Global growth beats
value 4.87%
Higher oil prices
53.02%
Rising global yield
21.19%
Positive global
market shock
14.44%
Higher commodity
prices (ex-oil)
21.66%
Stronger USD vs JPY
12.89%
New
Current
Skandia Global Hedge NTECH
P/E P/B EV/Sales EV/EBIT Size %Covered Syst.Var Factors Covariance Residual Total Volatility Explained %Covered
Current Portfolio 30.96 0.11 0.37 11.81 0.00 % 18.4 12.6 5.8 69.8 88.3 9.4 % 20.9 % 99.6 %
New Portfolio 42.33 0.06 0.29 11.81 0.00 % 14.7 10.9 3.9 77.4 92.2 9.6 % 16.0 % 99.6 %
Benchmark N/A N/A N/A N/A 0.00 % 0.0 0.0 0.0 0.0 0.0 0.0 % 100.0 %
Current Difference / Tracking N/A N/A N/A N/A 18.42 12.61 5.81 69.84 88.26 9.39 % 20.9 %
New Difference / Tracking 14.74 10.85 3.89 77.44 92.18 9.60 % 16.0 %
Sector Neutral
Current Portfolio N/A N/A N/A N/A 0.00 %
New Portfolio N/A N/A N/A N/A 0.00 %
Benchmark N/A N/A N/A N/A 0.00 %
Current Difference / Tracking N/A N/A N/A N/A
New Difference / Tracking
Risk SummaryFundamental Factor Tilts
'WorldPort' extracts are samples only
28

Agenda
29
1 DNB Asset Management
3 Investment Process
2 Portfolio Management Team & Track Record
4 Risk Management
5 Fund Facts
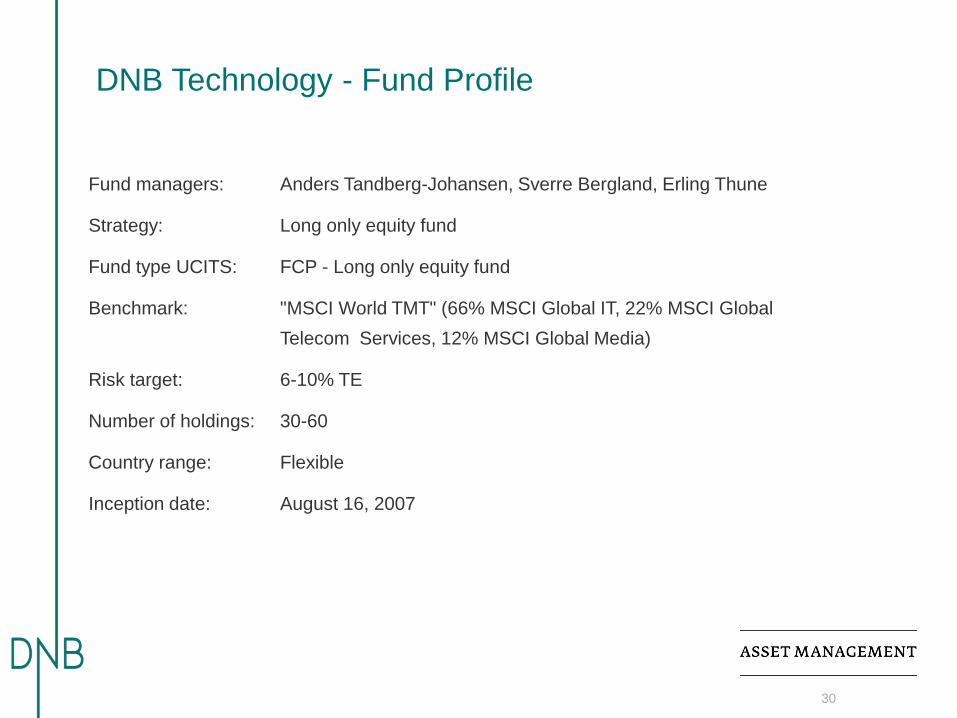
DNB Technology - Fund Profile
Fund managers: Anders Tandberg-Johansen, Sverre Bergland, Erling Thune
Strategy: Long only equity fund
Fund type UCITS: FCP - Long only equity fund
Benchmark: "MSCI World TMT" (66% MSCI Global IT, 22% MSCI Global
Telecom Services, 12% MSCI Global Media)
Risk target: 6-10% TE
Number of holdings: 30-60
Country range: Flexible
Inception date: August 16, 2007
30

31
DNB Technology - Terms
ISIN: LU0302296495
Liquidity: Daily
Management fee: 1.5% p.a.
Performance fee: 20% (based on accumulated relative performance, no reset)
Front end fee: Up to 5%
Currency: EUR
Minimum investment: EUR 1000
Domiciled: Luxembourg

32
Our ambition is clear cut
Identify winners and losers in changing landscape
Create consistent long-term returns for investors
Always keep tight risk management

This presentation has been prepared in accordance with DNB Asset Management AS' General Business Terms. The presentation was prepared for internal use as information
for our clients and is not intended for public use or distribution. The information contained herein may not be reproduced without DNB Asset Management AS’ prior consent.
This presentation was prepared on the basis of publicly available information. DNB Asset Management AS does not warrant that the information in the presentation is exact,
correct or complete. The opinions expressed herein reflect the views of DNB Asset Management AS at the time. DNB Asset Management AS reserves the right to change its
opinion without notice. Any written material distributed must be seen in the context of the oral presentation. DNB Asset Management AS will not accept responsibility for direct
or indirect losses incurred as a result of the interpretation and/or use of information in this presentation.
This presentation is not an offer or recommendation to purchase or sell financial instruments. Investments in financial instruments are associated with risk, including the
possibility that all or part of invested funds may be lost. Historical returns are no guarantee of future returns.
DNB Bank ASA and/or other entities in the DNB Group or employees and/or representatives of the DNB Group may trade in or hold positions in the presented or related
financial instruments and may give financial advice or provide banking services linked to such financial instruments. Rules regarding confidentiality and other internal rules limit
the exchange of information between different units and group companies in the DNB group. The employees in DNB who prepared this presentation may thus be prevented
from using, or be unaware of, information held in other units/companies in the DNB Group that may be relevant to this presentation.
DNB Asset Management AS is an entity within the DNB Group registered in the Registry of Business Enterprises under Enterprise Number 880 109 162.
Oslo
DNB Asset Management AS
Dronning Eufemias Gate 30
PO Box 1600 Sentrum
N-0021 Oslo, Norway
Stockholm
DNB Asset Management AB
Kungsgatan 18
SE-105 88 Stockholm, Sweden
Hong Kong
DNB Asset Management (Asia) Ltd.
99 Queen's Road Central
3305-3306, The Center, Hong Kong
Bergen
DNB Asset Management AS
Folke Bernadottesvei 40
P.O. Box 7515
N-5020 Bergen, Norway
Luxembourg
DNB Asset Management S.A.
13, rue Goethe
L-1637 Luxembourg
Chennai
DNB Investment Advisory Services (India) Private Ltd.
No.2 Leith Castle Center Street
Santhome High Road
600 028 Chennai, India
33
Disclaimer

Regional and sector allocation
69% 7%
22%
Regional Allocation
Americas
APAC (ex JP)
Europe
-20%
-10%
0%
10%
20%
30%
40%
50%
60%
Americas Japan APAC (ex JP) Europe
Net Overweight Underweight
Note: As of . Overweight and underweight is with reference to the assigned benchmark. May 13, 2014
36%
44%
12%
Sector Allocation
Hardware
Software & Services
Media
Semiconductors
Telecom
Retailing
Consumer Durables
-20%
-10%
0%
10%
20%
30%
40%
50%
Net Fund Benchmark

Global internet penetration still small
35 Source: ITU (International Telecommunication Union)
0
1,000
2,000
3,000
4,000
5,000
6,000
7,000
8,000
2005 2006 2007 2008 2009 2010 2011 2012 2013
Global Population
Internet Population
0
200
400
600
800
1,000
1,200
1,400
1,600
1,800
2,000
2005 2006 2007 2008 2009 2010 2011 2012 2013
Developed Developing
Only 40% of the world population is online The growth comes from smartphones in
emerging markets Million users Million users

Well positioned within all mega trends
36
YouTube Google Maps Google Chrome/OS
Google mobile search Android Google TV

37
Self driving cars Google glasses
«Connected home» Robotics
New Growth Opportunities


![[HUBDAY] Gameloft - La gamification, un pari gagant ?](https://img.dokumen.tips/doc/110x75/55c36367bb61eb7e498b4789/hubday-gameloft-la-gamification-un-pari-gagant-.jpg)


