Embed Size (px)
Citation preview
RESEARCH Open Access
DNA methylation patterns associate with geneticand gene expression variation in HapMap cell linesJordana T Bell1,3*, Athma A Pai1, Joseph K Pickrell1, Daniel J Gaffney1,2, Roger Pique-Regi1, Jacob F Degner1,Yoav Gilad1*, Jonathan K Pritchard1,2*
Abstract
Background: DNA methylation is an essential epigenetic mechanism involved in gene regulation and disease, butlittle is known about the mechanisms underlying inter-individual variation in methylation profiles. Here wemeasured methylation levels at 22,290 CpG dinucleotides in lymphoblastoid cell lines from 77 HapMap Yorubaindividuals, for which genome-wide gene expression and genotype data were also available.
Results: Association analyses of methylation levels with more than three million common single nucleotidepolymorphisms (SNPs) identified 180 CpG-sites in 173 genes that were associated with nearby SNPs (putatively incis, usually within 5 kb) at a false discovery rate of 10%. The most intriguing trans signal was obtained for SNPrs10876043 in the disco-interacting protein 2 homolog B gene (DIP2B, previously postulated to play a role in DNAmethylation), that had a genome-wide significant association with the first principal component of patterns ofmethylation; however, we found only modest signal of trans-acting associations overall. As expected, we foundsignificant negative correlations between promoter methylation and gene expression levels measured by RNA-sequencing across genes. Finally, there was a significant overlap of SNPs that were associated with bothmethylation and gene expression levels.
Conclusions: Our results demonstrate a strong genetic component to inter-individual variation in DNAmethylation profiles. Furthermore, there was an enrichment of SNPs that affect both methylation and geneexpression, providing evidence for shared mechanisms in a fraction of genes.
BackgroundDNA methylation plays an important regulatory role ineukaryotic genomes. Alterations in methylation canaffect transcription and phenotypic variation [1], but thesource of variation in DNA methylation itself remainspoorly understood. Substantial evidence of inter-individual variation in DNA methylation exists with age[2,3], tissue [4,5], and species [6]. In mammals, DNAmethylation is mediated by DNA methyltransferases(DNMTs) that are responsible for de novo methylationand maintenance of methylation patterns during replica-tion. Genes involved in the synthesis of methylation andin DNA demethylation can also affect methylation varia-tion. For example, mutations in DNMT3L [7] and
MTHFR [8] associate with global DNA hypo-methyla-tion in human blood. These changes occur at a genome-wide level and are distinct from genetic variants thatimpact DNA methylation variability in targeted genomicregions, for example, genetic polymorphisms associatedwith differential methylation in the H19/IGF2 locus [9].Recent evidence suggests a dependence of DNA
methylation on local sequence content [10-12]. A stronggenetic effect is supported by studies of methylation pat-terns in families [13] and in twins [14], but stochasticand environmental factors are also likely to play animportant role [2,14]. Recent work indicates that geneticvariation may have a substantial impact on local methy-lation patterns [5,15-18], but neither the extent to whichmethylation is affected by genetic variation, nor themechanisms are yet clear. Furthermore, the degree towhich variation in DNA methylation underlies variationin gene expression across individuals remains unknown.
* Correspondence: [email protected]; [email protected];[email protected] of Human Genetics, The University of Chicago, 920 E. 58th St,Chicago, IL 60637, USAFull list of author information is available at the end of the article
Bell et al. Genome Biology 2011, 12:R10http://genomebiology.com/2011/12/1/R10
© 2011 Bell et al; licensee BioMed Central Ltd. This is an open access article distributed under the terms of the Creative CommonsAttribution License (http://creativecommons.org/licenses/by/2.0), which permits unrestricted use, distribution, and reproduction inany medium, provided the original work is properly cited.
DNA methylation has long been considered a key reg-ulator of gene expression. The genetic basis of geneexpression has been investigated across tissues [19] andpopulations [20]. Both lines of evidence suggest geneticvariants associated with gene expression variation arelocated predominantly near transcription start sites.However, not much is known about the precise mechan-isms by which genetic variants modify gene-expression.Combining genetic, epigenetic, and gene expression datacan inform the underlying relationship between theseprocesses, but such studies are rare on a genome-widescale. Two recent studies have examined the linkbetween DNA methylation and expression in humanbrain samples [5,18]. Both studies identified substantialnumbers of quantitative trait loci underlying each typeof phenotype, but few examples of individual loci drivingvariation in both methylation and expression.To better understand the role of genetic variation in
controlling DNA methylation variation, and its resultingeffects on gene expression variation, we studied DNApromoter methylation across the genome in 77 humanlymphoblastoid cell lines (LCLs) from the HapMap col-lection. These cell lines represent a unique resource asthey have been densely genotyped by the HapMap Pro-ject [21], and are now being genome-sequenced by the1,000 Genomes Project. In addition, these cell lines havebeen studied by numerous groups studying variation ingene expression using microarrays [20,22] and RNAsequencing [23,24], as well as smaller studies of varia-tion in chromatin accessibility and PolII binding [25,26].Finally, one of the HapMap cell lines is now beingintensely studied by the ENCODE Project [27]. Thisconvergence of diverse types of genome-wide data fromthe same cell lines should ultimately enable a clearerunderstanding of the mechanisms by which genetic var-iation impacts gene regulation.
ResultsCharacteristics of DNA promoter methylation patternsTo study inter-individual variation in methylation profileswe measured methylation levels across the genome in 77lymphoblastoid cell lines (LCLs) derived from unrelatedindividuals from the HapMap Yoruba (YRI) collection.For these samples we also had publicly available geno-types [21], as well as estimates of gene expression levelsfrom RNA-sequencing in 69 of the 77 samples [24].Methylation profiling was performed in duplicate usingthe Illumina HumanMethylation27 DNA Analysis Bead-Chip assay, which is based on genotyping of bisulfite-converted genomic DNA at individual CpG-sites toprovide a quantitative measure of DNA methylation. TheIllumina array includes probes that target 27,578 CpG-sites. However, we limited analyses to probes thatmapped uniquely to the genome and did not contain
known sequence variation, leaving us with a data set of22,290 CpG-sites in the promoter regions of 13,236genes (see Methods). Following hybridization, methyla-tion levels were estimated as the ratio of intensity signalobtained from the methylated allele over the sum ofmethylated and unmethylated allele intensity signals.Methylation levels were quantile-normalized [28] acrosstwo replicates. We tested for correlations with potentialconfounding variables that could affect methylation levelsin LCLs [29], such as LCL cell growth rate, copy numbersof Epstein-Barr virus, and other measures of biologicalvariation (see Additional file 1) that were available for 60of the individuals in our study [30]; these did not signifi-cantly explain variation in the methylation levels in oursample (Figure S1 in Additional file 1). However, weobserved an influence of HapMap Phase (samples fromPhase 1/2 vs 3) on the distribution of the first principalcomponent loadings in the autosomal data, suggestingthat the first methylation principal component may inpart capture technical variation potentially related toLCL culture. In the downstream association mappinganalyses, we applied a correction using principal compo-nent analysis regressing the first three principal compo-nents to account for unmeasured confounders andincrease power to detect quantitative trait loci.
Global patterns of methylationDistinct patterns of methylation were observed for CpG-sites located on the autosomes, X-chromosome, and inthe vicinity of imprinted genes (Figure 1a). The majority(71.4%) of autosomal CpG-sites were primarilyunmethylated (observed fraction of methylation <0.3),15.6% were hemi-methylated (fraction of methylationwas between 0.3 and 0.7), and 13% were methylated. Asexpected, these patterns were consistent with previouslyobserved lower levels of methylation near promotersrelative to genome-wide levels [4,31]. We did not findevidence for sex-specific autosomal methylation pat-terns, consistent with a previous report [4]. In contrast,CpG-sites on the X-chromosome exhibited highly signif-icant sex-specific differences (Figure S2) with hemi-methylated patterns in females that were consistent withX-chromosome inactivation. A similar hemi-methylationpeak was observed for CpG-sites located near the tran-scription start sites (TSSs) of known autosomalimprinted genes in the entire sample.We observed a previously reported [4] drop in methyla-
tion levels for CpG-sites located within 1 kb of TSSs(Figure 1b). Promoter methylation levels have beenreported to vary with respect to CpG islands [32]. Wefound that although distance to the CpG island (CGI)border [33] (including CpG shores [34]) did not signifi-cantly affect methylation levels, CpG-sites located inCGIs were under-methylated and less variable (Wilcoxon
Bell et al. Genome Biology 2011, 12:R10http://genomebiology.com/2011/12/1/R10
Page 2 of 13
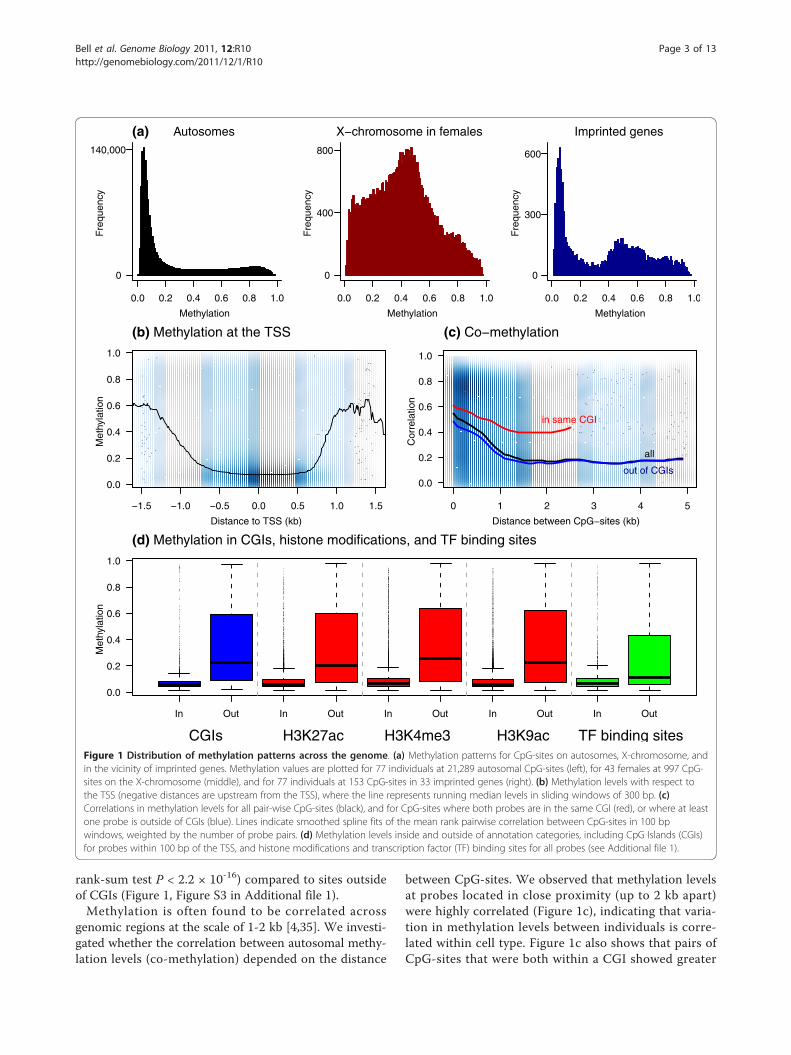
rank-sum test P < 2.2 × 10⁻¹⁶) compared to sites outsideof CGIs (Figure 1, Figure S3 in Additional file 1).Methylation is often found to be correlated across
genomic regions at the scale of 1-2 kb [4,35]. We investi-gated whether the correlation between autosomal methy-lation levels (co-methylation) depended on the distance
between CpG-sites. We observed that methylation levelsat probes located in close proximity (up to 2 kb apart)were highly correlated (Figure 1c), indicating that varia-tion in methylation levels between individuals is corre-lated within cell type. Figure 1c also shows that pairs ofCpG-sites that were both within a CGI showed greater
Autosomes
Methylation
Fre
quen
cy
0.0 0.2 0.4 0.6 0.8 1.0
0
140,000
(a) X−chromosome in females
MethylationF
requ
ency
0.0 0.2 0.4 0.6 0.8 1.0
0
400
800
Imprinted genes
Methylation
Fre
quen
cy
0.0 0.2 0.4 0.6 0.8 1.0
0
300
600
−1.5 −1.0 −0.5 0.0 0.5 1.0 1.5
0.0
0.2
0.4
0.6
0.8
1.0
Distance to TSS (kb)
Met
hyla
tion
(b) Methylation at the TSS
0 1 2 3 4 5
0.0
0.2
0.4
0.6
0.8
1.0
Distance between CpG−sites (kb)
Cor
rela
tion
all
in same CGI
out of CGIs
(c) Co−methylation
In Out In Out In Out In Out In Out
0.0
0.2
0.4
0.6
0.8
1.0
Met
hyla
tion
(d) Methylation in CGIs, histone modifications, and TF binding sites
CGIs H3K27ac H3K4me3 H3K9ac TF binding sitesFigure 1 Distribution of methylation patterns across the genome. (a) Methylation patterns for CpG-sites on autosomes, X-chromosome, andin the vicinity of imprinted genes. Methylation values are plotted for 77 individuals at 21,289 autosomal CpG-sites (left), for 43 females at 997 CpG-sites on the X-chromosome (middle), and for 77 individuals at 153 CpG-sites in 33 imprinted genes (right). (b) Methylation levels with respect tothe TSS (negative distances are upstream from the TSS), where the line represents running median levels in sliding windows of 300 bp. (c)Correlations in methylation levels for all pair-wise CpG-sites (black), and for CpG-sites where both probes are in the same CGI (red), or where at leastone probe is outside of CGIs (blue). Lines indicate smoothed spline fits of the mean rank pairwise correlation between CpG-sites in 100 bpwindows, weighted by the number of probe pairs. (d) Methylation levels inside and outside of annotation categories, including CpG Islands (CGIs)for probes within 100 bp of the TSS, and histone modifications and transcription factor (TF) binding sites for all probes (see Additional file 1).
Bell et al. Genome Biology 2011, 12:R10http://genomebiology.com/2011/12/1/R10
Page 3 of 13
evidence for co-methylation than pairs of CpG sites forwhich at least one was outside the CGI, controlling fordistance, implying differential regulation of DNA methy-lation for CpGs inside and outside of CGIs [32].
DNA methylation correlates with transcription andhistone modificationsMethylation has long been implicated in the regulationof gene expression. To examine the role of methylation
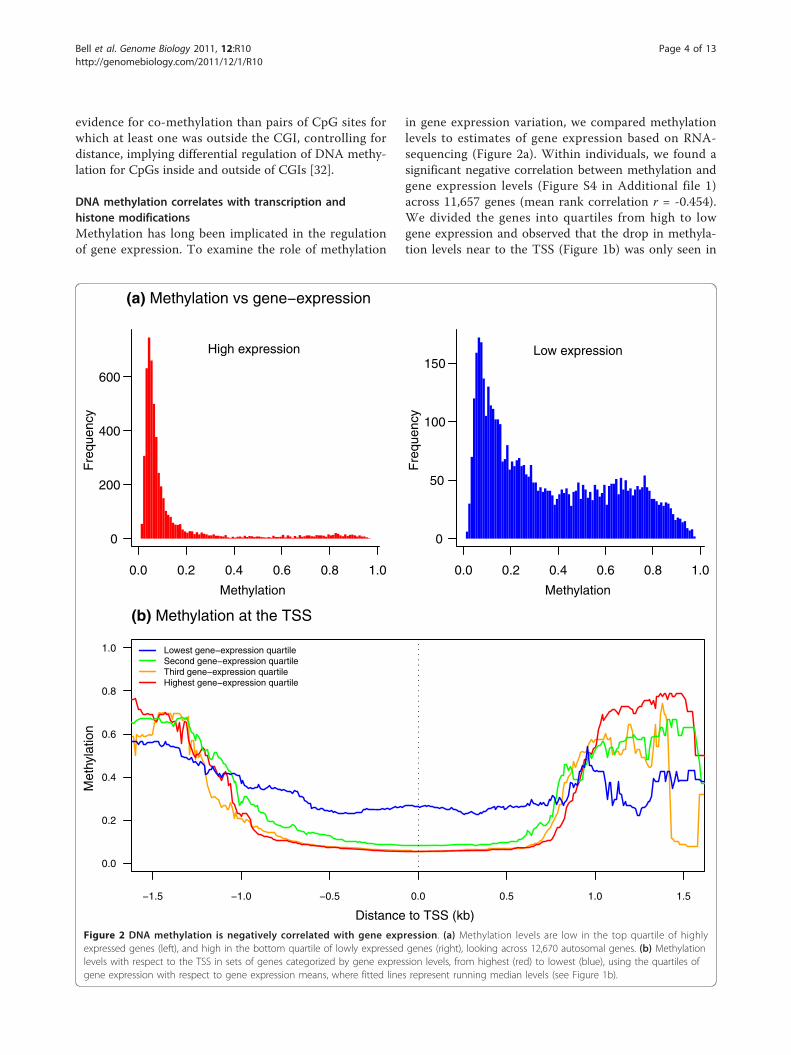
in gene expression variation, we compared methylationlevels to estimates of gene expression based on RNA-sequencing (Figure 2a). Within individuals, we found asignificant negative correlation between methylation andgene expression levels (Figure S4 in Additional file 1)across 11,657 genes (mean rank correlation r = -0.454).We divided the genes into quartiles from high to lowgene expression and observed that the drop in methyla-tion levels near to the TSS (Figure 1b) was only seen in
Methylation
Fre
quen
cy
High expression
0.0 0.2 0.4 0.6 0.8 1.0
0
200
400
600
(a) Methylation vs gene−expression
Methylation
Fre
quen
cy
Low expression
0.0 0.2 0.4 0.6 0.8 1.0
0
50
100
150
−1.5 −1.0 −0.5 0.0 0.5 1.0 1.5
0.0
0.2
0.4
0.6
0.8
1.0
Distance to TSS (kb)
Met
hyla
tion
Lowest gene−expression quartileSecond gene−expression quartileThird gene−expression quartileHighest gene−expression quartile
(b) Methylation at the TSS
Figure 2 DNA methylation is negatively correlated with gene expression. (a) Methylation levels are low in the top quartile of highlyexpressed genes (left), and high in the bottom quartile of lowly expressed genes (right), looking across 12,670 autosomal genes. (b) Methylationlevels with respect to the TSS in sets of genes categorized by gene expression levels, from highest (red) to lowest (blue), using the quartiles ofgene expression with respect to gene expression means, where fitted lines represent running median levels (see Figure 1b).
Bell et al. Genome Biology 2011, 12:R10http://genomebiology.com/2011/12/1/R10
Page 4 of 13
highly expressed genes (Figure 2b). We also askedwhether variation in methylation levels across indivi-duals correlates with variation in gene expression levels.Comparisons at the gene level across 69 individualsindicated a modest but significant excess of negativelycorrelated genes (permutation P < 0.0001).DNA methylation is thought to interact with histone
modifications during the regulation of gene-expression[36,37]. We compared methylation levels in our samplewith histone modification ChIP-seq data from theENCODE project in one of the CEPH HapMap LCLs(GM12878). We found strong negative correlationsbetween DNA methylation levels and the presence ofhistone marks that target active genes (Figure 1d;Figures S3 and S5 in Additional file 1). For example,DNA methylation was low in H3K27ac peaks, which areindicative of enhancers [38], have previously been posi-tively correlated with transcription levels [39] and nega-tively correlated with DNA methylation levels [31].Similarly, the transcription marks H3K4me3 andH3K9ac were both negatively correlated with DNAmethylation levels. We also observed lower methylationlevels in transcription factor binding sites predicted bythe CENTIPEDE algorithm, using cell-type specific dataincluding DNase1 sequencing reads [40], consistent withthe expectation that the absence of methylation isimportant for transcription factor binding.
Genome-wide association of DNA methylation with SNPgenotypesWe next assessed whether genetic variation contributesto inter-individual variation in DNA methylation levels.We first tested whether any SNPs were associated withoverall patterns of DNA methylation, as measured byprincipal component analysis (see Methods). The mostinteresting signal was obtained for SNP rs10876043,which had a genome-wide significant association withvariation in the first principal component of methylation(P = 4.5 × 10⁻⁹), and which also showed a modest asso-ciation with average genome-wide methylation levels(P = 4.0 × 10⁻⁵) (Table S1 in Additional file 1). This SNPlies within the intron of the gene DIP2B, which containsa DMAP1-binding domain, and has been previously pro-posed to play a role in DNA methylation [41].Associations in transAfter assessing the possibility that SNPs can have genome-wide effects on overall methylation patterns, we next trans-formed the methylation data by regressing out the firstthree principal components (see Methods), as we have pre-viously found that this procedure can greatly reduce noisein the data and improve quantitative trait locus (QTL)mapping [24] (see also [42,43]). At a genome-wide falsediscovery rate (FDR) of 10% (P = 2.1 × 10⁻¹⁰) methylationlevels at 37 CpG-sites showed evidence for association with
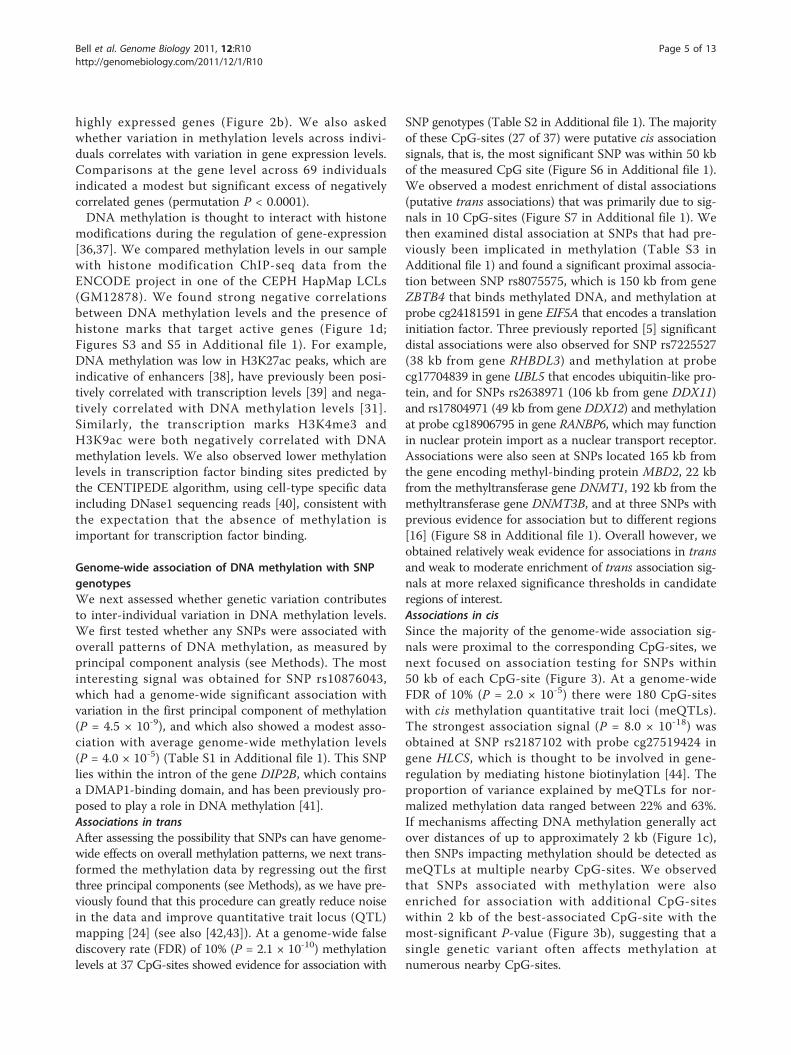
SNP genotypes (Table S2 in Additional file 1). The majorityof these CpG-sites (27 of 37) were putative cis associationsignals, that is, the most significant SNP was within 50 kbof the measured CpG site (Figure S6 in Additional file 1).We observed a modest enrichment of distal associations(putative trans associations) that was primarily due to sig-nals in 10 CpG-sites (Figure S7 in Additional file 1). Wethen examined distal association at SNPs that had pre-viously been implicated in methylation (Table S3 inAdditional file 1) and found a significant proximal associa-tion between SNP rs8075575, which is 150 kb from geneZBTB4 that binds methylated DNA, and methylation atprobe cg24181591 in gene EIF5A that encodes a translationinitiation factor. Three previously reported [5] significantdistal associations were also observed for SNP rs7225527(38 kb from gene RHBDL3) and methylation at probecg17704839 in gene UBL5 that encodes ubiquitin-like pro-tein, and for SNPs rs2638971 (106 kb from gene DDX11)and rs17804971 (49 kb from gene DDX12) and methylationat probe cg18906795 in gene RANBP6, which may functionin nuclear protein import as a nuclear transport receptor.Associations were also seen at SNPs located 165 kb fromthe gene encoding methyl-binding protein MBD2, 22 kbfrom the methyltransferase gene DNMT1, 192 kb from themethyltransferase gene DNMT3B, and at three SNPs withprevious evidence for association but to different regions[16] (Figure S8 in Additional file 1). Overall however, weobtained relatively weak evidence for associations in transand weak to moderate enrichment of trans association sig-nals at more relaxed significance thresholds in candidateregions of interest.Associations in cisSince the majority of the genome-wide association sig-nals were proximal to the corresponding CpG-sites, wenext focused on association testing for SNPs within50 kb of each CpG-site (Figure 3). At a genome-wideFDR of 10% (P = 2.0 × 10⁻⁵) there were 180 CpG-siteswith cis methylation quantitative trait loci (meQTLs).The strongest association signal (P = 8.0 × 10⁻¹⁸) wasobtained at SNP rs2187102 with probe cg27519424 ingene HLCS, which is thought to be involved in gene-regulation by mediating histone biotinylation [44]. Theproportion of variance explained by meQTLs for nor-malized methylation data ranged between 22% and 63%.If mechanisms affecting DNA methylation generally actover distances of up to approximately 2 kb (Figure 1c),then SNPs impacting methylation should be detected asmeQTLs at multiple nearby CpG-sites. We observedthat SNPs associated with methylation were alsoenriched for association with additional CpG-siteswithin 2 kb of the best-associated CpG-site with themost-significant P-value (Figure 3b), suggesting that asingle genetic variant often affects methylation atnumerous nearby CpG-sites.
Bell et al. Genome Biology 2011, 12:R10http://genomebiology.com/2011/12/1/R10
Page 5 of 13
Genetic variation has previously been associated withmethylation at specific imprinted regions [1]. The 180CpG-sites with meQTLs in our data were nearest to theTSSs of 173 genes, of which two-MEST and CPA4, wereknown to be imprinted genes. Previous observations
suggested that eQTL and imprinting effects can be sex-specific [45], raising the possibility that some of themeQTLs may act in a sex-dependent manner. However,we did not find compelling genome-wide significant sex-specific cis meQTL effects (see Additional file 1). Of the180 associations of CpG-sites with proximal meQTLs, 27were previously reported in human brain samples [5].Little is known about the biological mechanisms that
may underlie meQTL effects. To this end we applied aBayesian hierarchical model [22] to test for enrichmentof meQTLs in transcription factor binding sites, in his-tone modification categories, and in the vicinity of theassociated probes. We found that SNPs located nearestto the probe, and specifically in the 5 kb immediatelysurrounding the probe, were significantly enriched formeQTLs (Figure 3c). Transcription factor binding sites,including CTCF-binding sites, showed a modest butnon-significant enrichment for meQTLs (Figure S9 inAdditional file 1).
Methylation QTLs are enriched for expression QTLsFinally, we examined the overlap in regulatory variationthat affects both methylation and gene expression levelsusing RNA-sequencing data [24]. We hypothesized thatsince DNA methylation can regulate gene expression,then variants that affect methylation should often haveconsequent effects on gene expression. The first waythat we looked at this was to take the set of 180 SNPsthat are meQTLs at FDR <10% (taking only the mostsignificant SNP for each meQTL). We then tested eachof these SNPs for association with expression levels ofnearby genes (Figure 4a, red points). There is a clearenrichment of association with expression levels com-pared to the null hypothesis (black line) and comparedto sets of control SNPs that are matched in terms ofallele frequency and distance-to-probe distributions(black dots).One example of a SNP, rs8133082, that is both a
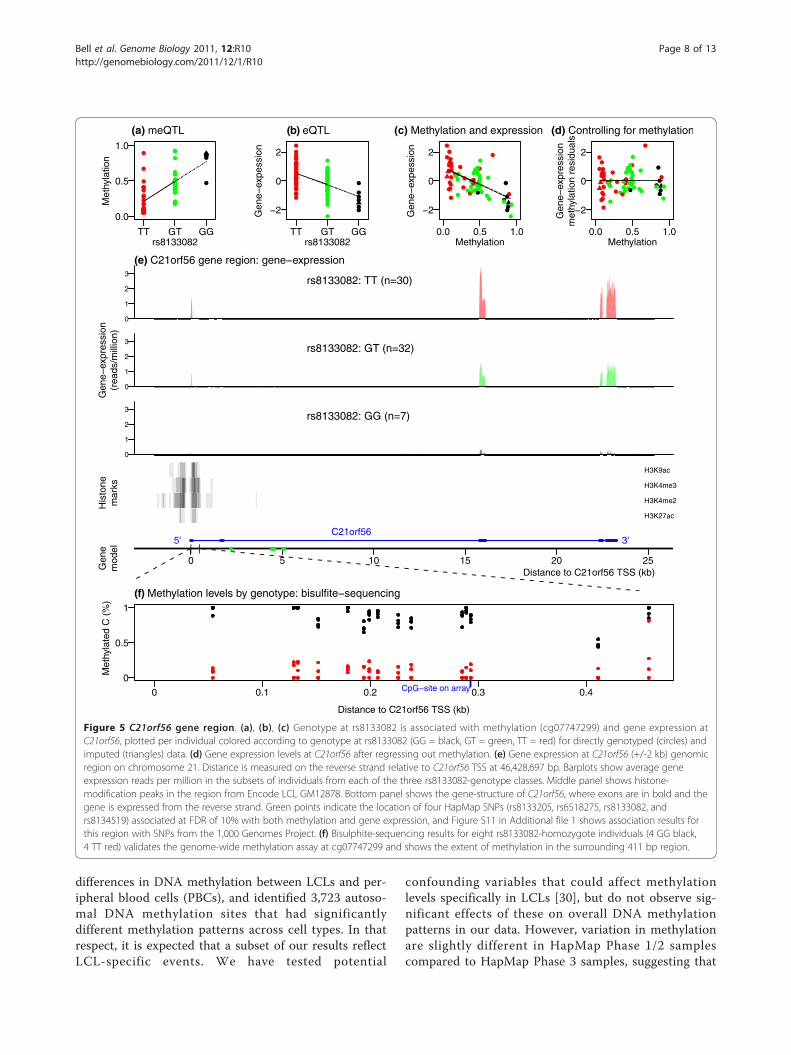
meQTL and eQTL for the gene C21orf56 is illustratedin Figure 5. When we regress out methylation, this com-pletely removes the association of this SNP with geneexpression (Figure 5a, b, c, d). We validated the methy-lation assay findings at C21orf56 by bisulfite sequencingthe methylation probe region in eight samples in ourstudy, four from each homozygote genotype class forthe SNP (Figure 5f). The two methylation probes atC21orf56 both had cis meQTLs and overlapped thelikely promoter region as indicated by histone modifica-tion data (Figure 5e), suggesting that genetic variationmay affect the chromatin structure in this region.C21orf56 appears to modulate the response of humanLCLs to alkylating agents, and may act as a genomicpredictor for inter-individual differences in response toDNA damaging agents [46].
0 1 2 3 4 5 6
0
5
10
15
−−log10 (Expected P−value)
−−lo
g 10
(Obs
erve
d P
−va
lue)
(a) cis−meQTL QQ plot
−log10 (Expected P−value)
−lo
g10
(Obs
erve
d P
−va
lue)
0
5
10
15
0 1 2
(b) meQTLs affect multiple CpGs
0−2kb2−10k10−50kb
Pro
babi
lity
that
SN
P is
a m
eQT
L
5' 50kb CpG 3' 50kb
0.0000
0.0005
0.0010
0.0015
(c) Locations of cis−meQTLs
Figure 3 Cis methylation QTLs. (a) Quantile-quantile (QQ) plotdescribing the enrichment of association signal in cis compared tothe permuted data (90% confidence band shaded). (b) The cis-meQTL SNPs were enriched for association signal at additional CpG-sites near to the CpG-site for which they are meQTLs. The 180 best-associated SNPs were tested for association to probes that fellwithin 2 kb (red), within 2 kb to 10 kb (purple), and within 10 kb to50 kb (blue) of the original best-associated CpG-site. The majority(96%) of probes within 2 kb (red) were in the same CGI as the best-associated probe. (c) Spatial distribution of cis-meQTLs with respectto the CpG-site as estimated by the hierarchical model.
Bell et al. Genome Biology 2011, 12:R10http://genomebiology.com/2011/12/1/R10
Page 6 of 13
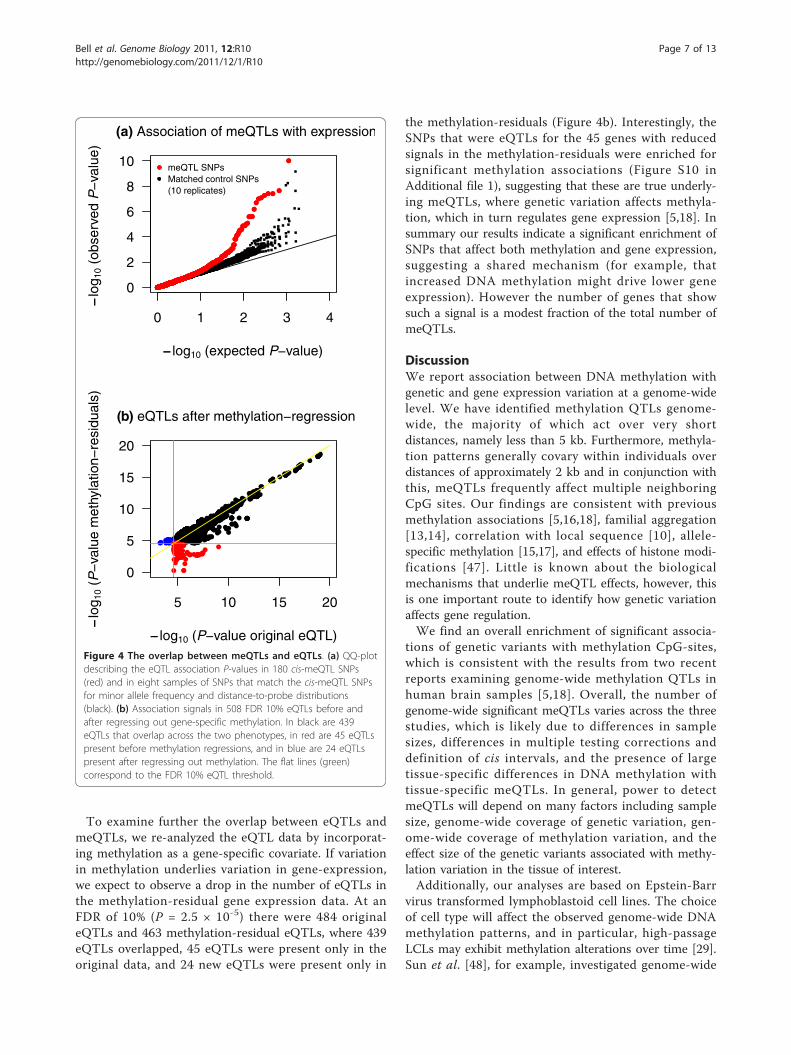
To examine further the overlap between eQTLs andmeQTLs, we re-analyzed the eQTL data by incorporat-ing methylation as a gene-specific covariate. If variationin methylation underlies variation in gene-expression,we expect to observe a drop in the number of eQTLs inthe methylation-residual gene expression data. At anFDR of 10% (P = 2.5 × 10⁻⁵) there were 484 originaleQTLs and 463 methylation-residual eQTLs, where 439eQTLs overlapped, 45 eQTLs were present only in theoriginal data, and 24 new eQTLs were present only in
the methylation-residuals (Figure 4b). Interestingly, theSNPs that were eQTLs for the 45 genes with reducedsignals in the methylation-residuals were enriched forsignificant methylation associations (Figure S10 inAdditional file 1), suggesting that these are true underly-ing meQTLs, where genetic variation affects methyla-tion, which in turn regulates gene expression [5,18]. Insummary our results indicate a significant enrichment ofSNPs that affect both methylation and gene expression,suggesting a shared mechanism (for example, thatincreased DNA methylation might drive lower geneexpression). However the number of genes that showsuch a signal is a modest fraction of the total number ofmeQTLs.
DiscussionWe report association between DNA methylation withgenetic and gene expression variation at a genome-widelevel. We have identified methylation QTLs genome-wide, the majority of which act over very shortdistances, namely less than 5 kb. Furthermore, methyla-tion patterns generally covary within individuals overdistances of approximately 2 kb and in conjunction withthis, meQTLs frequently affect multiple neighboringCpG sites. Our findings are consistent with previousmethylation associations [5,16,18], familial aggregation[13,14], correlation with local sequence [10], allele-specific methylation [15,17], and effects of histone modi-fications [47]. Little is known about the biologicalmechanisms that underlie meQTL effects, however, thisis one important route to identify how genetic variationaffects gene regulation.We find an overall enrichment of significant associa-
tions of genetic variants with methylation CpG-sites,which is consistent with the results from two recentreports examining genome-wide methylation QTLs inhuman brain samples [5,18]. Overall, the number ofgenome-wide significant meQTLs varies across the threestudies, which is likely due to differences in samplesizes, differences in multiple testing corrections anddefinition of cis intervals, and the presence of largetissue-specific differences in DNA methylation withtissue-specific meQTLs. In general, power to detectmeQTLs will depend on many factors including samplesize, genome-wide coverage of genetic variation, gen-ome-wide coverage of methylation variation, and theeffect size of the genetic variants associated with methy-lation variation in the tissue of interest.Additionally, our analyses are based on Epstein-Barr
virus transformed lymphoblastoid cell lines. The choiceof cell type will affect the observed genome-wide DNAmethylation patterns, and in particular, high-passageLCLs may exhibit methylation alterations over time [29].Sun et al. [48], for example, investigated genome-wide
0 1 2 3 4
0
2
4
6
8
10
−−log10 (expected P−value)
−−lo
g 10
(obs
erve
d P
−va
lue)
meQTL SNPsMatched control SNPs(10 replicates)
(a) Association of meQTLs with expression
5 10 15 20
0
5
10
15
20
−−log10 (P−value original eQTL)
−−lo
g 10
(P−
valu
e m
ethy
latio
n−re
sidu
als)
(b) eQTLs after methylation−regression
Figure 4 The overlap between meQTLs and eQTLs. (a) QQ-plotdescribing the eQTL association P-values in 180 cis-meQTL SNPs(red) and in eight samples of SNPs that match the cis-meQTL SNPsfor minor allele frequency and distance-to-probe distributions(black). (b) Association signals in 508 FDR 10% eQTLs before andafter regressing out gene-specific methylation. In black are 439eQTLs that overlap across the two phenotypes, in red are 45 eQTLspresent before methylation regressions, and in blue are 24 eQTLspresent after regressing out methylation. The flat lines (green)correspond to the FDR 10% eQTL threshold.
Bell et al. Genome Biology 2011, 12:R10http://genomebiology.com/2011/12/1/R10
Page 7 of 13
differences in DNA methylation between LCLs and per-ipheral blood cells (PBCs), and identified 3,723 autoso-mal DNA methylation sites that had significantlydifferent methylation patterns across cell types. In thatrespect, it is expected that a subset of our results reflectLCL-specific events. We have tested potential
confounding variables that could affect methylationlevels specifically in LCLs [30], but do not observe sig-nificant effects of these on overall DNA methylationpatterns in our data. However, variation in methylationare slightly different in HapMap Phase 1/2 samplescompared to HapMap Phase 3 samples, suggesting that
Met
hyla
tion
TT GT GG
0.0
0.5
1.0
rs8133082
(a) meQTL
Gen
e−ex
pess
ion
TT GT GG
−2
0
2
rs8133082
(b) eQTL
Gen
e−ex
pess
ion
0.0 0.5 1.0
−2
0
2
Methylation
(c) Methylation and expression
0.0 0.5 1.0
−2
0
2
Methylation
Gen
e−ex
pres
sion
met
hyla
tion
resi
dual
s
(d) Controlling for methylation
0
1
2
3rs8133082: TT (n=30)
(e) C21orf56 gene region: gene−expression
0
1
2
3rs8133082: GT (n=32)
Gen
e−ex
pres
sion
(rea
ds/m
illio
n)
0
1
2
3rs8133082: GG (n=7)
H3K27ac
H3K4me2
H3K4me3
H3K9ac
His
tone
mar
ks
C21orf565' 3'
0 5 10 15 20 25
Gen
em
odel | |
Distance to C21orf56 TSS (kb)
Distance to C21orf56 TSS (kb)
Met
hyla
ted
C (
%)
0
0.5
1
0 0.1 0.2 0.3 0.4CpG−site on array
(f) Methylation levels by genotype: bisulfite−sequencing
Figure 5 C21orf56 gene region. (a), (b), (c) Genotype at rs8133082 is associated with methylation (cg07747299) and gene expression atC21orf56, plotted per individual colored according to genotype at rs8133082 (GG = black, GT = green, TT = red) for directly genotyped (circles) andimputed (triangles) data. (d) Gene expression levels at C21orf56 after regressing out methylation. (e) Gene expression at C21orf56 (+/-2 kb) genomicregion on chromosome 21. Distance is measured on the reverse strand relative to C21orf56 TSS at 46,428,697 bp. Barplots show average geneexpression reads per million in the subsets of individuals from each of the three rs8133082-genotype classes. Middle panel shows histone-modification peaks in the region from Encode LCL GM12878. Bottom panel shows the gene-structure of C21orf56, where exons are in bold and thegene is expressed from the reverse strand. Green points indicate the location of four HapMap SNPs (rs8133205, rs6518275, rs8133082, andrs8134519) associated at FDR of 10% with both methylation and gene expression, and Figure S11 in Additional file 1 shows association results forthis region with SNPs from the 1,000 Genomes Project. (f) Bisulphite-sequencing results for eight rs8133082-homozygote individuals (4 GG black,4 TT red) validates the genome-wide methylation assay at cg07747299 and shows the extent of methylation in the surrounding 411 bp region.
Bell et al. Genome Biology 2011, 12:R10http://genomebiology.com/2011/12/1/R10
Page 8 of 13
technical variation related to LCL culture may influenceDNA methylation. We took this into account when per-forming all downstream methylation QTL analyses, andour analyses of the uncorrected methylation patterns areconsistent with the results of previous studies in primarycells [4,31,35].We obtained interesting results from the trans analysis
highlighting several loci with potential long-range effects onDNA methylation. Furthermore, an intriguing associationof a SNP within the intron of DIP2B, which contains aDMAP1-binding domain, with the first principal compo-nent of autosomal methylation patterns suggests novel gen-ome-wide effects on methylation variability. However, wedo not observe a strong effect of polymorphisms in many ofthe candidate methylation regulatory genes on overall pat-terns of methylation or on specific probes. The sample sizeused in the study limits our power to detect trans signals,rendering these analyses more difficult to interpret. In gen-eral, the moderate sample sizes used in all three genome-wide methylation studies to date do not allow for thedetection of subtle effects of genetic variants on methylationvariation and correspondingly the majority of methylationsites assayed across all studies remains unexplained by theGWAS analyses. However, the findings indicate that geneticregulation of methylation is as complex as expression orphenotypic variation.Relating genetic variation to both DNA methylation
and gene expression variation reveals complex patterns.We observe significant overlap between meQTLs andeQTLs for cis regulatory variants. These findings wereobtained when we both focus exclusively on meQTLSNPs (Figure 4a) and when we compare the genome-wide meQTL results for all SNPs classified as eQTLs inthe hierarchical model framework (Figure S9 inAdditional file 1). The observations indicate evidence forshared regulatory mechanisms in a fraction of genes.However, in the re-analyses of the eQTL data takinginto account DNA methylation, in only 10% of eQTLswas the genetic effect of the SNP on expression affectedby controlling for methylation, suggesting that variationin methylation accounts for only a small fraction ofvariation in gene expression levels. There may be severalexplanation for this. First, the coverage of the methyla-tion array provides a relatively low resolution snapshotof the genome-wide DNA methylation patterns. Second,steady state gene expression levels (as measured byRNA-sequencing) are controlled by many other factorsin addition to DNA methylation, such as transcriptionfactor binding, chromatin state including histone marksand nucleosome positioning, and regulation by smallRNAs. Finally, our study sample size provides modestpower, both for eQTL and meQTL mapping. However,compared to previous studies addressing this issue[5,18], we find more convincing evidence for meQTL
and eQTL overlap. For example, Zhang et al. [18] foundten cases where genetic variants associated with bothmethylation and expression, but they only examinedgene expression data for fewer than 100 genes in thesecomparisons in a subset of the sample, while Gibbset al. [5] found that approximately 5% of SNPs in theirstudy were significant as both meQTLs and eQTLs.Also, Gibbs et al. [5] find proportionally similar numberof QTLs for methylation and gene expression, while wefind more eQTLs. A potential explanation for thegreater overlap obtained in our data is that our studyexamines one cell type in comparison to heterogeneouscell-types in human brain tissue samples used in bothother studies [5,18].Characterizing the genetic control of methylation and
its association to the regulation of gene expression is animportant area for research, critical to our understand-ing of how complex living systems are regulated. Ourstudy has the potential to help disease mapping studies,by informing the phenotypic consequences of this varia-tion. Altogether, of the 173 genes with proximalmeQTLs in our study, eighteen genes were previouslyreported to be differentially methylated in cancer, inother diseases, or across multiple tissues (see Table S4in Additional file 1). Furthermore, thirty of the meQTLassociations reported in our study were also observed inhuman brain samples [5]. These findings provide a fra-mework to help the interpretation of GWAS findingsand improve our understanding of the underlyingbiology in multiple complex phenotypes.
ConclusionsOur results, together with recent findings of heritableallele-specific chromatin modification [25,47] and tran-scription factor binding [26,49] demonstrate a stronggenetic component to inter-individual variation in epige-netic and chromatin signature, with likely downstreamtranscriptional and phenotypic consequences. Impor-tantly, we found an enrichment for SNPs that affect bothmethylation and gene expression, implying a single causalmechanism by which one SNP may affect both processes,although such shared QTLs represent a minority of bothmeQTLs and eQTLs. Our data also have implications forthe functional interpretation of mechanisms underlyingassociation of genetic variants with disease.
Materials and methodsMethylation dataDNA was extracted from lymphoblastoid cell lines from77 individuals from the Yoruba (YRI) population fromthe International HapMap project (60 HapMap Phase 1/2 and 17 HapMap Phase 3 individuals). Lymphoblastoidcell lines were previously established by Epstein-BarrVirus transformation of peripheral blood mononuclear
Bell et al. Genome Biology 2011, 12:R10http://genomebiology.com/2011/12/1/R10
Page 9 of 13
cells using phytohemagluttinin. We obtained the trans-formed cell lines from the Coriell Cell Repositories.Methylation data were obtained using the IlluminaHumanMethylation27 DNA Analysis BeadChip assay.Methylation estimates were assayed using two technicalreplicates per individual and methylation levels were quan-tile normalized across replicates [28]. At each CpG-site themethylation level is presented as b, which is the fraction ofsignal obtained from the methylated beads over the sumof methylated and unmethylated bead signals. We consid-ered different approaches to normalizing values acrossreplicates, as well as using the log of the ratio of methy-lated to unmethylated signal instead of b, and found theresults robust to normalization procedure, measure ofmethylation, and across technical replicates (see Addi-tional file 1). The methylation data are publicly available[50] and have been submitted to the NCBI Gene Expres-sion Omnibus [51] under accession no. [GSE26133].We mapped the 27,578 Illumina probes to the human
genome sequence (hg18) using BLAT [52] and MAQ [53].We selected 26,690 probes that unambiguously mapped tosingle locations in the human genome at a sequence iden-tity of 100%, discarding probes that mapped to multiplelocations with up to two mismatches. We excluded afurther 4,400 probes that contained sequence variants,including 3,960 probes with SNPs (from the 1,000 gen-omes project [54], July 2009 release, YRI population) and440 probes which overlapped copy number variants [55].This resulted in a final set of 22,290 probes (21,289 auto-somal probes) that were used in all further analyses. The22,290 probes were nearest to the TSSs of 13,236 Ensemblgenes, of which 12,901 genes had at least one methylationCpG-site within 2 kb of the TSS.Bisulfite sequencing was performed in the C21orf56
region for eight individuals. DNA was bisulfite-con-verted using the EZ DNA Methylation-Gold Kit (ZymoResearch). PCR amplification was performed using pri-mers designed around CpG-site cg07747299 from theHumanMethylation27 array and the nearest CpG islandin the region (using Methyl Primer Express fromApplied Biosystems) for a total of 411 bp amplified inthe 5’ UTR of the C21orf56 gene. PCR products weresequenced and cytosine peak heights compared to over-all peak height were called using 4Peaks Software.
Gene expression dataRNA-sequencing data were obtained for LCLs from 69individuals in our study from [24]. The methylation andRNA-sequencing data were obtained from the same cul-tures of the LCLs. RNA-sequencing gene expressionvalues are presented as the number of GC-corrected readsmapping to a gene in an individual, divided by the lengthof the gene. In the methylation to gene expression com-parisons we split genes into quantiles based on the mean
gene expression per gene. For the eQTL analyses, RNA-sequencing data were corrected and normalized exactly asin [24]. Of the 22,683 genes in the original study, 10,167autosomal genes had both gene expression counts andmethylation CpG-sites within 2 kb of the TSS.
Genotype dataHapMap release 27 genotype data were obtained for3.8 million autosomal SNPs in HapMap (combinedPhase 1/2 and 3). Missing genotypes were imputed byBIMBAM [56] using the posterior mean genotype. Non-polymorphic SNPs were excluded, reducing the set to3,035,566 autosomal SNPs for association analyses.
Statistical analysisSpearman rank correlations were used to assess co-methylation between probes and to compare methyla-tion and gene expression. We used 10,000 permutationsof the gene expression to methylation assignments toassess the enrichment of negatively and positively corre-lated genes in the 25% and 5% tails within genes. Wil-coxon rank-sum tests were used to compare probemeans and variances for subsets of probes.
Association analysesGenome-wide association was performed using themethylation values at each CpG-site as phenotypes andthree million autosomal SNP genotypes. We used leastsquares linear regression with a single-locus additiveeffects model, where we estimated the effect of theminor SNP allele on the increase in methylation levels.Prior to the association analyses, we normalized themethylation values at each CpG-site to N(0, 1) andapplied a correction using principal component analysisregressing the first three principal components toaccount for unmeasured confounders following similarapproaches to reduce expression heterogeneity in geneexpression experiments [24,42,43] (see Additional file 1).Sex-specific analyses were performed using sex as a cov-ariate and assessing the significance of the sex by addi-tive-QTL interaction term.We assessed the enrichment of association at SNPs
and probes that were previously reported to be asso-ciated with methylation [7,8,15-18] and at SNPs within200 kb of genes known to affect DNA methylation(Table S3 in Additional file 1). We also comparedgenetic variation to normalized variation in the principalcomponents loadings for the autosomal methylationdata (see Additional file 1). Results from the 180 cismeQTLs are available online [50].
FDR calculationWe performed genome-wide permutations to assess thesignificance of the genome-wide association results in
Bell et al. Genome Biology 2011, 12:R10http://genomebiology.com/2011/12/1/R10
Page 10 of 13
the least-square linear regressions. We permuted themethylation values for the 21,289 autosomal probes(phenotypes), performed genome-wide association onthe 21,289 permuted and normalized phenotypes, andrepeated this procedure for 10 (cis-analyses) or 1 (trans-analyses) replicates selecting the best signal per probeper replicate. Results are presented at an FDR of 10%,meaning that an estimated 10% of the meQTLs arefalse positives. Results for additional FDR thresholds areshown in Additional file 1. FDR was calculated as thefraction of significant hits in the permuted versus theobserved data at a given P-value threshold. The associa-tion analyses and FDR calculations were performed forall autosomal principal components and CpG-sites inthe methylation data, and for all autosomal genes in theRNA-sequencing data.
Hierarchical modelWe fitted a Bayesian hierarchical model [22] to testwhether meQTLs were over-represented in transcriptionfactor binding sites, histone-modifications, and withrespect to distance to the probe. We extended themodel to fit the methylation data, where the referencepoint was the location of the methylation probe. Eachannotation category that we examined was included inthe model while accounting for distance effects.
Genome annotationsGenome annotation data were obtained from UCSC(hg18). Histone modification data were obtained fromChIP-seq reads from the ENCODE project (Bernsteinlab) for GM12878 for seven histone marks. Histonemodification categories were based on estimated peaksin the read-depth distribution (see Additional file 1).Transcription factor binding site locations were esti-
mated using the algorithm CENTIPEDE [40,57]. For theresults presented here, CENTIPEDE started by identifyingall matches in the genome to a large number of transcrip-tion factor binding motifs obtained from the TRANSFACand JASPAR databases. It then estimated which potentialbinding sites are actually occupied by transcription factorsin LCLs, by incorporating input data from sequence con-servation, location with respect to nearby genes, and cell-specific experimental data, including DNaseI data. Weused 1,136,620 non-overlapping sites from 751 transcrip-tion factor motif matches that overlapped 1,913 CpG-sites.
Additional material
Additional file 1: Supplementary material. Contains SupplementaryMethods and Results, Supplementary Figures 1-11, and SupplementaryTables 1-4.
AbbreviationsCEPH: Centre d’Etude du Polymorphisme Humain; CGI: CpG island; ChIP-seq:chromatin immunoprecipitation followed by sequencing; CpG: cytosine-phosphate-guanine; DIP2B: disco-interacting protein 2 homolog B gene;DNMT: DNA methyltransferase; eQTL: expression quantitative trait locus; FDR:false discovery rate; LCL: lymphoblastoid cell line; meQTL: methylationquantitative trait locus; QTL: quantitative trait locus; SNP: single nucleotidepolymorphism; TSS: transcription start site; UCSC: University of CaliforniaSanta Cruz genome browser; YRI: Yoruba.
AcknowledgementsWe thank Joseph deYoung (UCLA Southern California GenotypingConsortium) for performing the Illumina methylation assays. We thank theanonymous reviewers for helpful comments. We thank Matthew Stephens,Anna di Rienzo, Barbara Engelhardt, Jean-Baptiste Veyrieras, Yongtao Guan,Kevin Bullaughey, Gorka Alkorta-Aranburu, and members of the Pritchard,Przeworski, and Stephens labs for helpful discussions. We acknowledge theENCODE Project for providing publicly-available histone modification andDNase data (collected by the Bernstein and Crawford labs). JTB is supportedby a Sir Henry Wellcome postdoctoral fellowship. RPR is supported by theChicago Fellows Program. AAP is supported by an American HeartAssociation predoctoral fellowship. This work was supported by the HowardHughes Medical Institute, and by grants from the National Institutes ofHealth (Genetics and Regulation Training T 532 GM007197-34 support forJFD and AAP; RO1 MH084703-01 to JKPr; and GM077959 to YG).
Author details1Department of Human Genetics, The University of Chicago, 920 E. 58th St,Chicago, IL 60637, USA. 2Howard Hughes Medical Institute, The University ofChicago, 920 E. 58th St, Chicago, IL 60637, USA. 3Wellcome Trust Centre forHuman Genetics, University of Oxford, Roosevelt Drive, Oxford OX3 7BN, UK.
Authors’ contributionsJTB, JKPr, and YG wrote the paper and interpreted the results. JKPr and YGdesigned the study. JTB analyzed the data. AAP performed bisulfite sequencingand sample preparation. JKPi mapped and processed the RNA-sequencingdata, and helped with the analyses. DJG mapped and processed the histonemodification data. RP-R and JFD provided estimates for the transcription factorbinding sites. All authors read and approved the final manuscript.
Competing interestsThe authors declare that they have no competing interests.
Received: 3 October 2010 Revised: 17 December 2010Accepted: 20 January 2011 Published: 20 January 2011
References1. Murrell A, Heeson S, Cooper WN, Douglas E, Apostolidou S, Moore GE,
Maher ER, Reik W: An association between variants in the IGF2 gene andBeckwith-Wiedemann syndrome: interaction between genotype andepigenotype. Hum Mol Genet 2004, 13:247-255.
2. Rakyan VK, Down TA, Maslau S, Andrew T, Yang TP, Beyan H, Whittaker P,McCann OT, Finer S, Valdes AM, Leslie RD, Deloukas P, Spector TD: Humanaging-associated DNA hypermethylation occurs preferentially at bivalentchromatin domains. Genome Res 2010, 20:434-439.
3. Teschendorff AE, Menon U, Gentry-Maharaj A, Ramus SJ, Weisenberger DJ,Shen H, Campan M, Noushmehr H, Bell CG, Maxwell AP, Savage DA,Mueller-Holzner E, Marth C, Kocjan G, Gayther SA, Jones A, Beck S,Wagner W, Laird PW, Jacobs IJ, Widschwendter M: Age-dependent DNAmethylation of genes that are suppressed in stem cells is a hallmark ofcancer. Genome Res 2010, 20:440-446.
4. Eckhardt F, Lewin J, Cortese R, Rakyan VK, Attwood J, Burger M, Burton J,Cox TV, Davies R, Down TA, Haefliger C, Horton R, Howe K, Jackson DK,Kunde J, Koenig C, Liddle J, Niblett D, Otto T, Pettett R, Seemann S,Thompson C, West T, Rogers J, Olek A, Berlin K, Beck S: DNA methylationprofiling of human chromosomes 6, 20 and 22. Nat Genet 2006,38:1378-1385.
5. Gibbs JR, van der Brug MP, Hernandez DG, Traynor BJ, Nalls MA, Lai SL,Arepalli S, Dillman A, Rafferty IP, Troncoso J, Johnson R, Zielke HR,
Bell et al. Genome Biology 2011, 12:R10http://genomebiology.com/2011/12/1/R10
Page 11 of 13
Ferrucci L, Longo DL, Cookson MR, Singleton AB: Abundant quantitativetrait Loci exist for DNA methylation and gene expression in humanbrain. PLoS Genet 2010, 6:e1000952.
6. Enard W, Fassbender A, Model F, Adorján P, Pääbo S, Olek A: Differences inDNA methylation patterns between humans and chimpanzees. Curr Biol2004, 14:R148-149.
7. El-Maarri O, Kareta MS, Mikeska T, Becker T, Diaz-Lacava A, Junen J,Nüsgen N, Behne F, Wienker T, Waha A, Oldenburg J, Chédin F: Asystematic search for DNA methyltransferase polymorphisms reveals arare DNMT3L variant associated with subtelomeric hypomethylation.Hum Mol Genet 2009, 18:1755-1768.
8. Friso S, Girelli D, Trabetti E, Olivieri O, Guarini P, Pignatti PF, Corrocher R,Choi SW: The MTHFR 1298A > C polymorphism and genomic DNAmethylation in human lymphocytes. Cancer Epidemiol Biomarkers Prev2005, 14:938-943.
9. Heijmans BT, Kremer D, Tobi EW, Boomsma DI, Slagboom PE: Heritablerather than age-related environmental and stochastic factors dominatevariation in DNA methylation of the human IGF2/H19 locus. Hum MolGenet 2007, 16:547-554.
10. Bock C, Paulsen M, Tierling S, Mikeska T, Lengauer T, Walter J: CpG islandmethylation in human lymphocytes is highly correlated with DNAsequence, repeats, and predicted DNA structure. PLoS Genet 2006, 2:e26.
11. Bhasin M, Zhang H, Reinherz EL, Reche PA: Prediction of methylated CpGsin DNA sequences using a support vector machine. FEBS Lett 2005,579:4302-4308.
12. Handa V, Jeltsch A: Profound flanking sequence preference of Dnmt3aand Dnmt3b mammalian DNA methyltransferases shape the humanepigenome. J Mol Biol 2005, 348:1103-1112.
13. Bjornsson HT, Sigurdsson MI, Fallin MD, Irizarry RA, Aspelund T, Cui H, Yu W,Rongione MA, Ekström TJ, Harris TB, Launer LJ, Eiriksdottir G, Leppert MF,Sapienza C, Gudnason V, Feinberg AP: Intra-individual change over timein DNA methylation with familial clustering. JAMA 2008, 299:2877-2883.
14. Kaminsky ZA, Tang T, Wang SC, Ptak C, Oh GHT, Wong AHC, Feldcamp LA,Virtanen C, Halfvarson J, Tysk C, McRae AF, Visscher PM, Montgomery GW,Gottesman II, Martin NG, Petronis A: DNA methylation profiles inmonozygotic and dizygotic twins. Nat Genet 2009, 41:240-245.
15. Kerkel K, Spadola A, Yuan E, Kosek J, Jiang L, Hod E, Li K, Murty VV,Schupf N, Vilain E, Morris M, Haghighi F, Tycko B: Genomic surveys bymethylation-sensitive SNP analysis identify sequence-dependent allele-specific DNA methylation. Nat Genet 2008, 40:904-908.
16. Boks MP, Derks EM, Weisenberger DJ, Strengman E, Janson E, Sommer IE,Kahn RS, Ophoff RA: The relationship of DNA methylation with age,gender and genotype in twins and healthy controls. PLoS One 2009, 4:e6767.
17. Schalkwyk LC, Meaburn EL, Smith R, Dempster EL, Jeffries AR, Davies MN,Plomin R, Mill J: Allelic skewing of DNA methylation is widespread acrossthe genome. Am J Hum Genet 2010, 86:196-212.
18. Zhang D, Cheng L, Badner JA, Chen C, Chen Q, Luo W, Craig DW,Redman M, Gershon ES, Liu C: Genetic control of individual differences ingene-specific methylation in human brain. Am J Hum Genet 2010,86:411-419.
19. Dimas AS, Deutsch S, Stranger BE, Montgomery SB, Borel C, Attar-Cohen H,Ingle C, Beazley C, Gutierrez Arcelus M, Sekowska M, Gagnebin M, Nisbett J,Deloukas P, Dermitzakis ET, Antonarakis SE: Common regulatory variationimpacts gene expression in a cell type-dependent manner. Science 2009,325:1246-1250.
20. Stranger BE, Nica AC, Forrest MS, Dimas A, Bird CP, Beazley C, Ingle CE,Dunning M, Flicek P, Koller D, Montgomery S, Tavaré S, Deloukas P,Dermitzakis ET: Population genomics of human gene expression. NatGenet 2007, 39:1217-1224.
21. International HapMap Consortium, Frazer KA, Ballinger DG, Cox DR,Hinds DA, Stuve LL, Gibbs RA, Belmont JW, Boudreau A, Hardenbol P,Leal SM, Pasternak S, Wheeler DA, Willis TD, Yu F, Yang H, Zeng C, Gao Y,Hu H, Hu W, Li C, Lin W, Liu S, Pan H, Tang X, Wang J, Wang W, Yu J,Zhang B, Zhang Q, Zhao H, et al: A second generation human haplotypemap of over 3.1 million SNPs. Nature 2007, 449:851-861.
22. Veyrieras JB, Kudaravalli S, Kim SY, Dermitzakis ET, Gilad Y, Stephens M,Pritchard JK: High-resolution mapping of expression-QTLs yields insightinto human gene regulation. PLoS Genet 2008, 4:e1000214.
23. Montgomery SB, Sammeth M, Gutierrez-Arcelus M, Lach RP, Ingle C,Nisbett J, Guigo R, Dermitzakis ET: Transcriptome genetics using second
generation sequencing in a Caucasian population. Nature 2010,464:773-777.
24. Pickrell JK, Marioni JC, Pai AA, Degner JF, Engelhardt BE, Nkadori E,Veyrieras JB, Stephens M, Gilad Y, Pritchard JK: Understanding mechanismsunderlying human gene expression variation with RNA sequencing.Nature 2010, 464:768-772.
25. McDaniell R, Lee BK, Song L, Liu Z, Boyle AP, Erdos MR, Scott LJ,Morken MA, Kucera KS, Battenhouse A, Keefe D, Collins FS, Willard HF,Lieb JD, Furey TS, Crawford GE, Iyer VR, Birney E: Heritable individual-specific and allele-specific chromatin signatures in humans. Science 2010,328:235-239.
26. Kasowski M, Grubert F, Heffelfinger C, Hariharan M, Asabere A, Waszak SM,Habegger L, Rozowsky J, Shi M, Urban AE, Hong MY, Karczewski KJ,Huber W, Weissman SM, Gerstein MB, Korbel JO, Snyder M: Variation intranscription factor binding among humans. Science 2010, 328:232-235.
27. ENCODE Project Consortium, Birney E, Stamatoyannopoulos JA, Dutta A,Guigó R, Gingeras TR, Margulies EH, Weng Z, Snyder M, Dermitzakis ET,Thurman RE, Kuehn MS, Taylor CM, Neph S, Koch CM, Asthana S,Malhotra A, Adzhubei I, Greenbaum JA, Andrews RM, Flicek P, Boyle PJ,Cao H, Carter NP, Clelland GK, Davis S, Day N, Dhami P, Dillon SC,Dorschner MO, Fiegler H, et al: Identification and analysis of functionalelements in 1% of the human genome by the ENCODE pilot project.Nature 2007, 447:799-816.
28. Bolstad BM, Irizarry RA, Astrand M, Speed TP: A comparison ofnormalization methods for high density oligonucleotide array databased on variance and bias. Bioinformatics 2003, 19:185-193.
29. Grafodatskaya D, Choufani S, Ferreira JC, Butcher DT, Lou Y, Zhao C,Scherer SW, Weksberg R: EBV transformation and cell culturingdestabilizes DNA methylation in human lymphoblastoid cell lines.Genomics 2010, 95:73-83.
30. Choy E, Yelensky R, Bonakdar S, Plenge RM, Saxena R, De Jager PL,Shaw SY, Wolfish CS, Slavik JM, Cotsapas C, Rivas M, Dermitzakis ET, Cahir-McFarland E, Kieff E, Hafler D, Daly MJ, Altshuler D: Genetic analysis ofhuman traits in vitro: drug response and gene expression inlymphoblastoid cell lines. PLoS Genet 2008, 4:e1000287.
31. Lister R, Pelizzola M, Dowen RH, Hawkins RD, Hon G, Tonti-Filippini J,Nery JR, Lee L, Ye Z, Ngo QM, Edsall L, Antosiewicz-Bourget J, Stewart R,Ruotti V, Millar AH, Thomson JA, Ren B, Ecker JR: Human DNA methylomesat base resolution show widespread epigenomic differences. Nature2009, 462:315-322.
32. Weber M, Hellmann I, Stadler MB, Ramos L, Pääbo S, Rebhan M,Schübeler D: Distribution, silencing potential and evolutionary impact ofpromoter DNA methylation in the human genome. Nat Genet 2007,39:457-466.
33. Gardiner-Garden M, Frommer M: CpG islands in vertebrate genomes. JMol Biol 1987, 196:261-282.
34. Irizarry RA, Ladd-Acosta C, Wen B, Wu Z, Montano C, Onyango P, Cui H,Gabo K, Rongione M, Webster M, Ji H, Potash JB, Sabunciyan S,Feinberg AP: The human colon cancer methylome shows similar hypo-and hypermethylation at conserved tissue-specific CpG island shores.Nat Genet 2009, 41:178-186.
35. Ball MP, Li JB, Gao Y, Lee JH, LeProust EM, Park IH, Xie B, Daley GQ,Church GM: Targeted and genome-scale strategies reveal gene-bodymethylation signatures in human cells. Nat Biotechnol 2009,27:361-368.
36. Cedar H, Bergman Y: Linking DNA methylation and histone modification:patterns and paradigms. Nat Rev Genet 2009, 10:295-304.
37. Thomson JP, Skene PJ, Selfridge J, Clouaire T, Guy J, Webb S, Kerr ARW,Deaton A, Andrews R, James KD, Turner DJ, Illingworth R, Bird A: CpGislands influence chromatin structure via the CpG-binding protein Cfp1.Nature 2010, 464:1082-1086.
38. Heintzman ND, Hon GC, Hawkins RD, Kheradpour P, Stark A, Harp LF, Ye Z,Lee LK, Stuart RK, Ching CW, Ching KA, Antosiewicz-Bourget JE, Liu H,Zhang X, Green RD, Lobanenkov VV, Stewart R, Thomson JA, Crawford GE,Kellis M, Ren B: Histone modifications at human enhancers reflect globalcell-type-specific gene expression. Nature 2009, 459:108-112.
39. Kurdistani SK, Tavazoie S, Grunstein M: Mapping global histone acetylationpatterns to gene expression. Cell 2004, 117:721-733.
40. Pique-Regi R, Degner JF, Pai AA, Gaffney DJ, Gilad Y, Pritchard JK: Accurateinference of transcription factor binding from DNA sequence andchromatin accessibility data. Genome Res 2011, in press.
Bell et al. Genome Biology 2011, 12:R10http://genomebiology.com/2011/12/1/R10
Page 12 of 13
41. Winnepenninckx B, Debacker K, Ramsay J, Smeets D, Smits A, FitzPatrick DR,Kooy RF: CGG-repeat expansion in the DIP2B gene is associated with thefragile site FRA12A on chromosome 12q13.1. Am J Hum Genet 2007,80:221-231.
42. Leek JT, Storey JD: Capturing heterogeneity in gene expression studiesby surrogate variable analysis. PLoS Genet 2007, 3:1724-1735.
43. Kang HM, Ye C, Eskin E: Accurate discovery of expression quantitativetrait loci under confounding from spurious and genuine regulatoryhotspots. Genetics 2008, 180:1909-1925.
44. Zempleni J, Chew YC, Bao B, Pestinger V, Wijeratne SSK: Repression oftransposable elements by histone biotinylation. J Nutr 2009,139:2389-2392.
45. Ober C, Loisel DA, Gilad Y: Sex-specific genetic architecture of humandisease. Nat Rev Genet 2008, 9:911-922.
46. Fry RC, Svensson JP, Valiathan C, Wang E, Hogan BJ, Bhattacharya S,Bugni JM, Whittaker CA, Samson LD: Genomic predictors of interindividualdifferences in response to DNA damaging agents. Genes Dev 2008,22:2621-2626.
47. Kadota M, Yang HH, Hu N, Wang C, Hu Y, Taylor PR, Buetow KH, Lee MP:Allele-specific chromatin immunoprecipitation studies show geneticinfluence on chromatin state in human genome. PLoS Genet 2007, 3:e81.
48. Sun YV, Turner ST, Smith JA, Hammond PI, Lazarus A, Van De Rostyne JL,Cunningham JM, Kardia SLR: Comparison of the DNA methylation profilesof human peripheral blood cells and transformed B-lymphocytes. HumGenet 2010, 127:651-658.
49. Zheng W, Zhao H, Mancera E, Steinmetz LM, Snyder M: Genetic analysis ofvariation in transcription factor binding in yeast. Nature 2010,464:1187-1191.
50. Complete methylation data and results.. [http://eqtl.uchicago.edu/].51. NCBI Gene Expression Omnibus.. [http://www.ncbi.nlm.nih.gov/geo/].52. Kent WJ: BLAT-the BLAST-like alignment tool. Genome Res 2002,
12:656-664.53. Li H, Ruan J, Durbin R: Mapping short DNA sequencing reads and calling
variants using mapping quality scores. Genome Res 2008, 18:1851-1858.54. The 1000 genomes project.. [http://www.1000genomes.org/].55. Conrad DF, Pinto D, Redon R, Feuk L, Gokcumen O, Zhang Y, Aerts J,
Andrews TD, Barnes C, Campbell P, Fitzgerald T, Hu M, Ihm CH,Kristiansson K, Macarthur DG, Macdonald JR, Onyiah I, Pang AWC, Robson S,Stirrups K, Valsesia A, Walter K, Wei J, Wellcome Trust Case ControlConsortium, Tyler-Smith C, Carter NP, Lee C, Scherer SW, Hurles ME: Originsand functional impact of copy number variation in the human genome.Nature 2010, 464:704-712.
56. Guan Y, Stephens M: Practical issues in imputation-based associationmapping. PLoS Genet 2008, 4:e1000279.
57. CENTIPEDE.. [http://centipede.uchicago.edu].58. Servin B, Stephens M: Imputation-based analysis of association studies:
candidate regions and quantitative traits. PLoS Genet 2007, 3:e114.59. Devlin AM, Singh R, Wade RE, Innis SM, Bottiglieri T, Lentz SR:
Hypermethylation of Fads2 and altered hepatic fatty acid andphospholipid metabolism in mice with hyperhomocysteinemia. J BiolChem 2007, 282:37082-37090.
60. Gómez E, Caamaño JN, Bermejo-Alvarez P, Díez C, Muñoz M, Martín D,Carrocera S, Gutiérrez-Adán A: Gene expression in early expandedparthenogenetic and in vitro fertilized bovine blastocysts. J Reprod Dev2009, 55:607-614.
61. Sandell LL, Guan XJ, Ingram R, Tilghman SM: Gatm, a creatine synthesisenzyme, is imprinted in mouse placenta. Proc Natl Acad Sci USA 2003,100:4622-4627.
62. Kim M, Patel B, Schroeder KE, Raza A, Dejong J: Organization andtranscriptional output of a novel mRNA-like piRNA gene (mpiR) locatedon mouse chromosome 10. RNA 2008, 14:1005-1011.
63. Gius D, Cui H, Bradbury CM, Cook J, Smart DK, Zhao S, Young L,Brandenburg SA, Hu Y, Bisht KS, Ho AS, Mattson D, Sun L, Munson PJ,Chuang EY, Mitchell JB, Feinberg AP: Distinct effects on gene expressionof chemical and genetic manipulation of the cancer epigenomerevealed by a multimodality approach. Cancer Cell 2004, 6:361-371.
64. Sun L, Huang L, Nguyen P, Bisht KS, Bar-Sela G, Ho AS, Bradbury CM, Yu W,Cui H, Lee S, Trepel JB, Feinberg AP, Gius D: DNA methyltransferase 1 and3B activate BAG-1 expression via recruitment of CTCFL/BORIS andmodulation of promoter histone methylation. Cancer Res 2008,68:2726-2735.
65. Morison IM, Paton CJ, Cleverley SD: The imprinted gene and parent-of-origin effect database. Nucleic Acids Res 2001, 29:275-276.
66. Kong A, Steinthorsdottir V, Masson G, Thorleifsson G, Sulem P,Besenbacher S, Jonasdottir A, Sigurdsson A, Kristinsson KT, Jonasdottir A,Frigge ML, Gylfason A, Olason PI, Gudjonsson SA, Sverrisson S, Stacey SN,Sigurgeirsson B, Benediktsdottir KR, Sigurdsson H, Jonsson T,Benediktsson R, Olafsson JH, Johannsson OT, Hreidarsson AB, Sigurdsson G,DIAGRAM Consortium, Ferguson-Smith AC, Gudbjartsson DF,Thorsteinsdottir U, Stefansson K: Parental origin of sequence variantsassociated with complex diseases. Nature 2009, 462:868-874.
doi:10.1186/gb-2011-12-1-r10Cite this article as: Bell et al.: DNA methylation patterns associate withgenetic and gene expression variation in HapMap cell lines. GenomeBiology 2011 12:R10.
Submit your next manuscript to BioMed Centraland take full advantage of:
• Convenient online submission
• Thorough peer review
• No space constraints or color figure charges
• Immediate publication on acceptance
• Inclusion in PubMed, CAS, Scopus and Google Scholar
• Research which is freely available for redistribution
Submit your manuscript at www.biomedcentral.com/submit
Bell et al. Genome Biology 2011, 12:R10http://genomebiology.com/2011/12/1/R10
Page 13 of 13