Embed Size (px)
Citation preview

Priority Research Paper
www.aging-us.com AGING 2016, Vol. 8, No. 9
DNA methylation‐based measures of biological age: meta‐analysis predicting time to death
Brian H. Chen1,2,3*, Riccardo E. Marioni4,5,6*, Elena Colicino7*, Marjolein J. Peters8, Cavin K. Ward‐Caviness9, Pei‐Chien Tsai10, Nicholas S. Roetker11, Allan C. Just7, Ellen W. Demerath11, WeihuaGuan12, Jan Bressler13, Myriam Fornage13,14, Stephanie Studenski1, Amy R. Vandiver15, AnnZenobia Moore1, Toshiko Tanaka1, Douglas P. Kiel16,17, Liming Liang18,19, Pantel Vokonas18, JoelSchwartz18, Kathryn L. Lunetta20,2, Joanne M. Murabito2,21, Stefania Bandinelli22, Dena G.Hernandez23, David Melzer24, Michael Nalls23, Luke C. Pilling24, Timothy R. Price23, Andrew B.Singleton23, Christian Gieger9,25, Rolf Holle26, Anja Kretschmer9,25, Florian Kronenberg27, SonjaKunze9,25, Jakob Linseisen9, Christine Meisinger9, Wolfgang Rathmann28, MelanieWaldenberger9,25, Peter M. Visscher4,6,29, Sonia Shah6,29, Naomi R. Wray6, Allan F. McRae6,29,Oscar H. Franco30, Albert Hofman18,30, André G. Uitterlinden8,30, Devin Absher31, ThemistoclesAssimes32, Morgan E. Levine33, Ake T. Lu33, Philip S. Tsao32,34, Lifang Hou35,36, JoAnn E. Manson37,Cara L. Carty38, Andrea Z. LaCroix39, Alexander P. Reiner40,41, Tim D. Spector10, Andrew P.Feinberg15,42, Daniel Levy 2,43*, Andrea Baccarelli 7,44*, Joyce van Meurs8*, Jordana T. Bell10*,Annette Peters9*, Ian J. Deary4,45*, James S. Pankow11*, Luigi Ferrucci1*, Steve Horvath
33,46* 1Longitudinal Studies Section, Translational Gerontology Branch, Intramural Research Program, National Institute on Aging, National Institutes of Health, Baltimore, MD 21224, USA 2The NHLBI’s Framingham Heart Study, Framingham, MA 01702, USA 3Population Sciences Branch, Division of Intramural Research, National Heart, Lung, and Blood Institute, National Institutes of Health, Bethesda, MD 01702, USA 4Centre for Cognitive Ageing and Cognitive Epidemiology, University of Edinburgh, 7 George Square, Edinburgh, EH8 9JZ, UK 5Medical Genetics Section, Centre for Genomic and Experimental Medicine, Institute of Genetics and Molecular Medicine, University of Edinburgh, Edinburgh, EH4 2XU, UK 6Queensland Brain Institute, University of Queensland, Brisbane, QLD, Australia 7Laboratory of Environmental Epigenetics, Departments of Environmental Health Sciences and Epidemiology, Columbia University Mailman School of Public Health, New York, NY 10032, USA 8Department of Internal Medicine, Erasmus University Medical Centre, Rotterdam, 3000 CA, The Netherlands 9Institute of Epidemiology II, Helmholtz Zentrum München, 85764 Neuherberg, Germany 10Department of Twin Research and Genetic Epidemiology, Kings College London, London SE1 7EH, UK 11Division of Epidemiology and Community Health, University of Minnesota, Minneapolis, MN 55455, USA 12Division of Biostatistics, University of Minnesota School of Public Health, Minneapolis, MN, 55455, USA 13Human Genetics Center, School of Public Health, University of Texas Health Sciences Center at Houston, Houston, TX, USA 14Human Genome Sequencing Center, Baylor College of Medicine, Houston, TX, USA 15Center for Epigenetics, Johns Hopkins University, Baltimore, MD 21205, USA 16Department of Medicine, Beth Israel Deaconess Medical Center and Harvard Medical School, Boston, MA, USA 17Institute for Aging Research, Hebrew Senior Life, Boston, MA 02215, USA
www.aging‐us.com 1844 AGING (Albany NY)

18Department of Epidemiology, Harvard School of Public Health, Boston, MA 02115, USA 19Department of Biostatistics, Harvard School of Public Health, Boston, MA 02115, USA 20Department of Biostatistics, Boston University School of Public Health, Boston, MA 02118, USA 21Section of General Internal Medicine, Department of Medicine, Boston University School of Medicine, Boston, MA 02118, USA 22Geriatric Unit, Usl Centro Toscana, Florence, Italy 23Laboratory of Neurogenetics, Intramural Research Program, National Institute on Aging, National Institutes of Health, Bethesda, MD 20814, USA 24Epidemiology and Public Health, Medical School, University of Exeter, RILD, Exeter EX2 5DW, UK 25Research Unit of Molecular Epidemiology, Helmholtz Zentrum München, 85764 Neuherberg, Germany 26Institute of Health Economics and Health Care Management, Helmholtz Zentrum München, 85764 Neuherberg, Germany 27Division of Genetic Epidemiology, Department of Medical Genetics, Molecular and Clinical Pharmacology, Innsbruck Medical University, Innsbruck 6020, Austria 28Institute for Biometrics and Epidemiology, German Diabetes Center, Leibniz Center for Diabetes Research at Heinrich Heine University, 40225 Düsseldorf, Germany 29University of Queensland Diamantina Institute, University of Queensland, Brisbane, Queensland, Australia 30Department of Epidemiology, Erasmus University Medical Centre, Rotterdam, 3015 CN, The Netherlands 31HudsonAlpha Institute for Biotechnology, Huntsville, AL 35806, USA 32Department of Medicine, Stanford University School of Medicine, Stanford, CA 94305, USA; 33Human Genetics, David Geffen School of Medicine, University of California Los Angeles, Los Angeles, CA 90095, USA 34VA Palo Alto Health Care System, Palo Alto CA 94304, USA 35Department of Preventive Medicine, Feinberg School of Medicine, Northwestern University Chicago, IL 60611, USA 36Robert H. Lurie Comprehensive Cancer Center, Feinberg School of Medicine, Northwestern University Chicago, IL 60611, USA 37Department of Medicine, Brigham and Women's Hospital, Harvard Medical School, and the Department of Epidemiology, Harvard T.H. Chan School of Public Health, Boston, MA 02215, USA 38Center for Translational Science Children’s National Medical Center, George Washington University Washington, DC 20010, USA 39Department of Family Medicine and Public Health, University of California‐San Diego, La Jolla, CA 92093‐0725, USA 40Department of Epidemiology, University of Washington School of Public Health, Seattle, WA 98195, USA 41Public Health Sciences Division, Fred Hutchinson Cancer Research Center, Seattle, WA 98109, USA 42Departments of Medicine, Molecular Biology/Genetics, Oncology, and Biostatistics, Johns Hopkins University School of Medicine, Baltimore, MD 21205, USA 43Population Sciences Branch, Division of Intramural Research, National Heart, Lung, and Blood Institute, National Institutes of Health, Bethesda, MD 01702, USA 44Department of Environmental Health, Harvard T.H. Chan School of Public Health, Boston, MA 02115, USA 45Department of Psychology, University of Edinburgh, 7 George Square, Edinburgh, EH8 9JZ, UK 46Department of Biostatistics, School of Public Health, University of California Los Angeles, Los Angeles, CA 90095, USA *Joint first or senior authors Correspondence to: Steve Horvath; email: [email protected] Keywords: all‐cause mortality; lifespan; epigenetics; epigenetic clock; DNA methylation; mortality Received: July 01, 2016 Accepted: August 18, 2016 Published: September 28, 2016
www.aging‐us.com 1845 AGING (Albany NY)

INTRODUCTION DNA methylation-based biomarkers, often referred to as “epigenetic age” or "epigenetic clock", are robust estimators of chronological age of an individual [1–4]. For example, a measure of epigenetic age based on levels of methylation in 353 CpG dinucleotide markers (cytosine linked to guanine by a phosphate group) allow the estimation of the age of an individual. This estimate is consistent across most types of biological specimens, including whole blood, brain, breast, kidney, liver, lung, and saliva and cell types, including CD4+ T cells, monocytes, B cells, glial cells, and neurons [3]. Recent studies suggested that epigenetic age is associated with age-related health outcomes above and beyond chronological age. For example, we and others have shown that individuals whose epigenetic age was greater than their chronological age (i.e., individuals exhibiting epigenetic "age acceleration") were at an increased risk for death from all causes, even after accounting for known risk factors [5–7]. Further, we recently showed that the offspring of semi-supercentenarians (subjects who reached an age of 105-109 years) have a lower epigenetic age than age-matched controls [8]. Based on these findings, it has been hypothesized that epigenetic age captures some aspect of biological age and the resulting susceptibility to disease and multiple health outcomes. A first step in testing this hypothesis is to test whether epigenetic age predicts longevity in multiple populations and across ethnic groups. In many studies epigenetic age is estimated from DNA derived from blood samples. It is well known that blood
cell composition changes with age and some of these changes might be independent predictors of mortality [9–12]. Thus, it is of interest to understand whether considering information on blood cell composition in measures of epigenetic age improves their predictive power for mortality. Here, we evaluated the ability to predict time to death for blood-based epigenetic age measures, both published and novel measures that incorporate information on blood cell composition. Due to the well documented age-related changes in blood cell composition, we distinguished epigenetic measures of age that were independent of changes in blood cell composition (cell-intrinsic measures), and measures that incorporated age-related changes in blood cell composition ("extrinsic" measures). By increasing the number of independent cohort studies, we more than doubled the number of mortality events available for analysis, which allowed for detailed subgroup analyses including those based on race/ethnicity. RESULTS Cohort studies Our meta-analysis included 13 population-based cohorts. An overview of the cohorts is provided in Table 1. Our study involved 3 racial/ethnic groups: non-Hispanic whites (n=9,215), Hispanics (n=431), and Blacks (n=3,443). Detailed descriptions of each cohort can be found in the Supplemental Materials.
www.aging‐us.com 1846 AGING (Albany NY)
ABSTRACT Estimates of biological age based on DNA methylation patterns, often referred to as "epigenetic age", "DNAmage", have been shown to be robust biomarkers of age in humans. We previously demonstrated thatindependent of chronological age, epigenetic age assessed in blood predicted all‐cause mortality in four humancohorts. Here, we expanded our original observation to 13 different cohorts for a total sample size of 13,089individuals, including three racial/ethnic groups. In addition, we examined whether incorporating informationon blood cell composition into the epigenetic age metrics improves their predictive power for mortality. Allconsidered measures of epigenetic age acceleration were predictive of mortality (p≤8.2x10‐9), independent ofchronological age, even after adjusting for additional risk factors (p<5.4x10‐4), and within the racial/ethnicgroups that we examined (non‐Hispanic whites, Hispanics, African Americans). Epigenetic age estimates thatincorporated information on blood cell composition led to the smallest p‐values for time to death (p=7.5x10‐43).Overall, this study a) strengthens the evidence that epigenetic age predicts all‐cause mortality above andbeyond chronological age and traditional risk factors, and b) demonstrates that epigenetic age estimates thatincorporate information on blood cell counts lead to highly significant associations with all‐cause mortality.

Epigenetic age estimation We used two methods for estimating the epigenetic age of each blood sample (Table 2). First, we used the approach by Horvath (2013) based on 353 CpGs, as described in [3] and Methods. Second, we used the approach by Hannum et al. (2013) based on 71 CpGs [2]. Both epigenetic age estimates were correlated with chronological age at the time of blood draw (Table 1) with biweight midcorrelation coefficients ranging from 0.65 to 0.89. But birth cohorts were excluded from this correlation analysis because it is not meaningful to calculate correlations with chronological age in this situation. The Horvath and Hannum estimates were also highly correlated with each other (r=0.76) even though the underlying sets of CpGs share only 6 CpGs in common. (Supplementary Table 1).
Estimated blood cell counts that relate to chronological age We estimated the abundance of ten blood cell types based on observed DNA methylation patterns (Methods) –exhausted/senescent CD8+ T cells (CD8+CD28-CD45RA-), CD8+ naïve, CD8+ total, CD4+ naïve, CD4+ total, natural killer cells, B cells, monocytes, granulocytes, and plasmablasts. To study age-related changes in blood cell composition, we correlated these estimated blood cell counts with chronological age in all of the cohort studies (Supplementary Table 2). Our results are congruent with findings from flow cytometric studies that demonstrate that the abundance of naïve CD8+ T cells decreases with age (reflecting thymic involution), whereas exhausted/senescent CD8+ T cells increase with age [9–12].
Table 1. Baseline characteristics of participating cohorts. Cohort N Ndeaths (%) Follow-up
duration (years)*
Age (years)*
rHorvath† rHannum ‡
1. WHI (White) 995 309 (31%) 15.4 (14.0-16.4) 68 (65-72) 0.67 (p=5.1x10-131) 0.73 (p=8.0x10-167)
2. WHI (Black) 675 176 (26%) 15.4 (13.7-16.5) 62 (57-67) 0.70 (p=1.2x10-100) 0.76 (p=3.0x10-128)
3. WHI (Hispanic) 431 78 (18%) 15.2 (14.1-16.3) 61 (56-67) 0.78 (p=8.9x10-90) 0.79 (p=1.3x10-93)
4. LBC 1921 445 312 (70%) 10.2 (6.2-12.9) 79 (78-79) 0.15 (p=1.5x10⁻³) 0.13 (p=6.0x10⁻³)
5. LBC 1936 919 106 (12%) 7.5 (6.9-8.4) 69 (68-70) 0.15 (p=4.9x10⁻⁶) 0.16 (p=1.1x10⁻⁶)
6. NAS 647 221 (34%) 11.6 (8.6-12.9) 72 (68-77) 0.69 (p=1.3x10-92) 0.76 (p=8.2x10-123)
7. ARIC (Black) 2,768 1,075 (39%) 20.3 (14.3-21.4) 57 (52-62) 0.65 (p<1x10-200) 0.71 (p<1x10-200)
8. FHS 2,614 236 (9%) 6.2 (5.6-6.9) 66 (60-73) 0.84 (p<1x10-200) 0.86 (p<1x10-200)
9. KORA 1,257 42 (3%) 4.4 (4.0-4.8) 61 (54-68) 0.84 (p<1x10-200) 0.88 (p<1x10-200)
10. InCHIANTI 506 91 (18%) 15.0 (14.6-15.5) 67 (57-73) 0.82 (p=3.2x10-124) 0.85 (p=2.1x10-142)
11. Rotterdam 710 32 (5%) 5.6 (5.3-5.8) 58 (54-62) 0.72 (p=1.9x10-114) 0.76 (p=1.3x10-134)
12.Twins UK 805 30 (4%) 8.5 (7.5-8.5) 58 (51-65) 0.87 (p<1x10-200) 0.89 (p<1x10-200)
13. BLSA (white) 317 26 (8%) 5.3 (4.0-6.6) 66 (58-73) 0.85 (p=1.1x10-89) 0.88 (p=7.2x10-104)
Total 13,089 2734 (21%)
The last 3 columns report robust correlation coefficients (biweight midcorrelation) between chronological age and two epigenetic age estimates (Horvath and Hannum). * Median (25th percentile ‐ 75th percentile) † Biweight midcorrelation coefficient of chronological age with epigenetic age using the Horvath method. ‡ Biweight midcorrelation coefficient of chronological age with epigenetic age using the Hannum method.
www.aging‐us.com 1847 AGING (Albany NY)

Measures of epigenetic age acceleration Despite high correlations, epigenetic age can deviate substantially from chronological age at the individual level. The difference between epigenetic age and chro-
nological age can be used to define "delta age" but the resulting measure exhibits a negative correlation with chronological age. By contrast, all of our measures of epigenetic age acceleration are defined such that they are uncorrelated with chronological age.
Table 2. Overview of various measures of epigenetic age acceleration. Measure of age acceleration Short name of
measure Epigenetic age estimate
Uses blood counts
Correlation with blood counts
Conserved in breast tissue
(Universal) epigenetic age acceleration AgeAccelHorvath (AgeAccel)
Horvath: 353 CpGs no weak yes
Intrinsic epigenetic age acceleration (Horvath)
IEAA.Horvath (IEAA)
Horvath: 353 CpGs yes very weak yes
Age acceleration based on Hannum AgeAccelHannum Hannum: 71 CpGs no moderate noIntrinsic epigenetic age acceleration (Hannum)
IEAA.Hannum Hannum: 71 CpGs yes very weak no
Extrinsic epigenetic age acceleration EEAA Enhanced Hannum yes strong no
Description of the differences between epigenetic age and age acceleration measures. Column "Correlation with blood counts" relates to Supplementary Table 4. Column "Conserved in breast tissue" relates to Figure 1.
Figure 1. Epigenetic age acceleration in blood versus that in breast or saliva. (A‐D) Epigenetic age acceleration inhealthy female breast tissue (y‐axis) versus various measures of epigenetic age acceleration in blood: (A) universal measureof age acceleration in blood, (B) intrinsic epigenetic age acceleration based on the Horvath estimate of epigenetic age, (C)extrinsic epigenetic age acceleration, (D) intrinsic epigenetic age acceleration based on the Hannum estimate of epigeneticage. (E‐H) analogous plots for epigenetic age acceleration in saliva (y‐axis) and (E) AgeAccel, (F) IEAA based on Horvath, (G)EEAA, (H) IEAA based on the Hannum estimate. The y‐axis of each plot represents the universal measure of age accelerationdefined as the raw residual resulting from regressing epigenetic age (based on Horvath) on chronological age.
www.aging‐us.com 1848 AGING (Albany NY)

An overview of several measures of epigenetic age acceleration is presented in Table 2. One such measure (denoted as AgeAccel) is defined as the residual that results from regressing epigenetic age on chronological age. Thus, a positive value of AgeAccel indicates that the epigenetic age is higher than expected, based on chronological age. These Horvath and Hannum based measures of age acceleration are denoted by AgeAccelHorvath and AgeAccelHannum, respectively. For the sake of brevity and consistency with other publications from our group, we abbreviate AgeAccelHorvath as AgeAccel. AgeAccelHannum and to a lesser extent AgeAccel were previously shown to correlate with blood cell counts [5]. Thus, we distinguished two broad categories of measures of epigenetic age acceleration when dealing with DNA methylation from blood or peripheral blood mononuclear cells (PBMCs): intrinsic and extrinsic epigenetic measures, which are independent of, or enhanced by blood cell count information, respectively. We define intrinsic epigenetic age acceleration (IEAA) as the residual resulting from regressing epigenetic age on chronological age and measures of blood cell counts (Methods). By definition, IEAA is not correlated with chronological age and is weakly correlated with estimated measures of blood cell counts (Supplementary Table 4). IEAA is meant to capture cell-intrinsic properties of the aging process that exhibit some pre-
servation across various cell types and organs. Compared to our other measures of age acceleration, IEAA, adapted from the Horvath measure of epigenetic age, exhibited significant correlations with epigenetic age acceleration in breast tissue (r=0.48, p=0.0011, Figure 1B) and saliva (r=0.67, p=8.8x10⁻⁹, Figure 1F). By contrast, an analogous measure of IEAA based on the Hannum measure showed much weaker correlations (r=0.073 in breast and r=0.41 in saliva Figure 1D, 1H). For this reason, we focused on the Horvath measure of IEAA. The age-related changes to blood cell composition (Supplementary Table 4) can be leveraged to capture aspects of immunosenescence. Using these measures, we derived a novel extrinsic epigenetic age acceleration (EEAA) measure by up-weighting the blood cell count contributions of AgeAccelHannum (Methods and Supplementary Table 4). Descriptive statistics (minimum, maximum, median) of the measures of epigenetic age acceleration can be found in Supplementary Table 3. Cox regression models of all-cause mortality We used Cox regression models to assess the predictive value of our measures of epigenetic age acceleration for all-cause mortality. All of our Cox models were adjusted
Figure 2. Univariate Cox regression meta‐analysis of all‐cause mortality. A univariate Cox regression model was used to relatethe censored survival time (time to all‐cause mortality) to (A) the universal measure of age acceleration (AgeAccel), (B) intrinsicepigenetic age acceleration (IEAA), (C) extrinsic epigenetic age acceleration (EEAA). The rows correspond to the differentcohorts. Each row depicts the hazard ratio and a 95% confidence interval. The coefficient estimates from the respective studieswere meta‐analyzed using a fixed‐effect model weighted by inverse variance (implemented in the metafor R package [34]). It isnot appropriate to compare the hazard ratios and confidence intervals of the different measures directly because the measureshave different scales/distributions. However, it is appropriate to compare the meta analysis p values (red sub‐title of each plot).The p‐value of the heterogeneity test (Cochran's Q‐test) is significant if the cohort‐specific estimates differed substantially.
www.aging‐us.com 1849 AGING (Albany NY)

for the age at baseline (blood draw). Additional multivariate models further adjusted for covariates assessed at baseline (chronological age, body mass index,
educational level, alcohol intake, smoking pack-years, prior history of diabetes, prior history of cancer, hyper-tension status, self-reported recreational physical activity).
Figure 3. Multivariate Cox regression meta‐analysis adjusted for clinical covariates. A multivariate Cox regression model wasused to relate the censored survival time (time to all‐cause mortality) to (A) the universal measure of age acceleration (AgeAccel), (B)intrinsic epigenetic age acceleration (IEAA), (C) extrinsic epigenetic age acceleration (EEAA). The multivariate Cox regression modelincluded the following additional covariates: chronological age, body mass index (category), educational level (category), alcohol intake,smoking pack years, prior history of diabetes, prior history of cancer, hypertension status, recreational physical activity (category). Therows correspond to the different cohorts. Each row depicts the hazard ratio and a 95% confidence interval. The coefficient estimatesfrom the respective studies were meta‐analyzed using a fixed‐effect model weighted by inverse variance (implemented in the metafor Rpackage [34]). The sub‐title of each plot reports the meta‐analysis p‐value and a heterogeneity test p‐value (Cochran's Q‐test).
50 55 60 65 70 75 80 85
0.00
0.05
0.10
AgeAccel, T=-0.64, P=0.53
Median Age (years)
ln H
R
WHI White
WHI Black
WHI HispanicLBC 1921LBC 1936
NAS
ARIC Black
FHSKORA InCHIANTI
Rotterdam
TwinsUK
BLSA White
A
50 55 60 65 70 75 80 85
0.00
0.05
0.10
IEAA, T=-0.77, P=0.46
Median Age (years)
ln H
R
WHI White
WHI BlackWHI Hispanic LBC 1921LBC 1936
NAS
ARIC BlackFHS
KORA InCHIANTIRotterdamTwinsUK
BLSA White
B
50 55 60 65 70 75 80 85
0.00
0.05
0.10
EEAA, T=-1.2, P=0.25
Median Age (years)
ln H
R
WHI White
WHI Black
WHI Hispanic
LBC 1921LBC 1936NASARIC Black
FHS
KORA
InCHIANTI
RotterdamTwinsUK
BLSA White
C
5 10 15 20
-0.0
20.
020.
060.
10
AgeAccel, T=-0.86, P=0.41
Follow Up (years)
ln H
R
WHI White
WHI Black
WHI HispanicLBC 1921LBC 1936
NAS
ARIC Blac
FHSKORA InCHIANTI
Rotterdam
TwinsUK
BLSA White
D
5 10 15 20
-0.0
20.
020.
060.
10
IEAA, T=-0.57, P=0.58
Follow Up (years)
ln H
R
WHI White
WHI BlackWHI HispanicLBC 1921LBC 1936
NAS
ARIC BlacFHS
KORA InCHIANTIRotterdam
TwinsUK
BLSA White
E
5 10 15 20
-0.0
20.
020.
060.
10
EEAA, T=-1.2, P=0.27
Follow Up (years)
ln H
R
WHI White
WHI Black
WHI Hispanic
LBC 1921LBC 1936NAS ARIC Blac
FHS
KORA
InCHIANTI
RotterdamTwinsUK
BLSA White
F
Figure 4. Hazard ratio of death versus cohort characteristics. Each circle corresponds to a cohort (data set). Circle sizescorrespond to the square root of the number of observed deaths, because the statistical power of a Cox model is determined by thenumber of observed deaths. (A‐C) The y‐axis of each panel corresponds to the natural log of the hazard ratio (ln HR) of a univariate Coxregression model for all‐cause mortality. Each panel corresponds to a different measure of epigenetic age acceleration (A) universal ageacceleration, (B) intrinsic age acceleration, (C) extrinsic age acceleration. Panels (D‐F) are analogous to those in A‐C but the x‐axiscorresponds to the median age of the subjects at baseline (Table 1). The title of each panel reports the Wald test statistic (T) andcorresponding p‐value resulting from a weighted linear regression model (y regressed on x) where each point (data set) is weighted bythe square root of the number of observed deaths. The dotted red line represents the regression line. The black solid line represents theline of identify (i.e., no association).
www.aging‐us.com 1850 AGING (Albany NY)

Table 3. Subgroup analysis by demographic factors. Age-adjusted Full model Subgroup HR p-value HR p-value Race White 1.05 3.0x10⁻²⁶ 1.03 1.3x10⁻⁵ Black 1.04 7.8x10⁻²⁰ 1.02 7.6x10⁻³ Hispanic 1.05 1.1x10⁻² 1.06 5.3x10⁻² pinteraction 0.62 0.14 Sex Men 1.04 7.1x10⁻¹⁵ 1.03 1.9x10⁻² Women 1.04 3.7x10⁻¹⁰ 1.03 1.9x10⁻⁵ pinteraction 0.63 0.95 Follow-up duration
<5 years 1.02 0.20 0.98 0.79 5-10 years 1.02 1.8x10⁻³ 1.02 0.17 >10 years 1.03 4.5x10⁻⁹ 1.02 4.1x10⁻² pinteraction 0.67 0.84 BMI categories
Underweight 1.11 9.4x10⁻³ 1.04 8.9x10⁻³ Normal 1.06 6.1x10⁻¹⁹ 1.04 2.3x10⁻² Overweight 1.04 1.46x10⁻⁸ 1.03 5.0x10⁻² Obese 1.04 2.2x10⁻¹¹ 1.02 7.1x10⁻² pinteraction 0.05 0.75 Smoking status Never 1.03 6.9x10⁻⁶ 1.04 4.8x10⁻³ Former 1.05 4.2x10⁻²² 1.03 6.3x10⁻⁴ Current 1.06 2.1x10⁻⁴ 1.01 0.47 pinteraction 0.05 0.20 Physical activity status
Yes 1.05 3.8x10⁻⁶ 1.02 1.9x10⁻³ No 1.03 2.5x10⁻² 1.03 2.2x10⁻² pinteraction 0.23 0.65
Age‐adjusted and fully adjusted associations for EEAA to all‐cause mortality by subgroup (rows). The fully adjusted model includes the following covariates: body mass index, educational level, alcohol intake, smoking pack‐years, prior history of diabetes, prior history of cancer, hypertension status, self‐reported recreational physical activity.
www.aging‐us.com 1851 AGING (Albany NY)

Our novel measure of extrinsic age acceleration EEAA led to smaller p-values for the associations with all-cause mortality than the original measure AgeAccelHannum in univariate Cox models (pEEAA=7.5x10-43, pAgeAccelHannum=1.4x10⁻³⁴, Supplementary Figure 1) and in multivariate Cox models (pEEAA=3.4x10⁻¹⁹, pAgeAccelHannum=6x10-15, Supplementary Figure 2). Further, when both EEAA and AgeAccelHannum were included in the same Cox model, only EEAA remained significant in the WHI data and FHS univariate models. Since these results indicate that EEAA outperforms the closely related measure AgeAccelHannum when it comes to mortality prediction, we removed the latter from subsequent analyses. All considered measures of epigenetic age acceleration were predictive of time to death in univariate Cox models (pAgeAccel=1.9x10⁻¹¹, pIEAA=8.2x10⁻⁹, pEEAA=7.5x10-43, Figure 2) and multivariate Cox models adjusting for risk factors and pre-existing disease status (pAgeAccel=5.4x10⁻⁵, pIEAA=5.0x10⁻⁴, pEEAA=3.4x10⁻¹⁹, Figure 3).
Interpreting effect sizes and variance of epigenetic age acceleration Subjects differed substantially in terms of their measures of epigenetic age acceleration, e.g. EEAA ranged from -28 to 28 years in the WHI (standard deviation =6.4 years, Supplementary Table 3). About five percent of the participants of the WHI exhibited an EEAA value larger than 10, which is associated with a 48% increased hazard of death as can be seen from the following calculation. The HR of EEAA is 1.040 if EEAA=1 (Figure 2c) but it is HR=1.48=(1.040)10 if EEAA=10. Negative values of age acceleration were associated with a lower hazard of mortality. For example, 20% of subjects had an EEAA value less than -5, which is associated with an 18% decrease in the hazard of death (HR=0.82=1.04-5). Subgroup analysis With few exceptions, we found that the associations between EEAA and time to death remained highly signi-
Table 4. Subgroup analysis by prevalent disease status. Age-adjusted Full model Subgroup HR p-value HR p-value Cancer status Yes 1.05 2.5x10⁻¹⁰ 1.02 0.18 No 1.05 2.3x10⁻¹³ 1.03 1.7x10⁻⁴ pinteraction 0.92 0.73 Coronary artery disease status
Yes 1.04 2.4x10⁻⁵ 1.01 0.60 No 1.04 1.5x10⁻¹² 1.02 1.5x10⁻⁴ pinteraction 0.43 0.99 Hypertension status Yes 1.04 7.4x10⁻¹⁷ 1.03 2.9x10⁻³ No 1.05 7.1x10⁻⁶ 1.02 8.6x10⁻³ pinteraction 0.41 0.45 Type 2 diabetes status Yes 1.04 8.6x10⁻¹³ 1.03 1.7x10⁻³ No 1.04 1.2x10⁻¹⁰ 1.02 9.3x10⁻³ pinteraction 0.70 0.25
Age‐adjusted and fully adjusted associations for EEAA to all‐cause mortality in different subgroups (rows). The fully adjusted model includes the following covariates: body mass index, educational level, alcohol intake, smoking pack‐years, prior history of diabetes, prior history of cancer, hypertension status, self‐reported recreational physical activity.
www.aging‐us.com 1852 AGING (Albany NY)

ficant in subgroups stratified by race, sex, follow-up duration, body mass index, smoking status, physical activity (Table 3) and in subgroups stratified by prevalent disease at baseline such as cancer, coronary artery disease, hypertension and type 2 diabetes (Table 4). Only one subgroup led to an insignificant finding (p>0.05) in our univariate model analysis: namely subjects with less than 5 years of follow up (Table 3). For multivariate models, we failed to observe significant associations for the following subgroups: i) less than 5 years of follow up, ii) between 5 and 10 years of follow up, iii) current smokers, iv) obese individuals, v) Hispanics, vi) individuals with cancer, and vii) subjects with coronary artery disease. The insignificant results in multivariate models in cancer patients or CAD patients might reflect the relatively low sample sizes or that epigenetic age acceleration is dwarfed by other predictors of mortality in subjects with severe diseases. Hazard ratio estimates remained highly consistent across all subgroups examined. We did not observe significant differences in the estimated hazard ratios across any subgroup (Tables 3 and 4). Specifically, racial/ethnic differences in HR were not observed (interaction p=0.62 in age-adjustment models and p=0.14 in full models). Overall, these subgroup analysis results confirm that epigenetic age acceleration is an independent predictor of earlier mortality even after adjusting for possible confounders and within major subgroups of the population. Hazard ratio of death versus follow up time and median age The large number of cohorts allowed us to relate cohort characteristics (such as median age or median follow up removing time) to strength of association with mortality. We did not find a statistically significant relationship between the hazard ratio of death for the median age of the cohort or the follow up time (Figure 4). Robustness analysis To assess the robustness of our findings, we also carried out a leave-one-out analysis by re-running the metaanalysis after removing data from individual cohorts. The resulting p-values are highly robust with respect to a single data set from the analysis (Supplementary Table 5). In our study, we used a fixed effects meta-analysis method for the sake of consistency with previous analyses [5]. However, our results remain qualitatively the same after using a random effects meta-analysis method (Supplementary Figure 4).
DISCUSSION The current study corroborates previous findings regarding the predictive power of DNA methylation-based biomarkers of age for mortality [5,6,8]. We further examined novel variants of these measures that are either independent of blood cell counts or are enhanced by changes in blood cell sub-populations. We showed that the extrinsic measure EEAA out-performs previous measures of age acceleration when it comes to predicting all-cause mortality. Furthermore, the associations between epigenetic age acceleration and mortality did not differ significantly across subgroups of race/ethnicity, sex, BMI, smoking status, physical activity status, or major chronic diseases. The consistency of the associations across multiple subgroups lends support to the notion that epigenetic age acceleration captures some aspect of biological aging over and above chronological age and other risk factors. The development of suitable measures of biological age has been a key goal in the field of aging research [13]. Many biomarkers of age have been posited including epigenetic alterations of the DNA (e.g., DNA methylation), transcriptomic changes in blood [14], telomere length [15], whole-body function such as gait speed (reviewed in [16]). The current study does not aim to replace existing blood based biomarkers, but rather, we aimed to demonstrate that it complements existing markers. Above all, this study shows that epigenetic age captures an aspect of biological age, as assessed through lifespan, above and beyond chronological age, blood cell composition, and a host of traditional risk factors of mortality. The measures of epigenetic age acceleration are attractive because they are highly robust and because their measurement only involve DNA methylation data. While actual flow cytometry data will always be preferable to imputed blood cell count data (based on DNA methylation data), the measures of age acceleration do not require the measurement of flow data. Rather, measures of intrinsic and extrinsic epigenetic age used blood cell count estimates resulting from DNA methylation data. The measure of extrinsic age acceleration EEAA reflects aspects of immuno-senescence because, by construction, it correlates with age-related changes in blood cell composition, such as T lymphocyte populations, which underlie much of the age-related decline in the protective immune response [9–12]. Thus, the high predictive significance of EEAA for all-cause mortality probably reflects the fact that it assesses multiple aspects of the biological age of the immune system including both changes in blood cell
www.aging‐us.com 1853 AGING (Albany NY)

composition and cell-intrinsic epigenetic changes. It has been known for decades that poor T cell functioning is predictive of mortality [17]. The findings surrounding the predictive utility of intrinsic epigenetic age acceleration are biologically compelling and point to a new frontier in aging research. Our study strongly suggests IEAA is reflective of an intrinsic epigenetic clock that is associated with mortality independent of chronological age, changes in blood cell composition, and traditional risk factors of mortality. IEAA probably captures a cell-type independent component of the aging process for the following reasons. First, IEAA is moderately preserved across different tissues and cell types collected from the same subject (Figure 1). Second, IEAA but not EEAA is predictive of lung cancer [18]. Third, only IEAA and AgeAccel relate to centenarian status [8]. Overall, our results inform the ongoing debate about whether epigenetic biomarkers of age capture an aspect of biological age. While epigenetic processes are unlikely to be the only mediators of chronological age on mortality—in fact, multiple risk factors have stronger effects on mortality—our results suggest that at least one of the mediating processes relates to the epigenetic age of blood tissue and that this process is independent of age-dependent changes in blood cell composition. Future studies will be useful for gaining a mechanistic understanding of this intrinsic epigenetic aging process. MATERIALS AND METHODS Measures of epigenetic age We used an epigenetic biomarker of age based on 353 CpG markers as one measure of epigenetic age because: a) it is an accurate measurement of age across multiple tissues [3]; b) we previously showed that it is predictive of all-cause mortality [5]; c) it correlated with measures of cognitive/physical fitness and neuro-pathology in the elderly [19,20]; and d) it was associated with conditions that are of interest in aging research including Down's syndrome [21], Huntington's disease [22], Parkinson's disease [23], obesity [24], HIV infection [25], menopause [26], centenarian status [27], ethnicity and sex [28], and cellular senescence [3,29]. This epigenetic age estimator not only lends itself to measuring aging effects in elderly subjects; but also applies to prenatal brain samples [30] and blood samples from minors [31]. Epigenetic age is defined as the predicted value of age based on the DNA methylation levels of 353 CpGs. Mathematical details and software tutorials for estimating epigenetic age can be found in the additional
files of [3]. All of the described epigenetic measures of aging and age acceleration are implemented in our freely available software (https://dnamage.genetics. ucla.edu) [3]. DNA methylation age estimate by Hannum et al (2013) We also used an alternative measure of epigenetic age developed by Hannum et al (2013) [2]. The resulting age estimate is based on the 71 CpGs and coefficient values from the third supplementary table [2]. The authors developed this age prediction method by using an elastic net regression model for predicting chronological age based on DNA methylation levels from whole blood. Measures of epigenetic age acceleration Table 2 provides an overview of our measures of epigenetic age acceleration. The universal measure of age acceleration (AgeAccel), which is valid for a wide range of tissue types, is defined as the residual resulting from a linear regression model that regresses the Horvath estimate of epigenetic age on chronological age. Thus, a positive value for AgeAccel indicates that the observed epigenetic age is higher than that predicted, based on chronological age. AgeAccel has a relatively weak correlation with blood cell counts [25], but it still relates to estimated blood cell counts, as seen in Supplementary Table 4. To estimate "pure" epigenetic aging effects that are not influenced by differences in blood cell counts ("intrinsic" epigenetic age acceleration, IEAA), we obtained the residual resulting from a multivariate regression model of epigenetic age on chronological age and various blood immune cell counts (naive CD8+ T cells, exhausted CD8+ T cells, plasmablasts, CD4+ T cells, natural killer cells, monocytes, and granulocytes) imputed from methylation data. Extrinsic epigenetic age acceleration measures capture both cell intrinsic methylation changes and extracellular changes in blood cell composition. Our measure of EEAA is defined using the following three steps. First, we calculated the epigenetic age measure from Hannum et al [2], which already correlated with certain blood cell types [5]. Second, we increased the contribution of immune blood cell types to the age estimate by forming a weighted average of Hannum’s estimate with 3 cell types that are known to change with age: naïve (CD45RA+CCR7+) cytotoxic T cells, exhausted (CD28-CD45RA-) cytotoxic T cells, and plasmablasts using the Klemera-Doubal approach [32]. The weights
www.aging‐us.com 1854 AGING (Albany NY)

used in the weighted average are determined by the correlation between the respective variable and chronological age [32]. The weights were chosen on the basis of the WHI data. Thus, the same (static) weights were used for all data sets. EEAA was defined as the residual variation resulting from a univariate model regressing the resulting age estimate on chronological age. By construction, EEAA is positively correlated with the estimated abundance of exhausted CD8+ T cells, plasmablast cells, and a negative correlated with naive CD8+ T cells. Blood cell counts were estimated based on DNA methylation data as described in the next section. By construction, the measures of EEAA track both age related changes in blood cell composition and intrinsic epigenetic changes. None of our four measures of epigenetic age acceleration are correlated with chronological age. Estimating blood cell counts based on DNA methylation levels We estimate blood cell proportions using two different software tools. Houseman's estimation method [33], which is based on DNA methylation signatures from purified leukocyte samples, was used to estimate the proportions of cytotoxic (CD8+) T cells, helper (CD4+) T, natural killer, B cells, and granulocytes. The software does not allow us to identify the type of granulocytes in blood (neutrophil, eosinophil, or basophil) but we note that neutrophils tend to be the most abundant granulocyte (~60% of all blood cells compared with 0.5-2.5% for eosinophils and basophils). To estimate the percentage of exhausted CD8+ T cells (defined as CD28-CD45RA-), plasmablasts, and the number (count) of naïve CD8+ T cells (defined as CD45RA+CCR7+), we used the "Horvath method" [25], which is implemented in the advanced analysis option of the epigenetic age calculator software [3]. We and others have shown that imputed blood cell counts have moderately high correlations with corresponding flow cytometric data, e.g. r=0.86 for naïve CD4+ T cells, r=0.68 for naïve CD8+T, and r=0.49 for exhausted CD8+ T cells [28]. Cox regression models and meta-analysis Here, we used Cox models for analyzing the censored survival time data (from the age at blood draw until age at death or last follow-up). We regressed the censored survival times on covariates using Cox regression models implemented in the R function coxph in the survival package. The resulting coefficient values (interpreted as log hazard ratios) and standard errors were combined using the R software package metafor [34]. The meta-analysis was carried out with the R
command rma (with arguments method="FE" to get fixed effects estimates). The forest plots were created using the R function forest (with argument atransf=exp to exponentiate the estimate of the log hazard ratios). Sample exclusions In addition to cohort-specific quality checks, we further excluded individuals who had ever been diagnosed with leukemia (ICD-9: 203-208), reported receiving chemotherapy, and whose methylation beta value distributions deviated substantially from a gold standard (according to the quality statistic corSampleVSgold standard<0.80 from the online age calculator [35–37]). ACKNOWLEDGEMENTS Acknowledgement ARIC The Atherosclerosis Risk in Communities Study is carried out as a collaborative study supported by National Heart, Lung, and Blood Institute contracts (HHSN268201100005C, HHSN268201100006C, HHSN268201100007C, HHSN268201100008C, HHSN268201100009C, HHSN268201100010C, HHSN268201100011C, and HHSN268201100012C). The authors thank the staff and participants of the ARIC study for their important contributions. Methylation profiling of the ARIC samples was also supported by the National Institutes of Health (NIH) American Recovery and Reinvestment Act of 2009 (ARRA) Building on GWAS for NHLBI-diseases: the U.S. CHARGE consortium (5RC2HL102419) (PI: E. Boerwinkle). Acknowledgement Rotterdam This study was funded by The Netherlands Society for Scientific Research (NWO) VIDI Grant 917103521. The Rotterdam Study is funded by Erasmus Medical Center and Erasmus University, Rotterdam, Netherlands Organization for the Health Research and Development (ZonMw), the Netherlands Organization of Scientific Research NWO Investments (nr. 175.010.2005.011, 911-03-012), the Research Institute for Diseases in the Elderly (014-93-015; RIDE2), the Ministry of Education, Culture and Science, the Ministry for Health, Welfare and Sports, the European Commission (DG XII), and the Municipality of Rotterdam. The generation and management of the Illumina 450K methylation array data for the Rotterdam Study were executed by the Human Genotyping Facility of the Genetic Laboratory of the Department of Internal Medicine, Erasmus MC, the Netherlands. The methylation data was funded by the Genetic Laboratory of the Department of Internal Medicine, Erasmus MC,
www.aging‐us.com 1855 AGING (Albany NY)
and by the Netherlands Organization for Scientific Research (NWO; project number 184021007) and made available as a Rainbow Project (RP3; BIOS) of the Biobanking and Biomolecular Research Infrastructure Netherlands (BBMRI-NL). The authors are grateful to the study participants, the staff from the Rotterdam Study and the participating general practitioners and pharmacists. We thank Mr. Michael Verbiest, Ms. Mila Jhamai, Ms. Sarah Higgins, Mr. Marijn Verkerk, for their help in creating the methylation database. Acknowledgement KORA The KORA study was initiated and financed by the Helmholtz Zentrum München – German Research Center for Environmental Health, Neuherberg, Germany and supported by grants from the German Federal Ministry of Education and Research (BMBF), by the State of Bavaria, the Federal Ministry of Health (Berlin, Germany), the Ministry of Innovation, Science, Research and Technology of the state North Rhine-Westphalia (Düsseldorf, Germany), and the Munich Center of Health Sciences (MC Health) as part of LMUinnovativ. The work is partly supported by grants from the European Union’s Seventh Framework Program (FP7-Health) under grant agreement no. 305280 (MIMOmics) and by the BMBF: e:Med project: e:AtheroSysMed - Systems medicine of myocardial infarction and stroke, as well as a Grant from the GIF, the German-Israeli Foundation for Scientific Research and Development. Acknowledgements Lothian Birth Cohorts We thank the cohort participants and team members who contributed to these studies. This work was supported by multiple sources. Phenotype collection in the Lothian Birth Cohort 1921 was supported by the UK’s Biotechnology and Biological Sciences Research Council (BBSRC), The Royal Society and The Chief Scientist Office of the Scottish Government. Phenotype collection in the Lothian Birth Cohort 1936 was supported by Age UK (The Disconnected Mind project). Methylation typing was supported by Centre for Cognitive Ageing and Cognitive Epidemiology (Pilot Fund award), Age UK, The Wellcome Trust Institutional Strategic Support Fund, The University of Edinburgh, and The University of Queensland. REM, IJD and PMV are members of the University of Edinburgh Centre for Cognitive Ageing and Cognitive Epidemiology (CCACE). CCACE is supported by funding from the BBSRC, the Medical Research Council (MRC), and the University of Edinburgh as part of the cross-council Lifelong Health and Wellbeing initiative (MR/K026992/1).
Acknowledgement Framingham Heart Study The Framingham Heart Study is funded by National Institutes of Health contract N01-HC-25195 and HHSN268201500001I. The laboratory work for this investigation was funded by the Division of Intramural Research, National Heart, Lung, and Blood Institute, National Institutes of Health. The analytical component of this project was funded by the Division of Intramural Research, National Heart, Lung, and Blood Institute, and the Center for Information Technology, National Institutes of Health, Bethesda, MD. JMM and KLL were supported by R01AG029451. This work utilized the computational resources of the NIH HPC Biowulf cluster. (http://hpc.nih.gov). The views expressed in this manuscript are those of the authors and do not necessarily represent the views of the National Heart, Lung, and Blood Institute; the National Institutes of Health; or the U.S. Department of Health and Human Services. Acknowledgement WHI The generation of the WHI was supported by NIH/NHLBI 60442456 BAA23 (Assimes, Absher, Horvath). SH, ML, ATL were supported by NIH/NIA 5R01AG042511-02 (Horvath, Levine) and NIH/NIA 1U34AG051425-01 (Horvath). The WHI program is funded by the National Heart, Lung, and Blood Institute, National Institutes of Health, U.S. Department of Health and Human Services through contracts HHSN268201100046C, HHSN268201100001C, HHSN268201100002C, HHSN268201100003C, HHSN268201100004C, and HHSN271201100004C. We would like to acknowledge the following WHI investigators. Program Office: (National Heart, Lung, and Blood Institute, Bethesda, Maryland) Jacques Rossouw, Shari Ludlam, Dale Burwen, Joan McGowan, Leslie Ford, and Nancy Geller. Clinical Coordinating Center: Clinical Coordinating Center: (Fred Hutchinson Cancer Research Center, Seattle, WA) Garnet Anderson, Ross Prentice, Andrea LaCroix, and Charles Kooperberg Investigators and Academic Centers: (Brigham and Women's Hospital, Harvard Medical School, Boston, MA) Barbara V. Howard; (Stanford Prevention Research Center, Stanford, CA) Marcia L. Stefanick; (The Ohio State University, Columbus, OH) Rebecca Jackson; (University of Arizona, Tucson/Phoenix, AZ) Cynthia A. Thomson; (University at Buffalo, Buffalo, NY) Jean Wactawski-Wende; (University of Florida, Gainesville/Jacksonville, FL) Marian Limacher; (University of Iowa, Iowa City/Davenport, IA) Robert Wallace; (University of Pittsburgh, Pittsburgh, PA) Lewis Kuller; (Wake Forest University School of Medicine, Winston-Salem, NC) Sally Shumaker. Women’s Health Initiative Memory Study: (Wake
www.aging‐us.com 1856 AGING (Albany NY)

Forest University School of Medicine, Winston-Salem, NC) Sally Shumaker. Acknowledgement TwinsUK We would like to thank all the twins and family members in the TwinsUK cohort. Support for this work was obtained from the European Research Council (ERC 250157) and in part from the TwinsUK resource, which is funded by the Wellcome Trust; the European Community’s Seventh Framework Programme (FP7/2007–2013); and the National Institute for Health Research (NIHR) BioResource, Clinical Research Facility and Biomedical Research Centre based at Guy’s and St Thomas’ NHS Foundation Trust and King’s College London. AUTHOR CONTRIBUTIONS All co-authors contributed data or analyzed the data or helped interpret the findings or helped write the article. BHC coordinated the analysis of the cohort studies and created the software code. SH, D. Levy, A. Baccarelli, J van Meurs, J. Bell, A. Peters, I. Deary, J. Pankow, L. Ferrucci, led cohort studies of this effort. SH developed and implemented the novel measures of epigenetic age acceleration and wrote the first draft of the article. FUNDING This work was supported by NIH/NIA 1U34AG051425-01 and by grants mentioned in the acknowledgement section. The United States Department of Veterans Affairs (VA) Normative Aging Study (NAS) is supported by the Cooperative Studies Program/ERIC and is a research component of the Massachusetts Veterans Epidemiology Research and Information Center (MAVERIC), Boston Massachusetts. CONFLICTS OF INTEREST The Regents of the University of California is the sole owner of a provisional patent application directed at the invention of measures of epigenetic age acceleration for which SH is a named inventor. The other authors declare no conflicts of interest. REFERENCES 1. Bocklandt S, Lin W, Sehl ME, Sánchez FJ, Sinsheimer
JS, Horvath S, Vilain E. Epigenetic predictor of age. PLoS One. 2011; 6:e14821. doi.org/10.1371/journal. pone.0014821
2. Hannum G, Guinney J, Zhao L, Zhang L, Hughes G, Sadda S, Klotzle B, Bibikova M, Fan JB, Gao Y, Deconde R, Chen M, Rajapakse I, et al. Genome‐wide
methylation profiles reveal quantitative views of human aging rates. Mol Cell. 2013; 49:359–67. doi.org/10.1016/j.molcel.2012.10.016
3. Horvath S. DNA methylation age of human tissues and cell types. Genome Biol. 2013; 14:R115. doi.org/10.1186/gb‐2013‐14‐10‐r115
4. Lin Q, Weidner CI, Costa IG, Marioni RE, Ferreira MR, Deary IJ, Wagner W. DNA methylation levels at individual age‐associated CpG sites can be indicative for life expectancy. Aging (Albany NY). 2016; 8:394–401.doi.org/10.18632/aging.100908
5. Marioni RE, Shah S, McRae AF, Chen BH, Colicino E, Harris SE, Gibson J, Henders AK, Redmond P, Cox SR, Pattie A, Corley J, Murphy L, et al. DNA methylation age of blood predicts all‐cause mortality in later life. Genome Biol. 2015; 16:25. doi.org/10.1186/s13059‐015‐0584‐6
6. Christiansen L, Lenart A, Tan Q, Vaupel JW, Aviv A, McGue M, Christensen K. DNA methylation age is associated with mortality in a longitudinal Danish twin study. Aging Cell. 2016; 15:149–54. doi.org/10.1111/acel.12421
7. Perna L, Zhang Y, Mons U, Holleczek B, Saum K‐U, Brenner H. Epigenetic age acceleration predicts cancer, cardiovascular, and all‐cause mortality in a German case cohort. Clin Epigenetics. 2016; 8:64. doi.org/10.1186/s13148‐016‐0228‐z
8. Horvath S, Pirazzini C, Bacalini MG, Gentilini D, Di Blasio AM, Delledonne M, Mari D, Arosio B, Monti D, Passarino G, De Rango F, D’Aquila P, Giuliani C, et al. Decreased epigenetic age of PBMCs from Italian semi‐supercentenarians and their offspring. Aging (Albany NY). 2015; 7:1159–70. doi.org/10.18632/aging.100861
9. Fagnoni FF, Vescovini R, Passeri G, Bologna G, Pedrazzoni M, Lavagetto G, Casti A, Franceschi C, Passeri M, Sansoni P. Shortage of circulating naive CD8(+) T cells provides new insights on immuno‐deficiency in aging. Blood. 2000; 95:2860–68.
10. Franceschi C. Inflammaging as a major characteristic of old people: can it be prevented or cured? Nutr Rev. 2007; 65:S173–76. doi.org/10.1301/nr.2007.dec. S173‐S176
11. Franceschi C, Bonafè M, Valensin S, Olivieri F, De Luca M, Ottaviani E, De Benedictis G. Inflamm‐aging. An evolutionary perspective on immunosenescence. Ann N Y Acad Sci. 2000; 908:244–54. doi.org/10.1111/j.1749‐6632.2000.tb06651.x
12. Miller RA. The aging immune system: primer and prospectus. Science. 1996; 273:70–74.
doi.org/10.1126/science.273.5271.70
www.aging‐us.com 1857 AGING (Albany NY)

13. Baker GT 3rd, Sprott RL. Biomarkers of aging. Exp Gerontol. 1988; 23:223–39. doi.org/10.1016/0531‐5565(88)90025‐3
14. Peters MJ, Joehanes R, Pilling LC, Schurmann C, Conneely KN, Powell J, Reinmaa E, Sutphin GL, Zhernakova A, Schramm K, Wilson YA, Kobes S, Tukiainen T, et al, and NABEC/UKBEC Consortium. The transcriptional landscape of age in human peripheral blood. Nat Commun. 2015; 6:8570. doi.org/10.1038/ncomms9570
15. Sanders JL, Newman AB. Telomere length in epidemiology: a biomarker of aging, age‐related disease, both, or neither? Epidemiol Rev. 2013; 35:112–31. doi.org/10.1093/epirev/mxs008
16. Sanders J, Boudreau R, Newman A. 2012. Understanding the Aging Process Using Epidemiologic Approaches. (Dordrecht Heidelberg New York: Springer).
17. Roberts‐Thomson IC, Whittingham S, Youngchaiyud U, Mackay IR. Ageing, immune response, and mortality. Lancet. 1974; 2:368–70.
doi.org/10.1016/S0140‐6736(74)91755‐3
18. Levine ME, Hosgood HD, Chen B, Absher D, Assimes T, Horvath S. DNA methylation age of blood predicts future onset of lung cancer in the women’s health initiative. Aging (Albany NY). 2015; 7:690–700. doi.org/10.18632/aging.100809
19. Marioni RE, Shah S, McRae AF, Ritchie SJ, Muniz‐Terrera G, Harris SE, Gibson J, Redmond P, Cox SR, Pattie A, Corley J, Taylor A, Murphy L, et al. The epigenetic clock is correlated with physical and cognitive fitness in the Lothian Birth Cohort 1936. Int J Epidemiol. 2015; 44:1388–96. doi.org/10.1093/ije/dyu277
20. Levine ME, Lu AT, Bennett DA, Horvath S. Epigenetic age of the pre‐frontal cortex is associated with neuritic plaques, amyloid load, and Alzheimer’s disease related cognitive functioning. Aging (Albany NY). 2015; 7:1198–211. doi.org/10.18632/aging.100 864
21. Horvath S, Garagnani P, Bacalini MG, Pirazzini C, Salvioli S, Gentilini D, Di Blasio AM, Giuliani C, Tung S, Vinters HV, Franceschi C. Accelerated epigenetic aging in Down syndrome. Aging Cell. 2015; 14:491–95. doi.org/10.1111/acel.12325
22. Horvath S, Langfelder P, Kwak S, Aaronson J, Rosinski J, Vogt TF, Eszes M, Faull RL, Curtis MA, Waldvogel HJ, Choi OW, Tung S, Vinters HV, et al. Huntington’s disease accelerates epigenetic aging of human brain and disrupts DNA methylation levels. Aging (Albany NY). 2016; 8:1485–512.
doi.org/10.18632/aging.101005
23. Horvath S, Ritz BR. Increased epigenetic age and granulocyte counts in the blood of Parkinson’s disease patients. Aging (Albany NY). 2015; 7:1130–42. doi.org/10.18632/aging.100859
24. Horvath S, Erhart W, Brosch M, Ammerpohl O, von Schönfels W, Ahrens M, Heits N, Bell JT, Tsai P‐C, Spector TD, Deloukas P, Siebert R, Sipos B, et al. Obesity accelerates epigenetic aging of human liver. Proc Natl Acad Sci USA. 2014; 111:15538–43. doi.org/10.1073/pnas.1412759111
25. Horvath S, Levine AJ. HIV‐1 infection accelerates age according to the epigenetic clock. J Infect Dis. 2015; 212:1563–73. doi.org/10.1093/infdis/jiv277
26. Levine ME, Lu AT, Chen BH, Hernandez DG, Singleton AB, Ferrucci L, Bandinelli S, Salfati E, Manson JE, Quach A, Kusters CD, Kuh D, Wong A, et al. Menopause accelerates biological aging. Proc Natl Acad Sci USA. 2016; 113:9327–32. doi.org/10.1073/pnas.1604558113
27. Horvath S, Mah V, Lu AT, Woo JS, Choi OW, Jasinska AJ, Riancho JA, Tung S, Coles NS, Braun J, Vinters HV, Coles LS. The cerebellum ages slowly according to the epigenetic clock. Aging (Albany NY). 2015; 7:294–306. doi.org/10.18632/aging.100742
28. Horvath S, Gurven M, Levine ME, Trumble BC, Kaplan H, Allayee H, Ritz BR, Chen B, Lu AT, Rickabaugh TM, Jamieson BD, Sun D, Li S, et al. An epigenetic clock analysis of race/ethnicity, sex, and coronary heart disease. Genome Biol. 2016; 17:171. doi.org/10.1186/s13059‐016‐1030‐0
29. Lowe D, Horvath S, Raj K. Epigenetic clock analyses of cellular senescence and ageing. Oncotarget. 2016; 7:8524–31. doi:10.18632/oncotarget.7383.
30. Spiers H, Hannon E, Schalkwyk LC, Smith R, Wong CC, O’Donovan MC, Bray NJ, Mill J. Methylomic trajectories across human fetal brain development. Genome Res. 2015; 25:338–52. doi.org/10.1101/gr.180273.114
31. Walker RF, Liu JS, Peters BA, Ritz BR, Wu T, Ophoff RA, Horvath S. Epigenetic age analysis of children who seem to evade aging. Aging (Albany NY). 2015; 7:334–39. doi.org/10.18632/aging.100744
32. Klemera P, Doubal S. A new approach to the concept and computation of biological age. Mech Ageing Dev. 2006; 127:240–48. doi.org/10.1016/j.mad.2005.10.004
33. Houseman EA, Accomando WP, Koestler DC, Christensen BC, Marsit CJ, Nelson HH, Wiencke JK, Kelsey KT. DNA methylation arrays as surrogate
www.aging‐us.com 1858 AGING (Albany NY)
measures of cell mixture distribution. BMC Bioinformatics. 2012; 13:86. doi.org/10.1186/1471‐2105‐13‐86
34. Viechtbauer W. Conducting Meta‐Analyses in R with the metafor Package. J Stat Softw. 2010; 36:1–48. doi.org/10.18637/jss.v036.i03.
35. Curb JD, McTiernan A, Heckbert SR, Kooperberg C, Stanford J, Nevitt M, Johnson KC, Proulx‐Burns L, Pastore L, Criqui M, Daugherty S, and WHI Morbidity and Mortality Committee. Outcomes ascertainment and adjudication methods in the Women’s Health Initiative. Ann Epidemiol. 2003 (Suppl ); 13:S122–28. doi.org/10.1016/S1047‐2797(03)00048‐6
36. Deary IJ, Gow AJ, Pattie A, Starr JM. Cohort profile: the Lothian Birth Cohorts of 1921 and 1936. Int J Epidemiol. 2012; 41:1576–84. doi.org/10.1093/ije/dyr197
37. Ferrucci L, Bandinelli S, Benvenuti E, Di Iorio A, Macchi C, Harris TB, Guralnik JM. Subsystems contributing to the decline in ability to walk: bridging the gap between epidemiology and geriatric practice in the InCHIANTI study. J Am Geriatr Soc. 2000; 48:1618–25. doi.org/10.1111/j.1532‐5415.2000.tb 03873.x
www.aging‐us.com 1859 AGING (Albany NY)

SUPPLEMENTARY DATA
Supplementary Table 1. Average pairwise correlations between chronological age, epigenetic age based on the Horvath method, and epigenetic age based on Hannum.
Age Epigenetic age (Horvath)
Epigenetic age (Hannum)
Age
- 0.74 0.81
Epigenetic age (Horvath)
0.74 - 0.76
Epigenetic age (Hannum)
0.81 0.76 -
Supplementary Table 2. Correlations between estimated blood cell abundances and chronological age.
Cohort Plasmablasts CD8+CD28-CD45RA-
CD8+ naive
CD4+ naive
CD8+ total
CD4+ total
NK cells B cells Monocytes Granulocytes
ARIC 0.03 0.16 -0.22 -0.13 -0.06 -0.08 0.13 -0.08 0.09 0.04 FHS 0.23 0.36 -0.38 -0.22 -0.19 -0.23 0.20 -0.27 0.17 0.16 InCHIANTI 0.06 0.32 -0.43 -0.34 -0.19 -0.20 0.23 -0.20 0.08 0.11 KORA 0.20 0.48 -0.53 -0.37 -0.07 -0.37 0.12 -0.22 0.20 0.16 LBC1921 0.03 0.03 -0.14 -0.09 0.10 0.01 0.05 -0.07 0.10 -0.07 LBC1936 0.11 0.04 -0.05 -0.09 -0.03 0.00 -0.05 -0.13 -0.09 0.05 NAS 0.04 0.28 -0.21 -0.07 0.01 -0.16 0.12 -0.10 -0.01 0.08 RSIII 0.11 0.20 -0.26 -0.16 -0.10 -0.14 0.06 -0.16 0.14 0.11 TwinsUK -0.02 0.21 -0.35 -0.08 -0.14 0.07 0.27 -0.02 0.10 -0.14 WHI White 0.09 0.21 -0.17 -0.13 -0.13 -0.10 0.17 -0.12 0.10 0.04 WHI Black 0.12 0.24 -0.21 -0.13 -0.07 -0.17 0.16 -0.18 0.11 0.07 WHI Hispanic 0.08 0.26 -0.21 -0.15 -0.11 -0.13 0.17 -0.10 0.03 0.08 MEAN 0.09 0.23 -0.26 -0.16 -0.08 -0.12 0.14 -0.14 0.09 0.06 The values shown are robust correlation coefficients (biweight midcorrelation, which is based on medians). Colors reflect the direction and magnitude of the correlation coefficients (blue=negative correlation, red=positive correlation).
www.impactaging.com 1860 AGING (Albany NY)

www.impactaging.com 1861 AGING (Albany NY)
Supplementary Table 3. Descriptive statistics of measures of epigenetic age acceleration by cohort. Epigenetic age acceleration measure
Cohort SD Min 25th percentile
Median (50th percentile)
75th percentile
Max
AgeAccel ARIC 5.081 -34.380 -3.191 -0.100 3.220 25.620 AgeAccel FHS 4.621 -16.490 -3.110 -0.367 2.460 35.160 AgeAccel InCHIANTI 4.999 -33.600 -3.084 -0.338 2.223 29.770 AgeAccel KORA 4.937 -24.810 -3.423 -0.117 2.905 20.660 AgeAccel LBC1921 6.971 -24.240 -3.884 -0.170 3.943 39.730 AgeAccel LBC1936 6.485 -30.160 -3.879 0.116 3.801 42.100 AgeAccel NAS 5.365 -16.930 -3.706 -0.498 2.909 32.830 AgeAccel RSIII 6.003 -18.570 -4.325 -0.046 4.276 20.050 AgeAccel TwinsUK 4.108 -13.760 -2.514 0.274 2.899 13.560 AgeAccel WHI (white) 5.153 -22.560 -2.843 -0.103 3.443 22.790 AgeAccel WHI (Black) 6.091 -21.900 -5.424 -1.977 1.824 39.930 AgeAccel WHI (Hispanic) 4.494 -14.080 -3.831 -0.535 2.458 14.790 AgeAccel BLSA 4.828 -11.620 -2.966 0.290 3.197 25.180 AgeAccel ARIC 5.914 -38.770 -3.766 0.105 3.648 39.350 AgeAccelHannum FHS 5.279 -23.480 -3.303 -0.174 3.001 36.680 AgeAccelHannum InCHIANTI 6.028 -43.640 -3.152 0.431 3.573 31.490 AgeAccelHannum KORA 4.996 -30.280 -3.266 -0.314 2.711 37.410 AgeAccelHannum LBC1921 7.203 -25.140 -4.574 -0.821 3.722 51.840 AgeAccelHannum LBC1936 6.670 -27.520 -4.172 0.131 4.183 31.650 AgeAccelHannum NAS 5.161 -12.250 -3.310 -0.787 2.511 22.750 AgeAccelHannum RSIII 6.090 -18.600 -3.825 0.115 4.152 17.970 AgeAccelHannum TwinsUK 5.246 -17.040 -2.949 0.320 3.821 20.260 AgeAccelHannum WHI (white) 5.557 -23.460 -3.644 -0.086 3.441 21.760 AgeAccelHannum WHI (Black) 6.317 -23.490 -4.773 -0.891 3.045 31.480 AgeAccelHannum WHI (Hispanic) 5.357 -12.740 -2.139 1.133 4.469 20.880 AgeAccelHannum BLSA 5.709 -15.720 -2.942 0.429 3.801 31.730 AgeAccelHannum ARIC 4.928 -34.020 -3.010 -0.057 3.068 23.810 IEAA FHS 4.491 -16.010 -2.901 -0.199 2.547 32.160 IEAA InCHIANTI 4.783 -30.930 -2.898 -0.374 2.364 29.470 IEAA KORA 4.647 -29.350 -3.276 -0.114 2.761 18.740 IEAA LBC1921 6.228 -22.890 -3.664 0.135 3.554 24.600 IEAA LBC1936 6.162 -26.310 -3.596 0.035 3.718 34.090 IEAA NAS 4.929 -24.190 -3.019 -0.458 2.694 22.500 IEAA RSIII 5.130 -16.610 -3.330 -0.026 3.387 15.190 IEAA TwinsUK 4.016 -14.590 -2.257 0.234 2.718 13.100 IEAA WHI (white) 4.797 -21.460 -2.608 0.183 3.287 21.440

Supplementary Table 4. Pairwise correlations (mean and standard error (SE) across cohorts) between blood cell counts estimated from DNA methylation profiles (rows) and several measures of epigenetic age acceleration (columns).
AgeAccel IEAA EEAA AgeAccelHannum IEAA.Hannum BloodCell average r (SE) average r (SE) average r (SE) average r (SE) average r (SE) Plasma Blast 0.02 (0.031) 0 (0.002) 0.28 (0.034) 0.20 (0.033) 0 (0.018) Exhausted CD8+ 0.18 (0.039) 0 (0.009) 0.50 (0.033) 0.29 (0.044) 0 (0.046) CD8.naive -0.18 (0.043) 0 (0.011) -0.52 (0.04) -0.35 (0.048) 0 (0.05) CD4.naive -0.09 (0.033) 0.07 (0.017) -0.36 (0.038) -0.28 (0.041) 0.06 (0.046) CD8T 0.19 (0.026) 0 (0.023) 0 (0.046) 0 (0.041) -0.01 (0.024) CD4T -0.20 (0.032) 0 (0.004) -0.46 (0.034) -0.34 (0.036) 0 (0.026) NK 0.13 (0.026) 0 (0.002) 0.17 (0.042) 0.10 (0.042) 0 (0.03) Bcell -0.08 (0.051) -0.11 (0.028) -0.05 (0.068) -0.01 (0.061) -0.02 (0.035) Monocyte 0.05 (0.026) 0 (0.006) 0.12 (0.042) 0.07 (0.04) 0 (0.019) Granulocyte -0.03 (0.033) 0 (0.005) 0.16 (0.049) 0.14 (0.042) 0 (0.018)
AgeAccel=univeral measure of age acceleration based on Horvath estimate. IEAA=intrinsic epigenetic age acceleration based on the Horvath estimate. EEAA = extrinsic epigenetic age acceleration which is an enhanced version of the Hannum estimate. AgeAccelHannum=univeral measure of age acceleration based on the Hannum estimate. IEAA.Hannum=intrinsic epigenetic age acceleration based on Hannum estimate. By design, the intrinsic measures have only weak correlations with blood cell counts. By contrast, AgeAccelHannum and EEAA have moderately strong correlations with blood cell counts.
IEAA WHI (Black) 5.588 -20.320 -3.202 0.067 3.197 42.660 IEAA WHI (Hispanic) 4.333 -13.520 -3.971 -1.397 1.864 12.480 IEAA BLSA 4.488 -10.370 -2.658 0.017 3.330 23.120 EEAA ARIC 6.673 -32.940 -4.096 0.135 4.149 38.560 EEAA FHS 5.800 -26.100 -3.607 0.113 3.315 38.250 EEAA InCHIANTI 6.710 -44.360 -3.327 0.576 4.236 33.630 EEAA KORA 5.405 -26.610 -3.526 -0.339 3.189 37.600 EEAA LBC1921 7.745 -21.180 -5.262 -0.973 4.306 52.120 EEAA LBC1936 7.116 -30.590 -4.439 0.168 4.589 31.530 EEAA NAS 5.596 -13.730 -3.443 -0.579 2.987 23.540 EEAA RSIII 6.861 -22.380 -4.392 0.267 4.794 21.080 EEAA TwinsUK 5.840 -22.790 -3.409 0.401 4.023 23.020 EEAA WHI (white) 6.089 -22.710 -3.888 0.015 4.008 22.320 EEAA WHI (Black) 6.906 -27.600 -5.735 -1.382 2.827 27.900 EEAA WHI (Hispanic) 5.779 -14.310 -1.679 2.371 5.651 23.450 EEAA BLSA 6.256 -18.040 -3.435 0.921 4.724 29.230
www.impactaging.com 1862 AGING (Albany NY)
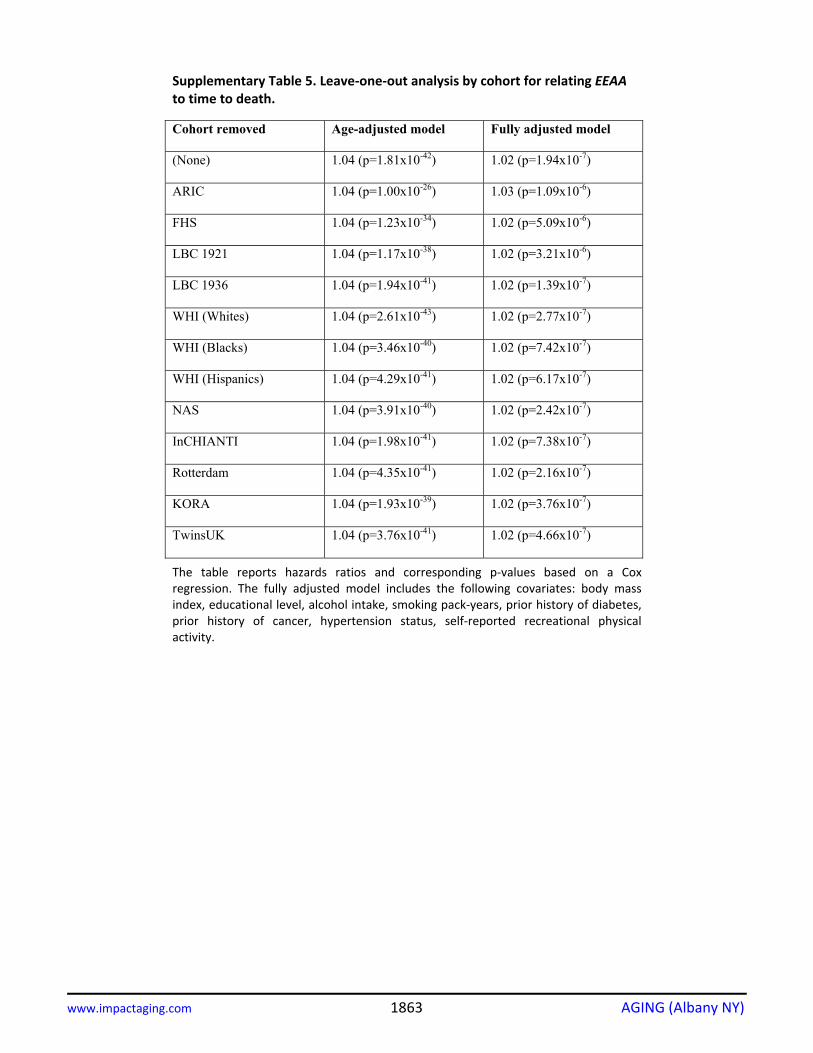
Supplementary Table 5. Leave‐one‐out analysis by cohort for relating EEAA to time to death.
Cohort removed Age-adjusted model Fully adjusted model
(None) 1.04 (p=1.81x10-42) 1.02 (p=1.94x10⁻⁷)
ARIC 1.04 (p=1.00x10⁻²⁶) 1.03 (p=1.09x10⁻⁶)
FHS 1.04 (p=1.23x10⁻³⁴) 1.02 (p=5.09x10⁻⁶)
LBC 1921 1.04 (p=1.17x10-38) 1.02 (p=3.21x10⁻⁶)
LBC 1936 1.04 (p=1.94x10-41) 1.02 (p=1.39x10⁻⁷)
WHI (Whites) 1.04 (p=2.61x10-43) 1.02 (p=2.77x10⁻⁷)
WHI (Blacks) 1.04 (p=3.46x10-40) 1.02 (p=7.42x10⁻⁷)
WHI (Hispanics) 1.04 (p=4.29x10-41) 1.02 (p=6.17x10⁻⁷)
NAS 1.04 (p=3.91x10-40) 1.02 (p=2.42x10⁻⁷)
InCHIANTI 1.04 (p=1.98x10-41) 1.02 (p=7.38x10⁻⁷)
Rotterdam 1.04 (p=4.35x10-41) 1.02 (p=2.16x10⁻⁷)
KORA 1.04 (p=1.93x10-39) 1.02 (p=3.76x10⁻⁷)
TwinsUK 1.04 (p=3.76x10-41) 1.02 (p=4.66x10⁻⁷)
The table reports hazards ratios and corresponding p‐values based on a Cox regression. The fully adjusted model includes the following covariates: body mass index, educational level, alcohol intake, smoking pack‐years, prior history of diabetes, prior history of cancer, hypertension status, self‐reported recreational physical activity.
www.impactaging.com 1863 AGING (Albany NY)

Supplementary Figure 1. Univariate Cox regression model analysis of all‐cause mortality, contrasting existing and novelmeasures of age acceleration. The rows correspond to the different cohorts. Each row depicts the hazard ratio and a 95%confidence interval. To combine the coefficient estimates from the respective studies into a single estimate, we applied afixed‐effect model weighted by inverse variance (implemented in the metafor R package [30]). (A) This measure of ageacceleration is based on Hannum et al [1]. Specifically, we estimated the age using the 71 CpGs and coefficient values fromHannum. Next, the measure of age acceleration was defined as residuals resulting from regressing the epigenetic ageestimate on chronological age. (B) Extrinsic epigenetic age acceleration (EEAA). The sub‐title of each plot reports the meta‐analysis p‐value and a heterogeneity test p‐value (Cochran's Q‐test). It is not appropriate to compare the hazard ratios andconfidence intervals of the different measures directly because the measures have different scales/distributions. However,it is appropriate to compare the meta‐analysis p‐values (colored in red).
Supplementary Figure 2. Multivariate Cox regression model analysis of all‐cause mortality, contrasting existing and novelmeasures of age acceleration. The multivariate Cox regression model included the following additional covariates: chronological age,body mass index (category), educational level (category), alcohol intake, smoking pack years, prior history of diabetes, prior history ofcancer, hypertension status, recreational physical activity (category). The rows correspond to separate cohorts. Each row depicts thehazard ratio (HR) and a 95% confidence interval. (A) Age acceleration based on Hannum et al [6], (B) Extrinsic epigenetic age acceleration(EEAA). The sub‐title of each plot reports the meta‐analysis p‐value and a heterogeneity test p‐value (Cochran's Q‐test).
www.impactaging.com 1864 AGING (Albany NY)

www.impactaging.com 1865 AGING (Albany NY)
Supplementary Figure 3. Multivariate Cox regression analysis of all‐cause mortality adjusted for blood cell counts andclinical covariates. A multivariate Cox regression model was used to relate the censored survival time (time to all‐cause mortality) to(A) the universal measure of age acceleration (AgeAccel), (B) intrinsic epigenetic age acceleration (IEAA), (C) extrinsic epigenetic ageacceleration (EEAA). The multivariate Cox regression model included blood cell counts (exhausted CD8+ T cells, naïve CD8+, CD4+ T cells,natural killer, monocytes, granulocytes, and plasmablasts) and clinical covariates (chronological age, body mass index, educational level,alcohol intake, smoking pack years, prior history of diabetes, prior history of cancer, hypertension status, recreational physical activity).The rows correspond to the different cohorts. Each row depicts the hazard ratio (HR) and a 95% confidence interval. Estimates weremeta‐analyzed using a fixed‐effect model weighted by inverse variance. The sub‐title of each plot reports the meta‐analysis p‐value and aheterogeneity test p‐value (Cochran's Q‐test).
Supplementary Figure 4. Random effects meta‐analysis for univariate Cox models. The figure is analogous to Figure 2 in ourarticle except that it uses a random‐effects meta‐analysis (DerSimonian‐Laird) instead of a fixed‐effects model. A univariate Coxregression model was used to relate the censored survival time (time to all‐cause mortality) to (A) the universal measure of ageacceleration (AgeAccel), (B) intrinsic epigenetic age acceleration (IEAA), (C) extrinsic epigenetic age acceleration (EEAA). To combine thecoefficient estimates from the respective studies into a single estimate, we applied the DerSimonian‐Laird random effects model. Thesub‐title of each plot reports the meta‐analysis p‐value and a heterogeneity test p‐value (Cochran's Q‐test).