Embed Size (px)
Citation preview
Capacity Development and GovernanceEmpirical Diagnostic Assessments
Building blocks and illustrations of the 3-prongempirical approach to CE diagnostics
Daniel Kaufmann, WBIDraft for preliminary/informal discussion only
Institutional Capacity: From revisiting ‘Capacity Building’to Measuring and Diagnosing Capacity Enhancement
Institutional Capacity unbundling into 3 dimensions:1. Physical capital and hardware (physical
infrastructure, computers, etc.) (K);2. Human and knowledge capital (including
organizational & administrative capital, i.e. the‘institutional software’) (HK), and,
3. Governance and political capital (GPK).
Capacity Enhancement = Changed capacity over time

Empirical Approach to Governance Capacity Diagnostics:Starting point: building from governance diagnostics
1. ‘Macro’: Worldwide Aggregate Governance Indicators: 200countries, 6 components, periodic – it permits broad proxy ofcapacity enhancement
2. ‘Mezzo’: Cross-Country Surveys of Enterprises3. ‘Micro’: Specialized, in-depth, in-country Governance and
Institutional Capacity Diagnostics: Includes surveys of: i) userof public services (citizens); ii) firms, and iii) public officials
• Item #1 above is central for comparative monitoringworldwide and to raise general ‘flags’ on country performance,while on other extreme, item #3 is key as in-depth input toconcrete capacity enhancement strategy/program at thecountry level. Increasingly, however, with improvements ofcross-country enterprise surveys, item #2 can play animportant role in benchmarking and monitoring capacityenhancement as well.

Overall Evidence is Sobering:Progress on Governance is modest at best, so far
• Evidence points to slow, if any, average progressworldwide on key dimensions of governance
• This contrasts with some other developmentaldimensions (e.g. quality of infrastructure; quality ofmath/science education; effective absorption of newtechnologies), where progress is apparent
• At the same time, substantial variation cross-country,even within a region. Some successes.
•And it is early days.

Capacity Enhancement Assessment, Level I:The ‘Macro’ or Aggregate Governance Indicators+
• Some Illustrations from updatedGovernance Indicators database: 200countries, 1996-2002, to be continued
Governance: A working definition – whichcontains much of what is relevant for CE
• Governance is the process and institutions bywhich authority in a country is exercised:
(1) S -- the process by which governments are selected,held accountable, monitored, and replaced;
(2) E -- the capacity of gov’t to manage resources andprovide services efficiently, and to formulate andimplement sound policies and regulations; and,
(3) R -- the respect for the institutions that governeconomic and social interactions among them

Operationalizing Governance:Unbundling its Definition into Components that
can be measured, analyzed, and worked on
Each of the 3 main components of GovernanceDefinition is unbundled into 2 subcomponents:
• Voice and External Accountability• Political Stability and lack of Violence&Terror• Quality Regulatory Framework• Government Effectiveness• Control of Corruption• Rule of Law
We measure these sixgovernance components…

Inputs for Governance Indicators 2002Publisher Publication Source Country Coverage
•Wefa’s DRI/McGraw-Hill Country Risk Review Poll 117 developed and developing
•Business Env. Risk Intelligence BERI Survey 50/115 developed and developing
•Columbia University Columbia U. State Failure Poll 84 developed and developing
•World Bank Country Policy & Institution Assmnt Poll 136 developing
•Gallup International Voice of the People Survey 47 developed and developing
•Business Env. Risk Intelligence BERI Survey 50/115 developed and developing
•EBRD Transition Report Poll 27 transition economies
•Economist Intelligence Unit Country Indicators Poll 115 developed and developing
•Freedom House Freedom in the World Poll 192 developed and developing
•Freedom House Nations in Transit Poll 27 transition economies
•World Economic Forum/CID Global Competitiveness Survey 80 developed and developing
•Heritage Foundation Economic Freedom Index Poll 156 developed and developing
•Latino-barometro LBO Survey 17 developing
•Political Risk Services International Country Risk Guide Poll 140 developed and developing
•Reporters Without Borders Reporters sans frontieres (RSF) Survey 138 developed and developing
•World Bank/EBRD BEEPS Survey 27 transition economies
•IMD, Lausanne World Competitiveness Yearbook Survey 49 developed and developing
•Binghamton Univ. Human Rights Violations Research Survey 140 developed and developing
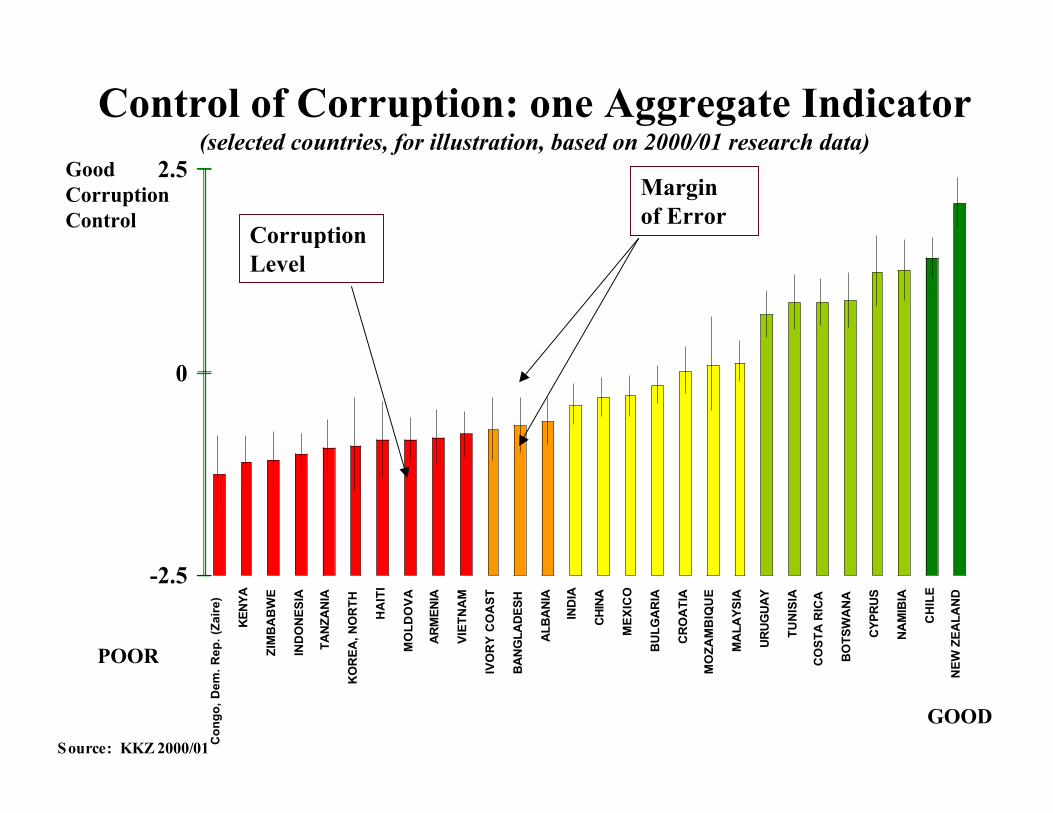
Control of Corruption: one Aggregate Indicator(selected countries, for illustration, based on 2000/01 research data)
-2.5
0
2.5
Co
ng
o,
De
m.
Re
p.
(Za
ire
)
KE
NY
A
ZIM
BA
BW
E
IND
ON
ES
IA
TA
NZ
AN
IA
KO
RE
A, N
OR
TH
HA
ITI
MO
LD
OV
A
AR
ME
NIA
VIE
TN
AM
IVO
RY
CO
AS
T
BA
NG
LA
DE
SH
AL
BA
NIA
IND
IA
CH
INA
ME
XIC
O
BU
LG
AR
IA
CR
OA
TIA
MO
ZA
MB
IQU
E
MA
LA
YS
IA
UR
UG
UA
Y
TU
NIS
IA
CO
ST
A R
ICA
BO
TS
WA
NA
CY
PR
US
NA
MIB
IA
CH
ILE
NE
W Z
EA
LA
ND
Source: KKZ 2000/01
POOR
GOOD
CorruptionLevel
Marginof Error
GoodCorruptionControl

Governance World Map :
Source for data: http://www.worldbank.org/wbi/governance/govdata2002 ; M ap downloaded from : http://info.worldbank.org/governance/kkz2002/govmap.asp
Colors are assigned according to the fol lowing criteria: Red, 25% or less rank worse ( bottom 10% in darker red); Orange, between 25% and 50% ; Yel low,
between 50% and 75% ; Light Green between 75% and 90% ; Dark Green above 90%

Governance World Map:
Source for data: http://www.worldbank.org/wbi/governance/govdata2002 ; M ap downloaded from : http://info.worldbank.org/governance/kkz2002/govmap.asp
Colors are assigned according to the fol lowing criteria: Red, 25% or less rank worse ( bottom 10% in darker red); Orange, between 25% and 50% ; Yel low,
between 50% and 75% ; Light Green between 75% and 90% ; Dark Green above 90%

Governance World Map :
Source for data: http://www.worldbank.org/wbi/governance/govdata2002 ; M ap downloaded from : http://info.worldbank.org/governance/kkz2002/govmap.asp
Colors are assigned according to the fol lowing criteria: Red, 25% or less rank worse ( bottom 10% in darker red); Orange, between 25% and 50% ; Yel low,
between 50% and 75% ; Light Green between 75% and 90% ; Dark Green above 90%

Governance Indicators: Botswana, 1998-2004
Source for data: http://www.worldbank.org/wbi/governance/govdata2002 ; Colors are assigned according to the fol lowing criteria: Dark Red, bottom 10th
percenti le rank; Light Red between 10th and 25th ; Orange, between 25th and 50th ; Yel low, between 50th and 75th ; Light Green between 75th and 90th ;
Dark Green above 90th.

Governance Indicators: Chile 1998 vs. 2004
Source for data: http://www.worldbank.org/wbi/governance/govdata2002 ; Colors are assigned according to the fol lowing criteria: Dark Red, bottom 10th
percenti le rank; Light Red between 10th and 25th ; Orange, between 25th and 50th ; Yel low, between 50th and 75th ; Light Green between 75th and 90th ;
Dark Green above 90th.

Capacity Enhancement Assessment, Level II:The ‘Mezzo’: Cross-country enterprise-based
• Illustrations for 4 countries from newdataset on enterprises from over 100countries
• Enterprise responses from this type ofsurveys permit nowadays an assessment ofkey CE and governance dimensions

Botswana – the ‘Mezzo’ Level of CE Assessment, 22 clusters
0
50
100
Con
trol
of c
orru
ption
Cor
porat
e Res
ponsib/G
over
nance
Dec
entr
aliz
atio
n
Envi
ronm
ent
Finan
cial
Sec
tor Cap
acity
Finan
cial
Gov
ernan
ce
Gov
ernm
ent Effec
tive
ness
Gen
der Equ
ality
Hum
an C
apita
l
Multi
late
ral O
rgan
izat
ions
Qual
ity
of Infr
astr
ucture
Leg
al e
ffec
tive
ness
Qual
ity o
f lab
or m
arket
s
Politi
cal F
inan
cing
Par
liam
ent Effec
tive
ness
Pol
ice
Effec
tive
ness
Politi
cal I
nfluen
ce
Reg
ulato
ry C
apac
ity
Tec
hnolog
y
Tax
effic
iency
Unof
ficia
ldom
Voi
ce &
Acc
ounta
bility
Percen
tile
Ra
nk
(0
-10
0)
Source: EOS 2003 WEF, preliminary. Percentile ranks based on comparative performance among the 103 countries in thesample. All variables rated from 0 (very bad) to 100 (excellent).

Capacity Enhancement Assessment, Level III:In-Country, In-depth CE diagnostic
• A: Illustrations of a number of countries(LAC-focus) in many dimensions
• B: Illustration for one country: The case ofPeru

Index of Transparency
0 10 20 30 40 50 60 70 80
Indonesia (2001)
Paraguay (1999)
Honduras (2001)
Bolivia (1999)
Colombia (2001)
Peru (2001)
Ecuador (2000)
As reported by public officials GoodPoor

Index of Openness
0
10
20
30
40
50
60
70
80
Frequency with which rules and
regulations are announced and opened to
the internal of the institution
Colombia (2001)
Honduras (2001)
Peru (2001)
Bolivia (1999)
Indonesia (2001)
As reported by public officials
High
Low

Index of Quality of Rules(within public administration to manage resources)
0
10
20
30
40
50
60
70
80
90
Indonesia
(2001)
Honduras
(2001)
Bolivia
(1999)
Colombia
(2001)
Peru
(2001)
Ecuador
(2000)
Paraguay
(1999)
As reported by public officials
High
Low

Index of Quality of Rules(to manage personnel and budget resources)
60
62
64
66
68
70
72
74
76
78
80
Colombia (2001) Honduras (2001) Peru (2001)
Personnel
Budget
As reported by public officials
High
Low

Index of Meritocracy(within the public administration to manage human
resources)
0 20 40 60 80 100
Indonesia (2001)
Honduras (2001)
Peru (2001)
Bolivia (1999)
Ecuador (2000)
Colombia (2001)
Paraguay (1999)
As reported by public officials HighLow

Index of Degree of Enforcement(of decisions and regulations within public
administration)
0
10
20
30
40
50
60
70
80
Indonesia
(2001)
Honduras
(2001)
Bolivia
(1999)
Colombia
(2001)
Peru
(2001)
Ecuador
(2000)
Paraguay
(1999)
As reported by public officials
High
Low

Understanding Causal Factors in CE andGovernance Underperformance
• Illustrating the extent to which politicaldeterminants, meritocracy, transparency,and voice and accountability matters

-5
0
5
10
15
20
Low Moderately Low Moderately High High
Politicization
New Diagnostic Tools permit measuring important dimensionsof capacity – illustration #1 from Bolivia diagnostics:
How Politicized Agencies exhibit Budgetary Leakages
Yellow columns depict the unconditional average for each category. Blue line depicts the controlled causal effect fromX to Y variables. Dotted red lines depict the confidence ranges around the causal effect depicted by the blue line.

Public Prosecutor
Electricicy company
Cent. BankM of Fin - Income
National Fin. Corp.
MunicipalityPresidency
M of Fin - Treasury
Attorney General
Congress
Undersec. Of Gov't
Electoral Supreme TribunalCourts
Universities and schools
M of Energy and Mines
M of Fin - BudgetUndersec. Of Social Welfare
Telephone company
National Council of TransitProv. Council
Comptroller
Real Estate Bank
y = -0.05x + 6.05
R2
= 0.50
r=-0.71
1
2
3
4
5
40 50 60 70 80 90 100
Meritocracy in Hiring and Promotion
Public Officials Survey: Meritocracy in the Public Service
Can Help Reduce Corruption
High
Low
Illustration #2: Link between meritocracy and institutional integrity
Source: Ecuador Diagnostic

Citizen Voice Improves Accessibility ofPublic Services to the Poor
Based on Public Officials Survey. The sample of institutions includes 44 national, departmental,and municipal agencies which are a prior anticipated to be accessible to the poor
0
20
40
60
80
100
10 20 30 40 50 60 70 80 90
Voice / External Accountability
Acc
essi
bil
ity t
o t
he
Poor
ControlledCausalLink
r = 0.54

Transparency within Government AgenciesPrevents Purchase of Public Positions
Based on 90 national, departmental, and municipal agencies covered in the Public Officials Survey.
3
6
9
12
15
18
Low Moderately Low Moderately High High
Internal Transparency
Jo
b P
urc
ha
se
Simple Average Association Control Causal Link Margin of Error

We have learnt that InstitutionalQuality Matters Enormously…
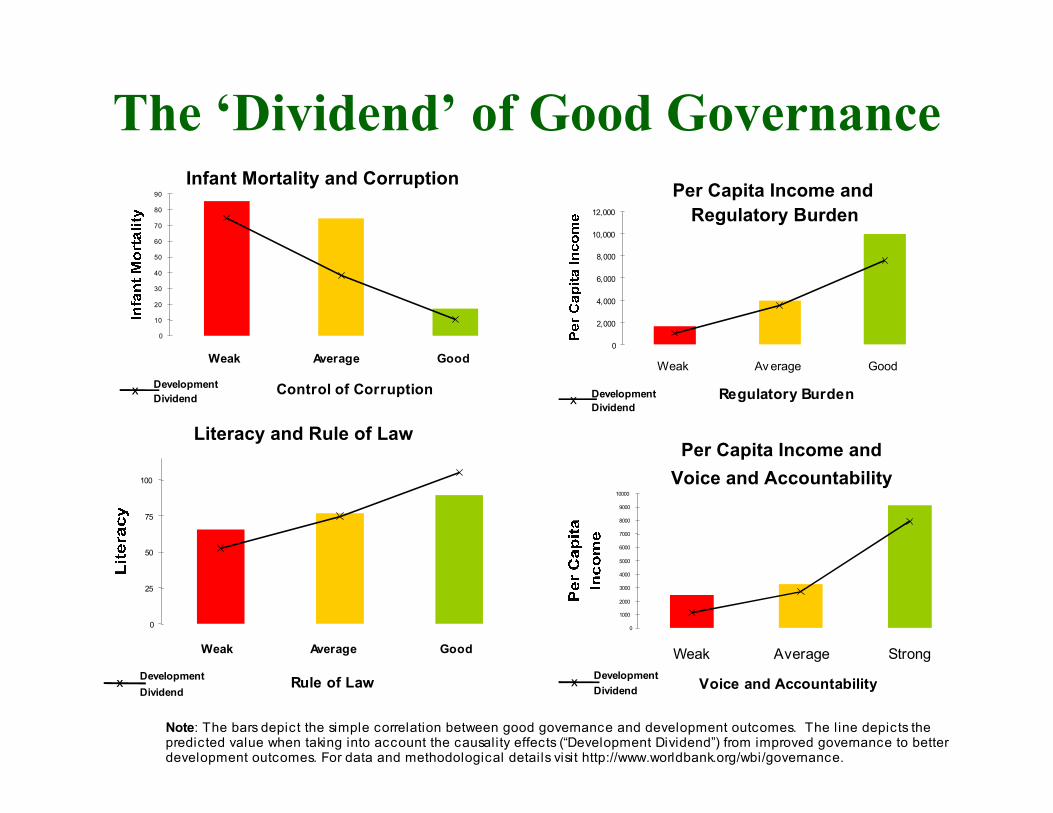
The ‘Dividend’ of Good GovernanceInfant Mortality and Corruption
0
10
20
30
40
50
60
70
80
90
Weak Average Good
Control of Corruption x Development Dividend
0
2,000
4,000
6,000
8,000
10,000
12,000
Weak Av erage Good
Regulatory Burdenx Development Dividend
Per Capita Income and Regulatory Burden
Literacy and Rule of Law
0
25
50
75
100
Weak Average Good
Rule of Law x Development Dividend
Per Capita Income and Voice and Accountability
0
1000
2000
3000
4000
5000
6000
7000
8000
9000
10000
Weak Average Strong
Voice and Accountabilityx DevelopmentDividend
Note: The bars depict the simple correlation between good governance and development outcomes. The line depicts thepredicted value when taking into account the causality effects (“Development Dividend”) from improved governance to betterdevelopment outcomes. For data and methodological details visit http://www.worldbank.org/wbi/governance.

1
3
5
Low Middle High
Extent of Transparency
Transparent Information by Government
Effective Parliamentary Oversight
Corporate Ethics
Annual GDP Growth (%)
Transparency, Parliaments, Corporate Ethics, and GDP Growth
Source: Annual GDP growth over 1999-2001 WDI 2002; GDP is computed in PPP terms. The various transparency /governance variables drawn from Executive Opinion Survey, 2002.

1. ‘Data Power’: Governance and Institutional Capacity can bemeasured, monitored and rigorously analyzed -- & it Matters
2. Little Progress on average on Governance and GovernanceCapacity-- Sobering Reality in past 10 years, but a number ofcountries have done well, and Bank has given support
3. Misdirected Approaches to Technical Assistance and Capacity-Building – Key to revisit in light of evidence: central role ofGovernance and Transparency?
4. Some Lessons – Did we under-estimated centrality ofimproving governance and corruption control, and within it,the role of: i) Politics; Vested interests of private and politicalelite; ii) Participatory Collective Action, Voice &Accountability, and, iv) Transparency Strategies
5. Broader Implications for Capacity Enhancement
Some Key Issues and Challenges


