Embed Size (px)
Citation preview

May 2013
DJSI Diversified Family
A cooperation of S&P Dow Jones Indices and RobecoSAM

2
Content
• RobecoSAM at a Glance
• Key messages DJSI Diversified
• DJSI Diversified universe
• DJSI Assessment
• DJSI Diversified Family

3
RobecoSAM at a Glance
• Investment specialist focused exclusively on Sustainability Investing since 1995
• Offering complementary capabilities to Sustainability Investing
• Powering Dow Jones Sustainability Indices since 1999
• EUR 7.1 billion total assets (as per 31.03.2013)
• Servicing a global and diversified client base
• Approx. 110 employees headquartered in Zurich, Switzerland

4
Key messages DJSI Diversified
• A new family of sustainability indices
• Leveraging the results of the RobecoSAM Corporate Sustainability Assessment (CSA)
• Index rules were set with the objective to maximize diversification while minimizing
the decrease in overall sustainability performance
• Developed to consciously consider country, sector and company size diversification
• Provides a solution to increase exposure to more sustainable companies while
maintaining low tracking error to traditional global benchmarks
• DJSI Diversified Family includes regional and local sub-indices

5
DJSI Diversified universe
6
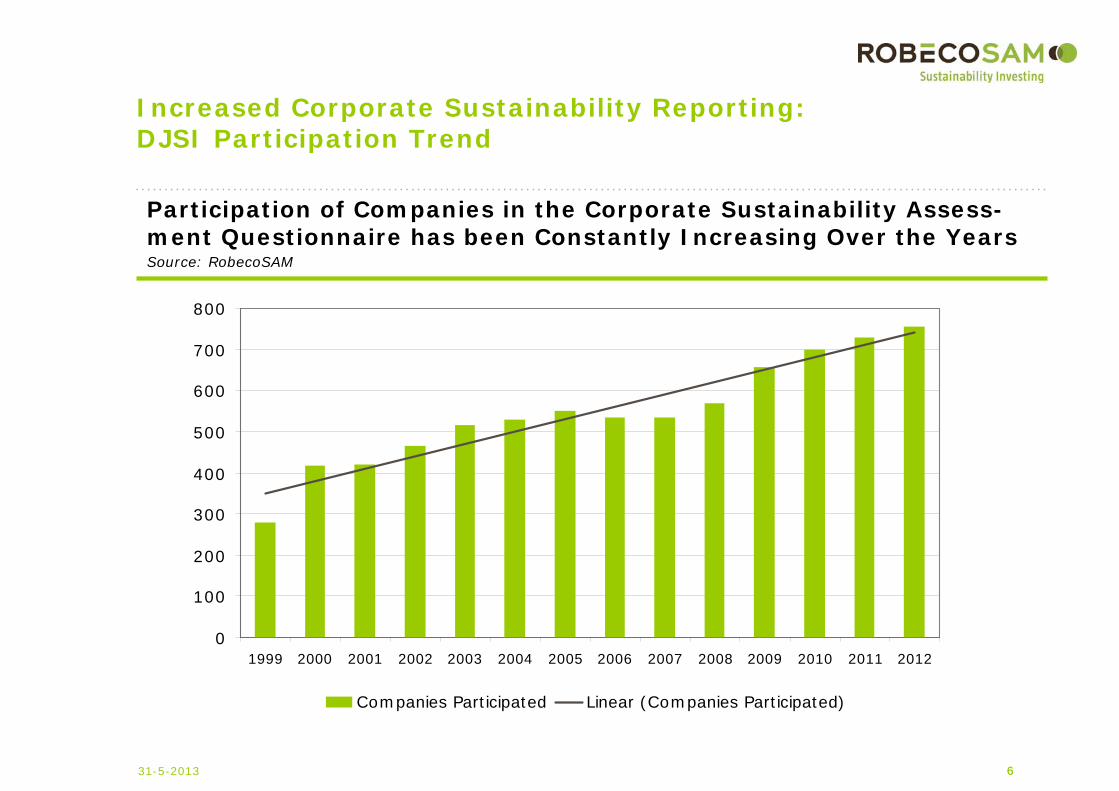
Increased Corporate Sustainability Reporting: DJSI Participation Trend
6
Participation of Companies in the Corporate Sustainability Assess-ment Questionnaire has been Constantly Increasing Over the YearsSource: RobecoSAM
31-5-2013
0
100
200
300
400
500
600
700
800
1999 2000 2001 2002 2003 2004 2005 2006 2007 2008 2009 2010 2011 2012
Companies Participated Linear (Companies Participated)

7
DJSI EmergingMarktes Diversified
151 Components58 DJSI Sectors17 Countries
DJSI World
Diversified
DJSI World Developed Diversified
DJSI North America Diversified
677 Components58 DJSI Sectors26 Countries
DJSI World
Diversified
*600 largest companies from South Korea, Australia, New Zealand, Japan, Hong Kong, Taiwan, and Singapore.Effective as of September 24, 2012 except for DJSI Emerging Markets which is as of February 21, 2013.
DJSI Assessment and Selection Process
DJSI Europe Developed Diversified
DJSI Asia Pacific Developed Diversified
8
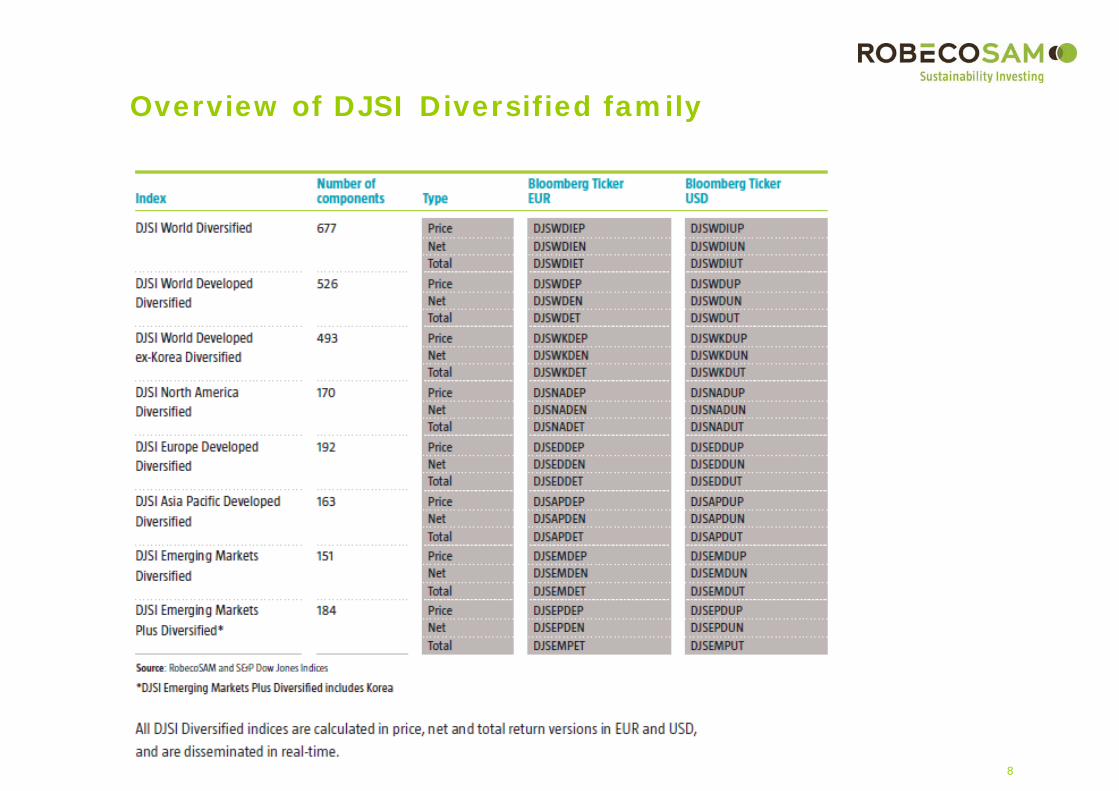
Overview of DJSI Diversified family

9
151 ComponentsDJSI Emerging Markets Diversified
163 ComponentsDJSI Asia Pacific Developed Diversified
192 ComponentsDJSI Europe Developed Diversified
as of May 30, 2013
DJSI World Diversified 677 Components
DJSI World Developed Diversified 526 Components
DJSI World Developed ex-Korea Diversified 493 Components
DJSI North America Diversified 170 Components
DJSI Emerging Markets Plus Diversified* 184 Components
DJSI World Diversified – Index Range
*DJSI Emerging Markets Plus Diversified includes Korea
10
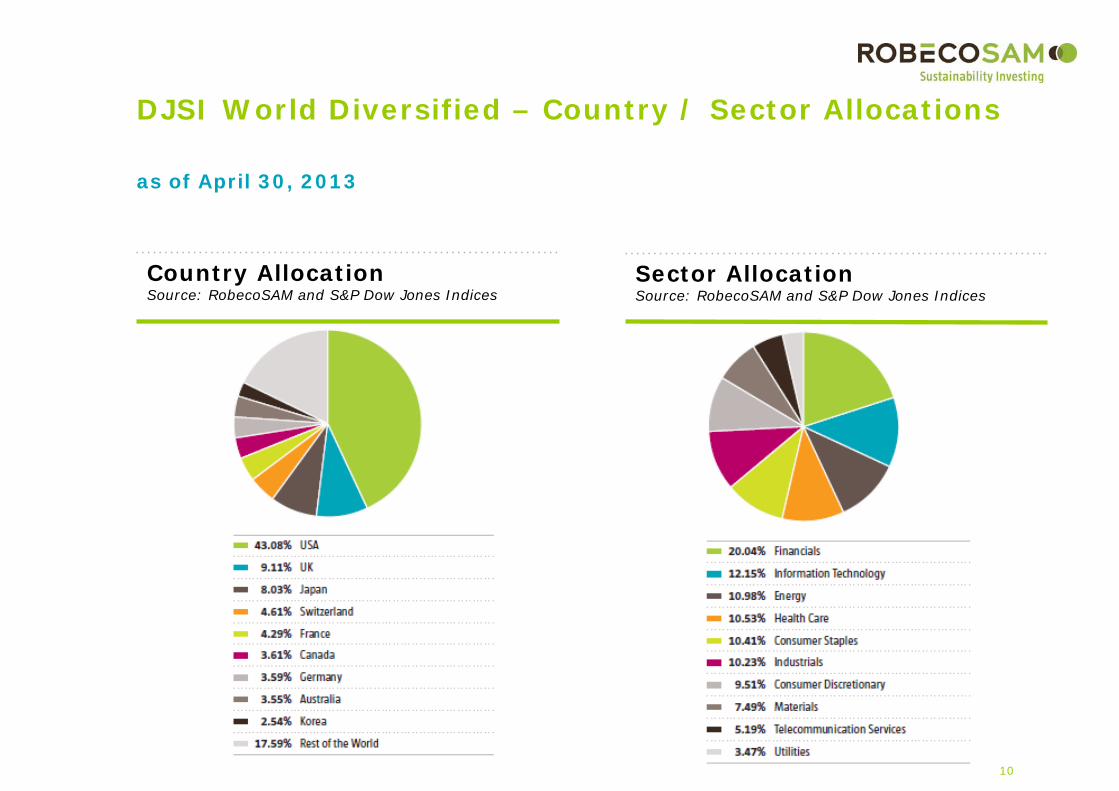
DJSI World Diversified – Country / Sector Allocations
as of April 30, 2013
Country AllocationSource: RobecoSAM and S&P Dow Jones Indices
Sector AllocationSource: RobecoSAM and S&P Dow Jones Indices

11
Effective as of May 30, 2013
DJSI
Diversified
Starting
Universe
(S&P Global
BMI)
Assessed Universe(approx 2’600 companies) in 46 eligiblecountries
Eligible Universe(approx 1’300 companies)
677 components24 GICS Industry Groups43 Countries
DJSI World Diversified – Selection

12
Since Launch, 09/09 – 04/13 (USD, Net Return)*Source: S&P, *based on backtested data
DJSI World Diversified – Performance
600
650
700
750
800
850
900
950
1000
1050
1100
1150
1200
Sep-09 Mar-10 Sep-10 Mar-11 Sep-11 Mar-12 Sep-12 Mar-13
DJSI World Diversified (US Dollar) Net Total ReturnS&P Global LargeMidCap (US Dollar) Net Total Return

13
DJSI World Diversified (TR, USD) Source: S&P, based on backtested data
Performance Comparison
as of April 30, 2013
30.04.2013DJSI
World Diversified USD NTR
S&P Global LargeMidCap
USD NTR
1 Month* 4.00% 3.56%3 Months 6.96% 6.29%YTD 2013 12.42% 10.80%1 Year 29.22% 27.13%3 Year 43.19% 45.14%2009** 3.83% 4.65%2010 11.48% 12.83%2011 -8.39% -7.58%2012 15.05% 16.13%
* 23.05.2013**30.09.2009

14
DJSI World Diversified versus the S&P Global LargeMidCapIndex (as of April 30, 2013)
0
25
50
75
100Risk & Crisis Management
Codes ofConduct/Compliance/Corruption&Bribery
Labor Practice Indicators and Human Rights
Human Capital Development
Stakeholder Engagement+Corporate Citizenship and Philanthropy
Environmental Policy/Management System
Climate Strategy
Operational Eco-Efficiency
DJSI World Diversified S&P Global LargeMidCap Index

15
Effective as of May 30, 2013
DJSI World Developed Diversified – Selection
DJSI World
Diversified
Eligible Countries*(26)
526 Components24 GICS Industry Groups26 Countries

16
Since Launch, 09/09 – 04/13 (USD, Net Return)*Source: S&P, *based on backtested data
DJSI World Developed Diversified – Performance
600
650
700
750
800
850
900
950
1000
1050
1100
1150
1200
Sep-09 Mar-10 Sep-10 Mar-11 Sep-11 Mar-12 Sep-12 Mar-13
DJSI World Developed Diversified (US Dollar) Net Total ReturnS&P Developed LargeMidCap (US Dollar) Net Total Return

17
Effective as of May 30, 2013
DJSI Europe
Diversified
Eligible Countries*(17)
192 Components24 GICS Industry Groups17 Countries
DJSI Europe Diversified – Selection
*Austria, Belgium, Denmark, Finland, France, Germany, Greece, Ireland, Italy, Luxembourg, Netherlands, Norway, Portugal, Spain, Sweden, Switzerland, United Kingdom

18
09/09 – 04/13 (USD, Net Return)*Source: S&P, *based on backtested data
DJSI Europe Diversified - Performance
600
650
700
750
800
850
900
950
1000
1050
1100
1150
1200
Sep-09 Mar-10 Sep-10 Mar-11 Sep-11 Mar-12 Sep-12 Mar-13
DJSI Europe Diversified (US Dollar) Net Total Return
S&P Europe LargeMidCap (US Dollar) Net Total Return

19
Effective as of May 30, 2013
DJSI North
America
Diversified
Eligible Countries*(2)
170 Components24 GICS Industry Groups2 Countries
DJSI North America Diversified – Selection
*Canada, United States

20
09/09 – 04/13 (USD, Net Return)*Source: S&P, *based on backtested data
DJSI North America Diversified– Performance
600
650
700
750
800
850
900
950
1000
1050
1100
1150
1200
Sep-09 Mar-10 Sep-10 Mar-11 Sep-11 Mar-12 Sep-12 Mar-13
DJSI North America Diversified (US Dollar) Net Total ReturnS&P North America LargeMidCap (US Dollar) Net Total Return
21
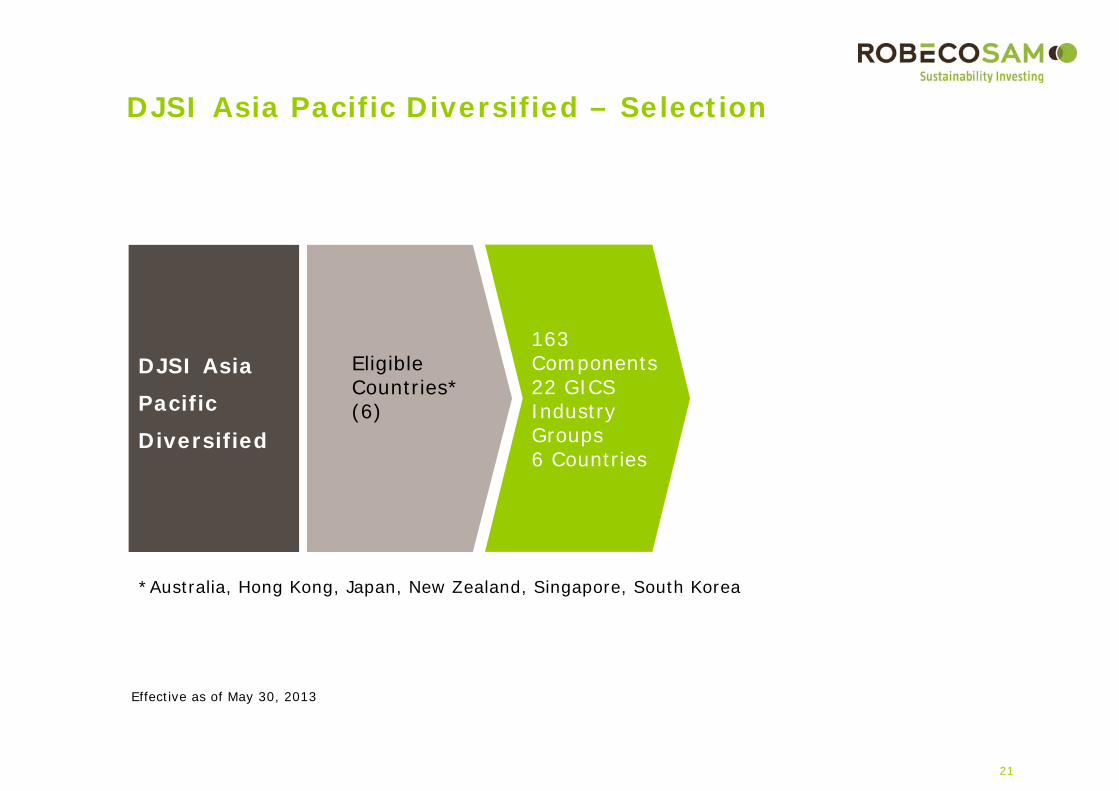
Effective as of May 30, 2013
DJSI Asia
Pacific
Diversified
Eligible Countries*(6)
163 Components22 GICS Industry Groups6 Countries
DJSI Asia Pacific Diversified – Selection
*Australia, Hong Kong, Japan, New Zealand, Singapore, South Korea
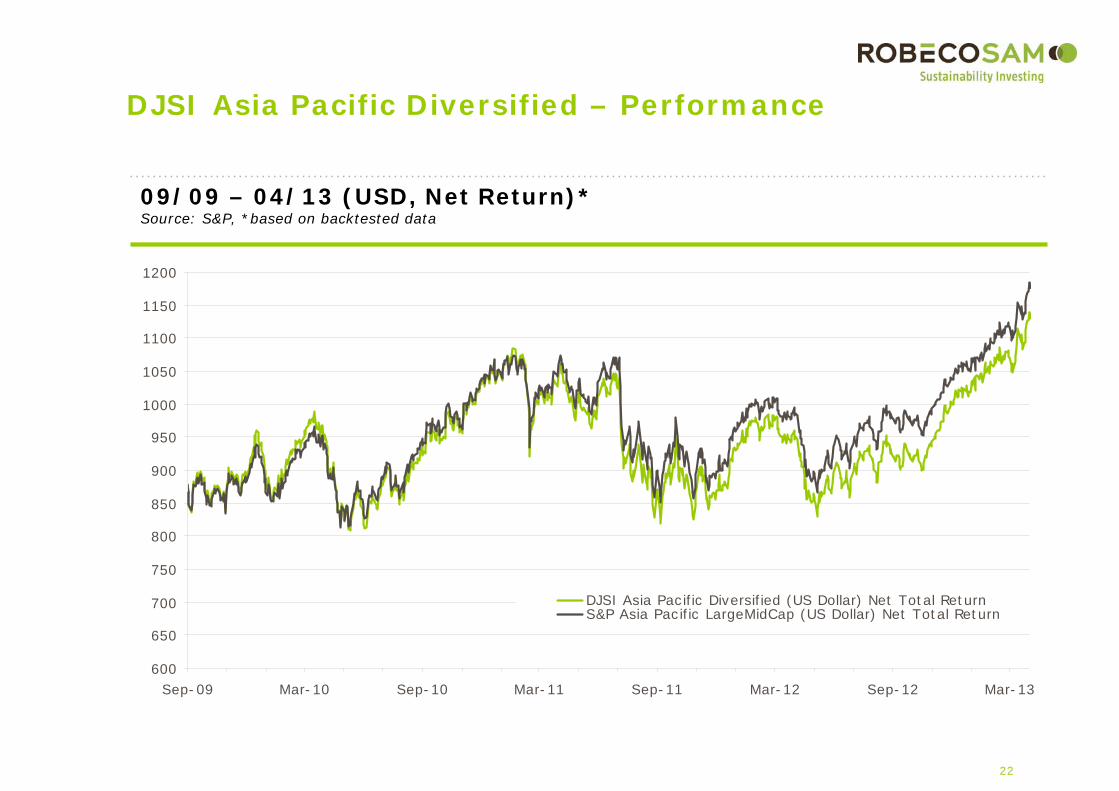
22
09/09 – 04/13 (USD, Net Return)*Source: S&P, *based on backtested data
DJSI Asia Pacific Diversified – Performance
600
650
700
750
800
850
900
950
1000
1050
1100
1150
1200
Sep-09 Mar-10 Sep-10 Mar-11 Sep-11 Mar-12 Sep-12 Mar-13
DJSI Asia Pacific Diversified (US Dollar) Net Total ReturnS&P Asia Pacific LargeMidCap (US Dollar) Net Total Return

23
Effective as of May 30, 2013
DJSI
Emerging
Markets
Diversified
Eligible Countries*(20)
151 Components24 GICS Industry Groups17 Countries
DJSI Emerging Markets Diversified – Selection
*Brazil, Chile, China, Colombia, the Czech Republic, Egypt, Hungary, India, Indonesia, Malaysia, Mexico, Morocco, Peru, the Philippines, Poland, Russia, South Africa, Taiwan, Thailand and Turkey

24
09/09 – 04/13 (USD, Net Return)*Source: S&P, *based on backtested data
DJSI Emerging Markets Diversified – Performance
600
650
700
750
800
850
900
950
1000
1050
1100
1150
1200
Sep-09 Mar-10 Sep-10 Mar-11 Sep-11 Mar-12 Sep-12 Mar-13
DJSI Emerging Markets Diversified (US Dollar) Net Total ReturnS&P Emerging LargeMidCap (US Dollar) Net Total Return

25Robeco
RobecoSAM AG
Josefstrasse 2188005 ZurichSwitzerlandPhone: +41 44 653 1800Fax: +41 44 653 1810E-Mail: indices@robecosam.comwww.robecosam.comwww.sustainability-indices.com
RobecoSAM Indices

26
Disclaimer
No warranty. This publication is derived from sources believed to be accurate and reliable, but neither its accuracy nor completeness is guaranteed. The material and information in this publication are provided "as is" and without warranties of any kind, either expressed or implied. RobecoSAM AG, S&P Dow Jones Indices LLC and their related, affiliated and subsidiary companies disclaim all warranties, expressed or implied, including, but not limited to, implied warranties of merchantability and fitness for a particular purpose. Any opinions and views in this publication reflect the current judgment of RobecoSAM and may change without notice. It is each reader's responsibility to evaluate the accuracy, completeness and usefulness of any opinions, advice, services or other information provided in this publication.
Limitation of liability. All information contained in this publication is distributed with the understanding that RobecoSAM, S&P Dow Jones Indices LLC, and their related affiliates are not rendering legal, accounting, investment or other professional advice or opinions on specific facts or matters and accordingly assume no liability whatsoever in connection with its use. In no event shall RobecoSAM AG, S&P Dow Jones Indices LLC and their related, affiliated and subsidiary companies be liable for any direct, indirect, special, incidental or consequential damages arising out of the use of any opinion or information expressly or implicitly contained in this publication.
Copyright. Unless otherwise noted, text, images and layout of this publication are the exclusive property of RobecoSAM AG and/or its related, affiliated and subsidiary companies and may not be copied or distributed, in whole or in part, without the express written consent of RobecoSAM AG or its related, affiliated and subsidiary companies.
No Offer. The information and opinions contained in this publication constitutes neither a solicitation, nor a recommendation, nor an offer to buy or sell investment instruments or other services, or to engage in any other kind of transaction. The information described in this publication is not directed to persons in any jurisdiction where the provision of such information would run counter to local laws and regulation.
The Dow Jones Sustainability Indices are a joint product of S&P Dow Jones Indices LLC and/or its affiliates and RobecoSAM AG (“RobecoSAM”). S&P® is a registered trademark of Standard & Poor’s Financial Services LLC, Dow Jones® is a registered trademark of Dow Jones Trademark Holdings LLC (“Dow Jones”) and RobecoSAM® is a registered trademark of Robeco Groep N.V. The trademarks have been licensed to S&P Dow Jones Indices LLC and its affiliates. Inclusion of a company within a Dow Jones Sustainability Index is not a recommendation to buy, sell, or hold such company, nor is it investment advice. Investment products based on the Dow Jones Sustainability Indices are not sponsored, endorsed, sold or promoted by S&P Dow Jones Indices LLC, RobecoSAM, Dow Jones or their affiliates.