Embed Size (px)
Citation preview

Chapter 3
Divided Attention
Contents
3.1 Definitions and Domain . . . . . . . . . . . . . . . . . . . . . . . . . . . . . 33
3.2 The Visual Search Paradigm . . . . . . . . . . . . . . . . . . . . . . . . . . 34
3.3 The Dual-Task Paradigm . . . . . . . . . . . . . . . . . . . . . . . . . . . . 44
3.4 Theoretical Accounts of Divided Attention . . . . . . . . . . . . . . . . . 48
3.5 The Locus of Processing Dependencies . . . . . . . . . . . . . . . . . . . 52
3.6 Visual Search Revisited: Simultaneous-Sequential Paradigm . . . . . . 53
3.7 Dual Tasks Revisited . . . . . . . . . . . . . . . . . . . . . . . . . . . . . . 62
3.8 The Generality of Divided Attention Effects . . . . . . . . . . . . . . . . 63
3.9 Chapter Summary . . . . . . . . . . . . . . . . . . . . . . . . . . . . . . . . 63
3.1 Definitions and Domain
In the last chapter we introduced selective attention, which concerns the use of one source of infor-mation rather than another. We now turn to divided attention, which concerns the use of multiplesources of information rather than a single source. Divided attention in vision is fundamentallyabout the dependence versus the independence of visual processing across stimuli. As with selec-tive attention, we take pains to distinguish between phenomena, or effects of divided attention, andtheoretical concepts that are used to explain effects of divided attention in terms of the relevantinternal processes.
Consider first phenomena. Effects of divided attention are behavioral consequences (such asimpaired performance) of manipulating the number of relevant stimuli. We can again use readingas an example. If we showed you a display of this page for a third of a second or so, and askedyou to read the word that is printed in bold in this paragraph, you might be able to do thatfairly well. However, if we asked you to read all of the words on the page in that period of time,you would probably be much less successful, and depending on which other words you read during
33

34 CHAPTER 3. DIVIDED ATTENTION
the brief period, you may or may not have gotten to the word in bold. In this example, readingperformance changes as the number of to-be-read words increases from one to many, thus reflectinga dependence of reading one word on reading other words. This is an effect of divided attentionacross words.
Our focus in this example is to make clear it is an attentional effect rather than a non-attentionalsensory effect. We did this by varying the number of relevant stimuli rather than the total numberof stimuli. The total number of stimuli was actually the same across the two situations. To be clear,a difference in the ability to read the word “bold” when it is the only word on the page versus whenit is one word of many on a full page of text should not be taken as definitive evidence of an effectof divided attention. This is because there are multiple sensory differences, unrelated to attention,that could lead to a difference in reading ability across those two situations. Divided attentioneffects are effects of the number of relevant stimuli, and must be distinguished from stimulus effectsthat depend on stimuli whether they are task relevant or not.
Now consider some corresponding theoretical terms used to refer to the nature of internal pro-cesses that give rise to divided attention effects. An extreme example, is serial processing. Someaspect of visual processing, say lexical access, might be capable of handling only one stimulus ata time. Such a theoretical statement predicts that any task that requires lexical access, such asreading, will show divided attention effects; performance will depend on the number of task-relevantstimuli. A contrasting extreme to serial processes would be those that proceed simultaneously (i.e.,in parallel) for multiple stimuli and are unaffected by the number of to-be-processed stimuli. Forsome situations, a set of completely independent parallel process is expected to suffer no dividedattention effects. Besides serial versus parallel processing, there are other types of dependenciesthat can lead to divided attention effects. We will expand on these possibilities in a later sectionof this chapter.
In this early chapter, we introduce two basic paradigms that have been used to study dividedattention: visual search and dual task. We first ask whether there is evidence from these paradigmsthat divided attention effects occur, starting with simple stimuli and tasks as we did with selectiveattention. We then offer an initial theoretical analysis, asking what aspect of processing is thesource of the divided attention effects. As was the case for selective attention in the last chapter,this initial consideration of divided attention is limited to a consideration of simple stimuli andtasks and focuses on divided attention across space. The purpose is to introduce the paradigms,recognize some of their strengths and weaknesses, and understand the kinds of theoretical questionsthat can and cannot be addressed by each. A more fully developed treatment of divided attentionis offered in Chapter xxx after we have considered a richer set of stimuli and tasks.
3.2 The Visual Search Paradigm
We first consider visual search which is a paradigm in which observers search a spatially distributeddisplay of stimuli for a target stimulus. For example, you might have to search for a stimulus thatis red among other-colored stimuli and respond “yes” when a target is present and “no” when itis absent. Although target presence versus absence is a common task, there are other ways ofasking observers to report the outcome of their visual search. They might, for example, be asked

3.2. THE VISUAL SEARCH PARADIGM 35
Time
Set Size 6Fixationtill keypress
Target750-1000 ms
Stimulustill response
Set Size 48
Figure 3.1: An illustration of the set-size conditions in Motter & Simoni (2008): Set Size 6 on theleft and Set Size 48 on the right. Each trial begins with a fixation point until the observer indicatesthey are ready with a keypress. Then the target is presented for 750 to 1000 ms. In this example,the target is a left-tilted, red “T” shape. This is followed by the stimulus display which remainsuntil the response. The task is to indicate the presence or absence of the target by a keypress.
to indicate the location of the target stimulus by indicating which of four quadrants it appeared, orby clicking on a particular location with a mouse. Visual search is a paradigm for studying dividedattention because multiple stimuli are relevant to the task.
A common manipulation in visual search is to vary the number of stimuli in the display. Perfor-mance is measured as a function of display set size to yield what are known, more briefly, as set-sizeeffects. On first blush, set-size effects appear to be divided attention effects, and are indeed ofteninterpreted as such. Set-size effects, however, can have multiple causes and need to be interpretedwith caution. Consider a visual search experiment conducted by Motter and Simoni (2008). Theprocedure is, illustrated in Figure 3.1 and a larger view of the stimulus displays in Figure 3.2. Thisexample includes typical elements of what must be hundreds of different visual search experimentsin the literature.
In this experiment, observers viewed an initial fixation display, and when ready to proceed theypressed a key. This was followed by a target display that specified the target for that trial. Targetschanged from trial to trial. In this example, a left-tilted, red “T” shape is the target. This wasfollowed by the stimulus display that remained until the response. These displays had set sizes of6, 12, 24 and 48 stimuli. The stimuli were all either “T” or “L” shapes that could be red or greenand could be rotated to any of six possibilities. Thus, there were 24 possible stimuli of which onlyone was the target. The observer’s task was to indicate whether the target was present or absentwith a key press. It was present on half of the trials.

36 CHAPTER 3. DIVIDED ATTENTION
Set Size 6 Set Size 48
Figure 3.2: An illustration of two set-size conditions in Motter & Simoni (2008): Set-Size 6 on theleft and Set-Size 48 on the right. The task was to detect a tilted-to-the-left, red “T” shape amonga variety of distractors. The target is present in both of these examples in the upper right.
3.2.1 Example 1: Visual search with and without eye movements
This experiment was conducted in two ways. First, the observers were allowed to move their eyesfreely to find the target. This is typical of many early visual search experiments beginning withNeisser (xxx) and Atkinson et al. (xxx). The results are shown in the top two panels of Figure3.3. On the top left, correct response time is plotted as a function of set size and on the top rightthe percent errors is plotted by set size. Both functions are further subdivided by the presence orabsence of the target. For both measures, performance declines with set size. The response timeincreases for both target present and target absent conditions. The increase is about twice as largefor target absent compared to target present. The larger effect for target absent trials is from about900 ms to 3000 ms. One account of such an effect is that groups of items are processed in sequenceand one terminates the trial when one finds the target in the target present conditions but must gothrough the entire sequence for target absent. Indeed the eye movements allowed in this conditionmay contribute to the appearance of such serial processing. Regarding errors, there are relativelyfew errors on the target absent trials (false alarms) and they were not reported broken down byset size. In contrast, errors on the target present trials (misses) were more common and increasedwith set size from around 1% to 10%. In sum, there were effects of set size on both response timeand errors but average errors remained relatively low (average misses of about 5%).
The second way the experiment was conducted was to require the observers to maintain centralfixation and not move their eyes. To enforce this, eye position was monitored and trials rejectedin which there was an eye movement. After a bit of practice, observers could do this and less than1% of trials were excluded because of eye movements. Conditions with enforced fixation are notcommon in the literature.

3.2. THE VISUAL SEARCH PARADIGM 37
0
1000
2000
3000
4000
0 10 20 30 40 50
Response Time (ms)
Set Size
Target Absent
Target Present
Eye Movements Allowed
No Eye Movements
0
1000
2000
3000
4000
0 10 20 30 40 50
Response Time (ms)
Set Size
Target Absent
Target Present
0
10
20
30
40
50
0 10 20 30 40 50
Target PresentTarget Absent
Percent Errors
Set Size
0
10
20
30
40
50
0 10 20 30 40 50
Target PresentTarget Absent
Percent Errors
Set Size
Figure 3.3: Results from Motter & Simoni (2008). The top two panels are for conditions that alloweye movements and the bottom two panels are for conditions without eye movements. On the leftside, the mean correct response time is plotted as a function of set size. On the right side, themean percent errors is plotted as a function of set size. Both are further broken down by whetherthe target is present or absent. Both with and without eye movements, response time and errorsincrease with increasing set size. Preventing eye movements has little effect on correct responsetime but causes a large increase in errors especially with the larger set sizes. We plot accuracy inresponse time experiments in terms of percent errors rather than percent correct because there areusually few errors and so that increasing values reflect poorer performance in both measures.

38 CHAPTER 3. DIVIDED ATTENTION
The results with no eye movements are shown in the bottom two panels of Figure 3.3 usingthe same conventions as before. The bottom left panel shows response time as a function of setsize and the results are very similar to when eye moments were allowed. The bottom right panelshows percent errors as a function of set size. Here the results are quite different. For target absentconditions, the false alarms are much higher but unfortunately are not broken down by set size.For the target present condition, the misses are also much higher and clearly increase with set size.For the set size 48 condition, the percent misses reach nearly 50% compared to only 10% witheye movements. These errors occurred despite instructions to the observers to be as accurate aspossible. Further analyses in the article show that observers were unlikely to do much better ifthey were given more time. Thus, without eye movements, observers could not perform the taskwithout 50% errors.
Why are their so many errors when observers could not move their eyes? In the next section wedescribe two stimulus differences between the set-size conditions that are likely to cause this effectas well as contribute to set-size effects generally.
3.2.2 Effects of eccentricity and crowding
One stimulus difference that is often confounded with set size is stimulus eccentricity. Recallfrom the previous chapter that where you point your eyes has substantial consequences for visualprocessing. Stimuli near fixation are processed with greater accuracy than are stimuli that projectto areas more peripheral relative to fixation. This difference in eccentricity can cause sensory effectsthat are confounded with any attentional effect of set size. This is particularly true when observersare free to move their eyes. In this case, observers can shift stimuli from being in the peripheryto being near fixation. Thus, one source of set-size effects can be the use of eye movements toovercome the effects of stimulus eccentricity.
One could control for the effects of eccentricity by presenting stimuli along an iso-eccentric ringof locations and prevent eye movements. Doing so, however, would typically confound stimulusdensity with set size, because larger numbers of stimuli will have to be presented along the samecircumference of locations. In fact, even without using isoeccentric placement of stimuli, stimulusdensity is often confounded with set size in visual search experiments. This is because stimuluslocations tend to be selected from a single predefined set of locations thereby forcing more stimulito be presented within the same spatial area as set size increases.
Confounding stimulus density with set size presents another problem for interpreting set-sizeeffects as due to divided attention. Increases in stimulus density lead to increased visual crowding :a decrease in stimulus visibility that occurs when peripheral stimuli are presented in the presenceof nearby stimuli. Figure 3.4 provides a demonstration of visual crowding. The task is to identifythe orientation of the C-like figure. These Landolt Cs can be oriented with the gap to the left,right, up or down. In the demo, the left side has a single Landolt C and the right side has acentral Landolt C surrounded by circles. Your task is to fixate the central cross and then judgethe orientation of the Landolt C. On the left The Landolt C is alone and the gap size was chosento make it easy to see. On the right, it is “crowded” by the surrounding figures and is hard to see.You can also shift one’s eyes to look directly at one or the other of the two Landolt Cs. On the left,the direct view illustrates the effect of eccentricity alone. On the right, the direct view illustrates

3.2. THE VISUAL SEARCH PARADIGM 39
Figure 3.4: An illustration of crowding. Fixate the central cross and compare the visibility of thesolitary Landolt C on the left with the visibility of the crowded Landolt C on the right.
the combined effects of eccentricity and the fact that crowding effects largely disappear when therelevant stimulus is directly viewed.
A key feature of this demonstration of crowding is that the relevant stimulus in the two conditionsare identical: a single Landolt C. Instead, crowding is the result of a manipulation of the numberof task-irrelevant stimuli. That the mere presence of the additional irrelevant stimuli can have alarge impact on performance means that one has to control for the effects of crowding in order tointerpret set-size effects as effects of divided attention.
The effect of crowding can be quite substantial and can occur for quite widely spaced peripheralstimuli. As a rule of thumb, crowding occurs for spacings that are half of the eccentricity ofthe relevant stimulus and smaller (Bouma, 1970). Thus, at a 10◦ eccentricity, stimuli within 5◦
cause crowding. Clearly, increasing set-size as illustrated in Figure 3.2 will cause more crowding.Indeed, Motter and Simoni (2008) argue that the most if not all of the set-size effect in theirexperiment are due to a combination of eccentricity, crowding and the eye movements to overcomethese effects.
In summary, although set-size effects in visual search have the potential for revealing effects ofdivided attention, differences in set size are often confounded with stimulus differences that can leadto sensory effects. We now present two examples of visual search experiments that have gone someway toward dealing with the confounds of eccentricity and stimulus density, and ask whether theremaining set-size effects are due to dividing attention across stimuli at multiple locations.
3.2.3 Example 2: Brief displays and minimal crowding
The task in this example (Carrasco, Mclean, Katz and Frieder, 1998, Experiment 2) was to detectthe presence of a vertical red line among tilted red lines. The target was present on half the trialsand absent on the others, and observers reported “present” or “absent” by making correspondingkey presses as quickly as possible following the presentation of the display. Both response time andresponse accuracy were measured as a function of set size. In the actual experiment, set size variedfrom 2 to 32. For purposes here, we consider only set sizes 2, 4, 6, and 8, because these conditions

40 CHAPTER 3. DIVIDED ATTENTION
Figure 3.5: An illustration of two set-size conditions in Experiment 2 of Carrasco et al. (1994): SetSize 2 on the left and Set Size 8 on the right. The task was to detect a vertical target among tilteddistractors. The vertical target is present in both of these examples.
allowed for stimulus spacings at which visual crowding should have been minimal (Bouma, 1970).The stimuli were distributed over a 6-by-6 array of possible positions with jitter. Thus the samepositions (and eccentricities) were sampled for all set sizes. Figure 3.5 provides an illustration ofthe smallest and largest set sizes that we are considering here (2 and 8).
The conditions that we have described so far are typical of most visual search experiments inthe literature. What is unusual about this experiment, however, is that the search displays werepresented for only 100 ms, thereby preventing eye movements within the display. Thus, betweenlimiting our consideration to conditions in which crowding should have been minimal and allowingfor only a single fixation, this experiment presents an opportunity for asking whether there are setsize effects in visual search above and beyond sensory effects. Set-size effects under these conditionscan be interpreted as divided attention effects with more confidence.
Indeed, as shown in Figure 3.6 there were set-size effects in this experiment. The left panelshows mean correct response time a function of set size. The right panel shows mean percent erroras a function of set size. As set size increased, both response time and errors increased. We can beconfident that differences in eye position and eccentricity did not contribute to these set-size effectsbecause no eye movements could be made given the brief displays, and stimulus positions weresampled from the same set of possible positions for all set sizes. In addition, crowding probably didnot play a large role for these small set sizes given the large spacing between stimuli. In summary,these set-size effects appear to be examples of an effect divided attention across multiple spatiallocations.
3.2.4 Example 3: Relevant set-size
The task for our third example (Palmer, 1994) was to detect the presence of a higher-contrast disk(30%, 40%, or 50% contrast) among distractors of a fixed lower contrast (20% contrast). Observers

3.2. THE VISUAL SEARCH PARADIGM 41
550
600
650
700
750
0 2 4 6 8 10
Res
pons
e Ti
me
(ms)
Set Size
Target Absent
Target Present
0
3
6
9
12
15
0 2 4 6 8 10
Per
cent
Err
ors
Set Size
Target Absent
Target Present
Figure 3.6: Results from Experiment 2 in Carrasco et al. (1998). On the left, the mean correctresponse time is plotted as a function of set size. On the right, the mean percent errors is plottedas a function of set size. Both are further broken down by whether the target is present or absent.Both response time and errors increase with increasing set size.
reported whether the target was present or absent, and although the displays were brief (100 ms) inorder to prevent eye movements within the display, responses were not speeded. Instead observerswere encouraged to take their time responding and to be as accurate as possible. Because some ofthe contrast differences between target and distractor were quite small, observers made errors andperformance was measured in terms of response accuracy as a function of set size (2 or 8). Thestimuli were presented at eccentricities that were randomly drawn between 5◦ and 8◦. The spacingbetween the stimuli was at least 3◦ with approximately equal spacing to the nearest neighboringstimulus in the two set sizes. This spacing, therefore, roughly satisfies Bouma’s rule of thumbto avoid crowding (half of the eccentricity). In the article itself, the analysis for this experimentfocused on modeling the interaction between set size and discriminability (the contrast incrementbetween the distractor and target). For the current purpose of providing examples of effects ofdivided attention, however, we focus on an aggregate measure of the set-size effect. Specifically,we collapsed the 20% and 40% target-contrast conditions, and excluded the 50% condition becauseperformance in this condition approached ceiling and was therefore less informative.
The results of this experiment are shown in Figure 3.8. The mean percent correct for 4 observersis plotted as a function of set size. With increasing set size, percent correct fell by 9± 1%. Giventhe controls for eccentricity, eye movements, and crowding, this set-size effect is likely to be aneffect of divided attention.
Our near-obsessive concern about controlling for sensory effects is necessary because the questionat hand is whether or not we have an attentional effect or something else. Does it reflect a changein visual processing due to what the observer is doing with the stimulus (i.e., what the task is),or does it reflect some difference in the stimulus itself? We believe it is critical to ascertain thatthere is an effect of attention at all, before pursuing theoretical explanations of those effects. With

42 CHAPTER 3. DIVIDED ATTENTION
Figure 3.7: An illustration of the two display-set-size conditions in Experiment 2 of Palmer (1994):Set-Size 2 on the left and Set-Size 8 on the right. The task was to detect a contrast incrementtarget which is present in both of these examples. The relative contrasts are exaggerated to makethem easily visible.
that in mind, we present a final example that is a follow-up to last experiment described. In thisexample, all possible stimulus influences on the measured set-size effect were eliminated by havingthe search displays across the different set sizes be physically identical. In this case, any set-sizeeffect that occurs must be an effect of divided attention because there were no stimulus differencesof any kind. Moreover, because this final example relies on a cueing procedure, it highlights theinterdependence between divided and selective attention.
The strategy used here, which we will refer to as the relevant-set-size strategy, was to providecues prior to the search display that indicated, in this case, either 2 locations or 8 locations that wererelevant to the task. As illustrated in Figure 3.9, an initial display was presented that containedboth a fixation cross and additional crosses in the periphery that indicated the location of everystimulus that would appear in the search display. The cues further indicated the relevance of eachlocation with regard to the search task by being either black or white. In the illustrated example,the black crosses indicated relevant locations and the white crosses indicated irrelevant locations.In some experiments, this mapping has been reversed for some observers ensuring an arbitraryrelation between cue-color and stimulus. A Relevant Set Size 2 example is illustrated on the leftwith 2 black cues and 6 white cues. A Relevant Set Size 8 example is illustrated on the right with 8black cues. After the cue, a search display containing 8 discs was presented. Observers knew thattargets would only appear in relevant locations. Thus, the relevant set size was 2 in one case and8 in the other, even though the number of discs that were physically present in the search displaywas 8 in all cases. The critical question was would performance depend on relevant set-size?
The results are shown in Figure 3.10. The open squares and dashed line function show meanpercent correct as a function of relevant set-size. Despite the fact that the physical displays forthese two conditions were identical, there was clearly an effect of dividing attention across 2 versus8 relevant spatial locations. The solid circles and solid line function are a replotting of the data fromthe display set-size experiment (see Figure 3.8). The relevant-set-size effect is essentially indistin-guishable from the display-set-size effect, and that the absolute performance in the correspondingconditions was also well matched.

3.2. THE VISUAL SEARCH PARADIGM 43
60
70
80
90
0 2 4 6 8 10
Per
cent
Cor
rect
Set Size
Figure 3.8: Results from Palmer (1994). The mean percent correct of 4 observers is plotted as afunction of the display set size. Performance declines with increasing set size. The error bars arestandard error of the mean.
The relevant-set-size effect that occurred in this experiment is clearly attentional. The use ofidentical stimuli makes that certain; there was no possibility of stimulus influences on the set-sizeeffect. The relevant-set-size effect, therefore, is a clear example of a divided attention effect, and thisis the most important point for purposes of this introductory chapter on divided attention.
Nonetheless, another important aspect of these experiments is that they provide a case forconverging measures of the set-size effect. Consider first the weakness of the relevant-set-sizeexperiment. Observers must be able to use the cues to allow them to search among stimuli at thecued locations and not at uncued locations. If observers either cannot or do not use the cues, thenthe relevant-set-size effect will be an underestimate of the effect of divided attention. Furthermore, ifthe selection mechanism is not as effective as actually changing the displayed stimuli physically, thenthe relevant-set-size effect will be an underestimate of the divided attention effect. Next consider theweakness of the display-set-size experiment. Any contributions of sensory effects would cause thedisplay set-size experiment to overestimate divided attention effect. The fact that the results fromthe the display-set-size and relevant-set-size experiment were nearly identical is consistent with aparticularly simple interpretation of these issues. For relevant-set-size, the observers used the cuesreliably, and the selection mechanism was as effective as if the displays were actually changed. Fordisplay-set-size, the contributions of crowding and other sensory effects were small relative to theattentional effects. Of course, these conclusions are specific to the conditions of these experiments.But the fact that such conditions are achievable provides an example of isolating attentional effectsfrom effects of the stimulus alone.
The experiments described here to introduce divided attention are success stories in findingconverging measures of divided attention effects. They should, however, be considered exceptions inthe larger world of visual search because set-size manipulations are often confounded with stimulusdifferences. If one does not control eye fixation, eccentricity and crowding, the measured effect of

44 CHAPTER 3. DIVIDED ATTENTION
RelevantSet Size 2
Tim
eCue250ms
RelevantSet Size 8
Warning750 ms
Stimuli100 ms
Figure 3.9: An illustration of the relevant-set-size conditions in Experiment 2 of Palmer (1994):Relevant Set Size 2 on the left and Relevant Set Size 8 on the right. The critical displays areidentical, and only the cues beforehand indicate the relevant stimuli.
attention will be confounded with sensory effects, making it difficult to test theoretical accounts ofattentional processes.
3.3 The Dual-Task Paradigm
We now turn to the dual-task paradigm. For this approach to divided attention, observers arerequired to perform two tasks simultaneously, and performance in a given task is compared to whenthat task is performed alone as a single task. For example, in a dual-task condition, observers mightbe asked to detect lights in two different locations giving separate responses (e.g., “yes” versus “no”)for each of the two locations on each trial. Performance for a given location is then compared toperformance in a single-task condition in which, although lights might appear in either location,they only had to monitor and offer a response for stimuli that appeared in one of the locations.
There is a wide variety of dual-task experiments in the literature. Among other things, theydiffer with regard to whether the two tasks are the same kind of task or not (e.g., detection versusidentification), whether the stimuli are the same for the two tasks or not (e.g., disks versus letters),what the response measure is (e.g., speeded response time versus unspeeded response accuracy) andwhether the displays are identical across dual- and single-task conditions. Our goal is to introduce

3.3. THE DUAL-TASK PARADIGM 45
60
70
80
90
0 2 4 6 8 10
Display Set SizeRelevant Set Size
Per
cent
Cor
rect
Set Size
Figure 3.10: Results from Palmer (1994). The mean percent correct of 4 observers is plotted as afunction of the display set size for both display set size and relevant set size. Performance declineswith increasing set size in a similar fashion for both manipulations. This is consistent with botheffects being attentional.
examples of clear effects of divided attention in order to set the stage for developing a theoreticalunderstanding of attentional processes. With that in mind, we start by describing an experimentin which the the two tasks were simple and identical (i.e., two luminance detection tasks), andperformance was measured in terms of response accuracy. In dual tasks, response time introducessignificant complications because dual-tasks (usually) require two separate responses. By speedingresponses and measuring how long they take, contributions from the response processes themselvescan contribute to differences between the dual- and single-task conditions. This is a topic ofintense study in the larger world of attention (e.g., the psychological refractory period, Welford,xxx; Pashler, xxx). Our focus, however, is visual attention, and so we will limit our discussionto dual tasks in which observers are allowed as much time to make their responses as they needand performance is measured in terms of accuracy rather than time. Finally, we focus on tasks inwhich the stimuli are presented briefly and simultaneously. This prevents eye movements and thepotential sensory contributions that we’ve discussed before. Indeed, most dual-task experimentsare similar to the relevant-set-size experiment in that identical stimuli are used in all conditions.We will call experiments that satisfy these constraints dual search tasks to distinguish them fordual tasks more generally.
The procedure for our example dual-search experiment (Bonnel, Stein and Bertucci, 1992) isillustrated in Figure 3.11. Observers were asked to detect luminance increments that could appearon either the left or right side of a display, which consisted of two small LEDs on either side ofa video camera lens (used to record eye position). Observers fixated the center of the lens of thecamera which put the LEDs 7◦ from fixation. Cues at the beginning of each trial indicated whetherobservers were to monitor only a single location (single-task condition) or monitor both locations(dual-task condition). Following the cue, observers indicated that they were ready by pressing afootswitch. After a short delay, a small luminance increment was (or was not) presented briefly (20

46 CHAPTER 3. DIVIDED ATTENTION
Dual-TaskCondition
Blank Interval(150 ms)
Luminance Increment (20 ms)
Blank Interval (till response)
Tim
e Precue (500 ms)
Single-TaskCondition
Blank Interval(until “ready” response)
Figure 3.11: An illustration of the dual-task procedure used by Bonnel et al. (1992). The leftcolumn shows the dual-task condition and the right column shows the single-task condition. Thedisplays are identical except for the precue that identifies the condition (two horizontal lines forthe dual task and left or right vertical lines for the single task).

3.3. THE DUAL-TASK PARADIGM 47
0
1
2
3
Dis
crim
inab
ility
(d'e
)
Fixed-Capacity
Unlimited- Capacity
Single DualTask
Figure 3.12: The results the luminance detection experiment in Bonnel et al. (1992)). The meand�e of 4 observers is plotted for the single- and dual-task conditions. Performance is similar in thetwo conditions. Given the single-task performance, the prediction of the unlimited-capacity andfixed-capacity models are shown for comparison. These models are defined in the following sectionon theories of divided attention.
ms). The probability of a luminance increment was 0.5 for each of the two sides, independently.Thus, on any given trial, a luminance increment could appear in one, neither, or both sides of thedisplay. In the dual-task conditions, observers made separate responses (“yes” or “no”) for the twosides. In the single-task conditions, they made a response for the cued side only.
Results for dual-task performance versus single-task performance (collapsed across the two sides)are given in Figure 3.12. Accuracy is plotted as a function of single- versus dual-task conditions.(Accuracy is reported in terms of d�e which is a bias-free measure of performance based on signaldetection theory. Details of signal detection theory are given in Chapter xxx, where we considerquantitative models of attention. For the moment, however, it is sufficient to think of this as atheoretical measure of performance similar to response accuracy. The main result of this experimentis that there is no dual-task effect. The graph also shows two theoretical predictions that aredeveloped in the following section. The “limited-capacity prediction” is that performance in thedual task will match the single task. In contrast, the “fixed-capacity prediction” is that performancewill decline by the amount predicted by a model in which only half the information can be extractedfrom each stimulus in the dual task (details in Chapter xxx). Clearly, the near-zero effects are muchless than predicted by such a model.
Another way to consider the results of this experiment is to look at performance as a function ofthe congruency of the stimuli and their associated responses across the two locations on each trial.Congruent trials are ones in which there are either stimuli on both sides or stimuli on neither sideand so the associated response is the same for the two sides, both “yes” or both “no”. Incongruenttrials are ones in which there is a stimulus on one side but no stimulus on the other side and sothe associated responses are opposite for the two sides, one “yes” and one “no”. If performance is

48 CHAPTER 3. DIVIDED ATTENTION
different for congruent and incongruent trials, then it would imply a dependency of processing acrossthe two stimulus locations. In other words, an effect of congruency is another kind of attentioneffect. For this experiment, there was a hint of a congruency effect in the dual-task condition,but it was not statistically reliable (82% versus 67% correct for congruent and incongruent trials,respectively). There was not even a hint of a congruency effect for the single-task trials (78%correct in both conditions). We mention these congruency effects because they will show up infuture chapters on both selective and divided attention. In particular, this is the kind of analysisthat motivates the concept of interactive processing (e.g. crosstalk) in the next section.
In summary, for contrast detection with dual search tasks, there is no evidence of an effect ofdividing attention across two locations. The lack of divided attention effects in this case seemsto contrast with the divided attention effects found in the visual search experiments described inthe previous sections. But before pursuing such interpretations, one must put some theory on thetable.
3.4 Theoretical Accounts of Divided Attention
We now turn to theoretical accounts of divided attention. What aspects of internal processingcan lead to dependence of processing across stimuli, and thereby effects of divided attention?To begin, we introduce three different kinds of processing dependence. Various combinations ofthese dependencies can lead to a variety of models, some of which make distinctive predictions.In this introductory chapter, we describe three theoretical distinctions and consider four genericmodels.
3.4.1 Unlimited versus limited capacity processing
The first theoretical distinction regarding potential processing dependencies is between unlimitedand limited (processing) capacity. This distinction, like all of the processing dependencies weconsider, can be thought of as involving a kind of independence property. Is the processing ofan individual stimulus independent of the number of relevant stimuli? To make this concrete,consider the Bonnel and colleague’s experiment with two lights that was described above. Does theperception of a given light depend on whether one must judge that light alone or must judge bothlights?
The term “capacity” derives from considering perceptual processing as a communication channel(Broadbent, 1958). The idea is that if additional stimuli do not impact the quality of informationthat is transmitted per unit time about each stimulus, then that processing has unlimited capacity.Unlimited capacity does not imply perfect processing. “Unlimited” simply refers to the usualquality of processing being unchanged by having to process additional stimuli (independence). Incontrast, if processing has limited capacity then the quality of the information for a given stimulusdeclines as increasing numbers of stimuli are processed (dependence). The idea is that the outcomeof a given process is either limited or not by how many stimuli must be processed.
Unlimited capacity is one extreme of the capacity distinction. The other extreme is a specificversion of limited-capacity processing that we refer to as fixed-capacity processing, and it is worth

3.4. THEORETICAL ACCOUNTS OF DIVIDED ATTENTION 49
considering separately. For fixed-capacity processing, only a fixed total amount of information canbe transmitted per unit time. As a consequence, the amount of information about any individualstimulus will be limited directly by the number of stimuli that must be processed. Fixed-capacitymodels imply an extreme dependence of processing and as a consequence they make specific pre-dictions regarding divided attention effects that can be useful in testing among alternative models.We will consider some of these in a later section of this chapter.
3.4.2 Parallel versus nonparallel processing
The second theoretical distinction regarding potential processing dependencies is between paralleland nonparallel processing. With parallel processing, the timecourse of the processing of any onestimulus is independent of the number of relevant stimuli. In contrast, nonparallel processingimplies the timecourse of processing any one stimulus depends on the presence of other relevantstimuli. Consider again the Bonnel two-light example. Parallel processing implies the timecourseof processing one of the lights is unaffected by the relevance of the other light. The processing ofeach light has independent and identical timecourses.
The best known example of a nonparallel model is the standard serial model. In this model,information from each stimulus is processed one at a time in sequence. Eye movements provide aconcrete example of a serial process. To directly view two lights, you have to move your eyes toview each light one at a time in sequence.
3.4.3 Noninteractive versus interactive processing
The third theoretical distinction regarding potential processing dependencies concerns the interac-tive processing of individual stimuli on individual trials. If channels of processing are noninteractive,then the processing of one stimulus is unaffected by the specific value of other stimuli that are beingprocessed at the same time. If channels of processing are interactive, then the value of a given stim-ulus affects the processing that occurs for another stimulus. Consider the Bonnel example again.A example of interactive processing is to have the processing of one light affected by the valueof the other light. For such a case, congruent lights have an advantage compared in incongurentlights.
The best known example of interactive processing is what we call the standard crosstalk model(e.g. Ernst, Palmer & Boynton, 2012; Navon & Miller, xxx). In this model, the stimuli areprocessed in parallel and without general dependencies on the number of stimuli (limited capacity).But, there are dependencies among the specific stimuli being processed. Specifically, there is somedegree of pooling across the different stimuli.
3.4.4 An illustration of the three dependencies
These three dependencies are illustrated in Figure 3.13. The cube represents all combinations ofthe three dependencies. Each axis represents a different dependency. On the bottom are labels

50 CHAPTER 3. DIVIDED ATTENTION
CapacityTimecourse
Stimulus-Specfic
UnlimitedLimited
ParallelNonparallel
Noninteractive
Interactive
Standard serial model
Fixed-capacity, parallel model
Standard crosstalk model
Standard parallel model
Figure 3.13: An illustration of the possible dependencies in processing multiple stimuli. The cubeillustrates all combinations of the three possible dependencies: capacity, timecourse and stimulus-specific. All three of these are independent for the standard parallel model. In contrast, the otherthree models illustrate relatively pure versions of each of the three possible dependencies.
3.4. THEORETICAL ACCOUNTS OF DIVIDED ATTENTION 51
for the dependencies in timecourse and in capacity. On the right, is the label for the dependencyon interactive processes. This cube is more than a 2-by-2-by-2. One value of each dependencyrepresents independence. There is only one way to be independent while there are many ways tohave a dependency. Hence the cube has a relatively small volume to represent the independent sideof each possible dependency.
3.4.5 Four example models
There are many different ways in which properties of these three potential sources of processingdependency can be combined to form specific process models. For purposes of illustration, webriefly introduce four different models and illustrate them in our figure of possible dependencies.The figure uses a cube to illustrate the range of all possible models. We use black to denote thecube and its labels; and, we use color to denote the four specific models.
The first and simplest model is the standard parallel model. As the name implies, this modelassumes parallel processing. In addition, the modifier “standard” is used to indicate the further as-sumptions of unlimited-capacity and noninteractive processing. This is the simplest possible modelwithin the context of the three potential sources of processing dependency described above. Eachof the three properties – parallel, unlimited capacity, noninteractive stimulus-specific processing –implies independence of processing. This unique model is shown in blue.
The second model is the fixed-capacity, parallel model. Like the standard parallel model, thismodel assumes parallel processing. However, it also assumes fixed-capacity processing, which im-plies a particular processing dependence. This model and the other models with dependencies areshown in red.
The third model is the standard serial model. It assumes serial processing, which implies aspecific dependence in the timecourse of processing. The modifier “standard” is used to indicatethe further assumptions of limited capacity and noninteractive processing.
Finally, the fourth model is the standard crosstalk model. This parallel model is built around adependency in stimulus-specific processing. The term “standard” refers to the assumption of par-allel processing and independence of any general effect of the number of relevant stimuli (unlimitedcapacity).
These four examples are intended as generic process models that can be applied to specific taskcontexts in order to build theories of divided attention. Such theories must elaborate how themodel applies to a given task and stimulus set. Detailed examples are given in Chapter xxx onquantitative models.
3.4.6 Comment on terminology
The three dependencies of capacity, timecourse and interactive processing each have a history.The terminology of capacity has long been used in theories of attention from Broadbent (1958),to Kahneman (1973) to Pashler (1998). We maintain their usage in our treatment. But, in the

52 CHAPTER 3. DIVIDED ATTENTION
literature more generally, one must take care exactly how the term is used. Some authors (e.g.Townsend & Ashby, 1983) use it in a slightly different way to contrast capacity with dependenciesin the timecourse of processing.
We depart from convention in contrasting parallel and nonparallel processing rather than paralleland serial processing. Our purpose is to distinguish the larger idea of independent time courses(parallel processing) from the specific example of nonparallel processing that is the standard serialmodel. This hopefully will make more clear the parallels between the three distinctions.
Finally, we differ from recent attention texts in considering dependencies due to interactiveprocessing on par with dependencies due to capacity limits and nonparallel processing. We weredrawn to this by the mounting examples of interactive processing we found in the literature. Forthis case, the terminology in the literature varies quite widely. Interactive processing (xxx) refersto any possible dependence between stimuli in separate channels. Crosstalk (xxx) refers to thepartial “pooling” of stimulus information across channels. Stochastic dependence (xxx) refers tothe trial-by-trial “noise” correlation of otherwise identical stimuli. For purposes of introduction, theconcepts of interactive processing, crosstalk and stochastic dependence can be considered essentiallyinterchangeable.
We now turn to one of the major challenges to building theories of divided attention. Effectsof divided attention (e.g., set-size effects or dual-task effects) are measured using tasks that un-fold through multiple processes. Some of the processes might function independently for multiplestimuli, while others might have dependencies. Moreover, some of the processes may fall intothe broader domain of interest (e.g., vision), whereas others that are necessary to do that task,nonetheless fall outside of domain of theoretical interest (e.g., response execution). One challenge,therefore, is ascertaining what component processes gave rise to the effect of interest. In the nextsection, we consider a first-pass through visual processing similar to what we did for selection in thelast chapter. Specifically, we ask whether observed effects of divided attention reflect processingdependencies in perception, in decision, or perhaps in both.
3.5 The Locus of Processing Dependencies
Building toward a general theory of divided attention, we seek to ask which visual processes possessdependencies of one kind or another, as assessed by evidence of divided attention effects. This isthe divided attention version of the locus question that we raised for selective attention in thelast chapter. In that case, we asked about the locus of selection. Here we ask about the locus ofprocessing dependencies. For selective attention, we began by contrasting the selective-perceptionhypotheses with the selective-decision hypotheses. For divided attention, we contrast dependent-perception hypotheses with dependent-decision hypotheses.
3.5.1 Dependent perception
The most common interpretation of set-size and dual-task effects is in terms of dependent per-ception. Specifically, they are interpreted as evidence that one or more perceptual process has

3.6. VISUAL SEARCH REVISITED: SIMULTANEOUS-SEQUENTIAL PARADIGM 53
dependencies across stimuli (e.g., is serial or limited-capacity parallel). A well-known example isfeature integration theory (Treisman & Gelade, 1980). In this theory, a serial process is requiredto represent a stimulus as a conjunction of features (e.g., red and vertical, as distinct from justred or just vertical). This processing dependency predicts poorer performance (e.g., slower and/orless accurate) with larger set sizes for any task that depends on feature conjunctions; that is, itpredicts set-size effects. This is an example of a dependent-perception hypothesis. More generally,any hypothesis that assumes the relevant perceptual process to be serial, limited-capacity parallel,or interactive would be an example of a dependent-perception hypotheses.
3.5.2 Dependent decision
An alternative interpretation of set-size or dual-task effects is in terms of dependent decision.Specifically, it is assumed that all perceptual processes for a given task are entirely independent,but that decision processes are subject to dependencies across stimuli. The starting assumption ofthis hypothesis is that the representation of each stimulus is noisy and that such noise is the sourceof errors in decision. Because visual search has multiple stimuli that contribute to the decision, eachadditional stimulus will contribute additional opportunity for an error to be made. As a consequenceperformance will decline as set size increases. This decision effect occurs without there being anydependencies within perceptual processes. This is an example of a dependent-decision hypothesisfor visual search.
The modifier “decision” in dependent-decision hypotheses can lead to some confusion that isworth raising explicitly. Dependent-decision hypotheses still concern visual processes. The focusis on decision processes within later visual processes that based on the output of earlier visualprocesses, which for want of a better label are being referred to as “perceptual” processes. Thisdistinction should not be confused with the distinction between sensitivity and decision bias thatwas introduced in the last chapter. Decision bias refers to influences from beyond the visual system,such as a reluctance to report seeing stimuli that aren’t there leading to a bias to report “no” in ayes/no detection task. Decision bias is something to be worried about as a potential contaminationof measures if one is interested in visual processing. Dependent-decision hypotheses, however, arestatements about where within visual processing – sometimes referred to as early (perceptual)versus late (decisional) – dependencies arise. They still concern vision and, by extension, visualattention.
3.6 Visual Search Revisited: Simultaneous-Sequential Paradigm
Set-size effects, in general, cannot provide a test between dependent-perception and dependent-decision hypotheses. Both hypotheses predict that performance will decrease with increasing setsize. One solution to this problem has been to try to make more specific quantitative predictionsregarding the expected magnitude of set-size effects in order to discriminate between the twohypotheses. Such efforts have tended to resolve the question in favor of dependent decision overa dependent perception for simple feature tasks (e.g., Palmer, et al., 1993; Shaw, 1984). Thisapproach, however, has a disadvantage. It requires a commitment to fairly specific assumptionsabout details of the process model that may or may not be warranted.
54 CHAPTER 3. DIVIDED ATTENTION
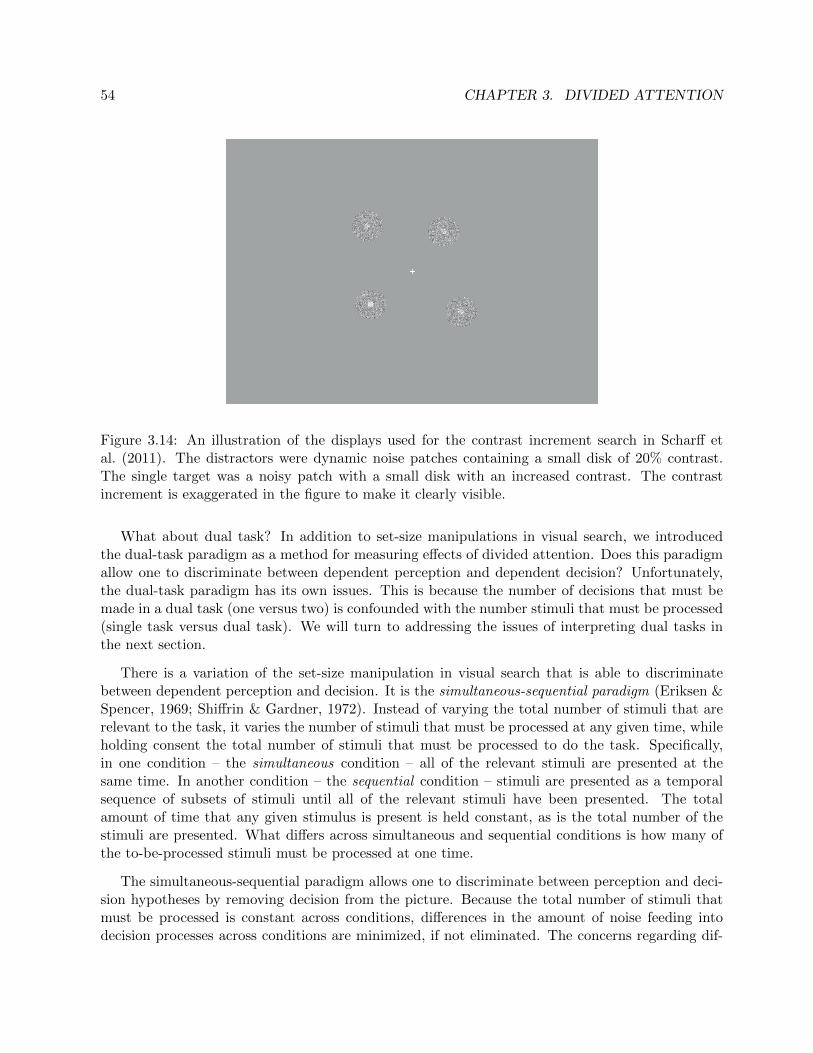
Figure 3.14: An illustration of the displays used for the contrast increment search in Scharff etal. (2011). The distractors were dynamic noise patches containing a small disk of 20% contrast.The single target was a noisy patch with a small disk with an increased contrast. The contrastincrement is exaggerated in the figure to make it clearly visible.
What about dual task? In addition to set-size manipulations in visual search, we introducedthe dual-task paradigm as a method for measuring effects of divided attention. Does this paradigmallow one to discriminate between dependent perception and dependent decision? Unfortunately,the dual-task paradigm has its own issues. This is because the number of decisions that must bemade in a dual task (one versus two) is confounded with the number stimuli that must be processed(single task versus dual task). We will turn to addressing the issues of interpreting dual tasks inthe next section.
There is a variation of the set-size manipulation in visual search that is able to discriminatebetween dependent perception and decision. It is the simultaneous-sequential paradigm (Eriksen &Spencer, 1969; Shiffrin & Gardner, 1972). Instead of varying the total number of stimuli that arerelevant to the task, it varies the number of stimuli that must be processed at any given time, whileholding consent the total number of stimuli that must be processed to do the task. Specifically,in one condition – the simultaneous condition – all of the relevant stimuli are presented at thesame time. In another condition – the sequential condition – stimuli are presented as a temporalsequence of subsets of stimuli until all of the relevant stimuli have been presented. The totalamount of time that any given stimulus is present is held constant, as is the total number of thestimuli are presented. What differs across simultaneous and sequential conditions is how many ofthe to-be-processed stimuli must be processed at one time.
The simultaneous-sequential paradigm allows one to discriminate between perception and deci-sion hypotheses by removing decision from the picture. Because the total number of stimuli thatmust be processed is constant across conditions, differences in the amount of noise feeding intodecision processes across conditions are minimized, if not eliminated. The concerns regarding dif-

3.6. VISUAL SEARCH REVISITED: SIMULTANEOUS-SEQUENTIAL PARADIGM 55
ferences in decision noise that we saw with standard set-size manipulations are therefore avoided inthis paradigm. As a consequence, any differences in performance across simultaneous and sequentialconditions can be attributed to dependencies within perception and not decision.
In this introductory chapter, we present a few examples of simultaneous-sequential experiments.They differ in the specific task that observers were asked to do, though all are still examples ofrelatively simple tasks. Several of the experiments revealed evidence of independent processingacross stimuli, whereas one experiment revealed evidence of dependent perception. We highlightthis contrast because in later chapters we will consider other simultaneous-sequential experimentsthat used more complex stimuli and tasks as a means of refining the locus question for dividedattention – which processes, in particular, have dependencies and which do not? – with a broadergoal of building a general theory of divided attention. For the moment, however, the goal is todescribe the simultaneous-sequential method and to present cases with and without evidence forprocessing dependencies within perception.
Example 1: Contrast-increment search
The first example used a simple contrast-increment search task (Scharff, Palmer & Moore, 2011).Displays contained four small (0.5◦) disks (3 distractors and 1 target), each presented in a smallfield of dynamic noise near the corners of an approximately 6◦ imaginary square around fixation(see Figure 3.14). Distractor contrast was 20%, with target contrast just a bit higher (ranging from28 to 35%), adjusted so that each observer could perform that task at roughly 75% accuracy. Thetask was to report which of the four quadrants contained the target with a corresponding key press.Responses were not speeded.
The experiment included three conditions as illustrated in Figure 3.15. In the simultaneouscondition (left), a brief fixation interval was followed by a 100 ms display with four stimuli, afterwhich the observer was prompted for the localization response. In the sequential condition (middle),two stimuli were presented in an initial 100 ms display, followed 1000 ms later by a second 100 msdisplay containing the other two stimuli. Thus for both of these two conditions, each individualstimulus was displayed for 100 ms. The third condition was the repeated condition (right) in whichall four stimuli were presented for an initial 100 ms display followed 1000 ms later by a second 100ms display containing all four stimuli again. Thus each individual stimulus was displayed for fortwice the time in the repeated condition than in the simultaneous and sequential conditions.
Figure 3.16 illustrates the logic of the experiment. In six panels, separate representations ofhow processing unfolds across the simultaneous, sequential, and repeated conditions dependingon whether the processes involved were all completely independent (i.e., standard parallel model)or highly dependent (e.g., standard serial model). Each panel illustrates two sequential framesthat contain up to four stimuli each. Time is illustrated as moving from left to right, and thedifferent stimuli within a display are depicted as grey bars, separated vertically and labeled 1-4.The processing that each stimulus receives according to the given model is denoted by black arrowssuperimposed on the grey bars depicting the stimuli. Predictions for performance across the threeconditions for each model are shown in the bottom row of the figure. These performance predictionsare derived by assuming that longer processing leads to better performance.

56 CHAPTER 3. DIVIDED ATTENTION
SimultaneousCondition
SequentialCondition
Fixation (250 ms)
Stimulus (100 ms)
Stimulus (100 ms)
Blank Interval (1000 ms)
Prompt (till response)
Tim
e
? ? ?
RepeatedCondition
selection (e.g., Pashler, 1998), both of which are interpreted as sequential paradigm. In the decades since, many authors have usedthe paradigm to address a variety of questions about capacity
Sample display from the simultaneous condition of the contrast discrimination task. The threedistractors are discs of lower contrast and the target is a single disc of higher contrast. In this illustration, thecontrast values have been exaggerated. The stimuli are embedded in dynamic Gaussian noise patches.
a standard serial model make similar predictions. Examples offixed-capacity processing in cognition are memory retrieval fororder information (e.g., McElree & Dosher, 1993) and responseselection (e.g., Pashler, 1998), both of which are interpreted as
Background on the Simultaneous-Sequential Paradigm
Eriksen and Spencer (1969) introduced the simultaneous-sequential paradigm. In the decades since, many authors have usedthe paradigm to address a variety of questions about capacity
Sample display from the simultaneous condition of the contrast discrimination task. The threedistractors are discs of lower contrast and the target is a single disc of higher contrast. In this illustration, thecontrast values have been exaggerated. The stimuli are embedded in dynamic Gaussian noise patches.
the paradigm to address a variety of questions about capacity
Sample display from the simultaneous condition of the contrast discrimination task. The threedistractors are discs of lower contrast and the target is a single disc of higher contrast. In this illustration, thecontrast values have been exaggerated. The stimuli are embedded in dynamic Gaussian noise patches.
a standard serial model make similar predictions. Examples offixed-capacity processing in cognition are memory retrieval fororder information (e.g., McElree & Dosher, 1993) and responseselection (e.g., Pashler, 1998), both of which are interpreted asserial processes.
Background on the Simultaneous-Sequential Paradigm
Eriksen and Spencer (1969) introduced the simultaneous-sequential paradigm. In the decades since, many authors have usedthe paradigm to address a variety of questions about capacity
Figure 1. Sample display from the simultaneous condition of the contrast discrimination task. The threedistractors are discs of lower contrast and the target is a single disc of higher contrast. In this illustration, thecontrast values have been exaggerated. The stimuli are embedded in dynamic Gaussian noise patches.
the paradigm to address a variety of questions about capacity
Sample display from the simultaneous condition of the contrast discrimination task. The threedistractors are discs of lower contrast and the target is a single disc of higher contrast. In this illustration, thecontrast values have been exaggerated. The stimuli are embedded in dynamic Gaussian noise patches.
selection (e.g., Pashler, 1998), both of which are interpreted asserial processes.
sequential paradigm. In the decades since, many authors have usedthe paradigm to address a variety of questions about capacity
Figure 1. Sample display from the simultaneous condition of the contrast discrimination task. The threedistractors are discs of lower contrast and the target is a single disc of higher contrast. In this illustration, thecontrast values have been exaggerated. The stimuli are embedded in dynamic Gaussian noise patches.
a standard serial model make similar predictions. Examples offixed-capacity processing in cognition are memory retrieval fororder information (e.g., McElree & Dosher, 1993) and responseselection (e.g., Pashler, 1998), both of which are interpreted asserial processes.
Background on the Simultaneous-Sequential Paradigm
Eriksen and Spencer (1969) introduced the simultaneous-sequential paradigm. In the decades since, many authors have usedthe paradigm to address a variety of questions about capacity
Figure 1. Sample display from the simultaneous condition of the contrast discrimination task. The threedistractors are discs of lower contrast and the target is a single disc of higher contrast. In this illustration, thecontrast values have been exaggerated. The stimuli are embedded in dynamic Gaussian noise patches.
serial processes. the paradigm to address a variety of questions about capacity
Figure 1. Sample display from the simultaneous condition of the contrast discrimination task. The threedistractors are discs of lower contrast and the target is a single disc of higher contrast. In this illustration, thecontrast values have been exaggerated. The stimuli are embedded in dynamic Gaussian noise patches.
through the items one-at-a-time (e.g., Sternberg, 1969). In sam-pling terms, an observer samples one stimulus until a satisfactoryrepresentation has been formed, and then moves on to sample thenext stimulus. A parallel, fixed-capacity model is also possible, inwhich the observer samples from multiple items in parallel, divid-ing the samples among them (Shaw, 1980; Palmer, 1990). Theexperiments presented in this article do not distinguish betweenserial and parallel accounts of fixed-capacity processing. However,we use will use the standard serial model to illustrate fixed-capacity predictions in this article. In Appendix A, we derivespecific predictions to show the parallel, fixed-capacity model anda standard serial model make similar predictions. Examples offixed-capacity processing in cognition are memory retrieval fororder information (e.g., McElree & Dosher, 1993) and responseselection (e.g., Pashler, 1998), both of which are interpreted asserial processes.
lel processing (e.g., Bonnel et al, 1992; Palmer, 1995; Palmer,Verghese, & Pavel, 2000; Huang & Pashler, 2005; Davis et al.,2006; but see Posner, 1980).Word categorization. In the second task, observers locate a
word from a specified semantic category. For example, if the targetcategory is ‘animals,’ the target word might be ‘dog’ and distrac-tors might be ‘car,’ ‘belt,’ and ‘poet’. Figure 2 shows a sampledisplay from our study. This task is closely related to reading, aprocess that many argue is serial (Karlin & Bower, 1976; Starr &Rayner, 2001; but see Brown, Gore, & Carr, 2002).
Background on the Simultaneous-Sequential Paradigm
Eriksen and Spencer (1969) introduced the simultaneous-sequential paradigm. In the decades since, many authors have usedthe paradigm to address a variety of questions about capacity
Figure 1. Sample display from the simultaneous condition of the contrast discrimination task. The three
tion can be processed per unit time. In terms of sampling, this is afixed number of samples per unit time. One example of this classof models is the standard serial model, in which an observer scansthrough the items one-at-a-time (e.g., Sternberg, 1969). In sam-pling terms, an observer samples one stimulus until a satisfactoryrepresentation has been formed, and then moves on to sample thenext stimulus. A parallel, fixed-capacity model is also possible, inwhich the observer samples from multiple items in parallel, divid-ing the samples among them (Shaw, 1980; Palmer, 1990). Theexperiments presented in this article do not distinguish betweenserial and parallel accounts of fixed-capacity processing. However,we use will use the standard serial model to illustrate fixed-capacity predictions in this article. In Appendix A, we derivespecific predictions to show the parallel, fixed-capacity model anda standard serial model make similar predictions. Examples offixed-capacity processing in cognition are memory retrieval fororder information (e.g., McElree & Dosher, 1993) and responseselection (e.g., Pashler, 1998), both of which are interpreted as
The observer’s task is to indicate the location of the higher-contrast target disc. There is considerable evidence that simplevisual discriminations such as this have unlimited-capacity, paral-lel processing (e.g., Bonnel et al, 1992; Palmer, 1995; Palmer,Verghese, & Pavel, 2000; Huang & Pashler, 2005; Davis et al.,2006; but see Posner, 1980).Word categorization. In the second task, observers locate a
word from a specified semantic category. For example, if the targetcategory is ‘animals,’ the target word might be ‘dog’ and distrac-tors might be ‘car,’ ‘belt,’ and ‘poet’. Figure 2 shows a sampledisplay from our study. This task is closely related to reading, aprocess that many argue is serial (Karlin & Bower, 1976; Starr &Rayner, 2001; but see Brown, Gore, & Carr, 2002).
Background on the Simultaneous-Sequential Paradigm
Eriksen and Spencer (1969) introduced the simultaneous-sequential paradigm. In the decades since, many authors have usedthe paradigm to address a variety of questions about capacity
of models is the standard serial model, in which an observer scansthrough the items one-at-a-time (e.g., Sternberg, 1969). In sam-pling terms, an observer samples one stimulus until a satisfactoryrepresentation has been formed, and then moves on to sample thenext stimulus. A parallel, fixed-capacity model is also possible, inwhich the observer samples from multiple items in parallel, divid-ing the samples among them (Shaw, 1980; Palmer, 1990). Theexperiments presented in this article do not distinguish betweenserial and parallel accounts of fixed-capacity processing. However,we use will use the standard serial model to illustrate fixed-capacity predictions in this article. In Appendix A, we derivespecific predictions to show the parallel, fixed-capacity model anda standard serial model make similar predictions. Examples offixed-capacity processing in cognition are memory retrieval fororder information (e.g., McElree & Dosher, 1993) and responseselection (e.g., Pashler, 1998), both of which are interpreted asserial processes.
visual discriminations such as this have unlimited-capacity, paral-lel processing (e.g., Bonnel et al, 1992; Palmer, 1995; Palmer,Verghese, & Pavel, 2000; Huang & Pashler, 2005; Davis et al.,2006; but see Posner, 1980).Word categorization. In the second task, observers locate a
word from a specified semantic category. For example, if the targetcategory is ‘animals,’ the target word might be ‘dog’ and distrac-tors might be ‘car,’ ‘belt,’ and ‘poet’. Figure 2 shows a sampledisplay from our study. This task is closely related to reading, aprocess that many argue is serial (Karlin & Bower, 1976; Starr &Rayner, 2001; but see Brown, Gore, & Carr, 2002).
Background on the Simultaneous-Sequential Paradigm
Eriksen and Spencer (1969) introduced the simultaneous-sequential paradigm. In the decades since, many authors have usedthe paradigm to address a variety of questions about capacity
Figure 1. Sample display from the simultaneous condition of the contrast discrimination task. The three
Under a fixed-capacity model, only a fixed amount of informa-tion can be processed per unit time. In terms of sampling, this is afixed number of samples per unit time. One example of this classof models is the standard serial model, in which an observer scansthrough the items one-at-a-time (e.g., Sternberg, 1969). In sam-pling terms, an observer samples one stimulus until a satisfactoryrepresentation has been formed, and then moves on to sample thenext stimulus. A parallel, fixed-capacity model is also possible, inwhich the observer samples from multiple items in parallel, divid-ing the samples among them (Shaw, 1980; Palmer, 1990). Theexperiments presented in this article do not distinguish betweenserial and parallel accounts of fixed-capacity processing. However,we use will use the standard serial model to illustrate fixed-capacity predictions in this article. In Appendix A, we derivespecific predictions to show the parallel, fixed-capacity model anda standard serial model make similar predictions. Examples offixed-capacity processing in cognition are memory retrieval fororder information (e.g., McElree & Dosher, 1993) and responseselection (e.g., Pashler, 1998), both of which are interpreted asserial processes.
which the discs are embedded in dynamic random visual noise.The observer’s task is to indicate the location of the higher-contrast target disc. There is considerable evidence that simplevisual discriminations such as this have unlimited-capacity, paral-lel processing (e.g., Bonnel et al, 1992; Palmer, 1995; Palmer,Verghese, & Pavel, 2000; Huang & Pashler, 2005; Davis et al.,2006; but see Posner, 1980).Word categorization. In the second task, observers locate a
word from a specified semantic category. For example, if the targetcategory is ‘animals,’ the target word might be ‘dog’ and distrac-tors might be ‘car,’ ‘belt,’ and ‘poet’. Figure 2 shows a sampledisplay from our study. This task is closely related to reading, aprocess that many argue is serial (Karlin & Bower, 1976; Starr &Rayner, 2001; but see Brown, Gore, & Carr, 2002).
Background on the Simultaneous-Sequential Paradigm
Eriksen and Spencer (1969) introduced the simultaneous-sequential paradigm. In the decades since, many authors have usedthe paradigm to address a variety of questions about capacity
tion can be processed per unit time. In terms of sampling, this is afixed number of samples per unit time. One example of this classof models is the standard serial model, in which an observer scansthrough the items one-at-a-time (e.g., Sternberg, 1969). In sam-pling terms, an observer samples one stimulus until a satisfactoryrepresentation has been formed, and then moves on to sample thenext stimulus. A parallel, fixed-capacity model is also possible, inwhich the observer samples from multiple items in parallel, divid-ing the samples among them (Shaw, 1980; Palmer, 1990). Theexperiments presented in this article do not distinguish betweenserial and parallel accounts of fixed-capacity processing. However,we use will use the standard serial model to illustrate fixed-capacity predictions in this article. In Appendix A, we derivespecific predictions to show the parallel, fixed-capacity model anda standard serial model make similar predictions. Examples offixed-capacity processing in cognition are memory retrieval fororder information (e.g., McElree & Dosher, 1993) and responseselection (e.g., Pashler, 1998), both of which are interpreted asserial processes.
The observer’s task is to indicate the location of the higher-contrast target disc. There is considerable evidence that simplevisual discriminations such as this have unlimited-capacity, paral-lel processing (e.g., Bonnel et al, 1992; Palmer, 1995; Palmer,Verghese, & Pavel, 2000; Huang & Pashler, 2005; Davis et al.,2006; but see Posner, 1980).Word categorization. In the second task, observers locate a
word from a specified semantic category. For example, if the targetcategory is ‘animals,’ the target word might be ‘dog’ and distrac-tors might be ‘car,’ ‘belt,’ and ‘poet’. Figure 2 shows a sampledisplay from our study. This task is closely related to reading, aprocess that many argue is serial (Karlin & Bower, 1976; Starr &Rayner, 2001; but see Brown, Gore, & Carr, 2002).
Background on the Simultaneous-Sequential Paradigm
Eriksen and Spencer (1969) introduced the simultaneous-sequential paradigm. In the decades since, many authors have usedthe paradigm to address a variety of questions about capacity
through the items one-at-a-time (e.g., Sternberg, 1969). In sam-pling terms, an observer samples one stimulus until a satisfactoryrepresentation has been formed, and then moves on to sample thenext stimulus. A parallel, fixed-capacity model is also possible, inwhich the observer samples from multiple items in parallel, divid-ing the samples among them (Shaw, 1980; Palmer, 1990). Theexperiments presented in this article do not distinguish betweenserial and parallel accounts of fixed-capacity processing. However,we use will use the standard serial model to illustrate fixed-capacity predictions in this article. In Appendix A, we derivespecific predictions to show the parallel, fixed-capacity model anda standard serial model make similar predictions. Examples offixed-capacity processing in cognition are memory retrieval fororder information (e.g., McElree & Dosher, 1993) and responseselection (e.g., Pashler, 1998), both of which are interpreted asserial processes.
lel processing (e.g., Bonnel et al, 1992; Palmer, 1995; Palmer,Verghese, & Pavel, 2000; Huang & Pashler, 2005; Davis et al.,2006; but see Posner, 1980).Word categorization. In the second task, observers locate a
word from a specified semantic category. For example, if the targetcategory is ‘animals,’ the target word might be ‘dog’ and distrac-tors might be ‘car,’ ‘belt,’ and ‘poet’. Figure 2 shows a sampledisplay from our study. This task is closely related to reading, aprocess that many argue is serial (Karlin & Bower, 1976; Starr &Rayner, 2001; but see Brown, Gore, & Carr, 2002).
Background on the Simultaneous-Sequential Paradigm
Eriksen and Spencer (1969) introduced the simultaneous-sequential paradigm. In the decades since, many authors have usedthe paradigm to address a variety of questions about capacity
Figure 1. Sample display from the simultaneous condition of the contrast discrimination task. The three
Figure 3.15: An illustration of the three conditions in the extended simultaneous-sequential pro-cedure. The left column shows the simultaneous condition with one display of four stimuli. Themiddle column shows the sequential condition with two displays of two stimuli. The right columnshows the repeated condition with two displays of four stimuli.

3.6. VISUAL SEARCH REVISITED: SIMULTANEOUS-SEQUENTIAL PARADIGM 57
1st Frame 2nd Frame
1234
1234
1st Frame 2nd Frame
1st Frame 2nd Frame
1234
Sequentialcondition
++14 2
++3
4
Simultaneouscondition
+ +1 34 2
Repeatedcondition
++1 34 2
++1 34 2
1st Frame 2nd Frame
1234
1234
1st Frame 2nd Frame
1st Frame 2nd Frame
1234
Unlimited capacity Fixed capacityModels
(serial for demonstration)
Figure 3.16: An illustration of processing sequences for the three conditions according to twomodels. On the left are predictions of the standard parallel model and on the right are predictionsof the standard serial model. The grey regions represent time when the stimulus is presented andthe arrows represent the time a given stimulus is being processed. The standard parallel modelpredicts equivalent performance for the sequential and simultaneous conditions. The standard serialmodel (and many fixed-capacity, parallel models) predicts equivalent performance for the sequentialand repeated conditions.
Consider first the case in which processing is fully independent for stimuli across space (leftcolumn). In this case, processing proceeds independently of the number of stimuli. Therefore,regardless of how many stimuli are presented within a given frame, they will all processed for theentire duration of the frame just as they would were they the only stimulus present. As a con-sequence, difference in performance across conditions will be determined entirely by differences indisplay duration. Because stimuli are displayed for the same amount of time across the simulta-neous and sequential conditions, performance is predicted to be equal across these two conditions.Because stimuli are presented for twice the amount of time in the repeated condition than in theothers, performance is predicted to be better in this condition than in the other two. This is thesimplest possible model for how multiple stimuli are processed across multiple locations.
Consider next the case of high dependence such as the standard serial model. For sake ofargument, imagine that the limit in processing is that only two stimuli can be processed in theamount of time allowed for processing these displays. For this example, only two of the four stimuliin a simultaneous display could be processed. In contrast, all four stimuli could be processed in
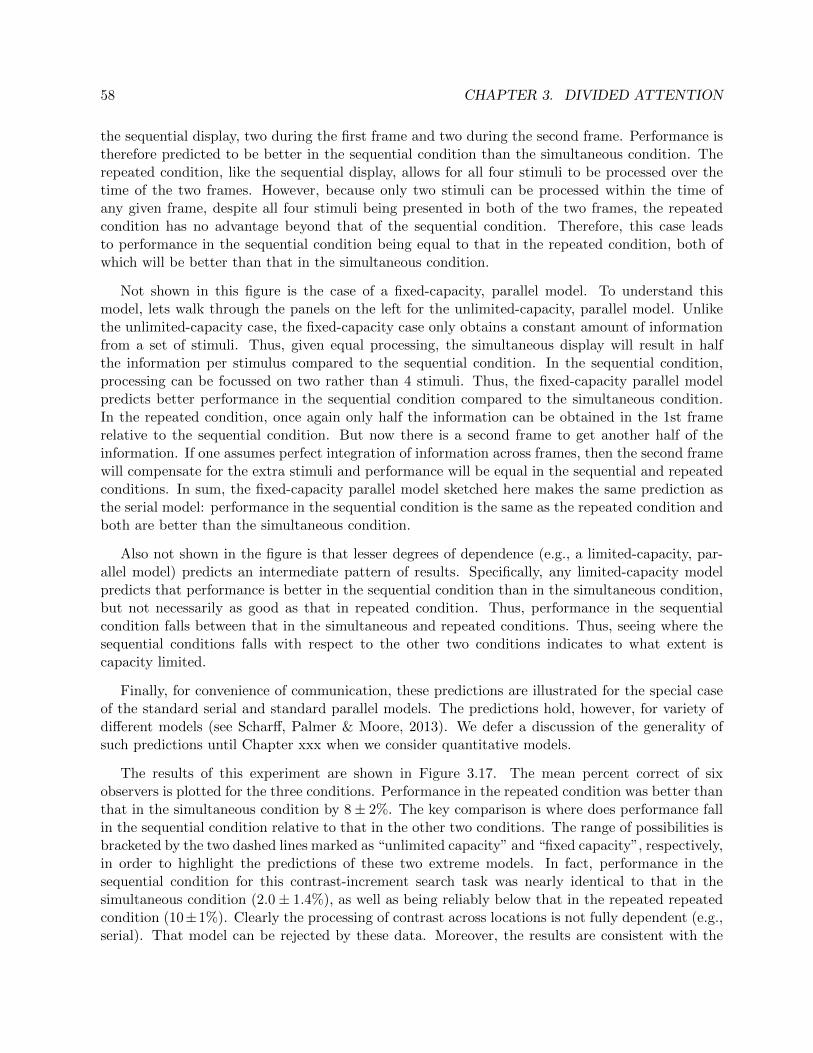
58 CHAPTER 3. DIVIDED ATTENTION
the sequential display, two during the first frame and two during the second frame. Performance istherefore predicted to be better in the sequential condition than the simultaneous condition. Therepeated condition, like the sequential display, allows for all four stimuli to be processed over thetime of the two frames. However, because only two stimuli can be processed within the time ofany given frame, despite all four stimuli being presented in both of the two frames, the repeatedcondition has no advantage beyond that of the sequential condition. Therefore, this case leadsto performance in the sequential condition being equal to that in the repeated condition, both ofwhich will be better than that in the simultaneous condition.
Not shown in this figure is the case of a fixed-capacity, parallel model. To understand thismodel, lets walk through the panels on the left for the unlimited-capacity, parallel model. Unlikethe unlimited-capacity case, the fixed-capacity case only obtains a constant amount of informationfrom a set of stimuli. Thus, given equal processing, the simultaneous display will result in halfthe information per stimulus compared to the sequential condition. In the sequential condition,processing can be focussed on two rather than 4 stimuli. Thus, the fixed-capacity parallel modelpredicts better performance in the sequential condition compared to the simultaneous condition.In the repeated condition, once again only half the information can be obtained in the 1st framerelative to the sequential condition. But now there is a second frame to get another half of theinformation. If one assumes perfect integration of information across frames, then the second framewill compensate for the extra stimuli and performance will be equal in the sequential and repeatedconditions. In sum, the fixed-capacity parallel model sketched here makes the same prediction asthe serial model: performance in the sequential condition is the same as the repeated condition andboth are better than the simultaneous condition.
Also not shown in the figure is that lesser degrees of dependence (e.g., a limited-capacity, par-allel model) predicts an intermediate pattern of results. Specifically, any limited-capacity modelpredicts that performance is better in the sequential condition than in the simultaneous condition,but not necessarily as good as that in repeated condition. Thus, performance in the sequentialcondition falls between that in the simultaneous and repeated conditions. Thus, seeing where thesequential conditions falls with respect to the other two conditions indicates to what extent iscapacity limited.
Finally, for convenience of communication, these predictions are illustrated for the special caseof the standard serial and standard parallel models. The predictions hold, however, for variety ofdifferent models (see Scharff, Palmer & Moore, 2013). We defer a discussion of the generality ofsuch predictions until Chapter xxx when we consider quantitative models.
The results of this experiment are shown in Figure 3.17. The mean percent correct of sixobservers is plotted for the three conditions. Performance in the repeated condition was better thanthat in the simultaneous condition by 8± 2%. The key comparison is where does performance fallin the sequential condition relative to that in the other two conditions. The range of possibilities isbracketed by the two dashed lines marked as “unlimited capacity” and “fixed capacity”, respectively,in order to highlight the predictions of these two extreme models. In fact, performance in thesequential condition for this contrast-increment search task was nearly identical to that in thesimultaneous condition (2.0± 1.4%), as well as being reliably below that in the repeated repeatedcondition (10±1%). Clearly the processing of contrast across locations is not fully dependent (e.g.,serial). That model can be rejected by these data. Moreover, the results are consistent with the

3.6. VISUAL SEARCH REVISITED: SIMULTANEOUS-SEQUENTIAL PARADIGM 59
Simultaneous Sequential Repeated60%
65%
70%
75%
80%
85%
90%
Percentcorrect
Fixed-capacity prediction
Unlimited-capacity prediction
+ +++ ++ ++
Figure 3.17: The results from the contrast increment experiment in Scharff et al. (2011). The meanpercent correct of 6 observers is plotted for the three conditions. Performance in the sequentialcondition is similar to that in the simultaneous condition and reliably less than in the repeatedcondition. This pattern of results is consistent with unlimited-capacity perceptual processing.
possibility that processing of contrast across locations is fully independent (i.e., captured by thestandard parallel model). This is an answer for contrast-increment search. What about tasks thatrequire other visual processes?
Example 2: Size-decrement search versus a spatial-relation search
The second example that we consider here is especially nice for the goals of this initial chapter.It contrasts the effects of divided attention as measured through set-size effects versus differencesacross simultaneous and sequential presentation of stimuli, and it does so for two different tasks:size-decrement search and a task in which observers searched for a T that could appear at anyorientation among L’s that could appear at any orientation (Huang & Pashler, 2005). We charac-terize this second task as a spatial-relations task because it was the specific spatial relations amongoriented bars that defined the target from the distractors. Figure 3.18 provides an illustration ofthe stimuli, and an illustration of how stimuli were displayed using one frame of a sequential-displaycondition to illustrate. Stimuli were presented in groups of 4, with each group appearing in one offour quadrants around fixation. Any given display could include all four groups of 4 or just twogroups of 4 as shown in the figure. The task was to report “yes” or “no” to the presence or absenceof a target in the display.
A schematic of the procedure for the simultaneous-sequential version of the experiments is shownin Figure 3.19, using the size-decrement displays to illustrate. Each trial began with a small fixationcross for 400 ms, followed by a blank interval of 400 ms (not shown in figure). Stimuli were thenpresented in either all four quadrants or in two of the quadrants for about 150 ms (this duration

60 CHAPTER 3. DIVIDED ATTENTION
targets
distractors
targets
distractors
Size Decrement Task Rotated Ts-and-Ls Task
Figure 3.18: An schematic illustration of the displays used for two tasks in Huang and Pashler(2005). The left panel shows the size decrement task: The distractors were fixed size squares andthe target was a slightly smaller square. The right panel shows the rotated-Ts-and-Ls task: Thedistractors were one of 4 L-shaped figures and the target was one of 4 T-shaped figures.
was adjusted for each observer) followed by a 100 ms mask. In the sequential condition, there wasa further blank interval of 250 ms followed by the stimuli in the remaining two quadrants (∼ 150ms) and another mask (100 ms). Observers responded by indicating a yes-no decision about thepresence or absence of a target in the displays with a corresponding button press. Responses werenot speeded.
For these displays there was probably is some effect of crowding because the spacing is less thanhalf of the eccentricity (remember Bouma’s rule of thumb). But this experiment used a differenttrick to hold the effect of crowding the same for the simultaneous and sequential displays. Thestimuli were grouped in sets of four what were more widely spaced between the groups than withinthe group (2.1◦ vs 0.8◦). Thus, the crowding effect was probably about the same whether therewere 2 or 4 groups in the display.
The display set-size version of the experiments used essentially the same displays, except thatthey (a) did not include the second frame of the sequential condition, (b) there were no masks,and (c) the display remained present until a response was made. These conditions resulted in astandard set-size manipulation of 8 versus 16 stimuli. For this version of the experiments, responseswere speeded, and performance was measured in both response time and accuracy.
Results from response time experiments are summarized in Figure 3.20. On the left the responsetime is plotted as a function of set size or both tasks. On the right, percent errors is similarly plottedSet-size effects occurred for both tasks by both measures. Assuming that there are no sensory effectsdue to eye movements or other stimulus differences across conditions, these effects imply that oneor more processing dependency exists within the processes engaged by these tasks. But what kindof processing dependence might they reflect, perception or decision? Both perception and decisionhypotheses predict that set-size effects will occur. Therefore, these results alone cannot discriminatethe locus of processing dependence, even at the coarse level of perception versus decision.
Adding the simultaneous-sequential results provides more information about the locus of process-ing dependence. Differences in performance across simultaneous and sequential conditions cannot
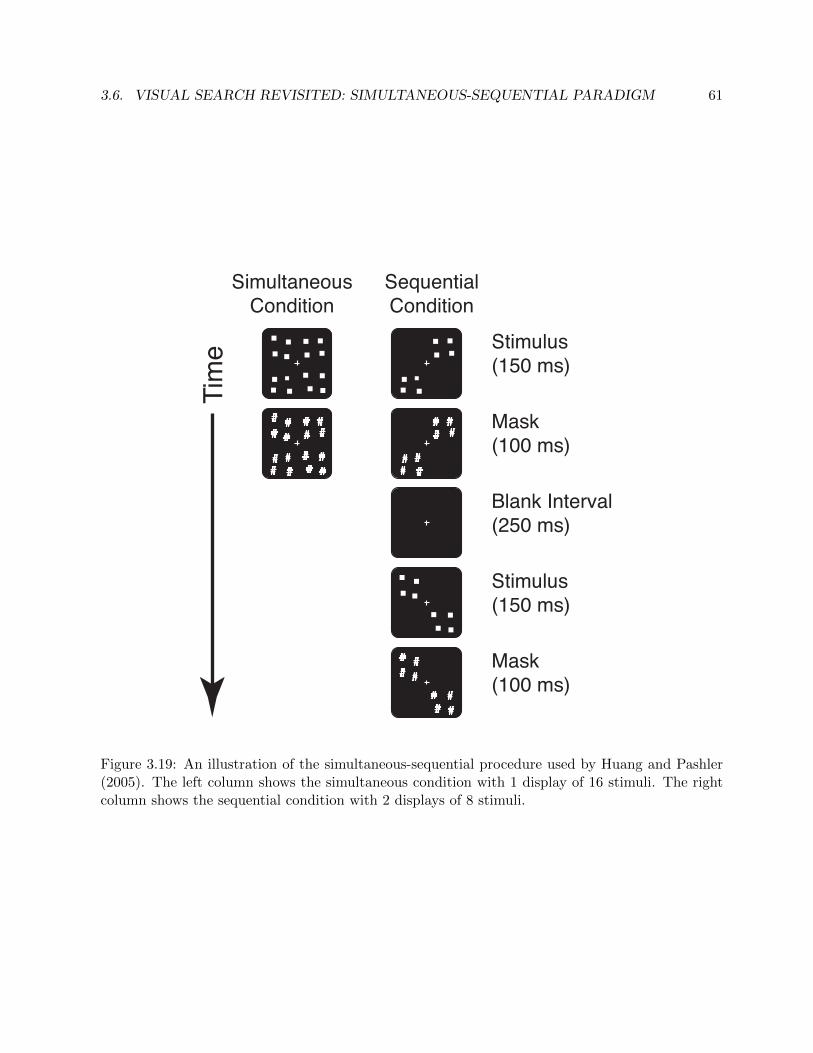
3.6. VISUAL SEARCH REVISITED: SIMULTANEOUS-SEQUENTIAL PARADIGM 61
# ## #
# ## #
SimultaneousCondition
SequentialCondition
Stimulus(150 ms)
Mask(100 ms)
Stimulus (150 ms)
Blank Interval (250 ms)
Mask(100 ms)
Tim
e
# ## #
# ## #
# ## #
# ## #
# ## #
# ## #
Figure 3.19: An illustration of the simultaneous-sequential procedure used by Huang and Pashler(2005). The left column shows the simultaneous condition with 1 display of 16 stimuli. The rightcolumn shows the sequential condition with 2 displays of 8 stimuli.
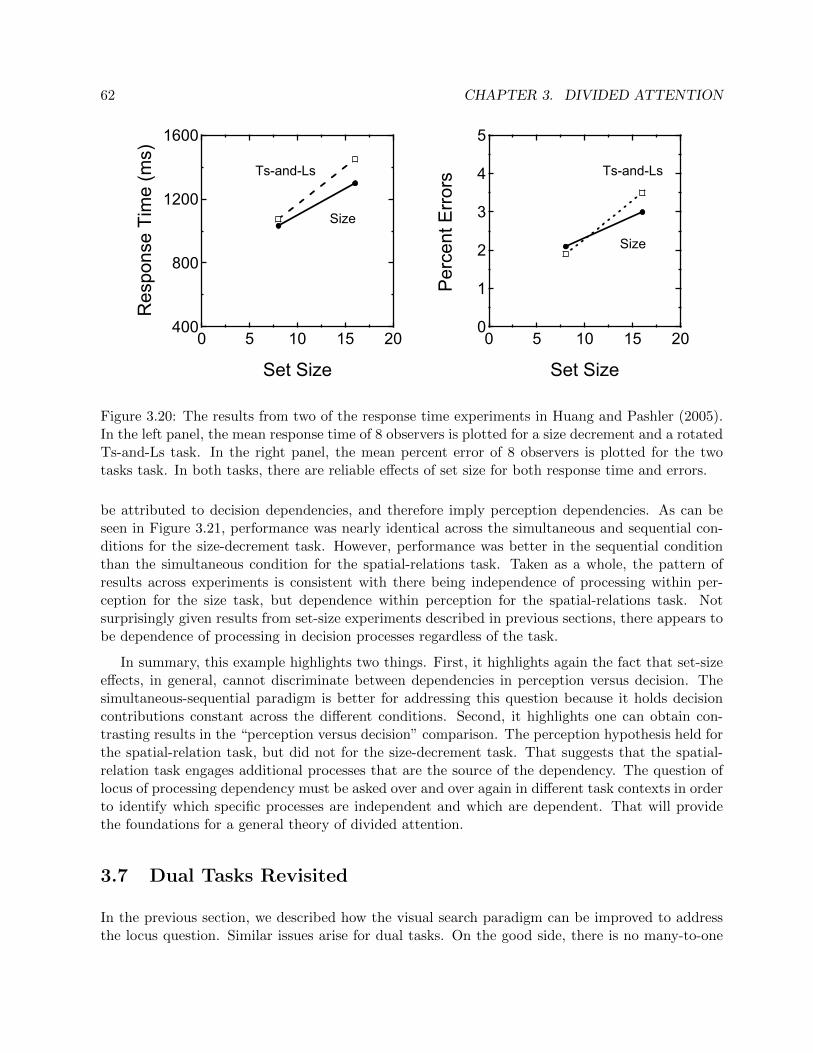
62 CHAPTER 3. DIVIDED ATTENTION
400
800
1200
1600
0 5 10 15 20
Res
pons
e Ti
me
(ms)
Set Size
Ts-and-Ls
Size
0
1
2
3
4
5
0 5 10 15 20
Per
cent
Err
ors
Set Size
Ts-and-Ls
Size
Figure 3.20: The results from two of the response time experiments in Huang and Pashler (2005).In the left panel, the mean response time of 8 observers is plotted for a size decrement and a rotatedTs-and-Ls task. In the right panel, the mean percent error of 8 observers is plotted for the twotasks task. In both tasks, there are reliable effects of set size for both response time and errors.
be attributed to decision dependencies, and therefore imply perception dependencies. As can beseen in Figure 3.21, performance was nearly identical across the simultaneous and sequential con-ditions for the size-decrement task. However, performance was better in the sequential conditionthan the simultaneous condition for the spatial-relations task. Taken as a whole, the pattern ofresults across experiments is consistent with there being independence of processing within per-ception for the size task, but dependence within perception for the spatial-relations task. Notsurprisingly given results from set-size experiments described in previous sections, there appears tobe dependence of processing in decision processes regardless of the task.
In summary, this example highlights two things. First, it highlights again the fact that set-sizeeffects, in general, cannot discriminate between dependencies in perception versus decision. Thesimultaneous-sequential paradigm is better for addressing this question because it holds decisioncontributions constant across the different conditions. Second, it highlights one can obtain con-trasting results in the “perception versus decision” comparison. The perception hypothesis held forthe spatial-relation task, but did not for the size-decrement task. That suggests that the spatial-relation task engages additional processes that are the source of the dependency. The question oflocus of processing dependency must be asked over and over again in different task contexts in orderto identify which specific processes are independent and which are dependent. That will providethe foundations for a general theory of divided attention.
3.7 Dual Tasks Revisited
In the previous section, we described how the visual search paradigm can be improved to addressthe locus question. Similar issues arise for dual tasks. On the good side, there is no many-to-one

3.8. THE GENERALITY OF DIVIDED ATTENTION EFFECTS 63
0.5
1.0
1.5Size Decrements
Accu
racy
(d')
Simultaneo
usSequ
entialSimul
taneousSequ
ential0.5
1.0
1.5Rotated Ts-and-Ls
Accu
racy
(d')
Figure 3.21: The results from two experiments in Huang and Pashler (2005). In the left panel, themean d� of 8 observers is plotted for a size decrement search task. Performance in the sequentialcondition is similar to that in the simultaneous condition. In the right panel, the mean d� of8 observers is plotted for the rotated Ts-and-Ls task. Performance in the sequential condition isreliably better than the simultaneous condition. This pattern of results is consistent with unlimited-capacity, perceptual processing for the size task and limited-capacity, perceptual processing for theTs-and-Ls task.
mapping in the decision process for comparing single and dual task. On the bad side, the dualtask for perception is confounded with a dual task for decision. How can one distinguish these twopossible sources of dependency for dual tasks?
[candidate examples: Bonnel and Hafter? Dosher? ]
3.8 The Generality of Divided Attention Effects
[to be added]
3.9 Chapter Summary
3.9.1 Three paradigms
We began this chapter by introducing visual search. The search paradigm allows one to manipulatethe number of stimuli in a display while holding constant the response choices. This set-sizemanipulation often has powerful effects on performance. Next we discussed strategies for separating

64 CHAPTER 3. DIVIDED ATTENTION
attentional effects from sensory phenomena that are often confounded with set size. The ultimatestrategy was to use the relevant-set-size paradigm in which the number of relevant stimuli variesbut the number of stimuli in the display is constant. This paradigm provides the most convincingevidence that while sensory effects can be large, there are also attentional effects.
Another specialization of visual search is known as the simultaneous-sequential paradigm. Thisparadigm is designed to distinguish set-size effects that are due to perception from those due todecision alone. It does this by varying the number of simultaneous stimuli while holding constantthe number of stimuli relevant to the task.
We also introduced a third paradigm that combines visual search with a dual-task paradigm. Inthese dual-search paradigms, one performs the same kind of search task for two parts of the display.The critical comparison is between the dual-task and the single-task conditions. Any resultingdual-task effect is an effect of divided attention. We then considered various interpretations of suchdual-task deficits.
3.9.2 Two theoretical questions
Following the prior chapter, we asked two theoretical questions about the phenomena of interest.First was the attention question: Is this effect due to attention or some sly stimulus effect? Tocompletely rule out purely stimulus effects, we relied on the use of identical displays and spatialcueing (the relevant-set-size paradigm). Such studies show that while there can be substantialsensory effects that are driven by the stimuli, there are also effects of divided attention itself.
We next addressed a new version of the locus question: Are the observed divided attention effectsdue to dependencies in perception or to dependencies in decision? For the simplest feature tasks,we argue that the observed effects are due to decision processes. Using either the simultaneous-sequential or dual-search paradigms, there is no effect of divided attention for these simple featuretasks.
3.9.3 One theoretical concept
To account for divided attention effects, we introduced the general concept of processing depen-dencies. These can take several forms and we described serial processing, limited-capacity, parallelprocessing, and crosstalk. For the simple feature experiments of this chapter, none of these de-pendencies proved necessary. The standard parallel model was enough to describe the perceptualprocessing of simple features under the ideal conditions considered here.