Embed Size (px)
Citation preview

1
Diversity and Donations:
The Effect of Religious and Ethnic Diversity on Charitable
Giving*
May 2016
James Andreoni Department of Economics
University of California, San Diego
A. Abigail Payne Department of Economics
McMaster University
Justin Smith Department of Economics Wilfrid Laurier University
David Karp
Department of Economics McMaster University
Abstract: We explore the effects of local ethnic and religious diversity on private donations to charity. Results show that an increase in ethnic diversity decreases donations, and that this effect is driven by non-minorities and blacks. We find a similar relationship between religious diversity and donation that is driven by Catholics, though that evidence is weaker. We find no consistent connection between diversity and fraction of households that donate on average. Our results provide a parallel to the negative effects of diversity on publicly provided goods, and opens new challenges for fundraisers and policy makers. JEL Codes: H41, R23, J11
* We acknowledge funding from the University of Manitoba and the Social Sciences and Humanities Research Council (SSHRC), and from the National Science Foundation. We thank Jonathan Meer for valuable comments.

2
I - Introduction
Diversity is increasingly a fact in urban centers across North America and
Europe, and is often lauded as a virtue in and of itself. Recent research suggests,
however, alongside any potential benefits, diversity appears to dilute support for
publicly funded goods and services. Ethnically diverse communities appear to
spend less on schools (Alesina, Baqir, Easterly, 1999 & 2000; Poterba, 1997,
Goldin & Katz, 1999), less on roads and hospitals (Alesina, Baqir, Easterly, 1999
& 2000), and to have lower Census form completion rates (Vigdor, 2004).
The fact that support for publically provided goods falls as diversity rises
raises the question of whether the same is true for the private provision of public
goods, like local charitable services. On one hand, factors that drive down public
spending when ethnic diversity increases – e.g. insularity or difficulty agreeing on
how to spend public funds – may also drive down private contributions to charity,
especially if other groups are seen to benefit from the contribution. Alternatively,
in a more segmented society where individuals vote for less public spending
because they feel less connected across groups, a greater connection within groups
may lead them to substitute into local charities such as religious organizations or
neighborhood food banks as a way target the benefits to their own group. This
substitution would increase total contributions to charities. Knowing the impact
diversity may have on the private provision of public goods and services is as
important to policy makers as it is to know diversity’s impact on publicly
provided goods and services, especially when the two sectors are producing things
that are substitutes for each other. In particular, private sector charity can either
blunt the negative effects of diversity on the community’s welfare, or exacerbate
the problem. Despite the clear evidence that support for publically provided goods
falls in more diverse populations, whether support for privately funded public

3
goods like charities rises or falls is an open, and equally important, empirical
question.
We examine the effect of ethnic and religious diversity on individuals’
donations to private charities using aggregated data on charitable donations
derived from Canadian tax records linked to Census data over 10 year time
periods. Our key contribution is that we estimate a relationship between diversity
and private donations to charity that is broader and more generalizable than prior
research. Work in this area to date (e.g. Fong and Luttmer, 2009; Fong and
Luttmer, 2011; Hungerman, 2008; Dimitrova-Grajzl, 2016) focuses specifically
on the effect of race on donations to small subsets of the charitable sector in
contexts where race is likely to play a key role. Our measure of donations, on the
other hand, includes giving to any registered charity in the country, and our
sample contains all urban areas across Canada. What we estimate is therefore
more representative of the general effect of diversity on private giving.
Furthermore, unlike most prior work, we separate the effect of diversity on giving
along the intensive and extensive margins.
Our empirical model is based on Vigdor (2002, 2004), where our
regressions of donations on the ethnic or religion Fragmentation Index (FI) at the
community-level are derived by aggregating an individual-level model of
donations as a function of a person’s own ethnic or religious group share of the
population. The advantage of this approach is that it relates the relationships we
observe between FI and donations in the aggregate to underlying individual
behavior. Typically the coefficient on FI is described as the effect of increasing
the probability that any two randomly chosen individuals belong to different
groups. Within the Vigdor (2002, 2004) framework, one can show that the
coefficient on FI equals the negative of the effect of increasing an individual’s
own-group share on donations. An inverse relationship between fragmentation

4
and donations therefore arises in this model because individuals increase
donations as their own-group share in the population rises.
A concern for estimation is unobserved heterogeneity, arising potentially
from sorting into neighborhoods based on factors correlated with both diversity
and charitableness. We attempt to control for this by including a set of
neighborhood fixed effects, and by controlling for key time-variant neighborhood
characteristics. To control for sorting by other factors, we employ control
variables intended to hold constant the important variables that might be related to
donations and diversity, such as income, education, house values (as a measure of
wealth), migration, labor market conditions, age distribution, and other
demographics.
The average adult in our sample donates $248 per year. We find that
increasing the ethnic FI by 10 percentage points reduces the average donation per
adult by roughly $36 per year, a 15% reduction. Based on the Vigdor (2002,
2004) framework, this effect arises because individuals donate more when their
own-group share rises. By contrast, we find no statistically significant
relationship between changes in the ethnic FI and the fraction of households that
make a donation. Ethnic diversity appears, therefore, to affect the intensive rather
than extensive margin. Looking deeper into which groups drive the inverse
relationship between diversity and amount donated, we find that non-minorities
contribute roughly $106 more per adult when their group share increases by 10
percentage points in the community, and blacks contribute $591 more for the
same increase in their group share. By contrast, East Asians contribute $116 less
per adult when their group share increases by 10 percentage points. Finally, the
effects are strongest in high income and low education communities.

5
Turning to religious diversity, a 10-percentage point increase in the FI
reduces contributions by about $23 per adult per year, a 9% reduction, though this
estimate is not statistically significant. Catholics increase their donations by $66
per adult when their share in the population rises by 10 percentage points. We
find no consistent evidence that the religious FI affects the fraction of households
that donate. Because the religiosity results lack precision and are less robust than
the ethnic diversity results, we interpret with caution.
In sum, our key results indicate that the deleterious effects of diversity on
public sector provision of goods extends to privately provided public goods; that
is, prior studies on the link between increased diversity and lower provision of
publicly provided goods are actually understating the total effect. Increases in
ethnic diversity lead to significant declines in charitable giving in the urban
Canadian areas in our sample. Over the ten years of our study, ethnic diversity
increased by six percentage points, suggesting that charitable donations are nine
percent lower than they would be had ethnic diversity not grown over that time
period.
II –Literature
Many studies on diversity focus on its relationship with the amount or
distribution of public spending by governments or, more recently, on
contributions or attitudes towards activities or goods that generate public benefits
(See reviews by Alesina and La Ferrara, 2005, Stichnoth and Van der Straeten,
2009). The main conclusion from the literature is that diversity reduces publicly
provided goods, both across countries and across communities within a country
(mainly the United States). Ethnically diverse communities are found to spend
less on schools (Alesina, Baqir, Easterly, 1999 & 2000; Poterba, 1997, Goldin &
Katz, 1999), less on roads (Alesina, Baqir, Easterly, 1999 & 2000), and less on

6
social programs in general as a fraction of GDP (Alesina, Glaeser, and Sacerdote,
2001). One exception is that Cutler et al. (1993) find that changes in state-level
demographic characteristics have a negative effect on public spending, but at the
county level the effect is positive.
A related literature also finds that diversity has a negative impact on
individual attitudes and behavior when public benefits are involved. In racially or
ethnically heterogeneous communities, surveyed individuals express a stronger
preference for decreasing social benefits (Dahlberg et al., 2012), involvement in
social activities is lower (Alesina and La Ferrara, 2000), people are less likely to
fill out census forms (Vigdor, 2004), they contribute less to schools through
voluntary fundraising events (Miguel and Gugerty, 2005), and contribute less to
community organizations (Okten and Osili, 2004). There are several explanations
offered for this effect. If different groups have different tastes or agendas for
public spending, then this disagreement may make it more difficult to raise the
funds necessary to provide those goods, and may make the goods themselves
more costly1 (such as multilingual education), and so overall provision is lower
(Alesina et al. 1999). Other researchers have suggested that individuals may be
less willing to contribute to a good with public benefits if those benefits accrue to
other groups besides their own. There may be mistrust across groups (Alesina and
La Ferrara, 2002, Fershtman and Gneezy, 2001) or pro-social within-group norms
that are not easily enforceable across groups (Habyarimana et al., 2007).
1 A nice example from Jackson (2010) is a fragmented community where some individuals want to provide public education in one language, and other individuals want to provide it in another. It may be more costly to devise a system where education is delivered in multiple languages compared to a more homogeneous community that funds education in one language.

7
Several studies focus specifically on the relationship between diversity and
altruistic behavior.2 Hungerman (2008) finds evidence that charitable spending by
all-white church congregations is more sensitive to increases in the percent of the
local community that is Black compared to more diverse congregations. Along
the same lines, Dimitrova-Grajzl et. al. (2016) show that giving to all-white
congregations falls when the percent white in the county falls. In an interesting
contrast, Hungerman (2009) finds that government spending on charities is less
likely to crowd out charitable spending by United Methodist Churches in more
ethnically diverse communities. Experimental evidence by Fong and Luttmer
(2009) shows that giving to Hurricane Katrina victims does not on the race of the
victim, but increases when the giver subjectively identifies with the racial
background of the recipient. In a different experiment, Fong and Luttmer (2011)
find again that donations are independent of the race of the victim, but that non-
Black participants view Black individuals as less worthy of charity, and giving
declines when the victim is viewed as less worthy.
A criticism of the results discussed above is that they are formed within
very specific contexts – homogeneous congregations, hurricane Katrina, the
southern United States – where race is likely to play a more prominent role in
determining donations. While those studies are certainly informative inside the
context in which they take place, it is not clear that they reveal the more general
relationship between ethnic diversity and donations. Furthermore, they do not
separate the effect of race on giving along the intensive and extensive margins.
With our data, we can potentially draw sharper, more generalizable
conclusions relative to previous work. Our information on donations includes
giving to any cause that generates a tax receipt, which includes a broad,
2 For reviews on the broader literature on charitable giving, see Andreoni (2006) and Andreoni and Payne (2013).

8
representative set of charitable organizations. In addition, we measure both
donations and diversity in a set of neighborhoods that spans all urban areas across
Canada over periods of 10 years. These two facts combined mean that we can
make broader statements about the relationship between diversity and amount
donated. Furthermore, because we know how many individuals donate to charity
in each neighborhood, we can examine diversity’s impact on the likelihood of
donating separate from amount donated.
III – Empirical Strategy
Our empirical analysis is based on Vigdor (2002, 2004), who builds a
community-level model by aggregating an individual-level model. The main
advantages of this exercise are that it provides a behavioral interpretation to the
coefficients we get from the community-level model, and motivates the use of a
Fragmentation Index (FI), which is the most common way to measure diversity.
Suppose that the amount individual i in group g from community c at time
t donates to charity depends on the fraction of the community members who are in
the same group:
!"#$%&"#!"#$ = !! + !!!ℎ!"#!"# + !!!"#$ + !"!" + !!"#$ (1)
where donationigct is an individual’s donation to any charity in dollars, and
sharegct is the share of group g in the population in community c at time t. Vigdor
(2002) calls !! the within-group affinity, because it measures the extra amount a
person is willing to donate when their group’s share in the population increases.
The coefficient !! measures each group’s baseline contribution level. The
variables in !!"#$ are individual-level factors affecting donations, such as income,
and !!" are community-level factors that may or may not vary over time.

9
Aggregating to the community-year level, we get
!"#$%&"#!" = !!!ℎ!"#!"#!!!! + !!!ℎ!"#!"#!!
!!! + !!!" + !"!" + !!" . (2) The overbars indicate community-level weighted averages at time t, where the
weights are the group shares in the community. In the aggregate, community-
level donations are a function of the shares and the squared shares, where the
baseline and affinity effects are the coefficients on those shares. Use of the FI as
a regressor is motivated by restricting all of the squared shares to have the same
effect,
!"#$%&"#!" = !!!ℎ!"#!"#!!!! + ! !ℎ!"#!"#!!
!!! + !!!" + !"!" + !!" (3)
Where ! is interpreted as the average effect across groups of increasing
own-group share (within-group affinity) on donations. Because the FI =
1− !ℎ!"#!"#!!!!! , models like equation 3 that use FI as a regressor in place of
!ℎ!"#!"#!!!!! estimate –!, the negative of the average within-group affinity
effect. That is, finding that increasing fractionalization reduces donations is
equivalent in this model to finding that on average increasing own-group share
increases donations. In the results that follow, we estimate both equations 2 and
3.3 When we estimate equation 3, we will use the FI as the main independent
variable rather than the sum of the squared shares, for interpretation purposes.
Note that while we estimate coefficients with equations 2 and 3, we interpret them
through the lens of equation 1. Coefficients derived from equation 2 are therefore
interpreted as the effect of increasing own group share on donations, and those
from equation 3 are a weighted average of the effect of own group share on
donations.
3 Because aggregation creates heteroskedastic errors, we use standard errors that are heteroskedasticity robust and clustered at the community level. All regressions are weighted by the number of taxfilers.

10
We control for the time varying factors in !!" and !!" using data from the
Census on the variables most likely to be related to donations (discussed below).
Additionally, we control for time-invariant community factors in !!" with a set of
community-level fixed effects. Our identifying assumption is, therefore, that
community fixed effects and other time-varying controls account for confounding
factors. The main threat to identification is likely to be sorting across
neighborhoods based on factors related to charitable donations. The
neighborhood fixed effects will control for a significant portion of this sorting if
the things that make one neighborhood more attractive than another do not change
much over the 10 years we study, as is likely. Individuals may nevertheless sort
based on things that change within those 10 years, and if they sort based on the
charitableness of the neighborhood or factors related to charitableness, our
estimates could be confounded. We believe there is a very small likelihood that
people sort into a community solely for the level of charity it provides, but if they
did, and more charitable communities attract more diverse populations, then our
estimates will be biased toward finding a positive relationship between diversity
and donations. We are also confident that we control for the main factors that are
related to diversity and donations that may draw someone to a neighborhood, such
as income, education, age distribution, labor market conditions, and other
demographics.
IV – Data
In this section we report the sources of our data, how we selected the sample for
analysis, and provide summary statistics for the observations we analyze.
IV.A – Data Description
Data on donations come from the Financial and Charitable Donors
Databank, produced by Statistics Canada. The dataset contains information on

11
yearly total amounts contributed by residential households, and number of
contributors to charity aggregated to the Forward Sortation Area (FSA) level
(discussed below) from individual tax records.4 Data at this level of aggregation
are only available for FSAs in urban areas.5 We extract information on total
amount contributed and total number of contributors to registered charities for tax
years 1991-2006. Registered charities include regular charitable organizations
providing any type of service, but also amateur athletic organizations, universities
inside and outside of Canada, tax exempt housing corporations in Canada,
municipalities, the United Nations, and charities outside of Canada that have been
given a gift by the Government of Canada (Statistics Canada, 2007).
From these data we create our two main outcome variables. First is the
average donation per adult, which we compute by dividing total donations by the
number of taxfilers in each FSA in each year.6 We also divide number of
charitable donors by the number of households to create our second outcome, the
fraction of households who donate. We divide by the number of households
instead of the number of taxfilers because of the tax treatment of charitable
donations. Charity tax credits are transferrable between spouses. Because the tax
credit rates jump substantially after passing a monetary threshold, it is most likely 4 Specifically, information is based on line 340 of T1 federal tax forms. 5 Statistics Canada produces the charitable donors data in such a way that users can aggregate to different levels, including the city level. Because some FSAs straddle city borders, sometimes our data splits an FSA’s observation between all cities within its border in a given year. In creating our sample, we simply added the donations across cities within an FSA boundary in a given year. It is possible, however, that if a city within an FSA is very small, Statistics Canada could have suppressed its data. To check whether the results were robust to excluding these areas, we reran all regressions eliminating FSAs that straddled city borders (about 20% of the observations), and the results were very similar to those presented in the manuscript. One notable exception is that the coefficient on the Religion Fragmentation Index in Table IX becomes statistically significant, at roughly the same magnitude. 6 In dividing total contributions by the number of taxfilers and interpreting it as donations per adult, we assume that people who do not file a tax return contribute the same on average as those who file. Alternatively, this measure could be interpreted more strictly as donations per taxfiler. When we instead use the size of the adult population as the denominator, our main results are similar, though slightly smaller in magnitude.
12
the case that one spouse claims all of the tax credits and the other spouse claims
none.7 We therefore expect, as far as tax records are concerned, the number of
donors more accurately reflects the total number of households who donate, rather
than the number of individuals.
There are several unique features of donations data based on tax records.
First, we cannot identify the charity to which donations have been made. This
could be problematic if some types of donations are sensitive to community
composition and others are not. Donations also include those made to large,
international organizations, which again may not be sensitive to the composition
of a local community.
Second, because data on donations are based on tax records, only
donations reported on an individual’s tax return are counted, and only for
individuals who file a tax return. According to documentation accompanying the
charitable donors’ data, 66% of Canadians filed taxes in 1991, which climbed to
74% in 2006. This may not be a substantial issue, however, because of the tax
treatment of donations discussed above: some individuals who do not file a tax
return may have a spouse who does, and that spouse may claim the donation on
his/her tax return. We are, therefore, likely picking up more donations than the
rate of filing might suggest.
We link data on donations to variables from the 1991, 1996, 2001, and
2006 Census of Canada aggregated to the FSA level. Statistics Canada collects
data on a small number of variables such as basic population counts and gender
from 100% of the population (the “short form”), and other more detailed
7 This is especially true if one spouse earns no income as the tax credit is non-refundable. The threshold levels and rates vary over time and across provinces. The thresholds are in the $200 to $250 range, with a federal rate below the threshold of around 15%-17%, which roughly doubles for all dollars above the threshold.

13
information using a mandatory 20% sample (the “long form”).8 Data on ethnic
groups, collected through the long form, is based on an individual’s “visible
minority” status, which assigns people to one of twelve groups based on race and
skin tone. Because some groups are quite small, we regroup individuals into the
following categories: Black, East/Southeast Asian, South Asian, Arab/West
Asian, Latin American, Other, and not-visible-minority.9 Religious groups, also
collected on the long form, contain a much larger number of disaggregated
categories, which we regroup for the same reasons into: Catholic, Christian (other
than Catholic), Jewish, Muslim, Other, and not religious.10 Data for visible
minorities are available in the 1996, 2001, and 2006 Censuses, and data for
religious groups are available for 1991 and 2001.
We draw our control measures from the Census. These include household
income, family structure, education, external and internal residential mobility,
unemployment, population distribution, language, housing stock, house values,
home ownership, and rent. All controls are listed in Table I.
Data are aggregated to the FSA level, which is a relatively small
geographic space used to delineate postal routes. An FSA is the first three
characters of the 6-digit Canadian postal code, where the first identifies the
province (in most cases) and the second identifies the area as urban or rural.
There are roughly 1,600 FSAs across Canada, and each is a relatively stable
8 Note, however, that in 2011 the long form portion of the Census was replaced with a voluntary survey of 30% of the population called the National Household Survey. The short form remains mandatory. 9 The groups available in the Census are: Chinese, South Asian, Black, Filipino, Latin American, Southeast Asian, Arab, West Asian, Korean, Japanese, Visible Minority Not Included Elsewhere, and Multiple Visible Minority. Individuals who report multiple visible minority groups or are not included elsewhere are sorted into the “other” group. Non-visible-minorities include Aboriginal peoples. 10 The groups are: Catholic ,United, Anglican, Presbyterian, Baptist, Lutheran, Pentecostal, Reform, Orthodox, Jehovah’s Witness, Mennonite, Salvation Army, Mormon, Other Christian, Jewish, Muslim, Buddhist, Hindu, Sikh, Other, and No Religion.

14
geographic area containing only 7,000 households on average. FSAs in rural
locations tend to occupy large areas, while those in urban areas can be very small.
Though they are generally stable, some FSAs do change boundaries over time.
This occurs mostly where an urban FSA is created out of part of a rural FSA, but
urban FSAs are occasionally, though seldom, split into 2 or more urban FSAs.
We refer to these as emerging FSAs. Our solution to this was to regroup
emerging FSAs back into their old boundaries, and use those boundaries for all
years. A more detailed explanation of this procedure is available in Appendix
B.11
IV.B – Sample
Our sample universe consists of all urban FSAs between 1991 and 2006,
the years when both donations and Census data are available.12 There are 19,820
FSA-year observations over that time period, or 1,284 FSAs. From this universe,
we drop 245 observations (1.2%) where one of the key Census measures
contained missing data; 154 observations (0.1%) from FSAs that are missing
donations data in one of the Census years; 2,031 observations (10.2%) for FSAs
that were not observed contiguously between either 1991-2001 or 1996-2006; 42
(<0.1%) observations from recombining emerging FSAs. The restriction to keep
contiguously observed data over two different time spans is imposed because we
separately analyze ethnic diversity using data from 1996-2006, and religious
diversity from 1991-2001. After these exclusions, we are left with a final sample
of 17,348 FSA-year observations.
11 For example, splitting an urban FSA into two but maintaining the same label for one of them, we might observe what appears to be large population drops or changes in other variables. But, this would simply be a product of redrawing boundaries. By regrouping FSAs back into their own boundaries, we avoid such issues. 12 This sample restriction also excludes FSAs that were regrouped back into rural FSAs, as explained in Appendix A.

15
Because Census data are only available in 1991, 1996, 2001, and 2006,
whereas donations data are available for all years, we linearly interpolate Census
measures between Census years. Visible minority information was not collected
in 1991, so we therefore do not interpolate this measure between 1991 and 1996.
Likewise, religion information was not collected in 1996 or 2006, so we do not
interpolate between 2001 and 2006 for this measure. Because visible minority
and religion data do not fully overlap, we use different samples to analyze ethnic
and religious diversity. To study ethnic diversity, we use 12,221 FSA-year
observations between 1996 and 2006. To study religious diversity, we use 11,055
FSA-year observations between 1991 and 2001.
IV.C - Summary Statistics
In Table I, Panel A, we present means of donation-related variables.
Average donations per adult (converted to constant year 2000 Canadian Dollars)
increased by 67% between 1991 and 2006, with most of the growth occurring
between 1996-2006. On the other hand, the fraction of households who make any
donation falls by roughly 8 percentage points over the same period.
In Table I, Panel B, we summarize Census information. Our key measure
of diversity is the FI, which measures the probability that any two randomly
selected individuals are in different groups. In 1996 there was on average a 23%
chance of two people being from different visible minority groups, which climbs
to 29% by 2006. There is much more diversity among religious groups: in 1991
there was a 53% chance on average that individuals belong to different religious
groups, which rose to 57% by 2001. While the baseline level of diversity is much
higher in terms of religion, growth in diversity is higher in terms of visible
minority status.

16
We also present statistics showing changes over time in control measures
that are related to diversity and donations. Some noteworthy changes are that
average household income grows by roughly $5850, the fraction of the population
who are immigrants grows by 4 percentage points, the fraction with a university
education grows by 6 percentage points, and housing value grows by $55,562.
In Table II we present data on the demographic shifts over time. Panel A
shows baseline shares in 1996 and the change in the shares over 10 years for
visible minority groups. Clearly the largest group is non-visible-minorities with
an 85.1% share. East/Southeast Asian is the next largest with 6.7%. South
Asians are roughly 3% of the population, blacks are 2.6%, and other groups are
smaller. The largest visible minority groups are also the fastest growing: the
East/Southeast Asian group increases its population share by roughly 31%, and
the South Asians increase their share by about 61%. Column 3 reports how many
of the FSAs in the sample experience growth in each of the groups listed.
Generally speaking, about 60% to 70% of FSAs in the sample have growing
visible minority shares. Offsetting this growth is a shrinking non-visible-minority
group: they lose 5.5% of their share and only 12.7% of FSAs see growth in this
group over time.
Religious groups do not move as uniformly. Catholics are the largest
group with 46% of the population in 1991, which shrinks slightly over the
subsequent 10 years. Combined, all other Christian religions make up about 35%
of the population in 1991, which also shrinks over time. On the other hand,
individuals claiming no religion, who comprise 14% of the population in 1991,
increase their share over time. Perhaps the most telling statistic is that 91.4% of
all FSAs in the sample increase their share of individuals reporting no religion.

17
Table III presents the mean relationship between diversity and donations.
The first three columns break up the visible minority FI into three quantiles and
recompute the means from Table I. We see donations are higher and more people
donate in more ethnically diverse FSAs. A similar pattern is observed in columns
4-6, which separate the data by religious diversity. However, changes in means of
the other variables across the quantiles suggest that this may not be a causal
relationship, in particular because income is also higher in diverse neighborhoods.
What is likely the case here is that more diverse neighborhoods are also the major
urban centers like Toronto, Montreal, and Vancouver, which will have more
diverse and wealthier populations. We control for these factors in the regression
analysis below.
V – Results
In next two subsections we first look at ethnic diversity, then religious diversity,
both using the Fragmentation Index of diversity. In the third subsection we
reconsider these results with a different index meant to capture concentration or
polarization of communities.
V.A – Ethnic Diversity
In Table IV we present regressions of average donations on measures of
visible minority heterogeneity. Columns 1-3 are OLS estimates of equation 3,
regressing donations on visible minority FI with different sets of control variables.
Recall that we interpret our results through equation 1, where coefficients measure
the effect of increasing own-group share on donations. As such, the coefficient on
FI measures the effect of moving from complete homogeneity (FI = 0) to
complete heterogeneity (FI = 1), or equivalently the negative of the effect of
increasing own-group share from 0 to 100%.

18
Our preferred specification is in column 3, which includes all controls and
FSA fixed effects. An increase of 0.1 in the FI visible minority diversity measure
lowers the average donation per adult by about $36 (that is, $358.56 times 0.1),
meaning that on average individuals display own-group affinity. Relative to the
overall mean, this represents a 15 percent drop in average donations per adult,
which we consider to be a substantial effect. To put this into perspective between
1996 and 2006 ethnic diversity in Canada increased by 0.06 points, which our
results suggests lowered giving in urban areas by nine percent.
In column 4 we estimate equation 2, which allows the squared shares to
enter the equation separately. The interpretation of the coefficients here, as per
equation 1, is the effect of increasing own group shares on donations. We find
that an increase of 10 percentage points in the share of the majority group, whites,
increases donations by $106 for this group, and a 10-point increase in the share
Black increases donations by $591.13 A 10-percentage point increase in the East
Asian group, on the other hand, reduces donations by roughly $116. Others are
not statistically significant.
In columns 5 and 6 we check the robustness of our results to the linear
interpolation between Census years. When we restrict the sample to only years
when the Census data are observed, we get very similar results. In an additional
robustness test, we replaced the average donation per adult with the median
donation in the FSA to test whether outliers were influencing our results. While
we do not report those coefficients here, the results were very similar to those in
Table IV.
13 While the coefficient on share black appears large relative to the overall mean donation, it would be more appropriate to compare to the mean among black individuals in the sample. Due to the aggregated nature of our data, we are not able to compute the average donation among black individuals in the sample. Thus, it is unclear whether this coefficient is large or small.

19
Our results therefore confirm that the negative relationship between
diversity and publically provided goods also exists for public goods financed
through private contributions. They suggest further that the negative relationship
between racial diversity and charitable donations found in past research goes
beyond subsets of the charitable sector where diversity is expected to play a key
role, like racially homogeneous churches. In particular, we find a country-wide
average effect of diversity on donations to a representative set of charities, which
could include churches, but also food banks and the arts. We interpret this to
mean that diversity plays a key role in determining revenues for the charitable
sector as a whole, which has potentially serious implications in countries like
Canada and the United States that are growing increasingly diverse over time.
One of the key advantages of our study is that we are able to explore the
effect of diversity on both the intensive and extensive margins of donations. Table
V reports coefficients from our preferred specification, but with of fraction of
households who donate as the outcome variable. Here we find no statistically
significant effect. Breaking out the FI into shares squared we see that a 10
percentage point increase in the Other share increases probability of donation by
about 45 percentage points. Other coefficients are statistically insignificant.
Overall, the results indicate that on average, charitable giving is sensitive
to the demographic composition of the community. We find evidence that the
donation amounts are sensitive to the ethnic makeup of the community, but the
fraction of people who donate is not. These average effects mask some
heterogeneity across ethnic groups: while some groups donate more with
increases in their group shares, others donate less. Along the extensive margin,

20
though we show average effect, the fraction who donate rises with the fraction of
Other ethnicities.14
V.B – Religious Diversity
Table VI reports the results of regressions where both average donations
and fraction of households who donate are regressed on diversity measures.15 We
find that increasing religious diversity FI by 0.1 reduces average donations per
adult by $23, though the coefficient is not statistically significant. Using squared
shares instead of the FI, the only statistically significant result is that Catholics
have a statistically significant positive group affinity.16
We also report in Table VI that the fraction of households who donate is
insensitive to religious fragmentation, suggesting no within-group affinity on
average. In specifications that use squared group shares separately, we find that a
10 percentage point increase in the non-religious population leads to a 20
percentage point increase in non-religious households that donate, while a similar
increase in the share Christian leads to a fall in the fraction of such households
that donate by 4.9 percentage points, and a fall in the fraction of Catholic
households that donate by 2.2 percentage points.
While one of the advantages of our data is that it contains detailed
information on religious groups, these results are unfortunately not robust enough
14 To dig deeper into what drives the diversity effect, we broke the data into terciles of household income, and terciles of the fraction of the people with a bachelor’s degree, then estimated diversity coefficients for each. We found that while there were differences in magnitude across these groups, the coefficients were statistically indistinguishable across both the income and education groups along the intensive and extensive margins. These results are available in Appendix A. 15 The results in Table VI are broadly similar when we use only the census years. See Appendix A for the results. 16 In results not reported, we generated estimates based on two alternative groupings of religions. In the first, we simply joined Catholics with the Christian group. In the second, we decompose Christians into finer groups, and also regroup the other religions. The coefficient on FI remains negative, but the magnitude is stronger when Catholics are grouped with Christians.

21
to make any firm conclusions. In particular, Table VI shows that the key
coefficients are noisy, and in other analyses we found that the coefficient on the
religion FI is sensitive to including the ethnic FI. Thus, despite their potential
importance, the religiosity results should be interpreted cautiously.
V.C – Diversity or Polarization?
While our model motivates our use of the FI, we estimate models with an
alternative measure of community diversity frequently found in the literature
called the RQ index (Montalvo & Reynal-Querol, 2002), which is defined as:
.
Whereas the FI measures fragmentation, RQ measures polarization. The
difference is best illustrated by example. Suppose there are three ethnic groups in
the population. FI takes a maximum when the population is divided equally
among the groups, whereas RQ takes a maximum when the population is divided
equally among only two of the groups. The distinction between fractionalization
and polarization could prove important if it is really two opposing groups that
matter, rather than diversity spread over many groups. Note that despite the
differences in interpretation, both measures are highly correlated at low values of
the FI, not correlated at middle values, and negatively correlated at high values.
Thus, relatively homogenous societies that become more diverse also initially
become more polarized, but highly diverse societies that become more diverse can
become less polarized.
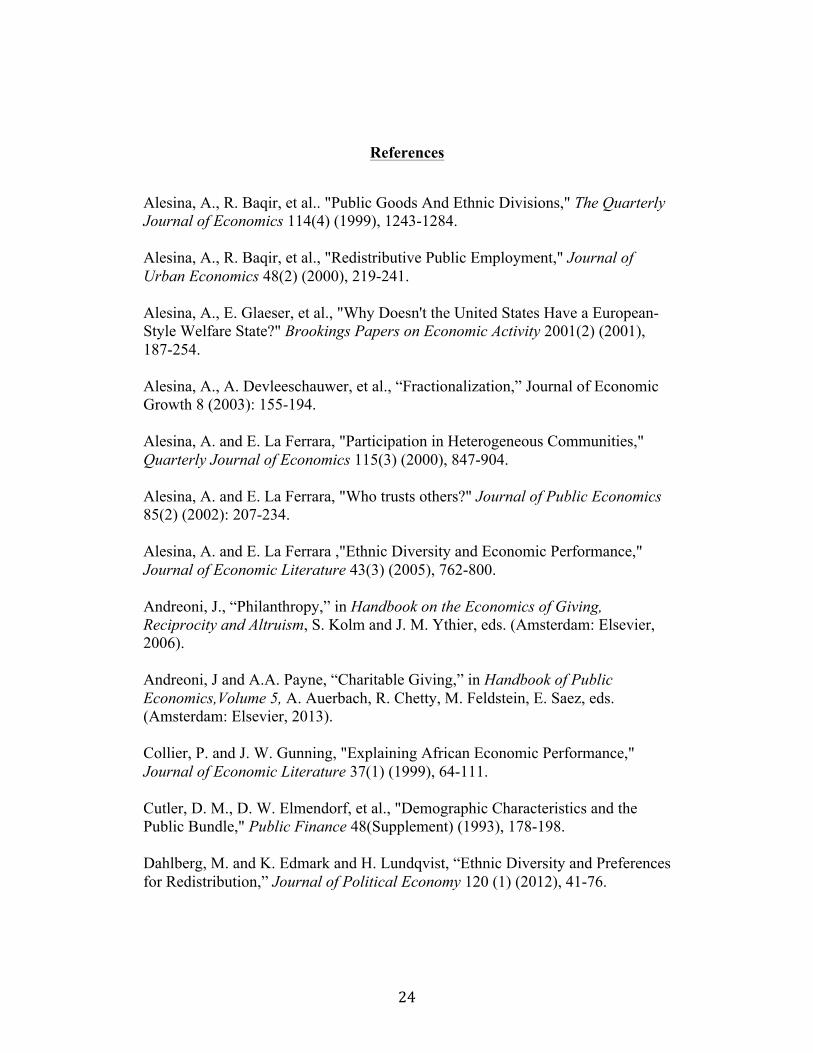
Results in Table VII show that ethnic polarization also reduces average
charitable donations per adult. A 0.1 change in this index reduces donations by
€
RQjt =1−0.5 − sharekjt
0.5#
$ %
&
' (
2
k=1
K
∑ sharekjt

22
roughly $22. Note that this index is not in the same scale as the FI, so the
coefficients are not directly comparable. Nevertheless, the effect is in the same
direction, which is not surprising because at low levels of the FI, the measures are
highly correlated. Similar to prior results, polarization does not have a
statistically significant effect on the fraction of households who donate.
An increase in religious polarization by 0.1 reduces donations by $13 and
increases the fraction of households who donate slightly by 1.2 percentage points.
We again caution that these results may lack statistical precision and robustness.
Polarization therefore has a similar effect on donations as an increase in
diversity. To the extent that these two measures are closely related when
population heterogeneity is low, polarization and diversity may simply be
measuring the same underlying effect. Our results are in line with Alesina et. al.
(2003), who suggest that when it comes to the effect of ethnic heterogeneity on
public goods, fractionalization and polarization produce similar results.
VII – Conclusion
In this paper we examine the relationship between ethnic diversity,
religious diversity, and charitable donations. While previous literature has shown
that publicly provided goods could be lower in jurisdictions that are more
heterogeneous along these dimensions, the effect on privately provided public
goods depends on whether people treat them as substitutes. Prior work shows that
donations are negatively related to the ethnic composition of the surrounding area,
but those results might be context-specific. By contrast, our data allows us to
estimate whether donations to a representative set of charities vary with diversity
using a country-wide sample of urban areas. We also explore this relationship
along the intensive and extensive margins.

23
We find that increasing diversity leads to a decline in support for privately
provided public goods, in particular private charity. The average donation per
adult in our sample drops by $36 per year when the ethnic FI increases by 0.1
points. This adds up to a substantial drop in the level of this public good. This
effect is mainly driven by non-minorities, who contribute $11 less for each
percentage point their group share drops, and blacks, who contribute $59 less. We
find no consistent evidence that ethnic diversity affects the propensity for
households to donate.
Religious diversity might also lower contributions. We find a negative
relationship between religious heterogeneity and amount donated, possibly driven
by Catholics that donating more when their group share rises in the population.
These estimates are, however, less precise and less robust than the estimates based
on ethnic diversity.
Our results imply that the recent and continuing demographic changes
across North America and Europe may have a significant and sizable impact on
charitable services provided through voluntary contributions of individuals. As
communities grow more diverse, charity revenues may fall. This raises further
public policy concerns, especially in urban areas, as religious and ethnic diversity
inevitably grow. Hence, the negative effect of diversity on publicly provided
goods is compounded by the fact diversity has a negative effect on privately
provided charity as well.
24
References
Alesina, A., R. Baqir, et al.. "Public Goods And Ethnic Divisions," The Quarterly Journal of Economics 114(4) (1999), 1243-1284. Alesina, A., R. Baqir, et al., "Redistributive Public Employment," Journal of Urban Economics 48(2) (2000), 219-241. Alesina, A., E. Glaeser, et al., "Why Doesn't the United States Have a European-Style Welfare State?" Brookings Papers on Economic Activity 2001(2) (2001), 187-254. Alesina, A., A. Devleeschauwer, et al., “Fractionalization,” Journal of Economic Growth 8 (2003): 155-194. Alesina, A. and E. La Ferrara, "Participation in Heterogeneous Communities," Quarterly Journal of Economics 115(3) (2000), 847-904. Alesina, A. and E. La Ferrara, "Who trusts others?" Journal of Public Economics 85(2) (2002): 207-234. Alesina, A. and E. La Ferrara ,"Ethnic Diversity and Economic Performance," Journal of Economic Literature 43(3) (2005), 762-800. Andreoni, J., “Philanthropy,” in Handbook on the Economics of Giving, Reciprocity and Altruism, S. Kolm and J. M. Ythier, eds. (Amsterdam: Elsevier, 2006). Andreoni, J and A.A. Payne, “Charitable Giving,” in Handbook of Public Economics,Volume 5, A. Auerbach, R. Chetty, M. Feldstein, E. Saez, eds. (Amsterdam: Elsevier, 2013). Collier, P. and J. W. Gunning, "Explaining African Economic Performance," Journal of Economic Literature 37(1) (1999), 64-111. Cutler, D. M., D. W. Elmendorf, et al., "Demographic Characteristics and the Public Bundle," Public Finance 48(Supplement) (1993), 178-198. Dahlberg, M. and K. Edmark and H. Lundqvist, “Ethnic Diversity and Preferences for Redistribution,” Journal of Political Economy 120 (1) (2012), 41-76.

25
Dimitrova-Grajzl, V., P. Grajzl, et. al., “Racial Group Affinity and Religious Giving: Evidence from Congregation-Level Panel Data,” The B.E. Journal of Economic Analysis and Policy (2016). Easterly, W. and R. Levine, "Africa's Growth Tragedy: Policies and Ethnic Divisions," The Quarterly Journal of Economics 112(4) (1997), 1203-1250. Fershtman, C. and U. Gneezy, "Discrimination in a Segmented Society: An Experimental Approach," The Quarterly Journal of Economics 116(1) (2001), 351-377. Fong, C. M. and E. F. P. Luttmer, "Do Race and Fairness Matter in Generosity? Evidence from a Nationally Representative Charity Experiment?" Journal of Public Economics 95(5-6) (2011), 372-394. Fong, C. M. and E. F. P. Luttmer, "What Determines Giving to Hurricane Katrina Victims? Experimental Evidence on Racial Group Loyalty," American Economic Journal: Applied Economics 1(2) (2009), 64-87. Giving USA Foundation, “Giving USA 2011: The Annual Report on Philanthropy for the Year 2010,” (Chicago: Giving USA Foundation, 2011). Glaeser, E. L., J. Scheinkman, et al., "Economic growth in a cross-section of cities," Journal of Monetary Economics 36(1) (1995), 117-143. Goldin, C. and L. F. Katz, "Human Capital and Social Capital: The Rise of Secondary Schooling in America, 1910 to 1940," Journal of Interdisciplinary History 29(4) (1999), 683-723. Habyarimana, J., M. Humphreys, et al., "Why Does Ethnic Diversity Undermine Public Goods Provision," American Political Science Review 101(4) (2007), 709-725. Hungerman, D. M., "Race And Charitable Church Activity," Economic Inquiry 46(3) (2008), 380-400. Hungerman, D. M., "Crowd Out and Diversity," Journal of Public Economics 93 (2009), 729-740. Jackson, Ken, “Public Good Provision, Diversity, and Distribution,” Wilfrid Laurier University Mimeo, 2010.

26
La Ferrara, E. and A. Mele, “Racial Segregation and Public School Expenditure,” C.E.P.R. Discussion Papers, 2006. La Porta, R., F. Lopez-de-Silanes, et al., "The Quality of Government," Journal of Law, Economics and Organization 15(1) (1999), 222-279. Miguel, E. and M. K. Gugerty, "Ethnic Diversity, Social Sanctions, and Public Goods in Kenya," Journal of Public Economics 89(11-12) (2005), 2325-2368. Montalvo, J. G. and M. Reynal-Querol, “Why Ethnic Fractionalization? Polarization, Ethnic Conflict and Growth,” Universitat Pompeu Fabra, Mimeo, 2002. Okten, C. and U. O. Osili, "Contributions in Heterogeneous Communities: Evidence from Indonesia," Journal of Population Economics 17(4) (2004), 603-626. Poterba, J. M., "Demographic Structure and the Political Economy of Public Education," Journal of Public Policy Analysis and Management 16(1) (1997), 48-66. Soroka, S. N., R. Johnston, et al., “Ethnicity, Trust, and the Welfare State,” in Cultural Diversity versus Economic Solidarity, P. V. Parijs, ed., (Brussels: De Boeck, 2003). Statistics Canada, “Financial and Charitable Donors Databank of the Income Statistics Division User Guide,” Statistics Canada: Income and Statistics Division, 2010. Stichnoth, H. and K. V. d. Straeten, “Ethnic diversity and attitudes towards redistribution: a review of the literature,” ZEW - Zentrum für Europäische Wirtschaftsforschung / Center for European Economic Research, 2009. Vigdor, J. L., "Interpreting Ethnic Fragmenation Effects," Economics Letters 75(2) (2002), 271-276. Vigdor, J. L., "Community Composition and Collective Action: Analyzing Initial Mail Response to the 2000 Census," The Review of Economics and Statistics 86(1) (2004), 303-312.

27
Table I - Sample Means of Key Variables Over Time
Overall
Year
1991 1996 2001 2006
Panel A: Donation Variables Average Donation (Year 2000 $) 248.12
200.42 212.39 256.41 334.37
Fraction of Households who Donate 0.483
0.538 0.495 0.470 0.458
Average Age of Donors 50.48
47.23 49.83 51.39 52.02
Median Income of Donors (Year 2000 $) 40673.22
39091.98 39408.16 41293.00 43307.55
Panel B: Census Variables Visible Minority Fragmentation Index 0.257
0.228 0.254 0.287
Religion Fragmentation Index 0.551
0.526 0.552 0.569 Household Income (Year 2000 $) 60540.14
59649.93 55878.96 61996.54 65503.38
Immigrants 0.223
0.204 0.218 0.225 0.240
1-Parent Families 0.163
0.145 0.160 0.169 0.171
Highest Level of Schooling High School 0.500
0.464 0.469 0.527 0.532
Highest Level of Schooling University 0.220
0.188 0.212 0.221 0.253
Unemployed 0.069
0.087 0.083 0.058 0.051
Interprovincial Migrants Last 5 Years 0.033
0.040 0.034 0.033 0.028
Interprovincial Migrants Last Year 0.010
0.012 0.010 0.010 0.009
External Migrants Last 5 Years 0.046
0.049 0.045 0.044 0.048
External Migrants Last Year 0.012
0.012 0.010 0.012 0.012
Population under 14 0.188
0.198 0.197 0.185 0.172
Population 15-19 0.066
0.066 0.066 0.067 0.067
Population 55-64 0.094
0.089 0.086 0.093 0.112
Population 65+ 0.126
0.110 0.123 0.130 0.137
Speak English at Home 0.690
0.667 0.676 0.730 0.662
Housing Stock Built 1991-2001 0.106
0.000 0.087 0.152 0.142
Average Number of Rooms in Dwelling 6.19
5.96 6.11 6.25 6.37
Fraction of Dwellings Owned 0.629
0.590 0.611 0.639 0.670
Average Value of Dwelling (Year 2000 $) 202942.40
205756.20 183015.30 181657.10 261318.40
Average Rent (Year 2000 $) 715.51
766.83 700.65 706.87 709.88
Number of Observations 17348
1005 1128 1128 1111
Notes: Numbers based on authors' calculations. All monetary figures are expressed in year 2000 Canadian Dollars. Fragmentation Index is one minus the sum of the squared shares of each group in the population. Average donation is the donation per taxfiler.

28
Table II - Visible Minority and Religion Groups Over Time 1996 Percentage Point
Change 2006-1996 % of FSAs with
Increasing Share 1996-2006
Visible Minority Not Visible Minority 85.10% -5.54 12.69%
East/Southeast Asian 6.68% 2.06 73.18% Chinese 4.16% 1.03 63.73% Filipino 1.10% 0.57 60.40% Southeast Asian 0.81% 0.15 55.99% Japanese 0.30% 0.29 52.39% Korean 0.30% 0.01 41.13%
South Asian 3.05% 1.85 66.34% Black 2.62% 0.47 69.67% Other 1.44% 0.59 76.33%
Latin American 0.83% 0.39 71.47% Other 0.60% 0.20 60.04%
Arab/West Asian 1.13% 0.58 63.64%
1991 Percentage Point Change 2001-1991
% of FSAs with Increasing Share 1991-
2001 Religion
Catholic 45.79% -1.76 42.49% Christian 35.08% -4.65 17.41%
United 10.01% -1.73 18.31% Anglican 7.75% -1.38 19.80% Other Christian 5.28% 0.37 57.11% Presbyterian 2.39% -1.05 6.97% Baptist 2.12% 0.07 53.03% Lutheran 2.24% -0.31 28.16% Orthodox 1.86% 0.08 49.25% Pentecostal 1.39% -0.30 29.55% Jehovah's Witness 0.59% -0.08 40.60% Mennonite 0.47% -0.07 24.98% Reform 0.36% -0.14 14.83% Mormon 0.32% -0.01 40.60% Salvation Army 0.31% -0.10 19.70%
No Religion 13.55% 3.79 91.44% Jewish 1.73% -0.13 45.07% Muslim 1.30% 1.38 74.43% Other 2.55% 1.37 64.78%
Buddhist 0.84% 0.53 67.16%

29
Hindu 0.79% 0.53 50.45% Sikh 0.66% 0.42 38.91%
Other 0.26% -0.11 21.79% Notes: Names of visible minority and religious groups are the names given in the Canada Census. The first column is the population share for a particular group, and the second column is the change in the share over 10 years. There is no data on visible minorities in 1991, and no data on religion in 1996 or 2006.

30
Table III - Relation Between Diversity, Donations, and Census Variables
Ethnic Diversity
Religious Diversity
Low Med High
Low Med High
Panel A: Donation Variables Average Donation 153.42 299.94 301.41
107.63 248.61 280.75
Fraction Donor 0.425 0.494 0.479
0.434 0.537 0.499 Average Age of Donors 52.87 52.03 49.87
50.12 50.67 48.72
Median Income of Donors 37906.71 42266.96 41987.76
37652.76 40561.82 41151.59
Panel B: Census Variables FI (1-3 Vismin, 4-6 Relig) 0.029 0.137 0.471
0.270 0.611 0.699
Household Income 53073.56 62818.17 64846.65
50262.26 60546.55 62950.44 Immigrants 0.050 0.151 0.382
0.094 0.175 0.341
1-Parent Families 0.156 0.164 0.175
0.169 0.146 0.165 Highest Level of School HS 0.546 0.528 0.485
0.482 0.500 0.472
Highest Level of School Uni 0.155 0.217 0.274
0.178 0.189 0.249 Unemployed 0.068 0.055 0.066
0.090 0.067 0.075
Interprov. Migrant < 5 Years 0.024 0.038 0.030
0.015 0.043 0.043 Interprov. Migrant < 1 Year 0.007 0.012 0.009
0.005 0.013 0.013
External Migrant < 5 Years 0.007 0.024 0.082
0.017 0.027 0.082 External Migrant < 1 Year 0.002 0.007 0.020
0.005 0.007 0.020
Population under 14 0.186 0.184 0.184
0.186 0.201 0.192 Population 15-19 0.070 0.066 0.065
0.067 0.068 0.063
Population 55-64 0.105 0.097 0.093
0.095 0.090 0.084 Population 65+ 0.138 0.138 0.120
0.123 0.131 0.114
Speak English at Home 0.497 0.799 0.722
0.275 0.910 0.810 Housing Built 1991-2001 0.128 0.124 0.141
0.070 0.075 0.095
Average Rooms in Dwelling 6.33 6.42 6.07
5.78 6.47 6.02 Fraction of Dwellings Owned 0.680 0.660 0.606
0.568 0.675 0.586
Average Value of Dwelling 124660.70 189579.20 260589.80
129491.50 177860.50 239310.30 Average Rent 555.47 689.41 799.77
586.27 723.16 810.54
Number of FSAs 4074 4074 4073
3685 3685 3685 Notes: FI=Fragmentation Index. Low, Med, and High are based on terciles of the Fragmentation Index for visible minority and religious groups using all available data pooled across time. Variables are as described in previous tables.

31
Table IV - Effect of Visible Minority Heterogeneity on Average Donation
Full Sample
Census Years Only
(1) (2) (3) (4)
(5) (6) Fragmentation Index 1023.69 -185.48 -358.56
-404.07
(142.56) (77.38) (129.68)
(171.91) % Black -1602.32 109.21 1386.62 -274.28
1417.56 -232.52
(349.91) (199.54) (430.27) (439.76)
(508.83) (642.40) % Black Squared 5911.69
5573.21
(2225.33)
(2588.36) % East Asian -609.42 47.40 913.24 483.44
1087.98 555.65
(118.46) (118.48) (217.36) (267.54)
(323.04) (412.42) % East Asian Squared -1157.4
-975.92
(374.28)
(450.06) % South Asian -859.44 137.38 1299.52 414.94
1283.52 367.79
(199.07) (133.77) (182.57) (288.35)
(243.47) (373.16) % South Asian Squared -564.81
-509.85
(416.20)
(534.10) % Arab West Asian -1678.52 -451.04 327.51 -418.18
694.25 -93.47
(490.49) (404.11) (414.57) (551.48)
(537.06) (681.08) % Arab West Asian Squared -3347.15
-3113.42
(3899.75)
(5166.98) % Other -2944.63 670.44 1679.75 95.6
1346.90 5.13
(652.19) (396.00) (468.86) (494.57)
(615.95) (651.00) % Other Squared 7742.7
3498.09
(5439.76)
(6497.43) % White Squared 1057.75
1083.52
(284.67)
(343.95)
Household Income 147.29 94.86 96.21
112.39 113.54
(12.69) (18.64) (18.42)
(27.24) (27.12)
R2 0.085 0.739 0.935 0.935
0.923 0.924 F 44 79 38 39
31 30
N 12221 12221 12221 12221
3333 3333
Census Controls No Yes Yes Yes
Yes Yes FSA Effects No No Yes Yes
Yes Yes
Year Effects Yes Yes Yes Yes Yes Yes

32
Notes: Bolded coefficients are significant at the 5% level; bold-italic coefficients are significant at the 10% level. Full sample includes data from all years 1996-2006, including linearly interpolated census data between years. Census years includes data from 1996, 2001, and 2006 only. Visible minority shares were demeaned prior to estimation, so the coefficients are interpreted as the effect of increasing the share on donations when the share is at its mean. F is the F-statistic of overall significance of the model. Census controls are all variables listed in the previous tables.

33
Table V - Effect of Visible Minority Heterogeneity on Fraction of Households that Donate
Full Sample
Census Years Only
(1) (2) (3) (4)
(5) (6)
Fragmentation Index 0.38 0.03 0.02
0.00
(0.08) (0.03) (0.05)
(0.07)
% Black -0.50 -0.03 0.16 -0.03
0.17 -0.05
(0.22) (0.08) (0.13) (0.11)
(0.15) (0.13)
% Black Squared 1.26
1.43
(0.83)
(0.86)
% East Asian -0.25 -0.08 -0.03 0.02
0.00 0.03
(0.09) (0.04) (0.06) (0.09)
(0.07) (0.11)
% East Asian Squared -0.21
-0.15
(0.14)
(0.18)
% South Asian -0.02 -0.02 0.23 0.25
0.17 0.17
(0.15) (0.04) (0.06) (0.12)
(0.07) (0.17)
% South Asian Squared -0.18
-0.10
(0.21)
(0.26)
% Arab West Asian -0.40 -0.43 -0.11 -0.19
-0.13 -0.27
(0.29) (0.11) (0.14) (0.15)
(0.17) (0.17)
% Arab West Asian Squared 0.42
1.09
(1.13)
(1.24)
% Other -2.66 0.13 0.13 -0.19
0.07 -0.30
(0.43) (0.17) (0.15) (0.17)
(0.18) (0.20)
% Other Squared 4.49
5.19
(1.76)
(1.99)
% White Squared 0.04
0.01
(0.12)
(0.15)
Household Income 0.02 0.00 0.00
0.00 0.00
(0.00) (0.00) (0.00)
(0.00) (0.00)
R2 0.083 0.808 0.979 0.979
0.972 0.973
F 206 259 98 88
42 38
N 12221 12221 12221 12221
3333 3333
Census Controls No Yes Yes Yes
Yes Yes
FSA Effects No No Yes Yes
Yes Yes
Year Effects Yes Yes Yes Yes Yes Yes Notes: Bolded coefficients are significant at the 5% level; bold-italic coefficients are significant at the 10% level. Full sample includes data from all years 1996-2006, including linearly interpolated census data between years. Census years includes data from 1996, 2001, and 2006 only. Visible minority shares were demeaned prior to estimation, so the coefficients are interpreted as the effect of increasing the share on donations when the share is at its mean. F is the F-statistic of overall significance of the model. Census controls are all variables listed in the previous tables.

34
Table VI - Effect of Religious Heterogeneity on Donation Outcomes
Average Donations
Fraction of Households Donating
(1) (2)
(3) (4)
Fragmentation Index -226.86
-0.03 (153.15)
(0.07)
% Catholic -420.97 -306.35
-0.06 0.38
(290.02) (330.64)
(0.10) (0.10) % Catholic Squared 660.61
-0.22
(313.27)
(0.12) % Christian -358.33 -149.02
-0.15 0.41
(207.38) (362.68)
(0.09) (0.12) % Christian Squared -295.97
-0.49
(558.15)
(0.18) % Muslim -1054.64 -1042.61
0.01 0.40
(385.21) (623.39)
(0.12) (0.16) % Muslim Squared -176.89
0.64
(1061.51)
(0.53) % Jewish -1255.50 -814.79
0.07 0.46
(999.69) (1091.59)
(0.12) (0.17) % Jewish Squared -595.42
0.02
(1693.10)
(0.18) % Other -314.31 -606.55
0.06 0.54
(219.26) (407.05)
(0.13) (0.18) % Other Squared 805.85
0.00
(666.29)
(0.35) % No Religion Squared 59.45
2.02
(637.94)
(0.29) Household Income 153.37 152.92
0.00 0.00
(22.38) (22.67)
(0.00) (0.00)
R2 0.925 0.925
0.977 0.978 F 26 24
136 128
N 11055 11055
11055 11055
Census Controls Yes Yes
Yes Yes FSA Effects Yes Yes
Yes Yes
Year Effects Yes Yes Yes Yes

35
Notes: Bolded coefficients are significant at the 5% level, and bold-italic coefficients are significant at the 10% level. Religion shares were demeaned prior to estimation, so the coefficients are interpreted as the effect of increasing the share on donations when the share is at its mean. F is the F-statistic of overall significance of the model. Census controls are all variables listed in the previous tables.
36
Table VII - Effect of RQ Measure on Average Donations and Fraction of Households who Donate
Panel A Visible Minority
Panel B Religion
Donation Fraction
Donation Fraction
Amount Donating
Amount Donating
(1) (2)
(3) (4)
RQ -219.52 -0.01
RQ -126.59 0.12
(62.67) (0.03)
(70.11) (0.04)
% Black 1152.60 0.19
% Catholic -359.55 0.03 (392.42) (0.11)
(258.53) (0.09)
% East Asian 800.21 -0.01
% Christian -266.33 -0.16 (208.33) (0.06)
(197.81) (0.09)
% South Asian 1148.01 0.24
% Muslim -1193.56 0.09 (164.18) (0.05)
(416.10) (0.12)
% Arab West Asian -29.89 -0.08
% Jewish -1212.63 0.10 (362.52) (0.12)
(1016.07) (0.11)
% Other 1310.25 0.17
% Other Religions -325.56 0.13
(407.64) (0.12)
(211.53) (0.14) Household Income 95.61 0.00
Household Income 152.16 0.00
(18.70) (0.00)
(22.19) (0.00)
0.93 0.98
R2 0.935 0.979
R2 0.925 0.978 F 39 97
F 25 139
N 12221 12221
N 11055 11055
Census Controls Yes Yes
Census Controls Yes Yes FSA Effects Yes Yes
FSA Effects Yes Yes
Year Effects Yes Yes Year Effects Yes Yes Notes: Bolded coefficients are significant at the 5% level, and bold-italic coefficients are significant at the 10% level. RQ is a measure of polarization of groups, as discussed in Montalvo & Reynal-Querol (2002). Religion and Visible Minority Shares were demeaned prior to estimation, so the coefficients are interpreted as the effect of increasing the share on donations when the share is at its mean. F is the F-statistic of overall significance of the model. Census controls are all variables listed in the previous tables.