Embed Size (px)
Citation preview

1
Disturbance Accommodating
Adaptive Control with Application to
Wind Turbines
Susan Frost, Ph.D. Intelligent Systems Division
NASA Ames Research Center
December 5, 2012
https://ntrs.nasa.gov/search.jsp?R=20130013544 2018-07-16T06:39:01+00:00Z

Outline
Why wind energy
Advances and challenges
Wind turbine control
Disturbance accommodating adaptive control
Residual mode filters for flexible structure control
Application to wind turbine control
Adaptive contingency control using system health
information for wind turbines
2

Why wind energy?
3

Primary energy use by fuel in U.S.
EIA (US Energy Information Association)
4
Fuel Use
(x 1015 BTU)
US electricity generation by fuel
EIA (US Energy Information Association)
5

Renewable electricity generation capacity
EIA (US Energy Information Association)
6
Electricity
Generation
Capacity
(GW)
Wind
MSW/LFG
Geothermal
Biomass
Solar
Note: Hydropower is omitted
Forecast →

Wind power resources in U.S.
• Class 4 or higher wind suitable for
utility-scale turbines
• Class 3 areas could have higher wind
power at 80 meters
7
Huge off-shore
wind resource:
US estimate is
54 GW

Evolution of wind turbines
Source: www.owenscorning.com Turn of the Century Wind Mill
Wind speed can increase by 20% with 10 m increase in height
Largest turbine in production is 126 meter diameter (5 MW)
Wind power is proportional to rotor area times wind speed cubed
8

Wind industry observations
Wind Industry Challenges
Building large turbines (>5 MW)
Developing off-shore turbines
CFD models of turbine interactions
Operating & maintenance costs
Turbine reliability
Grid integration
Community noise
Wind farm siting
Unstable public policy
Decreasing Cost of Energy
(~$0.40/kW-hr in 1979
~$0.07/kW-hr in 2010)
R&D Advances
Increased Turbine Size
Manufacturing Improvements
Large Wind Farms
9

Why wind energy?
US Energy Needs Aging nuclear plants
Reduce fuel emissions
Protect fossil fuel sources
for future generations
Mitigate reliance on foreign
energy sources
Stability of electricity prices
Comply with mandates
Increase reliability of electric
generation and distribution
Wind Energy Capabilities Becoming cost competitive
with fossil fuels
Clean, renewable energy
Significant wind energy
resources
Encourages rural economic
development
Dual use land – ranching or
oil/gas recovery and wind
farms
Public support of wind energy is strong in most places
10

Wind power capacity
U.S. Statistics for End of 2010 (AWEA)
40,180 megawatts (MW) total installed capacity in US
Average nameplate capacity was 1.67 MW for new turbines
Over 5,115 MW installed capacity in 2010
Name plate capacity: maximum power output of a turbine
Installed capacity: sum of nameplate power rating of all turbines
installed during a specific time period or geographic area
Capacity factor: indicator of how much power a particular
turbine will make in a specific location
Typical wind power capacity factors are 20-40%
11

World installed capacity (Dec 2010)
Source: GWEC
12
-
5,000
10,000
15,000
20,000
25,000
30,000
35,000
40,000
45,000 Total Installed Capacity (MW) (2010)
Inst
alle
d C
apac
ity (
MW
)
Wind Power Penetration
Denmark 21%
Portugal 18%
Spain 16%
- End of 2010
Ireland 14%
Germany 9%
U.S. 2.5%
Capacity Installed in 2011

U.S. transmission grid as of 2006
DOE, 2006
www.sanfranciscosentinal.com
13

Utility-scale horizontal axis wind turbine (HAWT)
Utility-Scale HAWT’s Rotor Diameter:
– 40-95 m Onshore
– 90-114 m Offshore
Tower: 25-180 meters
Capacity:
– 0.1-3 MW Onshore
– 3-6 MW Offshore
Start up wind speed:
4-5 mps
Max wind speed:
22-26 mps
Low speed shaft:
30-60 RPM
High speed shaft:
1000-1800 RPM
Image: NWTC, NREL 14

Equation for power
captured by a wind turbine:
312
,pP AC
Wind power
Wind Field
Aerodynamics
Structural Dynamics
Motion
Control
Sensing Actuation
Electrical Power
Internal Loads Blade Loads
blade pitch angle
tip-speed ratio
wind velocity
air density
rotor swept area
power coefficientp
A
C
speed of blade tip
wind speed
15
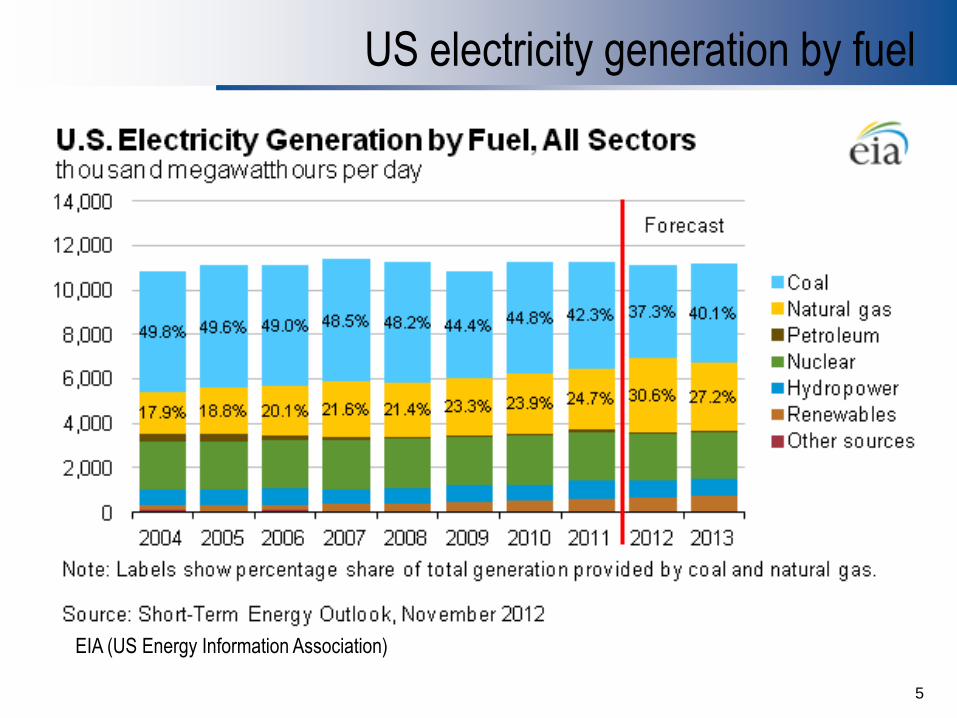
Operating regions & control strategies
16
Pow
er
Wind Speed,w
wcut-in wrated wcut-out
Rated Power
Pwind
Region 1 Region 2 Region 3
3
2
1wACPwindP
Maximize power
generation Maintain rated power
mitigate loads
Control Objectives:
Reduce cost of wind energy
Enhance power capture
Mitigate turbine loads
Maintain safe turbine operation
Region 3:
Control blade pitch to maintain
constant rotor speed
Generator torque held constant
Region 2:
Control generator torque to
yield optimum power
Hold blade pitch constant

Wind turbine control and adaptive control
Why is
control
important?
Future trends in wind turbines
– Large multi-megawatt turbines
– Increased likelihood of excitation of structural modes by
highly turbulent flow
Control can increase efficiency, uptime, and lifespan of
turbines
What is
adaptive
control?
Plant output is used to modify control law thereby
responding to unmodeled plant dynamics, uncertain
operating environment and time varying parameters
Benefits of
adaptive
control
Provides good performance for poorly modeled plants with
uncertain and quickly changing operating environments
Controller is quick to design
Controller is robust to slowly changing turbine parameters
17

Dynamical system definitions
18
where plant parameters (A, B, C, Γ) are unknown
Linear Time-invariant Plant:
0)0( ; xxCxy
uBuΑxx D
Disturbance Generator:
uD zD
zD LD ; zD (0) z0
where disturbance basis functions ΦD are known but amplitude
L is unknown
Ex: Step disturbance: where
are unknown and DDD a Lzu ;10
L ,0a 1D
Reference Model:
m
mmmm
m
mmmm
mmmmm
0
0
)0(;
)0(;
uuuFu
xxxCy
uBxAx
where model is stable and model
parameters are known

Disturbance accommodating adaptive control
19
Control Objective: Cause plant output to asymptotically track
reference model output while rejecting persistent disturbances 0
tmy yyeOutput error:
Control Law: DDyemumm GeGuGxGu
D
T
DyD
e
T
yye
m
T
mym
u
T
myu
h
h
h
h
eG
eeG
xeG
ueG
G
Controller Gains:
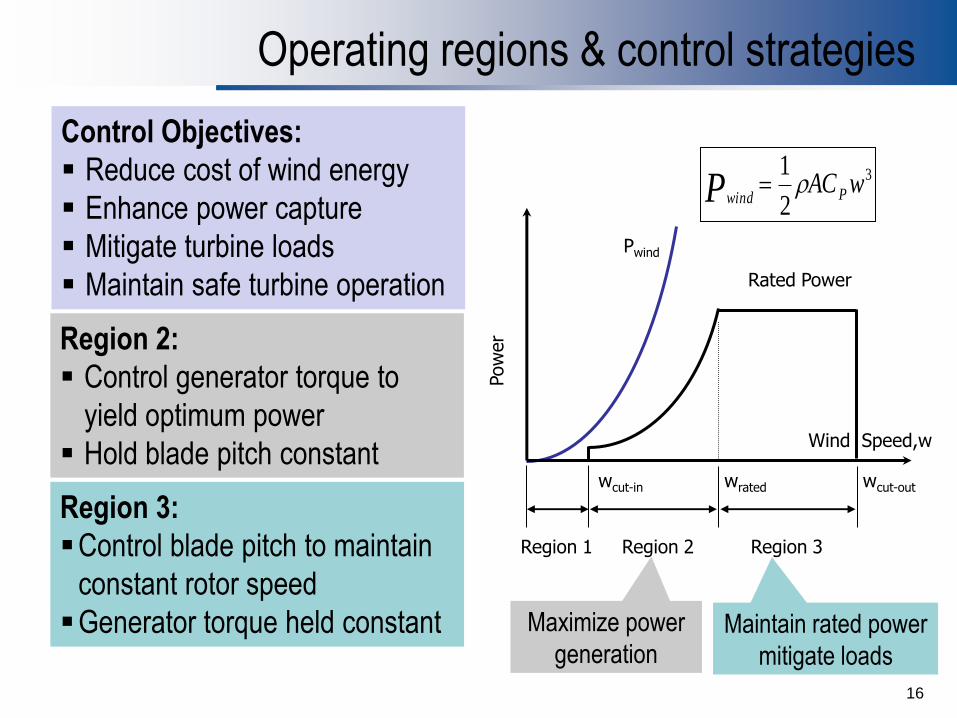
Model Matching Conditions
20
Define ideal trajectories for plant:
0)0(; )(
xxyCxy
uBuAxx
m
D
x S11xm S12
um S13
*zD
u S21xm S22
um S23
*zD
where
Solutions to matching conditions must exist for analysis purposes, BUT they don’t need to be known for adaptive controller design!
Matching conditions are
necessary and sufficient for
existence of ideal trajectories Matching conditions exist
if CB is nonsingular
Model Matching Conditions are obtained by substituting ideal trajectories into above:
AS11 BS21
S11Am;AS12
BS22 S11
Bm S12
Fm
CS11 Cm;CS12
0;AS13 BS23
S13F;CS13
0
)(

Closed-loop stability result
21
Theorem: Suppose the following are true:
1. All um are bounded (i.e., all eigenvalues of Fm are in the closed
left-half plane and any eigenvalues on the jω-axis are simple);
2. The reference model is stable;
3. is bounded (i.e., all eigenvalues of F are in the closed left-half
plane and any eigenvalues on the jω-axis are simple);
4. is Almost Strict Positive Real (ASPR) (i.e.,
and the open-loop transfer function is minimum phase)
Then the adaptive gains are bounded,
and asymptotic tracking occurs, i.e.
mmm CBA , ,
D
0CB CBA , ,
Deum GGGG , , ,
0* tmy Ceyye
For Closed-Loop Stability Analysis, see: Frost, Balas, Wright, IJRNC (2009)
1
Note: A system ( , , ) is ASPR when 0 and its closed-loop
transfer function ( ) ( ) is minimum phase.
A B C CB
P s C sI A B

Flexible structure control challenges
Controller Structure Interaction:
Flexible structures are intrinsically modal systems
Structural modes can be excited by feedback control
Low pass & notch filters can reduce problems, but limitations exist
Residual Mode Filter (RMF) has internal model of structural mode,
including phase and frequency, that can be used to remove
troublesome mode from feedback signal
22

Plant & operating environment uncertainties
23
Flexible aerospace structures, including wind turbines, are difficult to
model and they operate in poorly known environments
Adaptive control helps, but requires minimum phase plants (ASPR)
Residual Mode Filters (RMF) can restore ASPR to closed-loop system

24
Partition plant into ASPR & non-ASPR
ppp CBA ,,
0 ;
0
0
Q
Qp
D
Q
p
QQQQ
x
xCCy
uuB
B
x
x
A
A
x
x
Assume original system can be partitioned as:
Controlled Plant
Q modes:
Open-loop stable
but not ASPR
All Residual Modes
All Open-Loop
Unstable Modes
that are ASPR
Reduced Order Model
Use RMF to remove
these modes from
controller feedback

Adaptive controller using RMF
25
Retained Modes
yu
Adaptive
Controller
Residual Modes
Qy
yp
Qy
Qpc yyy
DuCxy
BuAxx
QQQ
QQQQ
xCy
uBxAx
Residual Mode
Filter
Nonlinear Wind Turbine Plant Du
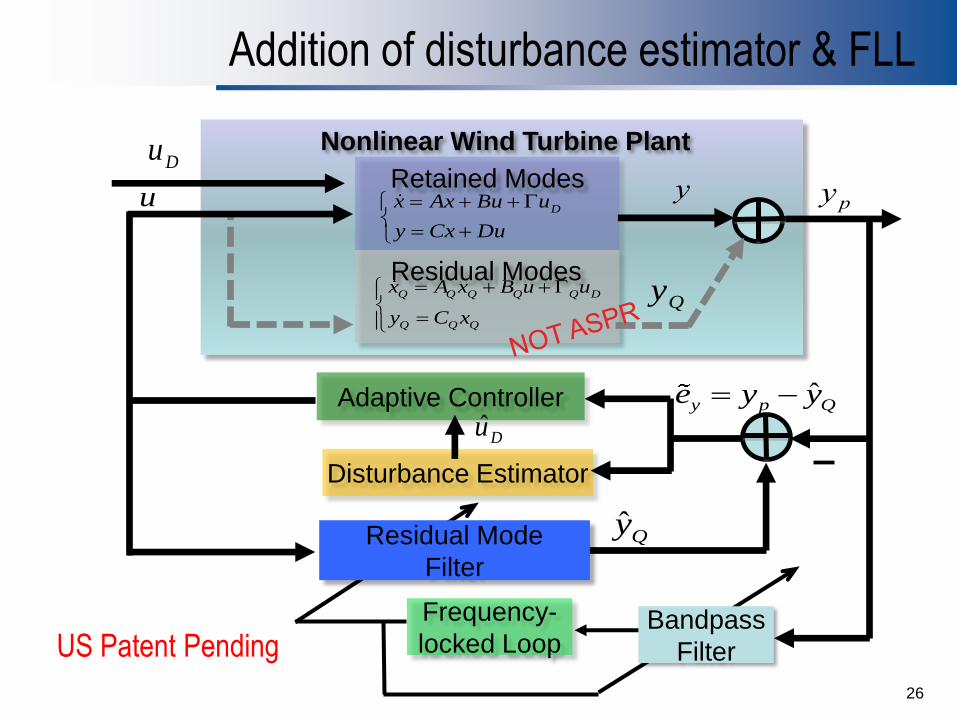
Addition of disturbance estimator & FLL
Retained Modes
yu
Adaptive Controller
Residual Modes Qy
yp
ˆQy
ˆy p Qe y y
Dx Ax Bu u
y Cx Du
Q Q Q Q Q D
Q Q Q
x A x B u u
y C x
Nonlinear Wind Turbine Plant Du
Disturbance Estimator
ˆDu
Bandpass
Filter
Residual Mode
Filter
Frequency-
locked Loop
26
US Patent Pending

Controls Advanced Research Turbine (CART)
27
CART2, NWTC, Golden, Colorado image credit: NREL
CART2 Specifications
Variable-speed, two-bladed, teetered, upwind, active-yaw
Rotor Diameter: 43.3 m
Hub Height: 36.6 m
Rated electrical power: 600 kW at 42 RPM in region 3
Region 3 Rated generator speed: 1800 RPM
Power electronics command constant generator torque
Blade pitch rate limit: ±18 deg/sec
Baseline PI Pitch Controller

28
FAST simulator for CART
rotgenQ
genIrotorI aeroQ
Low-speed
Shaft
High-speed
Shaft
Tower
Nacelle
Generator
Gearbox
Blade
Hub
Rotor erodynamics
tructures
urbulence
atigue
Configurable high fidelity simulation of CART with controller in the loop
Aeroelastic simulator of extreme and fatigue loads
Aerodynamic forces computed by AeroDyn code (Windward Engineering)
Turbine modeled by rigid and flexible bodies
http://wind.nrel.gov/designcodes/

29
Adaptive pitch control in Region 3
Objective: Regulate generator speed and reject disturbances
Input: Rotor speed
Output: Collective blade pitch, constant generator torque
Disturbance: Turbulent wind inflow
Uniform disturbance of wind gust across rotor can be modeled by a
step function of unknown amplitude, so
RMF designed for drive-train rotational flexibility mode
1D

30
Adaptive pitch control for FAST simulator*
Generator speed for
turbulent wind input
---- Baseline PI
---- Adaptive RMF
generator
set-point
generator
over-speed
*NREL’s FAST simulator of CART2 (high fidelity simulation of flexible 2-bladed wind turbine)
see: http://wind.nrel.gov/designcodes/
Excursions from set-point
cause higher blade loads

31
Adaptive contingency control
System health monitoring for safe operation of all turbines in wind farm
Ensure damaged turbines are off-line before failure
Adaptive controls to reduce loads on turbines with faults
Function of current damage level & operating conditions
Cost of Energy (CoE) optimization
Incorporate wind forecasts, grid requirements and maintenance
schedules with prognostic health management information
Reduce loading cycles and extreme events on damaged turbines
and extend remaining useful life
Smooth power production under variable wind conditions
Some OEMs are moving
towards guaranteed uptime
Operators and developers often need
20-25 years of life for profitability

SCADA system: Supervisory Control and Data
Acquisition for wind farm
Medium- and long-term changes in
environmental & operating conditions
Minimal fault diagnosis
Lots of data, not always useful
Short-term condition monitoring
Equipment set up for one month for vibration,
acoustic, strain, nacelle acceleration testing
Acceptance of CM by operators/developers
Dependent on cost of CM system
Might affect warranty
32
Condition monitoring in wind turbines
Image: www.vertigo.net.au

33
Leading causes of blade failures1
1) Manufacturing defects - wrinkles in laminate, missing or incomplete bond lines, dry fibers
2) Progressive damage initiating from leading-edge erosion, skin cracks, transport,
handling, or lightning strikes
3) Excessive loads from turbine system dynamics or dynamic interaction with control
system
4) Out-of-plane forces and distortion of blade sections (“bulging/breathing” effect) mostly in
root transition region, due to blade loading
5) Excessive loads due to unusually severe atmospheric conditions
1DNV Renewables, Seattle, WA, “Lessons Learned from Recent Blade Failures: Primary Causes and Risk-
Reducing Technologies”, D.A. Griffin & M.C. Malkin, 49th AIAA Aerospace Sciences Meeting, Jan 2011

34
FAST turbine blades
Damaged blade configuration files:
Flapwise and edgewise stiffness are varied at 1-2 blade stations
Blade bending mode shapes are recomputed
Structural damping and other parameters were left unchanged
Flapwise
Direction
Edgewise
Direction
Spanwise
Direction
Department of Wind Energy,
Risoe National Laboratory
Assumption:
Blade damage can be
represented by reduction
in flapwise and edgewise
stiffnesses
FAST blade configuration files:
21 distributed stations along span
Flapwise & edgewise stiffness
Flapwise & edgewise bending modes

35
Blade node sensitivity to stiffness changes
Full factorial study performed to determine blade node sensitivity:
Parameters: blade damage, wind speed, blade pitch
Levels: 8 for damage, 7 for wind, 10 for blade pitch
Loads on blades
are primarily due
to aerodynamic
forces
Out-of-plane deflection (m)

36
Effect of derating generator on blade loads
Hypothesis: Reducing power output through generator set-point
reduction will reduce loads on turbine blades
Percent reduction in
generator set-point
from rated value
17.5 18 18.5 19 19.5 20 20.5222
224
226
228
230
232
234
In-plane root bending moment for blade 1
Wind Speed (m/sec)
Da
ma
ge
Eq
uiv
ale
nt L
oa
ds
0%
3%
5%
10%

37
Adaptive contingency control in Region 3
Objective: Regulate generator speed, reject disturbances,
and derate generator in turbulent conditions
Input: Rotor speed
Output: Collective blade pitch, constant generator torque
Disturbance: Step function
Uniform disturbance of wind gust across rotor can be modeled by a
step function of unknown amplitude, so
RMF designed for drive-train rotational flexibility mode
Turbulent loading observer – uses delta rotor speed changes
Generator de-rating by incremental steps
1D

38
De-rating generator for reduced blade loads
0 100 200 300 400 500 60010
12
14
16
18
20
22
24
26
28
Win
d I
nflow
(m
ps)
Time (s)
0 100 200 300 400 500 6001400
1500
1600
1700
1800
Genera
tor
speed s
etp
oin
t (r
pm
)
0 100 200 300 400 500 6001400
1500
1600
1700
1800
1900
Genera
tor
speed (
rpm
)
Time (s)
Generator speed
Simulation Wind Input Generator set-point

Simulation results
0 100 200 300 400 500 600-200
-100
0
100
200
300
400
500
600
Bla
de R
oot
Bendin
g M
om
ent
(N-m
)
Time (s)
0 100 200 300 400 500 600-100
0
100
200
300
400
500
600
Bla
de R
oot
Bendin
g M
om
ent
(N-m
)
Time (s)
Out-of-plane blade root bending moment
No contingency control Adaptive contingency control
Simulation demonstrating contingency controller lowering generator
set-point for turbine with blade damage when winds are turbulent &
above rated speed
Resulting decrease in blade root bending could extend service life
39

40
Damage equivalent loads
Blade damage at node 5 – with 20%
reduction in stiffness
41
Future research: Cost of energy improvements
Proposed Solution Develop a multi-disciplinary game-changing approach to significantly
improve the cost of energy for wind.
By employing autonomous decision-making for adaptive contingency
control of wind turbines in large wind farms using prognostic health
management information, wind forecasting, and logistics information,
a significant reduction in the cost of wind energy is possible.
Preliminary Study Results Simulation demonstrating contingency controller lowering power
output for damaged turbines when winds could be destructive1
Resulting decrease in wind turbine loads could extend service life
Developed framework & path forward for autonomous decision-
making, wind turbine controls, prognostic health management, and
wind forecasting
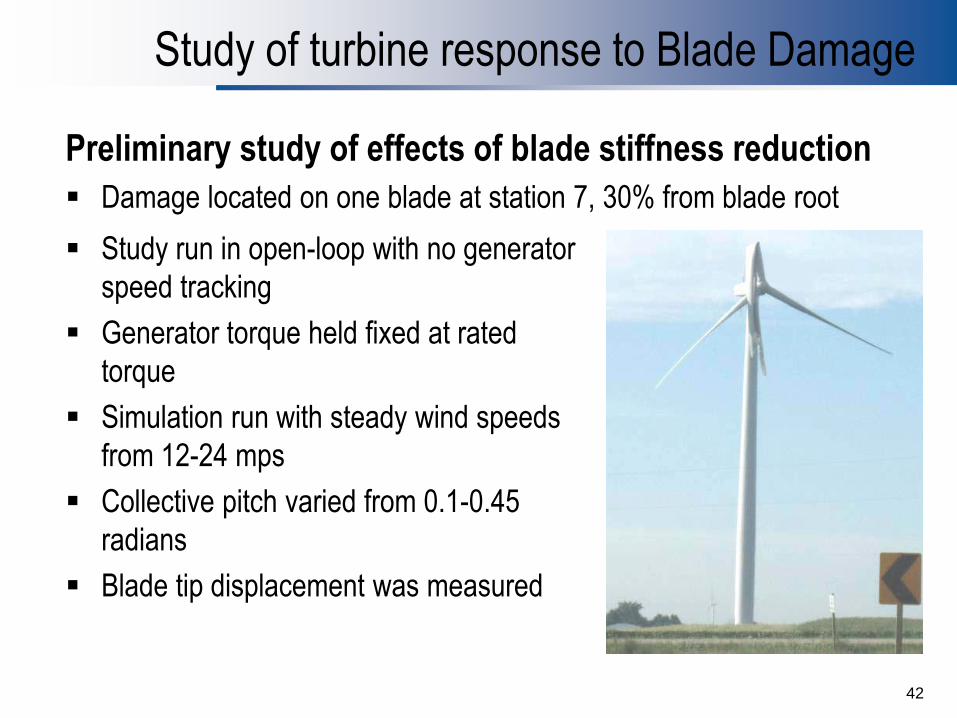
Study of turbine response to Blade Damage
Study run in open-loop with no generator
speed tracking
Generator torque held fixed at rated
torque
Simulation run with steady wind speeds
from 12-24 mps
Collective pitch varied from 0.1-0.45
radians
Blade tip displacement was measured
42
Preliminary study of effects of blade stiffness reduction
Damage located on one blade at station 7, 30% from blade root

43
Change in tip deflection with generator derating
Hypothesis: Reducing power output through generator set-point
reduction will reduce loads on turbine blades
Input: Above rated turbulent wind
Std. dev. of out-of-plane tip deflection for different damage levels at node 7

44
Backup slides