Embed Size (px)
Citation preview

Department of the ArmyU.S. Army Corps of Engineers
CECW-EE Washington, DC 20314-1000 EP 1110-2-550
Technical LetterNo. 1110-2-550 30 May 1997
Engineering and DesignRELIABILITY ANALYSIS OF HYDROPOWER EQUIPMENT
Distribution Restriction Statement
Approved for public release; distribution is unlimited.
Report Documentation Page
Report Date 30 May 1997
Report Type N/A
Dates Covered (from... to) -
Title and Subtitle Engineering and Design: Reliability Analysis ofHydropower Equipment
Contract Number
Grant Number
Program Element Number
Author(s) Project Number
Task Number
Work Unit Number
Performing Organization Name(s) and Address(es) Department of the Army U.S. Army Corps of EngineersWashington, DC 20314-1000
Performing Organization Report Number
Sponsoring/Monitoring Agency Name(s) and Address(es)
Sponsor/Monitor’s Acronym(s)
Sponsor/Monitor’s Report Number(s)
Distribution/Availability Statement Approved for public release, distribution unlimited
Supplementary Notes
Abstract
Subject Terms
Report Classification unclassified
Classification of this page unclassified
Classification of Abstract unclassified
Limitation of Abstract UU
Number of Pages 41

DEPARTMENT OF THE ARMY ETL 1110-2-550U.S. Army Corps of Engineers
CECW-EE Washington, DC 20314-1000
Technical LetterNo. 1110-2-550 30 May 1997
Engineering and DesignRELIABILITY ANALYSIS OF HYDROPOWER EQUIPMENT
1. Purpose a. In FY 1992, major rehabilitation projects
This engineer technical letter (ETL) provides basic and Flood Control, Mississippi River andguidance for assessing the reliability of hydropower Tributaries, appropriation accounts. Totalequipment and establishes an engineering basis for implementation costs of hydropower rehabilitationrehabilitation investment decisions. The projects must be in excess of $5.3 million for FYmethodology, concepts, and background 1998 submittals, and the work must extend overinformation are briefly stated with further two full construction seasons to qualify under theexplanation and examples in the appendices. This major rehabilitation program. The cost thresholdletter also references the hydropower benefits amounts are adjusted annually for inflation asanalysis and the economic models as they relate to published in the Annual Program and Budgethydropower rehabilitation projects. Request for Civil Works Activities, Corps of
2. Applicability economic analysis than in the past. Not only is it
This ETL applies to all HQUSACE elements and major rehabilitation work exceed the cost, but itUSACE commands having responsibilities for civil must also be demonstrated that each component in aworks hydroelectric power plant projects. rehabilitation plan is incrementally justified and that
3. References major rehabilitation work must be supported by the
Required and related publications are listed in water resource development projects. The Chap-Appendix A. ter 3 of the ER 1130-2-500 establishes the policy
4. Background established guidance for the preparation and
Reliability analyses are a required and significant Evaluation Reports for annual program and budgetpart of the economic justification for funding of submissions. They should be consulted for the mostrehabilitation and major maintenance projects. recent policy on types of improvements that can be
began being budgeted under Construction, General,
Engineers, EC 11-2-172. Proposals for theseprojects are subjected to a much more rigorous
necessary to show that the monetary benefits of
the combination of components proposed yields themaximum net benefits. In short, proposals for
same level of economic analysis as that for new
for major rehabilitation at completed Corpsprojects. The Chapter 3 of the EP 1130-2-500
submission of Major Rehabilitation Projects
pursued under the Major Rehabilitation program
This technical letter supersedes ETL 1110-2-337, dated 30 June 1994.

ETL 1110-2-55030 May 97
2
and the basic assumptions for the economic c. Uncertainty. A condition whereanalysis. Currently, reliability is the key factor in indeterminacy exists in some of the elements thatdetermining whether there is a Federal interest in a characterize a situation. Uncertainty may exist fromproposed replacement. If an equipment replacement either probability uncertainty or outcomeis reliability-driven, the investment is generally uncertainty or any of the pathways between theFederally funded. An increase in output which is initiating event and the consequences.primarily incidental to the reliability work may alsobe included in such a project. However, non- d. Variability. The existence of differences inFederal funding is required to fund the project if the numerical quantities within the same population. there are no reliability problems and the proposed Uncertainty and variability have some of the sameproject purpose is only to improve output beyond connotations. With variability, the range ofthe original design. Contact CECW-B for current possible values is usually known, perhaps alongpolicy on non-Federal funding of generation with other information such as the distribution. improvements. However, uncertainty allows the values for a
b. Hydropower major maintenance work items not characterized in quantities exhibiting variability. also require reliability analysis and economic This suggests that if placed on a continuum fromjustification. Major maintenance includes projects, complete randomness to complete determinacy,such as a generator rewind, with total estimated variability is somewhere closer to certainty thancosts that exceed $3 million and do not qualify as uncertainty is.Major Rehabilitation. Specific guidance onhydropower major maintenance evaluation e. Reliability of power plants. There are risksrequirements is being drafted by CECW-B. associated with the possible failure of operating
5. Reliability Concepts that has been derated because of previous problems
There are some basic reliability concepts which power that it could originally produce. That is aarise from statistics and are utilized in evaluating certainty. The exact amount of power the unit canreliability. The definitions of the terms used to produce in the derated condition is uncertain. Therepresent these concepts and the definitions of terms probability that a generating unit will fail after itmore specific to hydropower equipment reliability has been on line for 20 years has variability. Theanalyses follow. engineering reliability analysis required for a major
a. Risk. The exposure to a chance of loss or consider these reliability concepts.injury; the likelihood of adverse consequences. Expressions of risk are composed of the following f. Equipment reliability. Hydropowertwo parts: equipment reliability is defined as follows:
(1) The existence of unwanted consequences. be counted on to perform as originally intended.
(2) The occurrence of each consequence integrity of the equipment based on forced outageexpressed in the form of a probability. experience and maintenance costs, the output of the
b. Certainty. A condition where determinacy capacity, unit availability, and the dependability ofexists in the elements that characterize a situation. the equipment in terms of remaining service lifeThe likelihood of an event occurring and its (retirement of the equipment).consequences are known absolutely.
quantity to retain an element of vagueness that is
power plants. The risks include repair costs andhigher power generating costs. A generating unit
is not capable of producing the same amount of
maintenance rehabilitation proposal needs to
The extent to which the generating equipment can
This encompasses the confidence in soundness or
equipment in terms of measured efficiency and

ETL 1110-2-55030 May 97
3
6. Engineering Reliability Analysis contacted on the requirements for justifying
This section discusses the many facets of reliability rehabilitation and major maintenance threshholdsof hydropower equipment in relatively broad terms. and for using HYD-QUAD. HYD-QUAD isAppendices B through E go into further detail by discussed in Appendix F.exploring a theoretical project and applying ananalysis to that project. The overall engineering (2) Caution must be exercised when relying onreliability analysis consists of four independent maintenance costs as indicators of reliabilityanalyses to determine the following equipment because they do not necessarily reflect equipmentreliability factors: (a) forced outage experience and reliability. Explanations of costs and maintenancemaintenance costs; (b) efficiency and capacity; efforts should be presented in the evaluation(c) availability; and (d) dependability. The life- reports. Maintenance and repair records should becycle costs of each segment are compiled for use in tabulated and charted to show the trends over thethe economic analysis. Benefits for each alternative past few years. Projections for future years can beare calculated by subtracting the average annual made using sound engineering judgment toequivalent life-cycle costs for the alternative from extrapolate these costs and should be made for eachthe average annual equivalent life-cycle costs for the of the alternatives being considered. Lost energybase condition. The following paragraphs briefly and capacity are discussed below under the topic ofsummarize each segment of the reliability analysis. availability.
a. Forced outage experience and maintenance b. Efficiency and capacity. This portion of thecosts. A forced outage occurs when a power plant reliability analysis can be applied to any piece ofcomponent fails to perform satisfactorily and causes equipment that has an effect on the ability of thean interruption in power production. A planned generating unit to produce rated power at ratedoutage occurs when a unit is intentionally taken out efficiency. However, this approach is primarilyof service to perform planned repairs, replacements, applicable to the turbines, generators, androutine inspections, and rehabilitations. transformers. Turbines will be used as an example
(1) The life-cycle cost of equipmentmaintenance and repair includes labor and material (1) Part of the aging process of turbines is thecosts as well as lost energy and capacity benefits development of cracks, corrosion, erosion, scaling,associated with forced or planned outages. and cavitation damage. Much of this damage isTherefore, reliability is a determining factor in corrected by welding, which induces materialestimating life-cycle costs. Decreased reliability stresses and can change the shape of the turbinemay be represented by a large increase in labor and water passage thereby lowering the efficiency of thematerials costs over time. Certainly, increasing turbine. Thus, degradation of turbine performancemaintenance costs and unit outage hours can both occurs as a result of the aging process and can bebe used to indicate a need for equipment exacerbated by repairs which are necessary to keepreplacement or rehabilitation. Project records for the turbine operational.the equipment in question can be used to documentpast trends and as a basis to make future (2) The first step in quantifying the perfor-projections. Currently, such documentation may be mance degradation is to determine current andthe only justification required for replacing original levels of performance. Current efficiencyrelatively low cost items that are critical for power and power output must be determined by fieldproduction. In the near future, economic testing at similar settings used in the original fieldjustification that incorporates reliability will be tests. The current performance must then berequired. The economic justification will compared with the original level of performance tobe conducted using the Hydropower QUADRANT establish the amount of performance degradationmodel, HYD-QUAD. CECW-B should be that has occurred. Original levels of performance
relatively low cost items below the main
in the following explanation.

ETL 1110-2-55030 May 97
4
can be established from model tests and acceptance (2) Hydropower equipment is typicallytest data. It is important to fully investigate the operated until it fails or is retired for some othercalibrations and calculations of the data in order to reason. Failure meaning that it ceases to functiontruly compare the original and current performance. properly under the stresses applied. Replacement
(3) The information derived from this testing stituting the effective retirement of a piece ofand analysis is provided as input to the equipment. The first major reason for equipmenthydroelectric power benefits analysis, which is retirement is physical condition, which includesdiscussed in Appendix D. The benefits analysis deterioration with time, wear from use, and failureestimates the power system production costs using a in service. The second reason for retirement isfull range of unit availability which can be applied related to functional situations, which includeto the base case and each alternative. inadequacy to perform required functions, potential
c. Availability. Availability is the annual These may occur due to a change in environment,percentage of time that the generating equipment is operating conditions, or load requirements. Theavailable for power production. Records of first category, physical condition, is the primaryavailability are maintained by each project on a reason that the Corps developed the Majorunit-by-unit basis. The current level of availability Rehabilitation Program. This program establishes amust be compared with previous data to establish standardized method of considering and evaluatingthe extent of degradation. Historical trends can be the deterioration and wear of equipment in an effortextrapolated to project future changes in the unit to optimize rehabilitation actions. Failures inavailability rate. Availability data are also used as service are generally not evaluated under the Majorinput to the hydroelectric power benefits analysis. Maintenance and Rehabilitation Programs, but are
d. Dependability (reliability). Maintenance funds. Reliability is the key factor in
(1) The final area of consideration concerning proposed replacement. As previously stated, ifequipment reliability is dependability. there are no reliability problems and the proposedDependability is ascertained by a risk analysis that project purpose is to solely improve output beyonddetermines the probability that the equipment will the original design (improvement in functionalnot perform satisfactorily in any given year. The situations), non-Federal funding is required to fundoutput from this risk analysis is used in the the project. It also may happen that a replacementprobabilistic life-cycle cost analysis. One way to is reliability-driven, Federally funded, and there isgraphically represent the probabilistic life-cycle cost increased output which is primarily incidental to themodel is with event trees. A discussion of event reliability work.tree models is presented in Appendix E. Twomethods of probabilistic risk analysis are frequentlyused. The first method uses historical data and an 7. Risk Analysis Using Reliability Curvesevaluation of the condition of the equipment todetermine a statistical distribution of age at Historically, engineering judgment has been used toretirement. This method is characterized by the use predict remaining unit life and determine theof reliability curves. The second method is similar probability that the unit will perform unsatis-to that used in structural evaluations. It extends the factorily. The Corps has embarked on a program tosafety factor concept by using a probabilistic attempt to structure these predictions andapproach to determine a reliability index. The determinations. Methods of determining reliabilitymethod that is most appropriate depends upon the are well established for many types of physicaltype of equipment being evaluated and the specific properties. A useful way of expressing reliabilitysituation. for the Corps’ economic evaluations is the annual
and refurbishment are both considered as con-
for improvement (uprating), and obsolescence.
funded through reprogramming Operation and
determining whether there is a Federal interest in a

f(a) 'dD(a)
da' D(a)
H(a) 'd In D(a)
da' &
D (a)D(a)
ETL 1110-2-55030 May 97
5
probability that a piece of equipment will fail to surviving to age a in the first place. It is theperform satisfactorily. The following discussions probability that the failure occurs at age a. explain the terms and their applications used in thisprocess. b. The Corps is continuing to assemble a large
a. The following two functions are used in the reliability characteristics of various categories ofdevelopment of reliability curves. equipment. The initial work in this area focused on
(1) The reliability of equipment can be significant number of stator retirements in the formconsidered a continuous variable with a of rewinds (Ayyub, Kaminskiy, and Moser 1996),probability density function (pdf) of f. A pdf is a but a significant turbine database is also beingtheoretical model for the frequency distribution of a developed. The historical data include manypopulation of measurements. In this case regarding attributes such as year installed, age at failure, andreliability, the pdf is the rate of change of the rated capacity. Appendix F presents a review ofequipment dependability. Therefore, if the recent research in hydropower reliability analysis. dependability of the equipment at age a is defined The raw data are compiled and reduced into annualas: summaries of exposures and failures.
D(a) = P(A > a) c. The raw retirement data can be fitted using
where application of Iowa Curves developed in the 1930’s
A = age of the equipment at retirement then Iowa State College (Winfrey 1935). Other
and normal, exponential, log-normal, and Weibull. The
P(A > a) = probability that A > a (Ayyub, reliability functions. It has been shown that theKaminskiy, and Moser 1996) differences between the Iowa Curves and a Weibull
Then the pdf of D(a) is Weibull distribution is much easier to adapt to
This simply states that the dependability of a piece been to use the hazard function directly if theof equipment is equal to the probability that the condition of the specific equipment in question isequipment is still functioning at age a. considered average. If, however, the equipment has
(2) The hazard function H(a), or incremental deterioration, the hazard function has been adjustedfailure rate associated with the random variable A, to account for the evident higher probability ofis given by: failure. Similarly, the hazard function can be
That is, the incremental failure rate is equal to the functions.probability of the equipment life being age adivided by the probability of the equipment
database of equipment histories to establish the
generator stator windings because there have been a
any number of means. One method is the
by the Engineering Experiment Station at what was
distribution functions that may be used include
Weibull distribution is one of the most widely used
distribution are statistically insignificant. The
computer analysis techniques. Research to developnew and more refined reliability functionscontinues.
d. The practice in Corps evaluation reports has
exhibited signs of premature or accelerated
modified to account for lower failure probabilitiesfor equipment that is in better condition thanaverage. Contact the Hydroelectric Design Center(HDC) for the current details on modifying hazard

ETL 1110-2-55030 May 97
6
Figure 1. Generator stator windings. Number ofunits performing satisfactorily versus years inservice
Figure 2. Generator stator windings. Reliabilitycurve
Figure 3. Generator stator windings. Weibulldistribution
Figure 4. Generator stator windings. Hazardfunction from Weibull distribution
e. Figure 1 is a plot of generator raw datashowing the number of units performingsatisfactorily given years in service or age. Figure 2shows these data plotted as a reliability curve, withpercent in service as the ordinate. Figures 3 and 4then show these data fitted to a Weibull curve andthe resultant hazard function, respectively.
f. The factor being used by the Corps to fair to good. The best prediction of thisevaluate equipment condition and modify the equipment’s reliability is the statistical baselinefrequency curve data is the condition indicator (CI). data of similar equipment. Therefore, there is noCondition indicator evaluation methods have been cause to adjust the baseline frequency curve fordeveloped by the Corps for many types of equipment that falls into this category. Equipmentequipment and structures (USACE 1993). CI’s are with a CI below 40 is considered to be in poor
a screening tool which provides a uniform methodof evaluating condition through testing and inspec-tions. Inspection and test data are gathered andcondition index numbers assigned for each unit inaccordance with the latest guidance. Equipmentwith CI values from 70 to 100 is considered to be invery good to excellent condition. CI values in thisrange, when applied to the survivor curve, will tendto show increased reliability. Equipment with CIvalues in the midrange, from 40 to 69, is considered
condition or worse. CI values below 40 will tend to

ETL 1110-2-55030 May 97
7
increase the probability of failure and the baseline equipment can then be estimated by approximatingfrequency curve is adjusted. It is important to note the distribution of factor of safety as log-normal. that the methodology to be used in applying CI's to Mlaker (1993) and Mlaker and Bryant (1994)the reliability analysis is continuing to be devel- present technical details of this approach, alongoped. Current guidance should be sought by with an example. Their work is summarized incontacting HDC. Appendix F.
8. Risk Analysis Using Capacity and 9. RecommendationsDemand
This method of determining the dependability ofequipment uses a statistical approach towarddetermining both the demands placed on theequipment and its ability to handle those demands. This method is an adaptation of the structuralreliability assessment methods described inETL 1110-2-532. In this procedure, limiting statesof hydropower equipment performance are writtenas a factor of safety equal to the quotient of thecapacity and demand. The variables describing thiscapacity and demand are considered random, andestimates of means and standard deviations aremade based upon experience. Estimates of themean and standard deviation of the factor of safetyare then made using a Taylor Series Finite Difference procedure. The reliability index of the
It is recommended that the procedures containedherein be used as guidance toward assessing thereliability of hydropower equipment. This ETLshould be utilized in a team effort involvingOperations, Engineering, Planning, Project Management, and the HDC to contribute to theevaluation of rehabilitation or upgrade alternatives.
10. Additional Information
Much of the work that is covered by this ETL is stillunder development. The latest information can beobtained from the HDC in Portland, OR, telephone(503) 808-4225. Also, worldwide web sites con-taining information relating to the hydroelectricpower industry are listed in Appendix G.
FOR THE COMMANDER:
7 Appendices STEVEN L. STOCKTON, P.E.APP A - References Chief, Engineering DivisionAPP B - Reliability Study Process Directorate of Civil WorksAPP C - Example Problem Description APP D - Hydroelectric Power Benefits CalculationsAPP E - Economic Models APP F - Review of Recent Research in Hydropower Reliability AnalysisAPP G - Worldwide Web Sites

ETL 1110-2-55030 May 97
A-1
Appendix AReferences
A-1. Required Publications
ER 1105-2-100Guidance for Conducting Civil Works PlanningStudies
ER 1130-2-500Partners in Support (Work Management Policies)
EP 1130-2-500Partners in Support (Work Management Guidanceand Procedures)
EC 5-1-50Corps-wide Centers of Expertise
EC 11-2-172Annual Program and Budget Request for CivilWorks Activities
ETL 1110-2-321Reliability Assessment of Navigation Structures—Stability of Existing Gravity Structures
ETL 1110-2-532Reliability Assessment of Navigation Structures
Ayyub, Kaminskiy, and Moser 1996.Ayyub, B. M., Kaminskiy, M. P., and Moser, D. A. 1996. Reliability Analysis and Assessment ofHydropower Equipment. Technical Report forContract USDA-CSRS-95-COOP-2-1792. USACE Institute for Water Resources, Alexandria,VA.
Mlaker 1993Mlaker, P. F. 1993. Reliability of HydropowerEquipment. Study performed for U.S. ArmyEngineer Waterways Experiment Station, Vicks-burg, MS, by JAYCOR Structures Division. Finalreport to Contract DACW39-93-0073.
Mlaker and Bryant 1994Mlaker, P. F., and Bryant, L. M. 1994. TurbineReliability. Final report to Contract DACAW39-94-C-0101 for U.S. Army Engineer WaterwaysExperiment Station, Vicksburg, MS.
USACE 1993U.S. Army Corps of Engineers. 1993. ConditionRating Procedures/Condition Indicator for Hydro-power Equipment, REMR Management Systems;Hydropower Facilities. Washington, DC.
USACE 1995U.S. Army Corps of Engineers, Portland District,Hydroelectric Design Center. 1995. EvaluationReport for Major Rehabilitation of Main GeneratingUnits 1-14 at The Dalles Powerhouse. Portland,OR.
USACE HDC 1996U.S. Army Corps of Engineers HydroelectricDesign Center. 1996. Turbine Technical Reportfor Buford Major Rehabilitation Study. Portland,OR.
A-2. Related Publications
EPRI 1982Electric Power Research Institute. 1982. IncreasedEfficiency of Hydroelectric Power. ReportEM-2407.
EPRI 1984Electric Power Research Institute. 1984. Hydropower Feasibility Study. Report EM-3435.
EPRI 1986Electric Power Research Institute. 1986. Inspec-tion and Performance Evaluation of Dams: AGuide for Managers, Engineers, and Operators. Report AP-4714.

ETL 1110-2-55030 May 97
A-2
EPRI 1989 Moser, Males, Walsh, Grayman, andElectric Power Research Institute. 1989. Hydro-power Plant Modernization Guide. Report GS- Moser, D., Males, R., Walsh, M., Grayman, W., and6419. Strus, C. 1995. “The Use of Object-Oriented
EPRI 1992Electric Power Research Institute. 1992. Relia- International Conference on Hydropower,bility Centered Maintenance (RCM) Technical San Francisco, California, July 1995. Vol. 2,Handbook. Vol. 1 and 2. Report TR-100320. pp 1087-1096. American Society of Civil Engi-
EPRI 1994Electric Power Research Institute. 1994. Relia-bility Centered Maintenance Implementation in Newell, V. A., Tanner, D. T., and Wagner, C. D. the Nuclear Power Industry: Guidelines for 1995. “Hiwassee Dam Rehabilitation to CombatSuccessful RCM Implementation. Report Concrete Growth.” In Proceedings of the Inter-TR-103590. national Conference on Hydropower,
Kahl 1995Kahl, T. L. 1995. “Steel Penstock Rehabilitation neers, New York.Strategies.” In Proceedings of the InternationalConference on Hydropower, San Francisco,California, July 1995. Vol. 2, pp 1019-1038. Niznik, J. A., and Conner, G. C. 1995. “FeasibilityAmerican Society of Civil Engineers, New York. Studies to Rehabilitate TVA’s Chickamauga
Knight 1971Knight, F. H. 1971. Risk, Uncertainty, and Profit. Conference on Hydropower, San Francisco,University of Chicago Press, Phoenix Books. California, July 1995. Vol. 2, pp 1041-1050. Originally published in 1921. American Society of Civil Engineers, New York.
Laurence 1991 Norlin, Allen, Campbell, Frey, Joy, Pierce,Laurence, H. 1991. “Engineering Risk Assessmentfor Hydro Facilities.” In Proceedings of the Norlin, J. A., Allen, D., Campbell, D. J., Frey, M.,International Conference on Hydropower, Denver, Joy, J., Pierce, M., Raisanan, D. C., Vaughn, R., andColorado, July 1991. Vol. 2, pp 1238-1247. Woodward, G. 1993. Condition RatingAmerican Society of Civil Engineers, New York. Procedures/Condition Indicator for Hydropower
Leemis 1995Leemis, M. L. 1995. Reliability; ProbabilisticModels and Statistical Methods. Prentice-Hall,Inc., Englewood Cliffs, NJ. Pacific Engineering Corporation (PEC). 1995.
Moser 1991Moser, D. 1991. “Risk Analysis Applications for Hydroelectric Facilities in North America. PECDam Safety.” In Proceedings of the International Project Number 47508, Portland, OR.Conference on Hydropower, Denver, Colorado,July 1991. Vol. 2, pp 1255-1264. AmericanSociety of Civil Engineers, New York.
Strus 1995
Monte Carlo Simulation to Analyze HydropowerRehabilitation Proposals.” In Proceedings of the
neers, New York.
Newell, Tanner, and Wagner 1995
San Francisco, California, July 1995. Vol. 2,pp 1051-1058. American Society of Civil Engi-
Niznik and Conner 1995
Navigation Facility Due to the Effects of ConcreteGrowth.” In Proceedings of the International
Raisanin, Vaughn, and Woodward 1993
Equipment. U.S. Army Corps of Engineers,Washington, D.C.
PEC 1995
DRAFT - Current Applications of Risk Analysisand Risk Analysis Methodologies Applied to

ETL 1110-2-55030 May 97
A-3
Prakash and Sherlock 1991 Vo, Blackburn, Casazza, Khaleel, Markowski,Prakash, A., and Sherlock, P. 1991. “Evaluation ofRehabilitation Alternatives for Small Hydropower Vo, T. V., Blackburn, T. R., Casazza, L. O.,Plants.” In Proceedings of the International Khaleel, M. A., Markowski, F. J., Mitts, T. M., andConference on Hydropower, Denver, Colorado, Phan, H. K. 1995b. Frequency Analysis inJuly 1991. Vol. 3, pp 1884-1893. American Support of Risk Assessment for Non-routineSociety of Civil Engineers, New York. Closure/Shutdown of Hydroelectric Generating
Russell, Feather, and Randolph 1995Russell, C. S., Feather, T. D., and Randolph, M. 1995. Improvement of Operations and Manage-ment Techniques: Hydropower Quadrant Proto- Winfrey, R. 1935. Statistical Analysis oftype. Planning and Management Consultants, Ltd., Industrial Property Retirements. EngineeringCarbondale, IL. Research Institute, Iowa State University. Revised
Russell, Feather, Randolph, Langowski,Ventikos, and Pettit 1993Russell, C. S., Feather, T. D., Randolph, M.,Langowski, J. F., Ventikos, P., and Pettit, E. M. 1993. QUADRANT: Incremental AnalysisMethodology for Prioritizing O & M Projects(Locks and Dams). Planning and ManagementConsultants, Ltd., Carbondale, IL.
Vo, Blackburn, Casazza, Khaleel, Markowski,Mitts, and Phan 1995aVo, T. V., Blackburn, T. R., Casazza, L. O.,Khaleel, M. A., Markowski, F. J., Mitts, T. M., andPhan, H. K. 1995a. Risk Assessment for Non-Routine Closure/Shutdown of HydroelectricGenerating Stations: Phase I Report - Collectionand Analysis of Plant Failure Data. PNL-10547,Pacific Northwest Laboratory, Richland, WA.
Mitts, and Phan 1995b
Stations. PNL-XXXX, Pacific Northwest Lab-oratory, Richland, WA.
Winfrey 1935
1967 by Harold A. Cowles. Originally publishedin Bulletin 125 of the Iowa Engineering ExperimentStation.

ETL 1110-2-55030 May 97
B-1
Appendix BReliability Study Process
B-1. A reliability analysis of hydropower plantequipment requires the following three basic steps:(a) data collection and investigations; (b) identi-fication of specific reliability issues; and (c) cal-culations and evaluation. Figures B-1 and B-2show the basic steps in a reliability study and thetypical hydropower equipment analyzed forreliability.
a. The data collection and investigations needto be extensive and cover all aspects of theequipment design, use, history, and future demands.This step should include historical unit availabilityand operation, any equipment derating, accidentreports, operation and maintenance records,equipment performance tests (original, interim, andcurrent), periodic inspection reports, design andconstruction reports, the operation and maintenancemanual, and turbine model test reports. During thisstep it is also important to identify the priorities andconcerns of the project personnel and utilizeengineering judgment in evaluating equipmentcondition. A thorough site investigation should beconducted by hydropower technical experts andshould include equipment inspections and projectpersonnel interviews.
b. The data should then be compiled and theprimary equipment weaknesses and projectconcerns identified. The equipment condition maybe quantified with the Condition Indicator (CI)value as defined in the REMR Condition RatingProcedures (USACE 1993). In addition to the CIvalue, the equipment operation, demands, andmaintenance practices should be considered inevaluating the reliability. Experience and historicaldata of like equipment should be utilized in thedetermination of the equipment condition and futurereliability.
c. Once the condition of the equipment hasbeen identified, the calculations and evaluation
should be performed. For equipment with extensivelife databases, such as generators and turbines,standard time-dependent reliability and hazardfunctions should be used. These functions are underdevelopment by Institute for Water Resources(IWR) and HDC. Any of the weaknesses andconcerns identified in the previous steps should befully explained and addressed separately if required.
B-2. There may clearly be a failure history ofspecific equipment which warrants a reliabilityanalysis separate from the remainder of theequipment. The generators at The Dallespowerhouse demonstrated a specific failure mode(coil failure from turn-to-turn faults) and a severedecline in reliability after fifteen years of age. Weibull curves were developed for the generatorssince the historical data of the fourteen units, forwhich there had been thirteen coil failures,constituted a sufficient database (USACE 1995). Specific equipment curves can be developed byadjusting the standard equipment curves if theequipment demonstrates accelerated degradation,such as was found at the Buford powerhouse. Areliability study of the Buford turbines found thatthe condition of the main unit turbines was typicalfor their age, but the station service unit showedsevere degradation (USACE 1996). Therefore, itwas reasonable to use the standard reliability andhazard functions for the main units and adjust thesefunctions to reflect the poor state of the stationservice unit. If the equipment has a specificreliability problem but lacks a statisticallysignificant base of data, a capacity versus demandanalysis may be done. This approach was appro-priate for the reliability analysis of the Walter F.George powerhouse. The turbines were found tohave two areas which warranted further assessment,the shaft sleeve and hub, so JAYCOR was con-tracted to provide a full report (Mlaker and Bryant1994).
B-3. To obtain the most current time-dependentreliability research results, contact the HDC.

ETL 1110-2-55030 May 97
B-2
Fig
ure
B-1
. G
ener
al p
roce
ss f
or
eval
uat
ing
hyd
rop
ow
er e
qu
ipm
ent
relia
bili
ty

ETL 1110-2-55030 May 97
B-3
Fig
ure
B-2
. T
ypic
al h
ydro
po
wer
eq
uip
men
t an
alyz
ed f
or
relia
bili
ty

ETL 1110-2-55030 May 97
C-1
Appendix CExample Problem Description
C-1. In order to discuss the engineering reliabilityanalysis, the hydroelectric power benefits analysis,and the economic modeling process, a briefoverview of an example rehabilitation project iswarranted.
C-2. The “Chapman Hydroelectric Power Project”consists of a single powerhouse with four Francisturbines that were placed into service beginning in1947. The total rated capacity is 200 megawatts(MW). There are two three-phase generator step-uptransformers, each serving two generating units. The plant is a storage project located in thesoutheast portion of the United States. There is arelatively small variation in lake elevation due toseasonal flows and the need for flood protection. The storage in the lake is very large in relation tothe flow in the river. Therefore, all of the flow intothe lake either evaporates or passes through theturbines for power production. The plant factor is25 percent.
C-3. Problems include turbine runner cracking,severe cavitation damage, generator coil degrada-tion, and deterioration of the generator step-uptransformers. Over the past 10 years, the turbinerunners have exhibited increased cracking. On threeseparate occasions, pieces of the buckets havebroken off. An enhanced maintenance program wasinstituted. This program, which includes morefrequent inspections and welding repair, hasprevented further breakage. However, cracking andcavitation damage continue to increase at anaccelerated rate. Deterioration of coil insulation hascaused coil failures in three of the four generators inthe last two years. Spare generator coils are notavailable, and there is no spare transformer. Unsatisfactory performance of either the generatoror turbine runner will cause a unit outage. Unsatisfactory performance of a transformer willcause an outage of two units. Field testing hasshown that the units have experienced an efficiencyloss from their original condition. Average unitavailability has also deteriorated from 95 percent10 years ago, to 93 percent 5 years ago, and to88 percent this year.

ETL 1110-2-55030 May 97
D-1
Appendix DHydroelectric Power BenefitsCalculations
D-1. General
Traditionally, the economic feasibility of a hydro-electric project is determined by comparing the costof the hydroelectric project to the cost of the mostlikely thermal alternative. In other words, is thecost of constructing and operating a hydroelectricproject less than the cost of obtaining the powerfrom the thermal power plant(s) that would be themost likely source of that power if the hydroelectricplant were not built?
D-2. Energy vs. Capacity Benefits
The following two parameters define hydroelectricproject output: energy (the total amount of genera-tion in a given time period, expressed in megawatt-hours (MWh)); and capacity (the maximum amountof power that can be delivered at any given moment,expressed in megawatts (MW)).
a. Energy benefits are measured by the cost ofproducing an equivalent amount of generation in thepower system with the hydroelectric plant replacedby the most likely thermal alternative. The energybenefits represent the variable costs associated withproducing the alternative thermal generation, whichare primarily fuel costs.
b. Capacity benefits are measured as the costof constructing an equivalent amount of thermalpower plant capacity. The capacity benefits repre-sent the capital costs and other fixed costs asso-ciated with the most likely thermal alternative.
D-3. Gain in Output Resulting fromRehabilitation Projects
The Chapter 3 of the ER 1130-2-500 establishesthe policy for major rehabilitation at completedCorps projects. The Chapter 3 of the EP 1130-2-500 established guidance for the preparation and
submission of Major Rehabilitation Projects Evaluation Reports for annual program and budget submissions. They should be consulted for the mostrecent policy on types of improvements that can bepursued under the Major Rehabilitation programand the basic assumptions for the economicanalysis. The following discusses the benefitcomputations for the various types ofimprovements.
a. The first step in estimating the benefits is todetermine the gain in power output that will berealized from the proposed rehabilitation plan. Rehabilitation measures can be grouped into fivecategories, based on the way in which they increasehydroelectric power project output:
(1) Those which restore lost efficiency.
(2) Those which restore lost capacity.
(3) Those which restore lost availability.
(4) Those which increase the remaining servicelife (reduce the probability of retirement).
(5) Those which increase a plant’s operatingflexibility.
b. Replacing the worn turbine runners is ameasure that restores lost efficiency. The primarybenefit of this type of rehabilitation is increasedenergy production. Incidental increases inefficiency can also be included in the benefitscalculations. Increasing efficiency beyond that ofthe original equipment can be part of a rehabilita-tion project, but current guidance limits it to inci-dental or funded by non-Federal sources. ContactCECW-B for current policy regarding non-Federalfunding of generation improvements.
c. Rewinding the generators with state-of-the-art materials often permits the units to operateat higher output levels. This would be an exampleof a capacity-increasing measure. Current guidanceshould be consulted to determine to what extentincreased capacity can be funded under MajorRehabilitation funding. The incremental costs ofimproving generator capacity beyond the original

ETL 1110-2-55030 May 97
D-2
project level are often very small and can in many now matches more closely the maximum capabilitycases be supported under the Major Rehabilitation of the turbines.program.
d. Replacing runners and rewinding the gener- D-5. Duration Curveators will also improve the unit availability andincrease remaining service life. All of these benefits To graphically display the amount of energy thatshould be taken into consideration. could be gained from a rehabilitation measure, a
e. Replacing a Kaplan unit with an unreliable could be developed using historical records or out-blade adjustment mechanism can improve the unit’s put from a sequential streamflow routing modelresponse to changes in load and increase plant’s such as HEC-5.flexibility.
D-4. Example duration curve for the example plant for the avail-
The easiest way to describe the benefit evaluation existing condition of the plant. The duration curveprocess is to walk through an example of a typical in this case is based on weekly average streamflowrehabilitation project. The proposed plan for the data from a 60-year simulated operation study. fictional “Chapman”project includes replacing all Since this is a weekly average it does not reflect thefour worn turbine runners with new runners and effect of peaking operation. This would require anrewinding the generator stators (Appendix C). hourly generation-duration curve, which would have
a. It will be assumed that when the original operation at or near full output and less operationrunners were new, the units had an average overall at low output levels.efficiency of 87 percent, and tests have shown that,in their current condition, the overall efficiency has b. However, for purposes of estimating energydropped to 84 percent. With new runners, it is output, a curve based on average daily, weekly, orestimated that an average efficiency of 89 percent monthly output should be used rather than an hourlycould be achieved. However, the rated capacity of curve. The use of average values is necessary tothe turbines remains the same. measure the amount of energy that would otherwise
b. The rated capacity of the original generators implemented.was 50 MW. By rewinding the generator statorwith state-of-the-art materials, the rated capacity of c. The horizontal line at the top of the durationthe generators can be increased to 60 MW, which curve defines the maximum capacity of the plant,
generation-duration curve will be used. The curve
a. Table D-1 shows the output of the plant byunit, and Figure D-1 shows the annual generation-
able period of streamflow record based on the
the same area under the curve but would show more
be spilled if the rehabilitation measure were not
Table D-1Plant Output
Unit Unit Capacity Cumulative Capacity Unit Energy CumulativeMW MW MWh Energy, MWh
1 50 50 412,000 412,000
2 50 100 254,000 666,000
3 50 150 112,000 778,000
4 50 200 23,000 801,000

ETL 1110-2-55030 May 97
D-3
Figure D-1. Annual generation-duration curve
which in this case is 200 MW, the combined capac- Energy output with originality of the four existing generators. runners when new 828,000 MWh
Energy output with new runners 845,000 MWhD-6. Energy Gained by New Runners
Figure D-2 describes the gain in energy achieved byreplacing the worn existing turbine runners withnew state-of-the-art runners. The middle curveshows the output when the original runners werenew (overall efficiency of 87 percent), and the lowercurve shows the output with the original runners intheir existing, worn condition (overall efficiency of84 percent). The upper curve shows the output withnew state-of-the-art runners (overall efficiency of89 percent). The area between the upper andmiddle curve represents the gain in energy credit-able to the new runners. The upper and middlecurves were derived by applying efficiency adjust-ment factors to each of the points that were used toderive the existing case (Figure D-1) generation-duration curve. They could also be derived throughadditional simulation studies with a routing modelsuch as HEC-5.
Energy output with existing original runners 801,000 MWh
Gain in energy output 44,000 MWh
Note that the capacity of the existing generatorslimits output to a maximum of 200 MW. So, evenif the new runners had a somewhat greatermegawatt capability, it would not be possible totake advantage of that capability.
D-7. Energy Gained by New GeneratorWindings
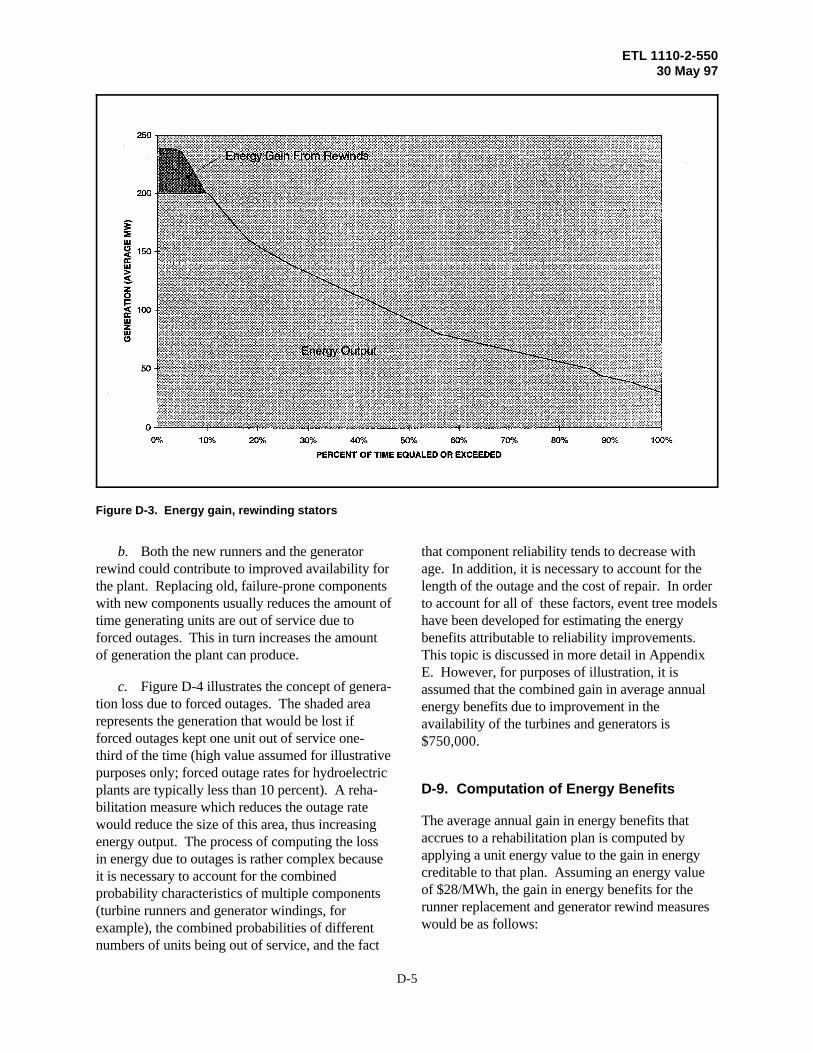
a. Figure D-3 describes the gain in energyachieved by rewinding the stators with state-of-the-art insulation materials. The new materials make it possible to place more copper in thewindings, which increases the capacity of thegenerators. In this example, it is assumed that the

ETL 1110-2-55030 May 97
D-4
Figure D-2. Energy gain, replacing runners
new runners are in place and the capacity of the curve on Figure D-2 rather than the upper curve. generators can be increased to match the full output The gain in energy for this scenario would beof the new runners. As a result, the capacity of the 4,000 MWh instead of 16,000 Mwh.plant is increased to (4 units × 60 MW) = 240 MW.
b. The upper limit (which truncates the D-8. Energy Gained by Improvedduration curve) is increased from 200 MW to Availability240 MW, so the generation-duration curve wasextended to the new upper limit. The upper hatched a. The major rehabilitation guidancearea on Figure D-3 defines the gain in energy output prescribes the approach to evaluating the unitrealized from adding a generator rewind to turbine availability. Major elements in this analysis are therunner replacement. assumptions that are used to define the base
Energy output with existing condition. The base condition assumes that the generators 845,000 MWh project will be operated in the most efficient mannerEnergy output with generator possible without the proposed rehabilitation. rewind 861,000 MWh Should the project experience unsatisfactoryGain in energy output 16,000 MWh performance (e.g., a hydroelectric power unit
Note that a gain in generation could also be realized available to fix the feature. The timing, frequency,by rewinding the generators but retaining the and consequences of system disruptions are allexisting turbines. The upper hatched area would be unknown and must be estimated for both the withsmaller, being defined by an extension of the lower and without project conditions.
condition, or the “without major rehabilitation”
outage), it is assumed that emergency funds will be
ETL 1110-2-55030 May 97
D-5
Figure D-3. Energy gain, rewinding stators
b. Both the new runners and the generator that component reliability tends to decrease withrewind could contribute to improved availability for age. In addition, it is necessary to account for thethe plant. Replacing old, failure-prone components length of the outage and the cost of repair. In orderwith new components usually reduces the amount of to account for all of these factors, event tree modelstime generating units are out of service due to have been developed for estimating the energyforced outages. This in turn increases the amount benefits attributable to reliability improvements. of generation the plant can produce. This topic is discussed in more detail in Appendix
assumed that the combined gain in average annualc. Figure D-4 illustrates the concept of genera-tion loss due to forced outages. The shaded arearepresents the generation that would be lost ifforced outages kept one unit out of service one-third of the time (high value assumed for illustrativepurposes only; forced outage rates for hydroelectricplants are typically less than 10 percent). A reha-bilitation measure which reduces the outage ratewould reduce the size of this area, thus increasingenergy output. The process of computing the lossin energy due to outages is rather complex becauseit is necessary to account for the combinedprobability characteristics of multiple components(turbine runners and generator windings, forexample), the combined probabilities of differentnumbers of units being out of service, and the fact
E. However, for purposes of illustration, it is
energy benefits due to improvement in theavailability of the turbines and generators is$750,000.
D-9. Computation of Energy Benefits
The average annual gain in energy benefits thataccrues to a rehabilitation plan is computed byapplying a unit energy value to the gain in energycreditable to that plan. Assuming an energy valueof $28/MWh, the gain in energy benefits for therunner replacement and generator rewind measureswould be as follows:

ETL 1110-2-55030 May 97
D-6
Figure D-4. Generation loss due to forced outages
Runner replacement benefits equivalent number of megawatts of thermal (44,000 MWh x $28/MWh) = $1,232,000 capacity. The different nature of power systems,Generator rewind benefits loads, and fuel costs throughout the nation requires (16,000 MWh x $28/MWh) = 448,000 site-specific evaluation for each major rehabilitationAvailability benefits = 750,000 study.Total energy benefits = $2,430,000
The unit energy values represent the energy cost D-10. Dependable Capacityassociated with producing the generation with themost likely thermal alternative or alternatives. The a. The dependable capacity of a hydroelectricenergy value of $28/MWh is based on the energy power plant is an estimate of the amount of thermalvalues provided from the Federal Energy generating capacity that would carry the sameRegulatory Commission (FERC) for coal-fired amount of peak load in a power system as thesteam, and gas-fired combustion turbines and hydroelectric power plant. It is intended to accountcombined cycle plants. The value is based on for the variables that affect the amount ofweighted national values by fuel source and hydroelectric power capacity that can be usedinclusion of estimated real fuel cost escalation. The effectively in the system load, including theenergy value is in terms of October 1995 price following:levels. The Corps usually develops these valuesusing a system production cost model, simulating (1) The variability in the maximum capacitythe operation of a particular power system twice: that a hydroelectric power plant can deliver causedonce with the hydroelectric plant in the system, and by variations in head.once with the hydroelectric plant replaced with an

ETL 1110-2-55030 May 97
D-7
(2) The variability in usable capacity caused by D-11. Dependable Capacity Gained by Newvariations in the availability of streamflow, which in Runnersturn causes variations in the amount of energy avail-able to support the capacity.
b. A variety of different techniques are used toestimate dependable capacity. The Corps presentlyuses the average availability method for projectswhich operate in thermal-based power systems andthe critical month method for projects inhydroelectric-based power systems.
c. For this example, the average availabilitymethod was used. Space does not permit a detaileddiscussion of the procedure, but, in brief, it involvescomputing the amount of capacity that can be sup-ported with the available energy for each week inthe peak demand months for each year in the hydroelectric period of record. The averagecapacity that can be supported over that perioddefines the project's dependable capacity.
d. Supportable capacity is defined as theamount of capacity that can be supported for aspecified number of hours per week. The number ofhours required varies from project to project andfrom system to system, depending on the systemresource mix and hourly load shape. A typicalexample might be 4 hours per day, 5 days per week(or 20 hours per week).
e. Some examples will illustrate this concept. Taking the 200-MW example project and using the20-hr/week criterion, assume that in a particularmonth, sufficient stream flow is available toproduce 5,000 MWh/week. Applying the 20-hrcriteria, (5,000 MWh)/(20 hr/week) = 250 MWcould theoretically be supported. However, theinstalled capacity of the plant is only 200 MW, sothe supportable capacity for that month is limited to200 MW. However, if the generators were rewoundto 240 MW, the supportable capacity wouldincrease to 240 MW. Assume that in anothermonth, 3,000 MWh/week can be generated. In thismonth, only (3,000 Mwh)/(20 hr/week) = 150 MWcan be supported, either with or without the rewind.
The amount of energy available in each week will beincreased due to the higher runner efficiency. Insome weeks, sufficient energy is already available tosupport the existing capacity. But in some of thelower flow weeks, this additional energy will permitmore capacity to be supported. The average gain incapacity over all of the peak demand weeks in theperiod of record defines the gain in dependablecapacity attributable to the new runners. Typically,this gain is relatively small for runner replacement,and for this example, the new runners increase thedependable capacity from 185 MW to 190 MW(compared with an installed capacity of 200 MW).
D-12. Dependable Capacity Gained byGenerator Rewind
The generator rewind increases the maximumcapacity of the plant. This in turn permits morecapacity to be supported in those weeks where moreenergy is available than is needed to support theexisting capacity. In the example case, if the gener-ator capacity is increased by 40 MW, the depend-able capacity increases from 190 MW to 226 MW(compared with the new installed capacity of240 MW).
D-13. Computation of Capacity Benefits
a. The average annual gain in capacity bene-fits that accrues to a rehabilitation plan is computedby applying a unit capacity value to the gain independable capacity creditable to that plan. Assum-ing a capacity value of $95/kW-year, the gain incapacity benefits for the runner replacement andrewind measures would be:
Runner replacement benefits (5,000 kW x $95/kW-year) = $ 475,000Generator rewind benefits (36,000 kW x $95/kW-year) = $3,420,000Total capacity benefits = $3,895,000
ETL 1110-2-55030 May 97
D-8
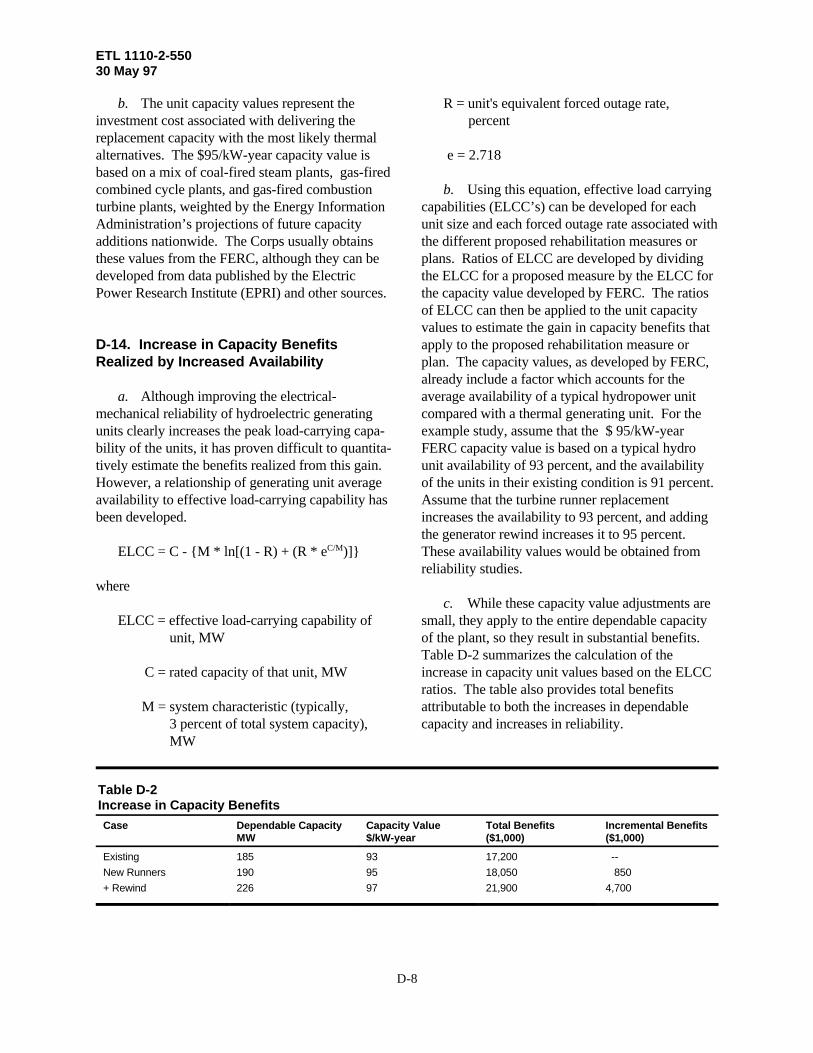
b. The unit capacity values represent the R = unit's equivalent forced outage rate,investment cost associated with delivering the percentreplacement capacity with the most likely thermalalternatives. The $95/kW-year capacity value is e = 2.718based on a mix of coal-fired steam plants, gas-firedcombined cycle plants, and gas-fired combustion b. Using this equation, effective load carryingturbine plants, weighted by the Energy Information capabilities (ELCC’s) can be developed for eachAdministration’s projections of future capacity unit size and each forced outage rate associated withadditions nationwide. The Corps usually obtains the different proposed rehabilitation measures orthese values from the FERC, although they can be plans. Ratios of ELCC are developed by dividingdeveloped from data published by the Electric the ELCC for a proposed measure by the ELCC forPower Research Institute (EPRI) and other sources. the capacity value developed by FERC. The ratios
D-14. Increase in Capacity Benefits apply to the proposed rehabilitation measure orRealized by Increased Availability plan. The capacity values, as developed by FERC,
a. Although improving the electrical- average availability of a typical hydropower unitmechanical reliability of hydroelectric generating compared with a thermal generating unit. For theunits clearly increases the peak load-carrying capa- example study, assume that the $ 95/kW-yearbility of the units, it has proven difficult to quantita- FERC capacity value is based on a typical hydrotively estimate the benefits realized from this gain. unit availability of 93 percent, and the availabilityHowever, a relationship of generating unit average of the units in their existing condition is 91 percent. availability to effective load-carrying capability has Assume that the turbine runner replacementbeen developed. increases the availability to 93 percent, and adding
ELCC = C - {M * ln[(1 - R) + (R * e )]} These availability values would be obtained fromC/M
where
ELCC = effective load-carrying capability of small, they apply to the entire dependable capacityunit, MW of the plant, so they result in substantial benefits.
C = rated capacity of that unit, MW increase in capacity unit values based on the ELCC
M = system characteristic (typically, attributable to both the increases in dependable3 percent of total system capacity), capacity and increases in reliability.MW
of ELCC can then be applied to the unit capacityvalues to estimate the gain in capacity benefits that
already include a factor which accounts for the
the generator rewind increases it to 95 percent.
reliability studies.
c. While these capacity value adjustments are
Table D-2 summarizes the calculation of the
ratios. The table also provides total benefits
Table D-2Increase in Capacity Benefits
Case Dependable Capacity Capacity Value Total Benefits Incremental Benefits MW $/kW-year ($1,000) ($1,000)
Existing 185 93 17,200 --
New Runners 190 95 18,050 850
+ Rewind 226 97 21,900 4,700

ETL 1110-2-55030 May 97
D-9
d. Subtracting out the previously calculated D-17. Total Gain in Benefitsbenefits for the gains in dependable capacity, thegain in capacity benefits as a result of improved The total annual power benefits attributable to thereliability is $375,000 ($850,000 - 475,000) for the combined runner replacement/stator rewind plannew runners alone, and $805,000 ($4,700,000 - would be as follows:3,895,000) for the combined plan of new runnersplus rewind. Energy benefits = $2,430,000
D-15. Benefits from Increasing RemainingService Life
The hydroelectric power benefits accruing fromreplacing equipment before it fails are limited to the a. Standard economic practice requires thatdifferences in unit outage times. A planned separable components of multi-component plans berehabilitation program will substantially reduce the incrementally justified on a last-added basis. Fortime that a unit is out of service when compared instance, the example rehabilitation plan includeswith waiting for a major equipment failure. two components. For the plan to be economically
D-16. Flexibility Benefits last-added basis. This assures that the plan with the
a. An additional area where benefits might benefits (i.e., benefits-costs) is identified, as calledaccrue to power plant rehabilitation is in the area of for in ER 1105-2-100. flexibility—the ability of a power plant to comeon-line quickly and to respond rapidly to changes in b. Last-added analysis refers to a comparisonload. An example might be a plant with aging of the incremental benefits gained by one compo-Kaplan units which have deteriorated to the point nent of a plan on a last-added basis, with the incre-where the turbine blade adjustment mechanism can mental costs of including that component in theno longer be operated reliably. In such cases, the plan. The last-added benefits for a component areblades may have to be welded in a fixed position so determined by deducting the benefits of a plan withthat they lose their ability to follow load. Rehabili- that component excluded from the benefits of thetating the units would restore this capability, and plan with all components included. Again referringthis in turn would generate some benefits which to the example, the last-added benefits of the gener-could be used to help support the investment in the ator rewind would be the benefits of the total planrehabilitation work. minus the benefits of runner replacement alone. A
b. Unfortunately, while it is widely agreed that incremental benefits of the runner replacement. flexibility benefits are an important hydroelectric Once incremental benefits are determined, they areproject output, it is difficult to quantify such compared to the incremental costs of including thebenefits. EPRI and others have done some work in component. If the incremental benefits exceed thethis area, but so far an accepted procedure for incremental costs, the component is justified on aquantifying flexibility benefits does not exist. last-added basis.However, if a proposed rehabilitation project doesimprove a project's flexibility, this should at least beaddressed qualitatively in the rehabilitation projectfeasibility report.
Capacity benefits = $4,700,000Total benefits = $7,130,000
D-18. Last-Added Test
feasible, both runner replacement and generatorrewind would have to be individually justified on a
highest net National Economic Development
similar process would be followed to determine the

ETL 1110-2-55030 May 97
D-10
D-19. Analysis Tools such as the Portland District and Mobile District,
Various computer analysis tools have been These models are conceptually described indeveloped to assist in the evaluation of Major Appendix E that follows. Assistance in evaluationRehabilitation and O&M repair projects. Examples of the potential project benefits can be receivedof these are Hydroelectric power-REPAIR and from the Power Branch (CENPD-ET-WP) of theHYDROELECTRIC POWER QUADRANT being North Pacific Division, which is the designateddeveloped through the Corps of Engineers Institute Corps-wide Mandatory Center of Expertise forof Water Resources (CERD-IWR-R). Life-cycle, Hydroelectric Power System - Economic Evaluationrisk models have been developed by other districts (EC 5-1-50).
for evaluation of Major Rehabilitation projects.

ETL 1110-2-55030 May 97
E-1
Appendix EEconomic Models (Event Trees)
E-1. General
Engineering reliability analysis coupled withtraditional engineering judgment offers a moreeffective and objective way of identifying futureevents and consequences than engineering judgmentalone. Detailed economic studies including risk anduncertainty analysis provide decision makers with amore comprehensive picture of the range and like-lihood of the economic consequences of any par-ticular project proposal. This appendix providesguidance for the use of event trees and incorporatingengineering reliability and hydropower benefitsstudies in the economic analysis of major rehabilita-tion projects.
E-2. Event Trees
An event tree is simply a diagram of the potentialevents and outcomes that could occur to a givencomponent or group of components in one timeperiod or in subsequent time periods.
a. Event tree diagrams are used to identifypossible occurrences of satisfactory or unsatisfac-tory performance and their consequences, givenspecific events. For example, a mechanical/electrical component such as a turbine runner or agenerator, during any time period, may be fullyoperational, out of service from a prior period, orexhibiting unsatisfactory performance.
b. These possible events or branches of thetree identify all of the pathways that may occurduring each time period. The event tree is devel-oped for each component to be evaluated for eachtime period of the analysis.
c. The consequences of each pathway are alsoidentified. The consequences may consist ofchanges in system hydropower generation costs dueto unit outages or changes in unit generatingefficiencies, increases or decreases in operation and
maintenance costs, or changes in repair orreplacement costs.
d. The event tree also facilitates coordinationof the engineering reliability analysis with theeconomic evaluation. In the Corps' planning frame-work, the event tree assists in developing a cleardefinition of the without-project condition. Formajor rehabilitation studies, the without-projectcondition is a description and evaluation of theconsequences that are expected to occur during theperiod of analysis in the absence of rehabilitation.Use of event trees requires planners (and projectengineers) to graphically depict what is expected tohappen to various components in any given timeperiod. This process helps clarify critical elementsand possible solutions. It highlights any apparentdata gaps and serves as a road map for building theeconomic spreadsheet model.
E-3. The Economic Model
In its most simplistic form, the economic model thatis developed for a major rehabilitation analysiscould be described as a basic accounting spread-sheet. In its final evolution it can span many mega-bytes of computer disk space and devour hundredsof hours of computer time. The Institute for WaterResources (IWR) has developed, and is continuingto improve, a PC-based program that will handle theeconomic modeling requirements much faster andeasier than using spreadsheet-based software. Thebasic spreadsheet model is described below becauseit is relatively easily understood.
a. The spreadsheet model is first created tomirror the single unit event tree diagram for thewithout-project condition. This incorporates boththe physical and economic consequences of possibleevents and the engineering reliability analysis foreach component. A Monte Carlo simulation pro-cedure is used to calculate variance and expectedvalues.
b. Monte Carlo simulation is a process inwhich random numbers are generated from a rangeof possible values, usually between zero and one,

ETL 1110-2-55030 May 97
F-1
Appendix FReview of Recent Research inHydropower Reliability Analysis
F-1. Introduction
This appendix presents a summary of recentresearch related to hydropower reliability analysisthat may be useful in conducting maintenance andrehabilitation studies.
F-2. Reliability Analysis of HydroelectricPower Equipment
a. In this study an assessment method of thetime-dependent reliability and hazard functions ofhydropower equipment is developed (Ayyub et al.1996). Life data of equipment can be classified intoseveral types. For hydropower equipment, completedata or right censored data are commonly encoun-tered. The 1993 inventory of generators as pro-vided by the Corps includes records of failure andreplacement. A preliminary examination of theserecords revealed that the average age at failure is28 years. Also, the average age of equipment basedon this 1993 inventory is 24 years. Generators weregrouped by plant-on-line date and power into12 groups. The life data of generators within eachgroup were analyzed. Survivorship functions weredeveloped, and models based on nonlinear numeri-cal curve fitting using an exponential function witha second-order polynomial tail were proposed. Early-life special models and late-life prediction(extrapolation) models were also developed. Theeffect of manufacturer on generator reliability wasinvestigated. It can be concluded that the differ-ences between the survivorship values of the Gen-eral Electric Corp. and the Westinghouse Corp.generators are, in general, statistically insignificant.
b. The above-mentioned reliability and hazardfunctions can be viewed as marginal functions thatdo not account for the particular condition of a pieceof equipment, but they provide average or genericresults for a group or stratum. In the practical useof hazard functions in investment decision analysis,a generic function might not be sufficient for a
particular piece of equipment. Hence, the genericfunction needs to be modified by conditioning on aparticular piece of equipment, resulting in a modi-fied hazard function. By conditioning on a particu-lar piece of equipment, the physical or performancecondition of the equipment is introduced as a factorfor modifying the generic function. The Corpsmaintains information on test results of a particularpiece of equipment that are aggregated to obtain acondition index. The test results and the conditionindex are needed to perform this modification.
c. Once a generic hazard function and acondition index are obtained for a particular pieceof equipment, they can be combined to obtain themodified hazard function using Bayesian tech-niques. Reliability functions were developed forgroups of generators that were defined by the dateof having the plant on line and the power rating ofthe generators. The resulting reliability functionsare called herein the group reliability functions. These reliability functions can be used as priorinformation in the Bayesian techniques to obtainplant-specific reliability functions by utilizing newplant information on generator failures or censoringto obtain plant reliability functions as posteriorreliability functions. Alternately, plant reliabilityfunctions can be developed using the same methodsthat were used for the groups to obtain prior plantreliability functions. Then, new plant informationon generator failures or censoring can be utilized toobtain updated plant reliability functions as poste-rior reliability functions. These two cases have thecommon objective of obtaining plant-specific relia-bility functions and updating these functions usingnew life or censoring data. Then, a method is pre-sented to obtain a unit (i.e., generator) specificreliability function based on a plant (or group)reliability function based on obtaining eithercensoring information or the condition index of theunit. Examples were used to demonstrate the use ofthese methods.
d. The suggested methods in this study weredemonstrated using hydropower generators. Othersimilar hydropower equipment types can be treatedusing similar methods.

ETL 1110-2-55030 May 97
F-2
F-3. Repair, Evaluation, Maintenance and the past was made by collecting data on the currentRehabilitation (REMR) Program condition of equipment. This collection process, if
a. The REMR research program is a 13-year, history data and could then be used to develop$67M research effort undertaken from 1984 failure rate and reliability data. The Hydroelectricthrough 1997. The objective of the program was to Power Equipment Condition Indicators programidentify and develop effective and affordable was developed as the methodology used to collecttechnology for maintaining and extending the equipment condition data (Norlin et al. 1993). Thisservice life of civil works structures. REMR program established a measure of equipmentproducts are useful in both major rehabilitation and condition called the condition index with an associ-nonroutine maintenance studies. The paragraphs ated REMR Condition Index (CI) scale (seebelow summarize some of the REMR products that Table F-1) which may be a key step in thehave been used in reliability studies (U.S. Army development of a reliability centered nonroutineCorps of Engineers 1993). maintenance program. The program also developed
b. The REMR Management System is a CI for (1) generator stators, (2) excitation systems,computer-based system for managing REMR (3) circuit breakers, (4) main power transformers,activities. It is designed as a planning tool and an (5) powerhouse automation systems, (6) turbines,information system for project-level management. (7) thrust bearings, (8) governor systems, (9) cranesIt establishes procedures to inspect and evaluate the and wire rope gate hoists, (10) hydraulic actuatorconditions of civil work structures, provides data systems, (11) emergency closure gates, andmanagement capabilities, and facilitates some (12) power penstocks. economic analysis of maintenance alternatives. TheREMR Management System was designed to help d. The CI for a piece of equipment is deter-prioritize REMR activities based on equipment mined by evaluating a “condition indicator” whichcondition, select maintenance alternatives based on consists of standard tests or visual or other non-performance, and compare the costs of maintenance destructive examinations. The CI for a componentalternatives. or system ranges from 0 to 100, where 0 index
c. Any decision which determines how to deteriorated condition, and an index of 100 indi-allocate rehabilitation dollars should be based on cates the component/system is in new condition.reliability data. An attempt to collect these data in
continued over time, could be used to develop life
the methodology used to objectively determine the
indicates the component/system is in completely
Table F-1REMR Condition Index Scale
Zone Condition Index Condition Description Recommended Action
1 85 to 100 Excellent: No noticeable defects. Immediate action is not required.
2
3
70 to 84 Very Good: Only minor deterioration or defects are evident.
55 to 69
40 to 54 Fair: Moderate deterioration. Function is still adequate. determine appropriate action.
25 to 39
10 to 24 Very Poor: Extensive deterioration. Safety evaluation is recommended.
0 to 9 Failed: No longer functions. General failure of a major structural
Some aging or wear may be visible.
Good: Some deterioration or defects are evident, but function isnot significantly affected. alternatives is recommended to
Poor: Serious deterioration of at least some portions of thestructure. determine the need for repair,Function is inadequate. rehabilitation, or reconstruction.
Barely functional.
component.
Economic analysis of repair
Detailed evaluation is required to

ETL 1110-2-55030 May 97
F-3
e. The CI does provide objective information were estimated. The statistics of this evaluationabout the current condition of the equipment, but it showed that there is no significant differenceis difficult to determine a failure rate from a CI. In between the condition indices for the stator in theaddition to the CI value, there are other meas- two different conditions. Based on this evaluation,urements (such as hours of usage, severity of it is concluded that the CI would not improve theusage, routine maintenance practices, and reliability information given by historical data formanufacturer) that are important in accurately the 15 units examined. The CI estimations weredetermining service life and predicting failure rates. based on only 4 of the 13 tests needed to fully
F-4. Reliability of Hydroelectric Power improve the reliability estimates.Equipment Study
A reliability study of hydroelectric power equipmentwas conducted by JAYCOR at the request of the (1) For equipment lacking a statisticallyCOE (Mlakar 1993). In this study, a Weibull significant base of data, a capacity and demanddistribution was fitted to survivor data to produce formulation can be used to estimate reliability. Thefailure rate estimates of generator stators. A reliability of the previous section can be used toBayesian analysis with the COE condition indices estimate the reliability of an item if statisticallywas performed. The results suggest that the CIs significant data exist. For most hydroelectric powercontribute little additional reliability information. equipment, these data do not exist. In these cases,For equipment lacking a statistically significant the reliability can be estimated using probabilisticbase of data, a capacity and demand formulation techniques to describe deterministic designwas used to estimate reliability. parameters.
a. Survivor Data Analysis. (2) In summary, the proximity to a limiting
(1) In this study, a survivor curve presents the safety, F. This measure is defined as the ratio ofpercentage of units in a given group which are capacity to resist, C, to the applied demand, D, andsurviving as a function of the age in service. The is also a function of a set of variables, Xi describingsurvivor curve can be represented by the reliability the components geometry, material, and boundaryfunction of probability theory which describes the conditions. Typically the logarithm of the randomprobability of satisfactory performance as a func- variable (F) is considered, and the reliability indextion of age. The Weibull distribution was used to (b) is defined as the ratio of the mean and standarddescribe the reliability distribution. The charac- deviation of ln(F). The reliability index representsteristic age and shape parameters were found for a the number of standard deviations from the limitingdata set by performing an algebraic transformation state to the mean. Generally, the mean and standardto the data and fitting the transformed data with a deviation of the ln(F) are not known but informationline. The scale and shape parameters were found may be known about the means and standardfrom the slope and intercept of the line. Once these deviations of the Xi variables. If so, the mean andparameters are known, the associated hazard standard deviation of the ln(F) can be approximatedfunction can be obtained. This hazard function using a Taylor Series Finite Difference estimation. provides the failure probability as a function of age Finally, the reliability index can be used to estimatefor the component. the reliability by assuming that ln(F) is normally
(2) To investigate the accuracy of the CI to distribution function. This formulation can be usedpredict whether a component is “sat” or “unsat,” to estimate the reliability as a function ofCIs for 15 units in a known satisfactory condition component age, R(t), because as a component agesand 3 units in a known unsatisfactory condition the underlying variables Xi change. Having
determine the CI. Had all tests been performed, theresults may have shown that the CI could be used to
b. Capacity and Demand Analysis.
state of performance is quantified as the factor of
distributed in which F(b) is the cumulative normal

ETL 1110-2-55030 May 97
F-4
estimated R(t), the hazard function can be derived (Russell et al. 1995). The HYD-QUADand the failure rate as a function of age can be development is based on the NAV-QUAD workfound. (Russell et al. 1993). The purpose of the HYD-
(3) The methodology used to conduct this part assist Corps managers in allocating maintenanceof the study was excellent but the results are funds. The project develops and uses an analyticalexpected to have larger uncertainties associated process based on economics to make maintenancewith them. Additionally, the method is generally investment decisions. HYD-QUAD is generallymore difficult to apply especially when considering applicable to maintenance items that are not athe age effects of random variables. A capacity and baseline budget item, have a cost greater thandemand formulation could be used, but fitting $100,000 and less than $5,000,000, and have anhistorical survivor data with a probility density impact on the probability of plant outage. function (e.g., Weibull or log-normal distribution) ispreferable. b. For a given project or facility, the HYD-
F-5. Turbine Reliability leads to a maintenance project ranked on economic
JAYCOR prepared this report which documents the using the existing NAV-QUAD model, a literaturedevelopment of quantitative measures for the review, interviews with field professionals,reliability of turbine features using capacity and workshops, and focus group meetings. Generally,demand analysis (Mlaker and Bryant 1994). The the HYD-QUAD methodology was developedresults can be used in economic models which around the following four steps:optimally allocate limited resources for projectrehabilitation. The second report section introduces Step 1 - Determine the current condition of thegeneral approaches to reliability estimation that are facility for which maintenance is being consideredused in the study. In the third section, deterministic using the CI method developed under the REMRmodels for three modes of unsatisfactory perform- program (Norlin et al. 1993). The CIs for eachance of the turbine hub are described. In section component/system are combined to produce anfour, a probabilistic-based, reliability formulation is overall indicator of the facility condition, called aexplained for application to these three models of summary condition index (SI). This SI value isunsatisfactory performance. The resulting obtained by taking a weighted average of each ofprobabilistic models are then applied to turbine unit the components that comprise the unit or facility. number 3 at the Walter F. George Power Plant. In These weighting factors were determined bythe fifth and closing section of the report, averaging 38 estimates made by hydroelectricobservations about the reliability of these features power managers. Each manager was asked toof hydropower equipment are summarized and distribute 100 points among the components/recommendations are made for broadly applying the systems of the facility or unit. Hydroelectricmethod to Corps hydropower projects. equipment included in the initial evaluation are
F-6. Hydroelectric Power QuadrantPrototype
a. The QUADRANT model for hydroelectricpower (HYD-QUAD) is being developedspecifically for field use on nonroutine main-tenance studies to support project budget decisions
QUAD is to develop a program that can be used to
QUAD framework evaluates an initial maintenancecondition, impact on maintenance condition, and
impact. The HYD-QUAD model was developed
generator, transformer, circuit breaker, governor,and voltage regulator.
Step 2 - Each proposed maintenance alternativeis listed and the associated change in SI is estimatedto produce a “change in SI.” Information on currentunit or facility condition and the expected improve-ment on condition is provided by districts orprojects.

ETL 1110-2-55030 May 97
F-5
Step 3 - Given the baseline SI and improved SI, d. The process described above could beoutage frequency and duration are calculated as a improved by determining the weighting factors in afunction of SI. A simple arithmetic weighting more objective fashion. For example, the weightingscheme was used to estimate the SI for a unit. factors could be determined through a fault treeEstimates of frequency and duration of outages as a analysis technique that would interrelate the variousfunction of SI were developed through opinions of systems/components and rank them based on thefive hydroelectric power experts. This outage risk associated with a failure of the system/information was collected by distributing a series of component. Systems/components with higher riskworksheets to hydroelectric power experts. The to the facility would be assigned a higher weightingworksheets collected judgments of outage fre- factor based on the relative magnitudes of the risks.quency and duration for units with SIs of 90, 80,60, and 40. Respondents were asked to estimate the e. Estimates of frequency and duration of25, 50, 75, and 99 percentile probabilities at each SI outages as a function of SI were developed throughlevel. Five respondents successfully executed the opinions of only five hydroelectric power experts. exercise and their estimates were used to develop Historical data were either not available or not used. frequency SI and duration SI functions to estimate This process is critical to the accuracy of the overalloutage frequency and duration given an SI. Finally, QUADRANT process but is based on the samplingthis information was converted into an estimated of only five experts. This process should becost. improved or at the very least the number of experts
Step 4 - The difference in costs with and associated with expert opinion. Although the SIwithout the proposed maintenance are compared to does provide useful information, it may not bedetermine the net benefit of performing the definitive enough to use alone in this analysis. maintenance. QUADRANT’s output includes costs There is no substitute for solid historical reliabilityand damages for all years, rankings, and cumulative data. Outage frequency should be based oninitial project costs. A PC version was developed historical reliability data, not SI values. The SIfor quantification. A dynamic programming values could be used to adjust the historicaltechnique was used to compare projects. reliability information (combined with failure rate
c. In addition to current unit condition and the actual piece of equipment under consideration.expected improved condition, HYD-QUAD inputincludes cost of outage (energy and capacity costs), f. Finally, the cost estimations are somewhatinterest rates, bowing factors, target SI, zero simplistic and should be improved. QUADRANTmaintenance age, years to horizon, and total cost of results only show highly summarized, cumulativework items. Input information is provided either by project costs. There is no consideration given tothe district or project office or HQUSACE. Other repair/construction costs of collateral damages thatintermediate input may include the energy value could occur from a given failure or the interest costsplant factor. The QUADRANT methodology is associated with construction costs.based on a CI adapted from the REMR program.Generally, the CI presents a “snapshot”representing the absolute condition of a piece of F-7. Risk Assessment for Nonroutineequipment regardless of its age or maintenance Closure/Shutdown of Hydroelectrichistory. CIs are received from the field and are Generating Stationsbased on testing, field observations, and inspectoropinion. The CIs are combined into an SI through a a. The Department of Energy Pacificsimple weighted average process of five systems. Northwest Lab under contract with the Corps isThe weighting factors were determined by an performing a reliability and risk analysis foropinion poll of 38 hydroelectric power managers. evaluating nonroutine turbine shutdown scenarios at
should be increased to reduce the uncertainties
data) to provide a better estimate of the reliability of

ETL 1110-2-55030 May 97
F-6
Columbia and Snake Rivers hydroelectric station Phase 2 - Probabilistic risk analysis techniquespowerhouses (Vo et al. 1995a,b). The purpose of and software were used to complete this phase. Thethe analysis is to evaluate the risks associated with postulated initiating events (loss-of-load, internalevents that would require a nonroutine shutdown at flooding upstream of the wicket gates, and internalhydroelectric stations and involve an inability to flooding downstream of the wicket gates) wereclose the intake gates within the time normally modeled in event trees. Systems required toallotted to close. The Corps guidance for rapid respond to these events were modeled in fault trees. closure of the intake gate is the 10-minute closure The fault tree component failure rate informationrule which requires intake gates to be capable of was taken from the Phase 1 database. The modelclosure within 10 minutes in the case of a flooding accounted for the minimum time that a componentor overspeed event. The ability to meet the could operate, the minimum time that a component10-minute closure rule is questionable for could fail, and time-based recovery actions. Inhydroelectric stations that have their intake gates addition, the model accounted for the different plantremoved or raised from the original design position. conditions which exist in the field (i.e., differencesThe intake gates at some hydroelectric stations on in design, operations, etc.). This latter featurethe Columbia and Snake Rivers have been removed allowed 48 different field conditions to be modeled. or raised to improve fish guidance. The results of this phase were “frequency profiles.”
b. This project provides a general prob- a potentially damaging event versus time afterabilistic risk assessment (PRA) for hydroelectric initiation (e.g., frequency of having loss-of-loadstations. The results of the PRA are being conditions which last 5 minutes, 10 minutes,synthesized with an economic consequence analysis 15 minutes, etc.). At present the model onlyto produce results in terms of economic risk. handles the three events of concern for the project. Results of this study can be used for policy and Other events are possible/plausible which coulddecision making. This project was broken down have application to a rehabilitation evaluation. into four phases. A separate report was or will be Only systems and components required to mitigateissued for each phase. Each phase offers the events of concern were modeled. With theinformation and/or processes that individually could addition of new events, more system models andbe useful to rehabilitation evaluations. components could be required. The existing system
Phase 1 - This phase involved collection and above, the model can handle 48 major designanalysis of relevant hydroelectric power equipment features (based on governor type, intake gatefailure data. Reviews of failure data from generic design, emergency wicket gate closure, etc.). Thesources were conducted and data were collected selected design features were found to be adequatefrom a survey of hydroelectric stations and an for differentiating between possible plant responseexpert panel elicitation. For each component the to the events of concern. With the addition of newsources were combined using a Bayesian process. events, more design features may be required.The resulting failure rate values are generic for thecomponents over their expected life. Failure rate Phase 3 - Given an event occurring for afunctions (i.e., failure rate vs component age) were specific time, there is a certain probability thatnot developed. Failure rate functions would need damage of a certain level (a damage state) willto be developed to support both major maintenance occur. There is an economic cost associated withand rehabilitation programs. In addition, the each level of damage. Phase 3 collected informa-failure information for electrical components tion to (1) delineate the different damage states,generally came from nuclear related sources. (2) quantify the probability of entering a damageFurther research into the applicability and possible state given an event lasting a set time, anddevelopment of hydroelectric-specific electrical (3) estimating the cost associated with each damagecomponent failure rates could be warranted. state. This information was collected from a
These profiles reflect the frequency of remaining in
models may also require additional detail. As noted

ETL 1110-2-55030 May 97
F-7
combination of expert elicitation and deterministic F-7. Engineering and Design Reliabilityand probabilistic calculations. The above Assessment of Navigation Structuresinformation was combined to produce “economic (ETL 1110-2-532) and Stability of Existingconsequence curves.” These curves provide an Gravity Structures (ETL 1110-2-321)economic cost versus time in an event. Theeconomic consequence curves were then combined a. Engineer Technical Letter (ETL) 1110-2-with the frequency profiles from Phase 2 to produce 321 supplements ETL 1110-2-532 and providesan economic risk. This is a single value for each guidance for assessing the reliability of existingfield condition that reflects the dollars at risk for gravity structures founded on rock and establishingthat field condition. Comparisons between the an engineering basis for rehabilitation investmentdifferent field conditions were provided, as were decisions. ETL 1110-2-532 provides guidance forimportance values for the components from assessing the reliability of navigation structures andPhase 1. This latter information is useful for establishing an engineering basis for rehabilitationidentifying components important to risk. In investment decisions. The guidance provided byaddition, the importance values were evaluated to these ETLs is intended to provide (1) anpredict changes in risk to specific components. The engineering method for assessing the reliability ofrisk values and associated importances would have structural features based on their current condition;to be re-quantified for any model and/or data (2) a consistent uniform method for prioritizing thechanges as discussed in Phases 1 and 2, but the investments needed to restore or modernize projectsgeneral process should be applicable to which are approaching or have exceeded theirrehabilitation projects. A detailed uncertainty design life; and (3) an initial step in defining theanalysis was included in the Phase 3 analysis using detailed engineering studies needed to estimate thea Latin-Hypercube process and a Monte Carlo remaining service life of structural features.simulation. This process discerned the overalluncertainty associated with each of the intermediate b. The methodology in these ETL guidancesteps as well as for the final result (economic risk). documents uses reliability indices as a relativeThe uncertainty values would have to be measure of the current condition and provides arequantified for any model and/or data changes as qualitative estimate of the structural performance. discussed in Phases 1, 2, and 3, but the general Structures with relatively high reliability indices willprocess should be applicable to the rehabilitation be expected to perform their function well. projects. Structures with low reliability indices will be
Phase 4 - The results of Phase 3 will be used as rehabilitation problems. If the reliability indices areinput to the decision analysis in Phase 4. This very low, the structure may be classified as aanalysis will be based on various economic analyses hazard. Working from a sufficiently largesuch as cost-benefit ratios. The cost-benefit ratios experience base, it should be practical to make someand economic analysis of Phase 4 are composed estimates of expected structural performance withmainly of comparisons between designs and some engineering judgment. The reliability indicesproposed changes to designs. They are not will be calculated using the performance function,expected to concentrate on changes in individual capacity, divided by demand. The results of thecomponent reliability improvements. However, the reliability analyses may be used to identify deficientprocess could lend itself to modification for structures in need of stabilization and to prioritizerehabilitation studies. investment decisions. Target reliability indices that
expected to perform poorly and present major

ETL 1110-2-55030 May 97
F-8
may be used in evaluating and comparing structures c. EM-2407, Increased Efficiency ofare given in these ETLs. Hydroelectric Power (EPRI 1982), presents the
F-8. Electric Power Research Institute existing plants. The physical factors studiedStudies include the uprating of turbines and generators,
The Electric Power Research Institute (EPRI) has study concluded that excluding pumped storage,conducted/sponsored research in the hydroelectric there is a potential for a 17% increase in capacityarea and, specifically, in reliability, modernization, and approximately a 5% increase in energy fromand risk. Some of the research potentially relevant existing conventional plants.to reliability and or rehabilitation studies aredocumented in the following reports: d. AP-4714, Inspection and Performance
a. GS-6419, Hydropower Plant Modernization Engineers, and Operators (EPRI 1986), providesGuide (EPRI 1989) helps utility managers to project owners, managers, engineers, and operatorsevaluate, plan, and coordinate the modernization of with useful guidelines for dam inspection and forthe major plant components that extend plant life, monitoring and evaluating dam performance. Thisreduce power loss, increase availability, and boost guide was prepared to assist utilities in the design,power output. This guide provides information, operation, maintenance, and modernization ofmethodology and data for developing reasonable hydroelectric projects. The guide includesexpectations of new equipment. It demonstrates information on the concept and organization ofhow to synthesize these requirements into a inspection-evaluation programs as well ascomprehensive plant modernization plan. A second recommendations for establishing reportingvolume deals with turbine runner upgrading and procedures and developing communicationgenerator rewinding, and a third with plant channels.automation.
b. EM-3435, Hydropower Reliability Study Maintenance (RCM) Implementation in the Nuclear(EPRI 1984), develops recommendations for Power Industry: Guidelines for Successful RCMimproving the reliability and availability of Implementation (EPRI 1994), provides informationhydroelectric generation plants in the United States. which could be used to develop an RCM program. The two-part project used statistical analysis and a RCM programs help utilities optimize preventivefield survey as the basis for documenting historical maintenance efforts while improving plant safetyperformance and present-day practice in and economy through increased dependability ofhydroelectric generation. The project team selected plant components. This guide details the factorsthe North American Electric Reliability Council's that influence a positive outcome in an RCMGeneration Availability Data System (GADS) program and lists success criteria that can be useddatabase as its historical source. In addition, a by RCM program managers early in the process.multidisciplinary survey team used questionnairesto obtain information on component ratings, f. TR-100320, Reliability Centeredmaterials, manufacturers, O&M practices, failure Maintenance (RCM) Technical Handbook:modes and causes, and other issues from a Volumes 1 and 2 (EPRI 1992), provides referencerepresentative group of U.S. hydroelectric plants. material and technical guidance to support RCMProject personnel made recommendations for evaluations at electric utility power plants.improvements to GADS. Those modifications,along with greater utility participation, are expected g. EPRI has recently initiated a Reliabilityto produce a more complete and statistically Centered Maintenance program for hydroelectricsignificant database for future users. power application. In addition, EPRI has
results of a project that examined the potential forincreasing hydroelectric generation efficiency at
leakage control, and the use of flashboards. The
Evaluation of Dams: A Guide for Managers,
e. TR-103590, Reliability Centered

ETL 1110-2-55030 May 97
F-9
researched risk, engineering, and economic issues rehabilitating the Chickamauga Navigation Facility. associated with hydroelectric facilities. EM-3435 The paper describes the work involved in the four(EPRI 1984) includes statistical analysis of options and the estimated costs as well as some ofhistorical performance data from the GADS the advantages and disadvantages that aredatabase. The report recommended changes to the associated with each option. The paper does notGADS system. GS-6419 (EPRI 1989), EM-2407 address the issues of risk or reliability, and does not(EPRI 1982), and AP-4714 (EPRI 1986) all contain include details regarding the considerations includedvaluable information for evaluating dam and system in the economic assessment.performance and modernizing equipment. TR-103590 (EPRI 1994) and TR-100320 (EPRI 1992) (3) The paper, “Hiwassee Dam Rehabilitationboth deal with RCM. EPRI has other reports and to Combat Concrete Growth” (Newell et al. 1995),documents available on these and related topics. summarizes the deterministic analysis effort used toThe reports are available at no additional cost to evaluate alternatives and project the performance ofEPRI members, and at a nominal cost for these alternatives over time. The decision amongnonmembers. the rehabilitation alternatives considered was
F-9. Waterpower Conference Proceedings not described in the paper. The paper alsoof the International Conference on summarizes the construction effort involved inHydropower performing the rehabilitation project. The paper
a. The Proceedings of the International does not include details regarding the considerationsConference on Hydropower, San Francisco included in the economic assessment.California, July 1995, Volume 2 includes a fewpapers that describe various aspects and cases ofrehabilitation program implementation to dams,navigation locks, and hydroelectric power stations.
(1) The paper, “Steel Penstock RehabilitationStrategies” (Kahl 1995), describes three importantdeterministic design considerations that caninfluence alternatives for rehabilitation of oldersteel penstocks. The three design considerationsthat need to be addressed arise primarily frompotential changes in operation or use of thepenstock and/or changes in the rigor of analyticaltechniques. These considerations may justifyalterations from the original design that would beappropriate under the rehabilitation effort. Thepaper does not address issues of risk, reliability, oreconomic analysis of potential rehabilitationalternatives.
(2) The paper, “Feasibility Studies toRehabilitate TVA’s Chickamauga NavigationFacility Due to the Effects of Concrete Growth”(Niznik and Conner 1995), summarizes the fouralternatives considered by a multidiscipline team inevaluating the feasibility of options for
selected based on the output from this time-basedanalysis and associated economic analysis that was
does not address the issues of risk or reliability, and
(4) The paper, “The Use of Object-OrientedMonte Carlo Simulation to Analyze HydropowerRehabilitation Proposals” (Moser et al. 1995),describes the underlying concept of economic riskanalysis as prescribed for the major rehabilitationprogram. The development of a computer programto conduct the economic analysis of rehabilitationproposals is described. Of particular interest is thegraphical user interface that facilitates the entry ofeconomic and reliability data and allows the user todevelop and analyze many alternatives. Theguidance for major rehabilitation proposals requiresuse of a risk-based probabilistic analysis ofunsatisfactory performance and the resultanteconomic consequences. The HYDROPOWERREPAIR (Risk-Based Economic Program for theAnalysis of Investments for Rehabilitation) isdesigned to model the distribution of life-cycle costsassociated with the operation and maintenance of ahydroelectric power plant. The benefits of a majorrehabilitation are inferred from the reduction in theexpected life-cycle costs, both expenses andoperation costs, associated with the rehabilitation. Reduction in the expected life-cycle costs are due toreduction of the likelihood of unplanned outages,

ETL 1110-2-55030 May 97
F-10
reduction of the costs from unplanned outages, (1) The paper, “Engineering Risk Assessmentreduction of future O&M costs, and various for Hydro Facilities” (Laurence 1991), describes acombinations of these. The model provides a risk assessment which evaluates the risk in terms ofprobabilistic treatment of the hazard function dollars to hydroelectric facilities due to earthquake,(likelihood of unsatisfactory performance) and loss tsunami, flood, wind, and other natural perils. Thefunction (likelihood of costs accruing for the methodology included initially evaluating facilityvarious feature losses considered) that are based on design criteria to determine how well varioususe of historical data. The estimated costs from the systems and structures would hold up to theloss function incorporate the amount of excess catastrophe. Next, varying degrees of catastrophecapacity that may exist within the facility or system. severity were established and probabilities of eachMonte Carlo simulation techniques are used to catastrophe were estimated using historical/calculate the distribution of the life-cycle costs for meteorological data. Damages (in dollars) for eachthe facility considering the maintenance, repair, and catastrophe were estimated based on the designoperation cost categories as well as investment criteria of the structures/systems and the codes tocosts for all alternative rehabilitation strategies which the structures/systems were built. Finally,evaluated. the risk (in dollars) was calculated based on the
(5) This paper (Moser et al. 1995) describes damage consequences.the underlying concept of an economic risk analysisprescribed for the major rehabilitation program and (2) The paper, “Risk Analysis Applications forthe development of a computer program by the Dam Safety” (Moser 1991), presents the principlesInstitute for Water Resources for use in conducting and issues of risk analysis as they have evolved inthe economic analysis of rehabilitation proposals. the evaluation of dam safety improvements. TheThe paper describes the economic framework used paper also reviews some results of the Corps’ Damin the computer program for performing these Safety Research program in applying risk analysisanalyses as well as the approach for incorporating and risk-based methods to dam safety evaluations. probabilistic risk-based analysis into the computer This paper describes several risk-based methodsprogram through Monte Carlo simulation using that have been used to evaluate the effects on risk ofhistorical data. The paper also addresses the figure widening spillways and raising dams in an effort toof merit incorporated into the computer program for minimize the effects of floods. These discussionsassessing the rehabilitation alternatives and making include both economic costs as well as human liferehabilitation decisions. The user interface for this considerations.program is presented with an example application. This paper addresses implementation of risk, (3) The paper, “Evaluation of Rehabilitationreliability, and economic considerations that are Alternatives for Small Hydropower Plants”mandated for evaluations of rehabilitation options (Prakash and Sherlock 1991), describes methods forunder the major rehabilitation program. The comparative evaluation of alternative rehabilitationmethodology described is technically measures for aging small-scale hydroelectric powercomprehensive and should be considered the plants. The evaluation criteria include both dollar-standard for economic analyses. denominated and nondollar denominated impacts
b. The Proceedings of the International comparative evaluation is performed using aConference on Hydropower, Denver, Colorado, July combination of the delphi and fuzzy-set approaches. 1991, Volume 2, includes a few papers that In the delphi approach, a panel of experts determinedescribe various aspects or risk analysis uses in the the factors for comparative evaluation ofhydroelectric power industry and cases of rehabilitation alternatives, and assign weights torehabilitation program implementation to various each factor. Next, the experts score eachstations. alternative. The evaluation factors form the
probability of the catastrophe occurring and the
associated with different rehabilitation options. The

ETL 1110-2-55030 May 97
F-11
columns and the alternatives form the rows of the b. The literature search located 19 articles thatfuzzy-set evaluation matrix. The weight factors are contained subjects of interest to the project. Theseapplied to the alternative score through matrix articles were briefly summarized in the report. multiplication to determine the best alternative. Interviews were conducted with a cross-section of
F-10. Pacific Engineering Study on research and development (R&D) and academicHydroelectric Risk Analysis interests. The results of the interviews were
a. Pacific Engineering Corporation (PEC) presented a section describing its investigativeinvestigated the current status of risk analysis as findings. This section summarized where to findapplied to hydroelectric power generation the best sources of technical articles dealing withequipment and facilities (PEC 1995). Attention is probabilistic risk analysis.focused on the use of probabilistic methods topredict changes in equipment reliability and to c. Although this report does not provide anyprioritize and schedule predictive maintenance. The useful technical risk analysis information, it couldstudy consisted of a literature search using online be used to locate additional sources of risk analysiselectronic databases and phone interviews with publications.individuals familiar with risk managementtechniques in hydroelectric power applications.
individuals representing manufacturing interests, hydroelectric power plant owners and operators, and
summarized in the report. Finally, this report

ETL 1110-2-55030 May 97
E-2
with any number in the range having an equal g. For each alternative, the model must be ablelikelihood of occurrence. Each random value is to incorporate routine and nonroutine O&M costsinput into the spreadsheet, and the spreadsheet is for each component over the period of analysis.recalculated to arrive at an associated outcome. Each random trial or iteration of the spreadsheet h. The model must be able to account forrepresents an independent “what-if” game. By changes in generating unit efficiencies with variousgenerating hundreds, or in some cases, thousands of rehabilitation scenarios.“what-if” games, Monte Carlo sampling will gener-ate the input distribution and the entire range of i. The model must be able to incorporate thepotential outcomes. consequences of events and repair/rehabilitation
E-4. Model Requirements alternative produces different hydropower outputs,
Basic functional requirements are established forthe model. These requirements allow for flexibility j. The model must be able to accommodatein the analysis, incorporation of basic assumptions, other economic calculations such as present valua-and the ability to change parameters as needed. tion and amortization of costs and incorporation ofSome of these requirements are described below. interest during construction.
a. The model must accurately reflect thewithout-project condition. The without-project E-5. Model Operating Characteristicscondition establishes a base condition from whichall other alternatives are to be evaluated. a. For each alternative considered, the
b. The model must be flexible enough to engineering, operational, and economic conse-evaluate a full range of alternatives. Alternatives quences relative to the alternative. Monte Carloconsidered in the analysis often include: enhanced simulation techniques are incorporated into themaintenance, use of spare parts, a full array of spreadsheet. This approach uses random numberrehabilitation scenarios, and, subsequently, appro- generation to compute an expected result given apriate timing of any rehabilitation strategy. combination of probabilities and events. The
c. The model must distinguish between indi- the simulation and produces expected values andvidual operating components, and economic conse- variance. Each simulation should include a mini-quences of various alternatives, and the timing of mum of 300 iterations. Up to 5,000 iterations mayevents. need to be computed in some simulations.
d. The model must be able to incorporate b. Separate simulations are conducted for theincremental analysis of each unit and its separable without-project and for each alternative consideredcomponents. in the analysis. Simulations for the Chapman
e. The model must account for a project life rehabilitation of one to four turbines; rehabilitation(35 years is recommended) and for near-term events of one to four generators; rehabilitation of one orthat could impact future rehabilitation strategies. two transformers; and all reasonable combinations
f. The model must be able to incorporate the rehabilitation should also be evaluated. Anotherengineering reliability and risk and uncertainty alternative that should be considered is one thatanalysis for each time period and each functional uses an enhanced maintenance strategy. In manycomponent under evaluation. cases this may already be implemented in the
scenarios in terms of changes in hydropower systembenefits and alternative construction costs. Each
system benefits, and O&M costs.
spreadsheet is modified to simulate the specific
program sums the results of multiple iterations of
Powerhouse example (Appendix C) should include:
of these alternatives. The appropriate timing for

ETL 1110-2-55030 May 97
E-3
without-project condition. A spare parts alternative and the type of outage, the unit will either beshould also be considered where reasonable. repaired or rehabilitated. If the unit is repaired, thenIncremental analysis of the alternatives should be the probability of unsatisfactory performance inperformed to allow for optimization of the number each successive time period continues to increase. of components to be rehabilitated. If a unit is rehabilitated, then the probability of
c. This process permits consideration of the condition as the equipment is considered to bephysical condition of the individual components and restored.the potential sequencing of repairs.
d. Each simulated outage incorporates E-7. Types of Unsatisfactory Performanceconsequences, in the form of cost resulting fromincreased frequency of repair, increased mainte-nance effort, and having to resort to more expensivemeans of energy production (hydropower benefitscalculations).
E-6. Incorporation of Physical andEconomic Consequences
a. Several columns of the spreadsheet modelare needed to account for the engineering reliabilityanalysis. The engineering reliability analysisestablishes the probability of unsatisfactory per-formance for each component for current and futureconditions. This probability, over time, is insertedfor each year in the modeling sequence. Currentconditions and probabilities of unsatisfactoryperformance vary for each individual turbine,generator, and transformer.
b. Within each iteration, a random number isgenerated for each component in a given timeperiod. Based on the probability of unsatisfactoryperformance in that time period, the unit either incurs an outage or continues to operate. Forexample, if the probability of unsatisfactory perfor-mance for turbine unit number one in the year 1993is 2.19 percent, then any random number generatedbetween 0 and 1 that is less than 0.0219 will causean outage to occur; any number greater than 0.0219will indicate that the unit is still available for opera-tion. If the unit remains operational, then theprobability of unsatisfactory performance in thenext time period increases. A random number isgenerated for each successive time period, and theconsequences are recorded. Should a unit incur anoutage, depending on the alternative being modeled
unsatisfactory performance is returned to a new
a. The analysis can include multiple types ofunsatisfactory performance with different probabili-ties of occurrence. For example, in the Chapmanhydropower example, the first type could be consid-ered to be a catastrophic outage. For a generatorstator, this type of outage could occur if a signifi-cant number of coils failed, and a rewind was theonly possible repair. The second type of outage isless debilitating. This outage mode consists of arepairable coil failure.
b. For each type of unsatisfactory perfor-mance, outage times and costs for repair are com-puted. For the Chapman generators, a repairablecoil failure may cause an outage of 1 month at anestimated repair cost of $25,000. For a catastrophicoutage, the Chapman unit is estimated to be out ofservice for a period of 24 months at a repair cost of$1,500,000.
c. For each alternative considered, routineannual O&M costs are also estimated. Under exist-ing conditions, the Chapman turbine units aredewatered, inspected, and repaired once every6 months. If a unit is rehabilitated, inspections areassumed to decrease in frequency with a resultingreduction in O&M costs. The time associated withinspections and routine maintenance must also beaccounted for in each iteration.
d. Subsequent columns in the spreadsheet sumall unit outages for a given year. Subroutinesshould be incorporated in the model to preventdouble counting of outage time if two interrelatedcomponents are out concurrently. If the unit isconsidered to be out of service in excess of12 months, outage times must be carried over intothe next time period.

ETL 1110-2-55030 May 97
E-4
e. Additional columns are required to sum condition is modeled assuming that only three unitsO&M, repair, and rehabilitation costs for any given are available. Subsequent scenarios are runyear. Again, subroutines must be used to prevent removing a unit at a time until all four units aredouble counting of normal maintenance costs if the considered to be off-line. This process results inunit is considered to be out of service for an construction of a system production cost curveextended period of time. assuming a full range of unit availability in the
f. Columns must be added to the spreadsheet curve is then used in the economic model toto account for specific alternatives and conditions. quantify the production cost consequences of unitFor example, in an alternative that includes a availability for any potential combination ofplanned sequence of rehabilitation, if a unit outage randomly generated unit outages.occurs within a year of the planned rehabilitation,the unit would not be repaired or returned to service b. Additional production cost curves areprior to the rehabilitation. This would be the proper constructed to assist in modeling the alternativesequence of events assuming that it is more cost rehabilitation and repair scenarios. As units areeffective to leave the unit off-line than to return it to rehabilitated, unit efficiencies increase, hydropowerservice and then shut it down later for a permanent production increases, and system production costsrehabilitation. decrease.
g. Another column needs to account for c. Once all of the separate cost curves andwhether or not existing spare parts are available for previously described input values are established,a given unit. In any simulation, if a unit with spare the without-project and all of the with-projectparts experiences a catastrophic outage, the existing conditions are simulated. For each iteration of aspare parts should be assumed to be put into simulation, potential outages are generated; O&M,service. repair, and rehabilitation costs are calculated; and
E-8. Cost of Replacement Power - period of analysis are summed and described inHydropower Benefits present values terms. Net benefits are computed for
a. The without-project condition must first be benefits is recommended for implementation. modeled as discussed in Appendix D. This pro- Additional statistics are generated to describe theduces an annual system production cost assuming range and distribution of values for eachall four of the Chapman powerhouse units are avail- component.able for production. Next, the without-project
without-project condition. This production cost
system production costs are estimated. The eco-nomic consequences for each alternative over the
each alternative, and the plan that maximizes net

ETL 1110-2-55030 May 97
G-1
Appendix GWorldwide Web Sites
There is a significant amount of data on the world-wide web relating to the hydroelectric powerindustry. This appendix lists worldwide web sitesthat were found to contain information that could beuseful to reliability studies:
a. Institute of Electrical and ElectronicsEngineers (IEEE): http://www.ieee.org/
b. Electric Power Research Institute (EPRI): http://www.epriweb.com/
c. North American Electric Reliability Council(NERC): http://www.nerc.com/
d. Repair, Evaluation, Maintenance, andRehabilitation (REMR) Research Program: http://www.wes.army.mil/REMR/remr.html
e. U.S. Army Corps of Engineers,Hydroelectric Design Center (HDC):http://www.npd.usace.army.mil/hdc/