Embed Size (px)
Citation preview
Distribution of SMS deposits
Presentation to the
International Workshop for Students “Seafloor Mineral Resources: scientific, environmental, and
societal issues”
Helmholtz-Zentrum fur Ozeanforschung Kiel (GEOMAR)
March 18, 2013
by
Lawrence M. Cathles
Cornell University
http://www.eurekalert.org/images/kidsnews/FisherSMOKER.jpg

The Grand Challenge: To supply, indefinitely, the resources to bring 10.5 bn to an EU standard
UN Population Division 2100
10.5 bn
If not: • Large fraction of humanity has no future • No common future • Fighting over resources
The ocean is the key

Outline
The context
– Resources needed
– Resources available
– Why ocean special for resources
– How to assess resources in long term
Size and distribution of the SMS resource
Conclusions
– SMS only one example (U, Li, …)
– Must look to oceans and be positive and courageous
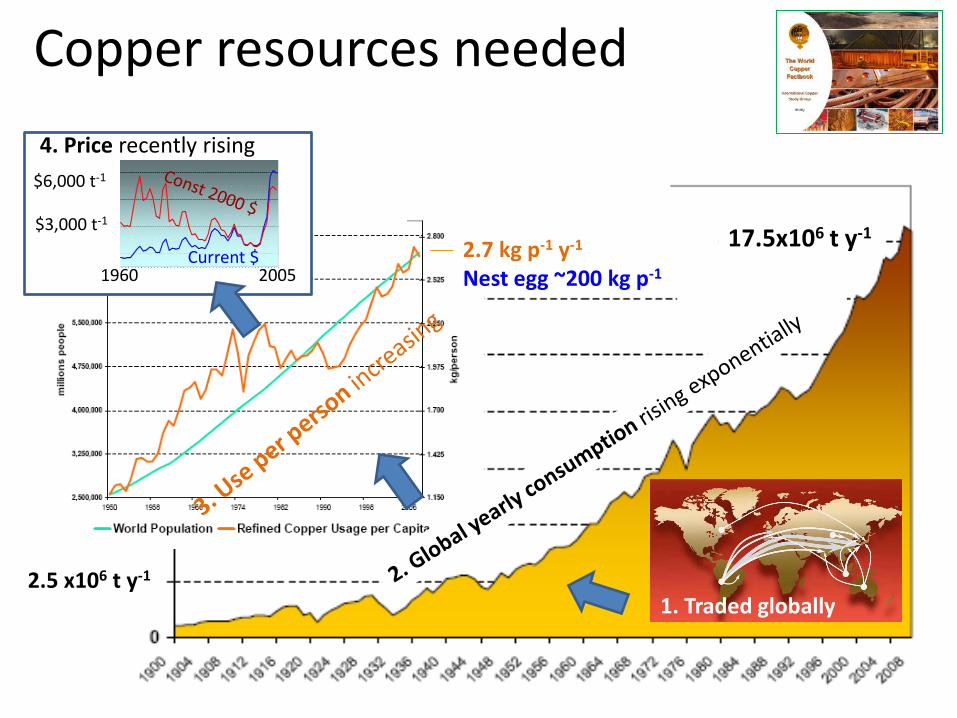
Copper resources needed
2.7 kg p-1 y-1
Nest egg ~200 kg p-1
17.5x10⁶ t y-1
1960 2005
$3,000 t-1
$6,000 t-1
Current $
4. Price recently rising
2.5 x10⁶ t y-1
1. Traded globally

Land Resources of 3 btCu
Cu
-1
Cu bt 1.2p t2.0pbillion 5.10
2.1 Bt
Century #1 #2
1.05 Bt
3.15 Bt cumulative
Land resources of 3 btCu
Gordon et al. (2005)
Similar story for Zn
Each person needs nest egg of 0.2 tCU
To bring 10.5 bn to EU standard of living in 100 years Requires: To maintain against 50% loss per century requires 1.05 btCu every 100 years thereafter
Land resources will last ~ 200 yrs

The ocean has 3 Planetary-scale Wagon Trains
Hydrologic Cycle
37,400 km3/yr w/ dissolved & particulates
wave sorting
500 km3/yr (cycle ocean in 2.6 Ma)
Mississippi = 550 km3/yr ~US water use
Hydrothermal Cycle
Haline 40 Sv*
1,260,000 km3/yr
*Sv=106 m3/s
+ a gold panning operation
Your yard
The little red wagon ore deposit model

The area of the ocean is huge The ocean is by far our biggest VMS district
Mars Moon
Steve Scott The ocean is special in terms of resources

How do you look at resources long term?
Rognar (1997)
Co
st p
er t
on
Resource [bt]
Res
ou
rce
Bas
e
technology
Technology keeps price ~constant until resource base exhausted Resource base = what can be conceivably produced

Estimating the SMS Cu Resource
1 kg magma
1 kg 350°C discharge
@ 215 ppm FeS2
3.5x10⁶ tFeS2 km-2
-2
350
7 m k10 .61 g
Potential VMS tonnage per m2 of seafloor
1 m
5.8
km
Mass = (5.8x10³ m3)(2800 kg m-3)=1.6x10⁷ kg m-2
1
2
3
350°C water

Scott (1997)
The ocean VMS resource
67.0
65.203.0
0.063522
0.065085106.1 7
kg350 m-2 µmMe kg mol-1 kgMe m-2
Zn Cu
Zn+Cu =3.32 kg m-2
Aocean = 3.6x10⁸ km2
ZnCu
Cu
Zn
bt 1200
bt 241
bt 954
CuZn
Cu
Zn
Ocean Resource = ~10 x land Cu resource of 3 mt
accum. eff.

½ SMS Cu Resource Sustains 10.5 bn for 112 centuries at EU standard
2.1 Bt
Century #1 #2 #3 #111 #112
1.05 Bt 1.05 Bt 1.05 Bt 1.05 Bt
3.05 4.1 119 120 Bt cumulative
… …
Land resources of 3 btCu
Oceans
Centuries of copper supply
from ocean
A path forward, SEG Newsletter #83, 2010
Same for Zn
… much longer if losses decreased

Confirmation of Narrow Melt Zone
4 km?
Seismic tomography at 9°30’N EPR
Dunn et al. (2000)
Off-axis smokers if width > 2x depth to top of axial mush zone
AMZ
Mineralium Deposita DOI 10.1007/s00126-010-0292-9

Confirmation of complete crustal cooling near ridge
0.5 ma
3.5 cm y-1 (1/2 rate)
7.2 cm y-1 ½ rate
71°2’ to 8°38’ EPR Extremely fast spr.
Galapagos
Retarded subsidence indicates cooling at ridge axis followed by re-heating at intermediate-, fast-, and extremely fast- spreading ridge segments
35 km
Cochran and Buck (2001)

Nakhl-Rustaq
Mantle
Gabbro
Wadi Al Abyad, Oman
White (300-400°C) veins at Moho “See” hydrothermal circulation to Moho in Oman and elsewhere
Nicholas and Boudoir

18O Profile reflects circulation to Moho
Cathles (1993)

Accumulation factor
• 3% at 21N on EPR (Converse et al., 1984)
• Compatible with mined VMS districts (Sangster, 1980)
• Gives observed deposit sizes at Matagami (Carr et al., 2009)
• Probably biologically controlled and increasing with time
• Slow, diffuse venting increases
• Silicate replacement extreme example (Galley et al, 1985)
… there is a lot of uncertainly in this parameter

The magmatic curve ball
Middle/small halo 600-300ºC hydroth cpx 0.5-5cm wide, 20 m long 0.2 to 2 m-1 frequency
Early/no halo >600ºC Ca-amphib w/ 5wt% Cl 0.5-5cm wide, 10 m long 0.2 TO 2 m-1 frequency
Schiffries and Skinner (1987)
Late stage <300ºC pren-pump-qtz 1 mm wide with wide alt halos <10 to >100 m-1 frequency
Closely spaced early stage
Ribbing
width-adjusting 350°C flow zone
Cathles (1993)
0.35→8 d 10%
3.4 m 180 m
Hydrothermal and magmatic systems intermingled
Magmatic fluids could source metals
Back-arcs could be special

SMS distribution and size
Topographic high
% black smokers = 0.004 (full spr rate [mm y-1])
Baker et al. (1996)
con
tinuous
or
ban
ds
of
VM
S d
eposi
ts
Spreading episodicity:
flapping of butterfly wing
Hydrothermal consequences of
spreading pulse reach seafloor
well after extrusive magmas
* (One 20 km transf spr event / 89,000 km ridge) 30 yrs = 130,000 yrs
every 100 ka
A question of distribution
and size but not amount

Less Environmental Impact
• Mobile infrastructure
• Surgically mine smaller deposits
• Greater safety
• Less environmental damage
• More equitable access
No acid mine drainage, tailings, old underground workings, surface disruption…
Nautilus Minerals (Smith presentations)

0.2
0.7
1
1.5
2
3
5
7
0.3
0.5
15
10
20
Pow
er c
on
sum
pti
on
[kW
p-1
] 15 TW
2008 Global Energy Consumption
2006 World average
EU Standard
Energy: The most essential resource Grand challenge requires 75 TW by 2100
Bangladesh and WWI 0.3 h p-1
10 kW p-1
14 horses

21 GtC = 109 tons carbon EJ = 1018 joules PAL = pre-industrial atmos level of C
EJ p
er y
ear
2300 EJ yr-1
Commodity Resource Base (PAL = 595 GtC)
Conventional Units Gtoe GtC/PAL
Gas 33,852 tcf 870 0.9
Oil 6066 Gboil 814 1.2
Coal 5041 metric tons 3400 6.6
TOTAL 5209 8.8
Fuel %RB
Gas [tcf] 50%
Oil [Gbbl] 59%
Coal [Gt] 15%
GtC/PAL 2.13
∆GtC/PAL -0.56 -1.22 SG = 46% LCF
B as U consumes ~50% of O&G resource base
= 10.5 bn x 7 kW p-1
SG LCF
Rogner’s Resource Base
Must move to low-C sources
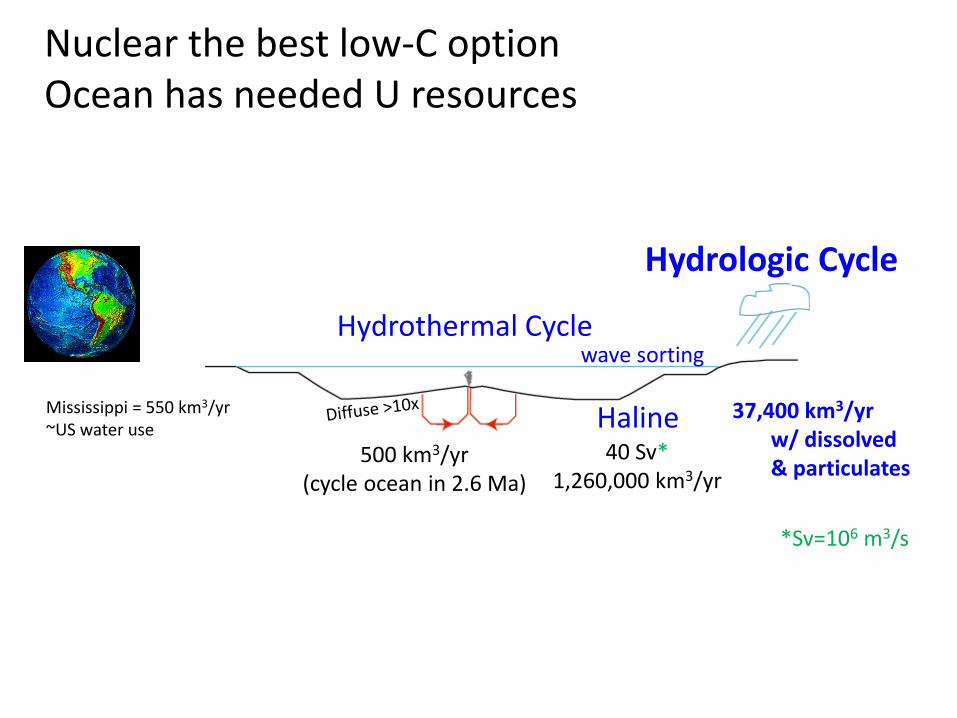
Nuclear the best low-C option Ocean has needed U resources
Hydrologic Cycle
37,400 km3/yr w/ dissolved & particulates
wave sorting
500 km3/yr (cycle ocean in 2.6 Ma)
Mississippi = 550 km3/yr ~US water use
Hydrothermal Cycle
Haline 40 Sv*
1,260,000 km3/yr
*Sv=106 m3/s

U3O8 (106 t) U (106 t)
Reserves 4.7 3.9
Resources 35 28.7
Dissolved in Ocean (3.3 ppb)
4600
J 102.2 tJ 107.81)3/2(ele toconv. 25.0 t t0071.0t103.2 231-
U
151-
UUU
9235235
centuries 94001yrs 94breeder
yrs 94s J 1075
J 102.2 supply
1-12
23
50% ocean resource
Assuming population steady at 10.5 bn
Does not count Th reactors Or that in a few centuries we will have fusion power
Oceans
Need breeder reactors
burned in reactor
The hydrologic cycle has accumulated a huge U resource in the oceans
Fuel is in oceans

24
Hydrologic Cycle
Hydrothermal Cycle
Haline 535,500 km3/yr
+1.8 m s-1
40 80 120 160 200 240 Km
1
2
3
4
5
0
Dep
th [
km]
Gulf Stream
counter flow
Cape Hatteras
Bro
wn
, 19
89
, Ocean
Circu
lation
, the O
pen
Un
iv. [6c]
0.35 t fabic recovered 1 kg U in 240d submersion (Seko et al., 2003) at $240/kg U (IAEA,
Uranium 2003)[8]
1
U
5
15
712
y t104.2100107.81166.00071.0
1015.31075
75 TW seconds per yr
235U/U conv to ele J/tonne 135U breeder
3.3 ppb U in seawater
(3.1x10⁶ )(3.3x10⁻⁹) = 0.01 tU m-2 y-1
0 ppb U
To supply 10.5 bn at 7 kW p-1 (EU std)
Current price $130/kg $52/lb U3O8
3.3 ppb U = 2.5x10⁵ tU y-1 Extraction piloted already
Nature will extract it for us

Ocean resources Dissolved
Salt Br Mg U (3 ppb) Li (170 ppb)
Placer Sand and gravel Diamonds Ti, Sn, Au, lime
Precipitated Phosphate Ferromanganese Crusts Mn Nodules SMS REE
Oil, Gas Hydrates
Diamond placers, Namibia
Mn Nodules 28% Mn 1.4% Ni 1.2% Cu 0.25% Co. Roger Hekinian
13°N EPR
San Francisco Bay sea salt Dow Mg Plant Feeeport, Tx
Shipboard recovery
Mn crusts, Jim Hein USGS 1% Co, Ni, Cu, Mo, PGE, REE, Zr,Te
largest marine mining (Indonesia)
MOR oxyhydroxide sediments
>1500 ppm REY
Mero (1969)

Must look to the oceans Accept grand challenge of 10.5 at EU std
Prepare to tap oceans wisely
Accept risks and manage them Solve problems don’t just raise them
If we do this the future will be very bright indeed … and we will learn a lot

References Anonymous, 1998, Phosphate Recovery, Journal of Phosphorous and Potassium, 217 (Sept-Oct),
http://www.nhm.ac.uk/research-curation/research/projects/phosphate-recovery/p&k217/steen.htm
Brown, J, et al., 1989, Ocean Circulation, The Open University, Pergamon Press, New York, 238p.
Cathles, L. M., 2010, A path forward, Views III, SEG Newsletter #83, October, p18-20.
Cathles LM, 2012, Assessing the greenhouse impact of natural gas, G3, vol 13(6), 18p., doi:10.1029/2012GC004032.
Gordon RB, Bertram M, and Graedel TE 2006, Metal stocks and sustainability: Proceedings of the National Academy of Sciences 103(5) p 1209-1234 www.pnas.org/cgi/doi/10.1073/pnas.0509498103
Harford, T., 2011, Why success always starts with failure- Adapt, Farrar, Straus and Giroux, New York, 309p.
Kesler, S, 2007, Mineral supply and Demand into the 21st Century, Proceedings, Workshop on Deposit Modeling, Mineral Resource Assessment, and Sustainable Development.
Lomborg, B., 2001, The skeptical environmentalist, Cambridge Univ. Press, Cambridge, 515p.
MacKay, J. C., 2009, Sustainable development without hot air, UIT Cambridge Ltd, Cambridge, 366p. (free online www.withouthotair.com )
Mero, J. L., 1964, The mineral resources of the sea, Elsevier, New York, 312p.
Paytan, A. and McLaughlin, K, 2007, The Ocean Phosphorous Cycle, Chem. Rev., 107, p563-576.
Rogner, H.H., 1997, An assessment of world hydrocarbon resources, Annu. Rev. Energy Environ., 22, p217-262
Tahil, W, 2007. The trouble with lithium, http://www.meridian-int-res.com/Projects/Lithium_Problem_2.pdf
Wellmer, F-R and Becker-Platen, D, 2007, Global nonfuel mineral resources and sustainability, Keynote Address, http://pubs.usgs.gov/circ/2007/1294/paper1.html