Embed Size (px)
Citation preview

The Journal of Neuroscience, February 1990, 70(2): 479-490
Distribution of a Putative Kainic Acid Receptor in the Frog Central Nervous System Determined with Monoclonal and Polyclonal Antibodies: Evidence for Synaptic and Extrasynaptic Localization
Claude J. Dechesne, Michael D. Oberdorfer, David R. Hampson, Kathryn D. Wheaton, Adil J. Nazarali, G. Goping, and Robert J. Wenthold
Neurochemistry Section, Laboratory of Molecular Otology, National Institute on Deafness and Other Communication Disorders, National Institutes of Health, Bethesda, Maryland 20892
A frog brain kainic acid receptor (KAR) was studied using monoclonal and polyclonal antibodies against the affinity- purified receptor. lmmunocytochemistry was done on sec- tions of the frog CNS, and the distribution of immunostaining was compared with the distribution of high- and low-affinity 3H-kainic acid (3H-KA) binding sites determined with in vitro receptor autoradiography. These studies showed (1) similar distributions of high- and low-affinity 3H-KA binding sites, (2) identical patterns of immunostaining with the polyclonal an- tibodies and 2 monoclonal antibodies, and (3) an antibody binding distribution which closely matched that of 3H-KA binding, suggesting that the antibodies recognize the pri- mary KAR in frog brain. In the frog brain, an anteroposterior gradient of immunostaining was observed, with the telen- cephalon intensely and uniformly immunoreactive. Other areas intensely immunoreactive included the cerebellum, the infundibulum, the tectal and posterior commissures, and the laminar nucleus of the torus semicircularis. The optic tectum showed selective staining of the plexiform layers 3 and 5- 7. The pattern of staining was punctate and appeared to be associated with nerve fibers, among them dendritic arbori- zations. Electron microscopic observations showed staining at the cytoplasmic side of postsynaptic membranes. Extra- synaptic staining was observed as patches on the surface of unmyelinated nerve processes.
Excitatory amino acids (EAA) are thought to be major neuro- transmitters with a widespread distribution in the vertebrate CNS. Electrophysiological studies, which provide the strongest evidence for such a role, have led to the identification of 3 major classes of EAA receptors named after the agonist which pref- erentially excites the receptor: kainate (KA), quisqualate, and N-methyl-D-aspartate receptors (Watkins and Evans, 198 1). Ra- dioligand binding studies to tissue homogenates have demon- strated binding sites that appear similar to these classes of re- ceptors. The tissue distribution of these binding sites has been determined with in vitro autoradiography in the CNS of several species, showing distinct patterns for each receptor type (Mon- aghan et al., 1983; Greenamyre et al., 1985). Although these experiments have given extensive information on the properties
Received May 31, 1989; revised July 12, 1989; accepted July 19, 1989. Correspondence should be addressed to Dr. R. J. Wenthold, Laboratory of
Molecular Otology, NIH, Bldg. 36, Rm. 5D08, Bethesda, MD 20892. Copyright 0 1990 Society for Neuroscience 0270-6474/90/100479-12$02.00/O
of EAA receptors, autoradiography lacks the resolution of im- munocytochemical techniques. Immunocytochemistry can be used to localize receptors at specific populations of synapses in addition to addressing questions such as the presynaptic, post- synaptic, or nonsynaptic localization of a receptor. For example, recent studies using selective antibodies have shown that the GABA, receptor is not limited to a postsynaptic localization (Richards et al., 1987) while the glycine receptor appears to be exclusively postsynaptic (Triller et al., 1985; Wenthold et al., 1988). The apparent widespread presence of EAA neurotrans- mitters in the CNS and the strong evidence implicating them in numerous neurological functions raises questions related to the localization of EAA postsynaptic receptors. EAA have lacked a specific immunocytochemical marker to identify neurons us- ing these neurotransmitters, and antibodies against EAA post- synaptic receptors offer a potentially selective approach for iden- tifying such neurons. Thus far, however, specific antibodies against EAA receptors have not been available.
Using domoic acid affinity chromatography, we have recently obtained a highly purified protein from frog brain that has phar- macological characteristics of a kainic acid receptor (KAR; Hampson and Wenthold, 1988). The purified protein migrates as a single broad band with an M, = 48,000 with SDS-poly- acrylamide gel electrophoresis and silver staining. Scatchard analysis showed that the purified protein contains high- and low-affinity binding sites for 3H-kainic acid (3H-KA) with dis- sociation constants similar to those obtained for binding to brain membrane fractions. Competition studies also showed that the purified binding sites are similar to the membrane-associated sites. The availability of this purified receptor provides an op- portunity to make selective polyclonal and monoclonal anti- bodies against a putative EAA receptor. In the present study, these antibodies were used to determine the distribution of a KAR in frog brain with light and electron microscopy.
Materials and Methods Antibodies. Production and characterization of polyclonal and mono- clonal antibodies have been described elsewhere (Hampson et al., 1989). Rabbits and Balb/C mice were injected with affinity-purified frog brain KAR for the production of polyclonal and monoclonal antibodies, re- spectively. These antibodies have been characterized by immunopre- cipitation and immunoblotting using frog brain proteins separated by SDS-PAGE. These analvses show the antibodies to be suecific for an IV, = 48,000 protein in frog brain which is not expressed;n frog heart, liver, or muscle. In this study, we used the monoclonal antibodies KAR- Al and KAR-Bl. While they both specifically recognize the KAR on immunoblots, KAR-Al immunoprecipitates detergent-solubilized KA

480 Dechesne et al. l Kainic Acid Receptor lmmunoreactivity in Frog Brain
CBL 1 OPT
AA I
Figure 1. Parasagittal section through the frog brain immunostained with a polyclonal anti-KA receptor antibody. There is a general anteroposterior gradient of staining. The telencephalon, the amygdalar area, the cerebellum, and the infundibulum have the highest density of staining. The olfactory bulb, superior layers of the optic tectum, nucleus isthmi, and ventral part of the brain stem display the lowest density of staining. Abbreviations used in the figures: AA, amygdalar area; ADN, anterodorsal nucleus of the mesencephalic tegmentum; AF, arcuate fibers; A VN, anteroventral nucleus of the mesencephalic tegmentum; CBL, cerebellum; DCT, dorsal commisssure of the tectum; DIN, dorsal infundibular nucleus; DN, dorsal nucleus (cochlear); EPN, entopeduncular nucleus; ZNF, infundibulum; ZPN, interpeduncular nucleus; MRF, medullary reticular formation; NI, nucleus isthmi; OC, optic chiasma; OL, olfactory lobe; OPT, optic tectum; OT, optic tract; PC, posterior commissure; PCTN, posterocentral thalamic nucleus; PLTN, posterolateral thalamic nucleus; RZN, reticular isthmic nucleus; SEP, septum; SGC, stratum griseum centrale of the tectum; SGS, stratum griseum superficiale of the tectum; SO, superior olive; TEL, telencephalon; THA, thalamus; TL, laminar nucleus of the torus semicircularis; TM, magnocellular nucleus of the torus semicircularis; TP, principal nucleus of the torus semicircularis; TS, torus semicircularis; VZN, ventral infundibular nucleus; VLTA, ventrolateral thalamic area; VN, ventral nucleus (vestibular).
binding activity from frog brain, while KAR-Bl recognizes only the denatured receptor. Like KAR-Al, the polyclonal antibody immuno- precipitates KA binding activity.
Zmmunocytochemistry. Adult frogs (Rana pipiens berlandieri, 1 SO- 200 gm, Carolina Biological Supply Co.) were used in this study. The frogs were anesthetized with 2% 3-amino benzoic acid ethyl ester in water (0.5 ml/100 pm). They were perfused through the truncus arter- iosus with 20 ml of 0.1 M phosphate buffer (pH 7.2) immediately fol- lowed by 50 ml cold 4% paraformaldehyde (either with 0.1% glutaral- dehyde, for electron microscopy, or without, for light microscopy) in
Figure 2. Immunostaining of the mesencephalon and optic tectum on co- ronal sections with the monoclonal an- tibodies KARAl (A) and KARBl (B). The patterns of immunoreactivity are identical. The same tectal layers are stained with both antibodies; the torus semicircularis is intensely immuno- reactive.
the same buffer. Brains and spinal cords were removed and postfixed for 1 hr in the same fixative at 4°C.
Zmmunocytochemistry for light microscopy. For frozen sections, brains were immersed overnight in 20% sucrose in PBS at 4°C. Brains were frozen in isopentane at - 50°C. Sagittal sections, 20 pm thick, were cut with a cryostat and thaw-mounted on gelatin-coated slides. For vibra- tome sectioning, brains and spinal cords were transferred after fixation to PBS, pH 7.2. Coronal sections, 50 pm thick, were cut and placed in PBS. Frozen and free-floating vibratome sections were preincubated for 15 min in 0.3% hydrogen peroxide in methanol for quenching of en-

The Journal of
dogenous peroxidase. Sections were incubated for 1 hr in blocking serum (10% normal goat serum in PBS, for a subsequent incubation with polyclonal antiserum or normal horse serum for monoclonal antibodies, with or without O.lOYo Triton X-100), and reacted with the primary antiserum overnight at 4°C and then for 2 hr at room temperature. The polyclonal antiserum was diluted l/1000 to 16000 in PBS plus 1% normal goat serum. The monoclonal antibodies, KAR-Al and KAR- B 1, were used as undiluted culture supematants. Subsequent steps were done following the procedure of Hsu et al. (198 1) using the avidin- biotin-peroxidase complex (ABC, Vector Laboratories, Burlingame CA). Each step was followed by 4 rinses for 10 min each in PBS. The per- oxidase activity was developed using 0.1% diaminobenzidine tetrahy- drochloride (DAB, Polysciences Inc.) and 0.02% hydrogen peroxide in 0.1 M Tris buffer, pH 7.2. Vibratome sections were rinsed in distilled water, mounted onto slides in a 1% gelatin, 25% alcohol solution in distilled water and dried for 2 hr. Cryostat and vibratome sections were cleared in xylene and coverslipped with Cytoseal 280 (Thomas Scien- tific). The specificity of the immunoreactions was determined (1) by substituting either a preimmune rabbit serum at the appropriate dilution for the anti-KAR serum or a culture medium for KAR-Al and KAR- B 1 and (2) by omitting the primary antibody. In these cases, no staining was found with light and electron microscopy.
February 1990, lO(2) 481
Figure 3. Comparison of distribution of KA receptor immunoreactivity (polyclonal antibody) (A) with high-af- finity (B) and low-affinity (C) KA bind- ing sites on coronal sections of the optic tectum and mesencephalon of the frog brain. D shows the corresponding atlas of the section. Repartition of KA re- ceptor in A-C corresponds very closely with highest density in the upper part of the torus semicircularis, mainly the laminar nucleus, and portion of the anterodorsal (ADiV) and anteroventral (A VN) nuclei of the mesencephalic teg- mentum.
Immunocytochemistry for electron microscopy. Free-floating vibra- tome sections were processed as described above omitting the prein- cubation step for quenching of endogenous peroxidase. After develop- ment of the substrate, sections were postfixed in 1% osmium tetroxide in PBS for 1 hr. They were dehydrated in alcohol and flat-embedded in Epon 8 12. Thin sections were obtained and examined using a Jeol 1 OOCXII electron microscope with or without counterstaining.
Autoradiography. Frogs were anesthetized as described for immu- nocytochemistry and decapitated. Receptor autoradiography was car- ried out using a modification of the method of Monaghan and Cotman (1982). The brains and spinal cords were rapidly removed and frozen in isopentane (-50°C). Coronal sections, 12 pm thick, were cut in a cryostat and thaw-mounted on acid-cleaned, gelatin-coated slides. The sections were quickly dried at room temperature and then preincubated in 2 changes of cold (4°C) 50 mM Tris citrate, pH 7.0 (20 min for each change), followed by a warm (37°C) incubation in the same buffer for 10 min. The slides were then immersed in Tris citrate buffer, pH 7.0 (4OC for 30 min) containing 8 nM 3H-KA for labeling h&h-affinity bind- ing sites or 80 nM ‘H-KA for labeling low-affinity binding sites. Non- specific binding was determined by including 100 PM unlabeled KA in the incubation buffer during incubation with the tritiated ligand and resulted in the absence of 3H-KA binding. At the end of the incubation

482 Dechesne et al. - Kainic Acid Receptor lmmunoreactivity in Frog Brain
Al 2
Figure 4. A, Comparison of the distribution of immunoreactivity with a polyclonal antibody against KA receptor (AI) and high-affinity KA binding sites (A2) on coronal sections of the telencephalon of the frog brain. Section (AI) is anterior to section (142). Total density of immunostaining is uniformly high throughout the section and corresponds to the high density of ‘H-KA binding sites. B, Distribution of KA receptor immunoreactivity (oolvclonal antibodv) in the dienceohalon of the frog brain (BI) and corresponding atlas of the coronal section (B2). All structures display relatively high immunoreactiky except the optic tract. -
period, the sections are rinsed quickly 3 times for 20 set each in cold buffer, blown dry with warm air, and exposed to tritium-sensitive film (LKB Ultrofilm) in light-tight cassettes. Exposure times ranged from 5- 9 d for low-affinity binding and 12-l 5 d for high-affinity binding at room temperature.
Results General distribution of immunostaining with monoclonal and polyclonal antibodies The polyclonal antisera and the 2 monoclonal antibodies used in this study (KAR-Al and KAR-Bl) gave indistinguishable patterns of immunostaining in all areas of the frog brain. The overall distribution of staining is depicted on a sagittal section treated with the polyclonal antiserum (Fig. 1). The presence of 0.1% glutaraldehyde in the fixative solution and/or Triton X- 100 in the blocking incubation medium did not modify the distri- bution and intensity of the immunostaining. Precise comparison of the labeling patterns obtained with the different antibodies was done for convenience on brain coronal sections containing the optic tectum because this structure has clearly defined layers. The immunoreactivity patterns obtained with the polyclonal antibody KAR-A 1 and KAR-B 1 were identical at the light level showing staining ofthe same layers and intense immunoreaction in the torus semicircularis (Fig. 2, A, B; 3A).
Comparison of immunostaining and KA binding site distribution The distribution of the antibody immunostaining and that of 3H-!LA binding sites determined with in vitro autoradiography were compared to determine if the immunostaining represented the major KA binding sites in frog brain. 3H-KA binding au- toradiography was done at 8 and 80 nM 3H-KA to label primarily
the high- and low-affinity sites, respectively. Since the B,,, for low-affinity sites is about 3 times that of high-affinity sites in frog brain, binding at 80 nM includes both high- and low-affinity sites, but most of the binding represents low-affinity sites. These studies showed that throughout the frog CNS (1) the binding done at 8 and 80 nM 3H-KA gave similar autoradiographic patterns (Figs. 3, B, C; 5, B, C, 6, A2, A3), and (2) the immuno- staining patterns with the polyclonal antibody and the mono- clonal antibodies were similar to the autoradiographic binding pattern (Figs. 2-6).
Immunostaining displayed a rostralxaudal gradient with the entire telencephalon intensely immunoreactive (Fig. 1). All the areas of the pallium and subpallium were intensely stained (Fig. 4A1) and displayed a homogeneous high density of KA binding sites (Fig. 4A2). In the diencephalon, a generally intense staining of all structures except the optic tract was seen (Fig. 4BI). The posterocentral and posterolateral thalamic nuclei showed la- beling in discrete layers. The dorsal and ventral infundibular nuclei were uniformly and strongly immunoreactive. The hy- pothalamus and the nucleus rotundus were less intensely la- beled. In the brain stem (mesencephalon and rhombencephal- on), we observed a general low intensity of staining. A number of the layers of the optic tectum were clearly defined by the labeling pattern (Fig. 7); the observations in the other structures are summarized in Table 1. The laminar nucleus of the torus semicircularis was intensely stained (Fig. 3A). High-intensity staining was seen in the arcuate fibers (Fig. 6AI). The dorsal (cochlear) and ventral (vestibular) nuclei of the eighth nerve were stained (Fig. 6AI). The nucleus isthmi was prominent for its lack of immunostaining. The cerebellum was strongly stained (Fig. 1). Immunoreactivity in the spinal cord (Fig. 6BI) was mainly found in the spinal gray, in the dorsal, lateral, and ven-
The Journal of Neuroscience, February 1990, W(2) 483
tromedial fields, and in the superior part of the central field. Staining was very faint in the ventrolateral and lateral motor fields. In the white matter, immunoreactivity was faint but still evident in all of the fimiculi and appeared to correspond to the dendritic arborization of the motoneurons. On some sections we observed a strong staining of the ventral roots, while the dorsal roots were not immunoreactive.
KAR immunoreactivity in the optic tectum The optic tectum displayed a defined pattern of layer labeling with both monoclonal and polyclonal immunostaining and in vitro autoradiography (Figs. 2,3,5). In our analysis, we followed the anatomical division established in the frog by Szekely and Lazar (1976). Immunoreactivity was observed only in plexiform layers (Fig. 7, A, C, D). The immunoreactive fibers showed a
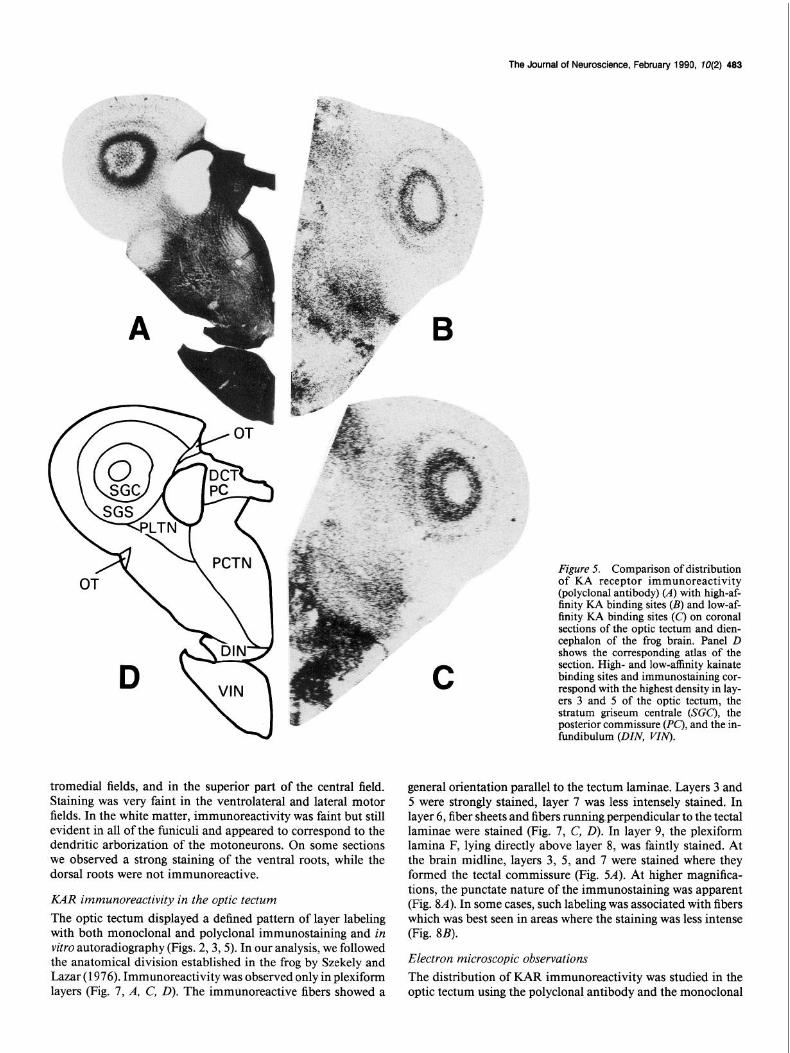
Fimre 5. Comnarison of distribution of-KA receptor immunoreactivity (polyclonal antibody) (A) with high-af- finity KA binding sites (B) and low-af- finity KA binding sites (C) on coronal sections of the optic tectum and dien- cephalon of the frog brain. Panel D shows the corresponding atlas of the section. High- and low-affinity kainate binding sites and immunostaining cor- respond with the highest density in lay- ers 3 and 5 of the optic tectum, the stratum griseum centrale (SGC), the posterior commissure (PC), and the in- fundibulum (DIN, VIN).
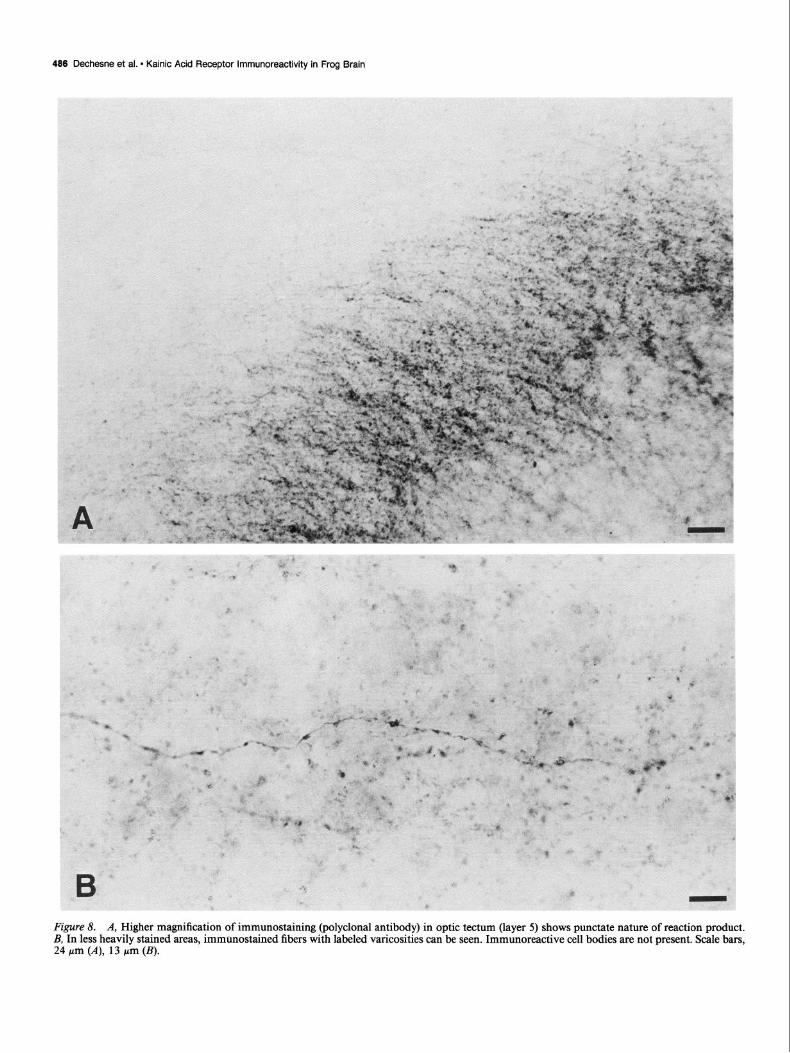
general orientation parallel to the tectum laminae. Layers 3 and 5 were strongly stained, layer 7 was less intensely stained. In layer 6, fiber sheets and fibers running,perpendicular to the tectal laminae were stained (Fig. 7, C, 0). In layer 9, the plexiform lamina F, lying directly above layer 8, was faintly stained. At the brain midline, layers 3, 5, and 7 were stained where they formed the tectal commissure (Fig. %I). At higher magnifica- tions, the punctate nature of the immunostaining was apparent (Fig. 8A). In some cases, such labeling was associated with fibers which was best seen in areas where the staining was less intense (Fig. 8B).
Electron microscopic observations
The distribution of KAR immunoreactivity was studied in the optic tectum using the polyclonal antibody and the monoclonal

484 Dechesne et al. l Kainic Acid Receptor lmmunoreactivity in Frog Brain
Figure 6. A, Comparison of distribution of KA receptor immunoreactivity (polyclonal antibody) (AI) with high-affinity (A2) and low-affinity (A3) KA binding sites on coronal sections of the brain stem of the frog. Panel A4 shows the corresponding atlas of the section. There is a close correspondence between the location of KA receptors in the 3 experiments. The vestibular nucleus (VN) is immunoreactive. Most of the immu- nostaining is in the sulcus limitans (SL) and arcuate fibers (AF). B, Comparison of the distribution of KA receptor immunoreactivity (polyclonal antibody) (BI) and high-affinity KA binding sites (E2) on coronal sections of the frog spinal cord. The 2 sections correspond with most KA receptor density in the posterior horn and medial part of the ventral horn.
antibody KAR-A 1. Immunostaining was found to be associated with synapses and at extrasynaptic sites in the tectal neuropile. At synapses, staining was found on the cytoplasmic side of the postsynaptic membranes with monoclonal (Fig. 9, A, B) and polyclonal (Fig. 9C) antibodies. Intracellular staining extending into the nearby cytoplasm was often seen adjacent to the labeled postsynaptic membrane. The labeled synapses represented a minor population of the total synapse population. The presyn- aptic terminals of stained synapses contained clear, pleomorphic synaptic vesicles. Extensive extrasynaptic labeling was seen throughout the neuropile with the monoclonal (Fig. 10, A, B) and polyclonal (Fig. 1OC) antibodies. Staining appeared as dense dark patches often regularly spaced on the surface of the cyto- plasmic membrane of unmyelinated processes. Labeled fibers were predominantly found in clusters. At times, immunoreac- tivity appeared as opposing patches on adjacent neurite mem- branes (Fig. 1OC).
Discussion In the present study, we describe the distribution of a putative KAR in frog brain using monoclonal and polyclonal antibodies made against an affinity purified protein. These antibodies are selective for the KAR based on immunoprecipitation and im- munoblot analyses with SDS-PAGE (Hampson et al., 1989). The similarity in distributions of 3H-KA binding sites, deter- mined with receptor autoradiography, and of the KAR, deter- mined by immunocytochemistry with monoclonal and poly- clonal antibodies, provides strong evidence that purified receptor
used as antigen for making the antibodies is the major KA binding site in frog brain and that the antibodies are selective for this protein.
Binding studies on tissues of several species have shown cur- vilinear Scatchard plots for KARs, which have been interpreted as indicating 2 binding sites of high (& values of 3.5-15 nM) and low (Kd values of 25-65 nM) affinity. A differential distri- bution of these 2 sites has been reported in the rat (London and Coyle, 1979; Pate1 et al., 1986), while Monaghan et al. (1986) reported that distributions of high- and low-affinity binding sites are similar in rat and primate brain. Radiation inactivation studies on rat brain showed different molecular sizes of the KAR, suggesting that the high- and low-affinity binding sites are distinct molecules (Honor+ et al., 1986). Our in vitro au- toradiographic results show similar distributions for high- and low-affinity KA binding sites, suggesting that these sites may be associated with the same molecular complex in frog brain. Since the autoradiographic technique we used cannot completely dif- ferentiate between high- and low-affinity sites, minor differences in distribution may not be detected. However, the autoradio- graphic results are consistent with our earlier findings showing that high- and low-affinity binding sites from frog brain copurify through ion-exchange and affinity chromatography, yielding a single band with SDS-PAGE with an M, = 48,000 (Hampson and Wenthold, 1988). Furthermore, we have found no evidence that the polyclonal or the monoclonal antibodies can selectively immunoprecipitate either the high- or low-affinity KA binding sites (Hampson et al., 1989, and unpublished observations).

“I
The Journal of Neuroscience, February 1990, 1 O(2) 485
488 Dechesne et al. l Kainic Acid Receptor lmmunoreactivity in Frog Brain
Figure 8. A, Higher magnification of immunostaining (polyclonal antibody) in optic tectum (layer 5) shows punctate nature of reaction product. B, In less heavily stained areas, immunostained fibers with labeled varicosities can be seen. Immunoreactive cell bodies are not present. Scale bars, 24 pm (A), 13 pm (B).

The Journal of Neuroscience, February 1990, IO(2) 487
Table 1. Distribution of kainic acid immunoreactivity in the brain stem (except the optic tectum) of the frog
Brain stem tissue Density
Central rhombencephalic gray Deep mesencephalic nucleus Dorsal nucleus (cochlear) Ventral nucleus (vestibular) Infundibulum Interpeduncular nucleus Medullary reticular formation Motor nucleus of the glossopharyngeal nerve Nucleus of the abducens nerve Nucleus isthmi Nucleus of the media1 longitudinal fasciculus Nucleus of the oculomotor nerve Raphe nucleus Reticular isthmic nucleus Inferior reticular nucleus Superior reticular nucleus Superior olive Sulcus limitans Anterodorsal nucleus of the mesencephalic
tegmentum
+ ++ + + +++ rostra1 + ++ +++ + 0 layers ++ ++ 0 part + + + + ++
fibers ++ Anteroventral nucleus of the mesencephalic
tegmentum ++ Posterodorsal nucleus of the mesencephalic
tegmentum 0 Posteroventral nucleus of the mesencephalic
tegmentum Iaminar nucleus of the torus semicircularis Principal nucleus of the torus semicircular% Magnocellular nucleus of the torus
semicircularis Fibers
++ +++ ++
+
Ansulate commissure ++ Arcuate fibers ++ Cerebellobulbar tract + Marginal lateral part of the optic tract part ++ Media1 longitudinal fascicle 0 Posterior commissure +++ Solitary fascicle + Spinal lemniscus 0 Tectal commissure +++ Tecto-bulbar and spinal tract ++ Tegmental fascicle 0 Transverse commissure ++
Nomenclature derived from Kemali and Braitenberg (1969), Nieuwenhys and Opdam (1976), and Netchitailo et al. (1987). Total density of the immunoreaction: high, + + +; moderate, + +; low, +; absent, 0.
Therefore, these data suggest that, in frog, both high- and low- affinity KA binding sites are associated with the M, = 48,000 protein. Further studies are required to determine if, in fact, 2 different binding sites exist and if they are on the same molecule.
Limited data are available concerning the distribution of pu- tative EAA neurotransmitters in frog brain. A number of studies
Figure 9. Electron micrographs of immunostained synapses in the frog tectum. A and B, KAR-A 1; C, polyclonal antibody, no counterstaining.
C The same pattern of immunostaining is seen with the polyclonal and monoclonal antibodies. The postsynaptic density is intensely stained (arrowhead). Intracellular staining is present in the postsynaptic neurite (open arrow). Presynaptic terminals contain numerous light core syn- aptic vesicles. Scale bars, 0.25 pm.

488 Dechesne et al. - Kainic Acid Receptor lmmunoreactivity in Frog Brain
Figure 10. Electron micrographs of immunostained neuropiles in the frog tectum. A and B, KAR-Al , no counterstaining; C, polyclonal antibody, counterstained. Groups of unmyelinated nerve processes display the same pattern of staining. Periodic intensely stained patches are found on the surface of the neurite cytoplasmic membranes. In some opposing neurites, the stained patches face each other (arrowhead). Intracellular cytosolic staining is sometimes seen in the processes presenting immunostained membranes (open arrow). Note a stained synapse (star). Scale bars, 0.5 pm.
have implicated glutamate as the neurotransmitter of the retino- tectal pathway of frog and goldfish. Deafferentation causes a decrease in the high-affinity uptake of glutamate in frog tectum (Roberts and Yates, 1976) and pharmacological studies have suggested that an EAA may be a neurotransmitter of the retino- tectal pathway in goldfish (Langdon and Freeman, 1986, 1987). Recently, McDonald et al. (1989) showed that, in the frog tec- turn, the highest densities of NMDA and quisqualate receptor binding sites were found in layer 9, which is consistent with the retinotectal pathway being glutamatergic. However, Henley and Oswald (1988) suggested that an EAA may not be involved in this pathway since they did not observe changes in binding of
EAA in goldfish tectum after deafferentation. Our studies show that immunostaining in the frog tectum is concentrated in layers 3, 5, and 7, which is not consistent with a KAR involved in neurotransmission at the primary synapses between the optic nerve and tectal neurons since optic fiber terminals are found in layer 9. Electrophysiological evidence for the role ofglutamate as a neurotransmitter exists in the frog spinal cord and vestibular nuclei. In the spinal cord, glutamate depolarizes the motoneu- rons (Kudo, 1978; Watkins, 1978). Glutamate receptors may be then present on motoneuron dendritic arborization, where we found some immunoreactivity. Cochran et al. (1987) showed that, in the vestibular nuclear complex, the vestibular nerve

The Journal of Neuroscience, February 1990, IO(2) 489
transmitter activated second-order neurons through KA/quis- qualate synaptic receptors. This is consistent with our results showing immunostaining of the ventral (vestibular) nuclei.
While the distribution of 3H-KA binding sites in frog brain has not been previously studied, our results can be compared with homologous structures in other vertebrate species brain. We found a general anteroposterior gradient in the intensity of immunostaining and distribution of binding sites, with the telen- cephalon being the most extensively stained structure. This ob- servation has been reported previously for the distribution of KA binding sites in the rat (Monaghan and Cotman, 1982; Pate1 et al., 1986). The frog cerebellum had a high density of im- munostaining, which is consistent with other studies showing KA binding sites in the cerebellum of goldfish, pigeon, mouse, and rat (Henke et al., 198 1; Olson et al., 1987; Henley and Oswald, 1988). Klein et al. (1988) described KAR immuno- reactivity in the molecular and Purkinje cell layers of the pigeon cerebellum. The infundibulum, which is strongly immunoreac- tive in frog, has a high density of binding sites in the rat (Un- nerstall and Wamsley, 1983). Finally, in the rat spinal cord, only the substantia gelatinosa shows moderately dense binding (Mon- aghan and Cotman, 1982) and this area, in the frog, is found in the dorsal field, which is clearly immunoreactive in our ex- periments. On the other hand, we found uniform staining of the telencephalon and especially the medial pallium, which is thought to be a homolog of the mammalian hippocampus, whereas KA binding sites are regionally distributed in the mammalian telen- cephalon (for a review, Monaghan et al., 1986; Represa et al., 1987). A difference is also noted in the thalamus, which is in- tensely stained in our experiments, and which is described as containing very few binding sites in the mouse and rat (Mon- aghan and Cotman, 1982; Pate1 et al., 1986). In the mouse and rat brain stem, KA binding sites have a relatively low density (Monaghan and Cotman, 1982; Pate1 et al., 1986), which is similar to our results in the frog. However, in this region, a part of the torus semicircularis was strongly immunostained, while the homologous region in the rat, which is the inferior colliculus, shows only a moderate density of KA binding sites (Pate1 et al., 1986).
Our electron microscopy results show that KAR molecules are present at postsynaptic membrane sites, as well as at extra- synaptic sites in the frog optic tectum. This pattern is not re- stricted to the tectum, but is also seen in other CNS structures (unpublished observations). A postsynaptic localization of the KAR is expected based on physiological studies and results of immunocytochemical studies of other neurotransmitter recep- tors including the glycine (Wenthold et al., 1988) GABA, (Rich- ards et al., 1987) fl-adrenergic (Aoki et al., 1987), and nicotinic ACh receptors (Jacob et al., 1986), all of which demonstrate synaptic staining. However, for the KAR, the predominant staining is extrasynaptic. There are several possible explanations for the extrasynaptic labeling. First, the M, = 48,000 protein may not be a postsynaptic neurotransmitter receptor but rather a KA binding molecule that may or may not be related to EAA neurotransmission. Our results on the binding properties of the isolated protein and on the distribution of 3H-KA binding sites/ KAR immunoreactivity confirm that our antibodies recognize the major KA binding protein in frog brain. Therefore, this interpretation would imply that all or most of the KA binding sites are not postsynaptic receptors. A small subset ofthe binding sites could include postsynaptic receptors, since such a small population would probably not be recognized in ligand binding
studies even if it had different pharmacological and ligand-bind- ing properties. However, our results showing synaptic labeling, although minor, are consistent with the M, = 48,000 protein being a receptor. We have also recently isolated a cDNA for this protein, and preliminary results show that it displays a ligand-gated ion channel-like hydrophobicity pattern (Wada et al., 1989).
A second possibility is that our antibodies recognize 2 differ- ent antigens in frog brain. This seems unlikely since (1) the same patterns of staining at both the light and electron microscopic levels were seen using polyclonal and monoclonal antibodies, and (2) immunoblot analyses of l- and 2-dimensional SDS- PAGE show both types of antibodies react with the same pro- teins clustered around M, = 48,000. While the immunoprecip- itation properties of the 2 monoclonal antibodies used in this study are different (Hampson et al., 1989) we cannot rule out the possibility that the antibodies used all recognize the same or very similar epitopes on the KAR molecule and that these epitopes are shared with other proteins.
A final explanation is that the M, = 48,000 protein is a neu- rotransmitter receptor which is not localized primarily at syn- apses. The extrasynaptic KAR immunoreactivity may represent molecules in transport or a nonsynaptic pool of the receptor. This is consistent with findings on several neurotransmitter re- ceptors which have been shown immunocytochemically to be present at extrasynaptic sites (Jacob et al., 1986; Aoki et al., 1987; Richards et al., 1987). Recently, the distribution of the nicotinic ACh receptor was studied in frog optic tectum using a series of monoclonal antibodies (Sargent et al., 1989) and ultrastructural analysis showed the labeling to be primarily ex- trasynaptic, with synaptic staining only rarely seen. These results are similar to those we obtain using antibodies to KAR, although it is clear that different molecules are being localized since their distributions at the light microscopic level are very different. This raises the possibility that extrasynaptic localization of re- ceptors may be common in frog brain. We note, however, that a pattern of staining similar to that seen in these 2 cases was obtained in cat cerebral cortex using monoclonal antibodies generated against cat nervous tissues and thought to identify cell surface or extracellular matrix molecules (Naegele and Bamstable, 1989). This may suggest that the extrasynaptic KAR has a function distinct from that of the synaptic KAR. It is interesting that frog brain has a concentration of KA binding sites about 40-fold higher than mammalian brain, but with sim- ilar pharmacology and binding properties (Hampson and Went- hold, 1988). This very high level in frog brain could be accounted for by the extrasynaptic sites. A further characterization of the function of this putative EAA receptor can now be carried out through isolation and expression of a cDNA encoding this pro- tein.
References Aoki, C., T. H. Joh, C. Strader, and V. M. Pickel (1987) Ultrastructural
localization of beta-adrenergic receptor-like immunoreactivity in the cortex and neostriatum. Brain Res. 437: 264-282.
Cochran, S. L., P. Kasik, and W. Precht (1987) Pharmacological as- pects of excitatory synaptic transmission to second-order vestibular neurons in the frog. Synapse I: 102-123.
Greenamyre, J. T., J. M. M. Olson, J. B. Penney, and A. B. Young (1985) Autoradiographic characterization of N-methly-D-aspartate- quisqualate- and kainate-sensitive glutamate binding sites. J. Phar- macol. Exp. Ther. 233: 254-263.
Hampson, D. R., and R. J. Wenthold (1988) A kainic acid receptor

490 Dechesne et al. * Kainic Acid Receptor lmmunoreactivity in Frog Brain
from frog brain purified using domoic acid affinity chromatography. J. Biol. Chem. 263: 2500-2505.
Hampson, D. R., K. D. Wheaton, C. J. Dechesne, and R. J. Wenthold (1989) Identification and characterization of the ligand binding sub- unit ofa kainic acid receptor using monoclonal antibodies and peptide mapping. J. Biol. Chem. 264: 13329-13335.
Henke, H., A. Beaudet, and M. Cuenod (198 1) Autoradiographic lo- calization of specific kainic acid binding sites in pigeon and rat cer- ebellum. Brain Res. 219: 95-105.
Henley, J. M., and R. E. Oswald (1988) Characterization and regional distribution of glutamatergic and cholinergic ligand binding sites in goldfish brain. J. Neurosci. 8: 2101-2107.
Honor& T., J. Drejer, and M. Nielsen (1986) Calcium discriminates two [‘HI kainate binding sites with different molecular target sizes in rat cortex. Neurosci. Lett. 65: 47-52.
Hsu, S. M., L. Raine, and H. Fanger (198 1) Use of avidin-biotin- peroxidase complex (ABC) in immunoperoxidase techniques: A com- parison between ABC and unlabeled antibody (PAP) procedures. J. Histochem. Cytochem. 29: 577-580.
Jacob, M. H., J. M. Lindstrom, and D. K. Berg (1986) Surface and intracellular distribution of a putative neuronal nicotinic acetylcho- line receptor. J. Cell Biol. 103: 205-2 14.
Kemali, M., and V. Braitenberg (1976) Atlas of the Frog’s Bruin, Springer-Verlag, Berlin. - - -
Klein. A. U.. B. Niederoest. K. H. Winterhalter. M. Cuenod. and P. S&t (1988) A kainate binding protein in pigeon cerebellum: Pu- rification and localization by monoclonal antibody. Neurosci. Lett. 95: 359-364.
Kudo, Y. (1978) The pharmacology of the amphibian spinal cord. Prog. Neurobiol. 11: l-76.
Langdon, R. B., and J. A. Freeman (1986) Antagonists ofglutamatergic neurotransmission block retinotectal transmission in fron. Brain Res. 398: 169-174.
Langdon, R. B., and J. A. Freeman (1987) Pharmacology of retino- tectal transmission in the goldfish: Effects of nicotinic linands strvch- nine, and kynurenic acid.>. Neurosci. 7: 760-773. - _
London, E. D., and J. T. Coyle (1979) Specific binding of pH]kainic acid to recentor sites in rat brain. Mol. Pharmacol. 15: 492-505.
McDonald, J.-W., H. T. Cline, M. Constantine-Patton: W. F. Marangos, M. V. Johnston, and A. B. Young (1989) Quantitative autoradio- graphic localization of NMDA, quisqualate and PCP receptors in the frog tectum. Brain Res. 482: 155-l 58.
Monaghan, D. T., and C. W. Cotman (1982) The distribution of [3H]kainic acid binding sites in rat CNS as determined by radioau- tography. Brain Res. 252: 91-100.
Monaghan, D. T., V. R. Holets, D. W. Toy, and C. W. Cotman (1983) Anatomical distribution of four pharmacologically distinct ‘H-L-glu- tamate binding sites. Nature 306: 176-l 79.
Monaghan, D. T., L. Nguyen, and C. W. Cotman (1986) The distri- bution of [‘Hlkainate binding sites in primate hippocampus is similar to the distribution of both Ca2+-sensitive and Ca2+-insensi- tive [)H]kainate binding sites in rat hippocampus. Neurochem. Res. II: 1073-1082.
Naegele, J. R., and C. J. Bamstable (1989) Molecular determinants of GABAergic local circuit neurons in the visual cortex. Trends Neu- rosci. 12: 28-34.
Netchitailo, P., M. Feuilloley, G. Pelletier, F. Leboulenger, M. Cantin, J. Gutkowska, and H. Vaudry (1987) Atria1 natriuretic factor-like immunoreactivity in the central nervous system of the frog. Neuro- science 22: 341-359.
Nieuwenhuys, R., and P. Opdam (1976) Structure of the brain stem. In Frog Neurobiology, R. Links and W. Precht, eds., pp. 81 l-855, Springer-Verlag, New York.
Olson, J. M. M., J. T. Greenamyre, J. B. Penney, and A. B. Young (1987) Autoradiographic localization of cerebellar excitatory amino acid binding sites in the mouse. Neuroscience 22: 9 13-923.
Patel, S., B. S. Meldrum, and J. F. Collins (1986) Distribution of [)H]kainic acid and binding sites in the rat brain: in vivo and in vitro receptor autoradiography. Neurosci. Lett. 70: 301-307.
Represa, A., E. Tremblay, and Y. Ben-Ari (1987) Kainate binding sites in the hippocampal mossy fibers: Localization and plasticity. Neuroscience 20: 739-748.
Richards, J. G., P. Schoch, P. Having, B. Takacs, and H. Mohlkr (1987) Resolving GABA,/benzodiazepine receptors: Cellular and subcellular localization in the CNS with monoclonal antibodies. J. Neurosci. 7: 1866-1886.
Roberts, P. J., and R. A. Yates (1976) Tectal deafferentation in the frog: Selective loss of L-glutamate and gamma-aminobutyrate. Neu- roscience 1: 371-374.
Sargent, P. B., S. H. Pike, D. B. Nadel, and J. M. Lindstrom (1989) Nicotinic acetylcholine receptor-like molecules in the retina, retino- tectal pathway and optic tectum of the frog. J. Neurosci. 9: 565-573.
Szekely, Gy., and Gy. Lazar (1976) Cellular and synaptic architecture of the optic tectum. In Frog Neurobiology, R. Lin&and W. Precht, eds.. vv. 407-434. Svrinaer Verlaa. New York. __
Triller, A. F., F. Cluzeaud, and H. Kom (1985) Distribution ofglycine receptors at central synapses: An immunoelectron microscopy study. J. Cell Biol. 101: 683-688.
Unnerstall, J. R., and J. K. Wamsley (1983) Autoradiographic local- ization of high-affinity [‘Hlkainic acid binding sites in the rat fore- brain. Eur. J. Pharmacol. 86: 36 l-37 1.
Wada, K., C. J. Dechesne, S. Shimasaki, R. G. King, K. Kusano, A. Buonanno, D. R. Hampson, C. Banner, R. J. Wenthold, and Y. Naka- tani (1989) Sequence and expression of a frog brain complementary DNA encoding a kainate-binding protein. Nature (in press).
Watkins, J. C. (1978) Excitatory amino acids. In Kainic Acid as a Tool in Neurobiology, E. G. MacGeer, J. W. Olney, and P. C. MacGeer, eds., pp. 37-69, Raven, New York.
Watkins, J. C., and R. H. Evans (198 1) Excitatory amino acid trans- mitters. Annu. Rev. Pharmacol.. Toxicol. 21: 165-204.
Wenthold. R. J.. M. H. Parakkal. M. D. Oberdorfer. and R. A. Altschuler (1988) ‘Glycine receptor immunoreactivity in ‘the ventral cochlear nucleus of the guinea pig. J. Comp. Neurol. 276: 423-435.