Embed Size (px)
Citation preview
Farida Fassi IFIC, Valencia, Spain PCI2010 workshop
Rabat, Moroco, October, 2011
Distributed Data Analysis in ATLAS Top quark physics
OUTLINE v ATLAS Computing Model: Data Format and Data Flow v Analysis and Distributed Analysis System v Usage of Distributed Analysis and Data Format v Data Analysis work-Flow
v What type of jobs you can run? v What type of data you can run on? v ATLAS release status
v Running on Grid: Practical Advise
v Top quark physics
v Motivation v Search for new physics in top sector
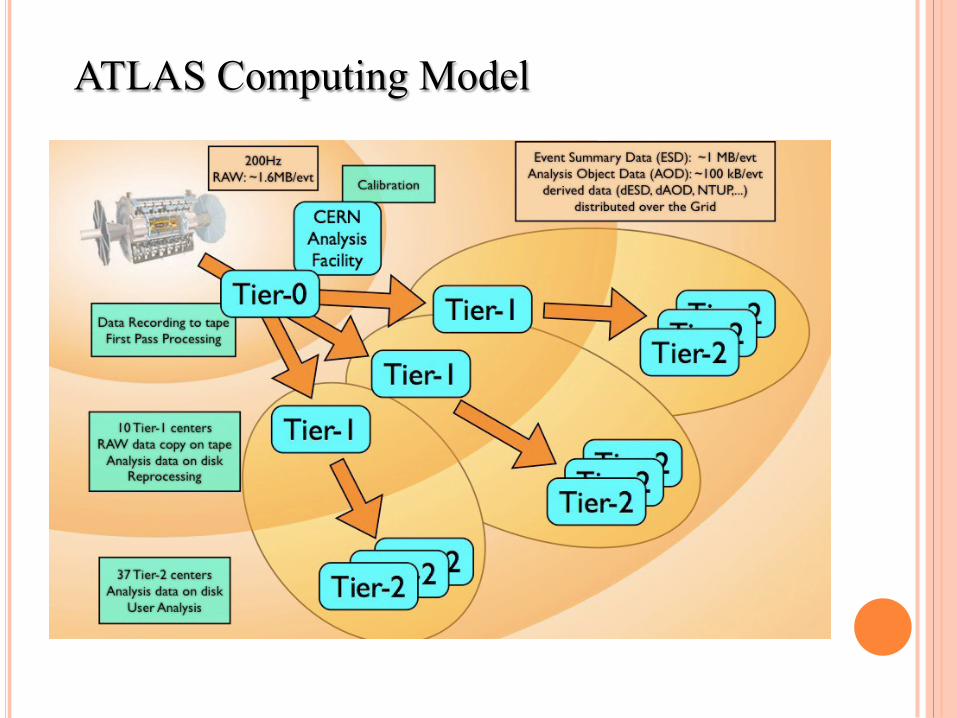
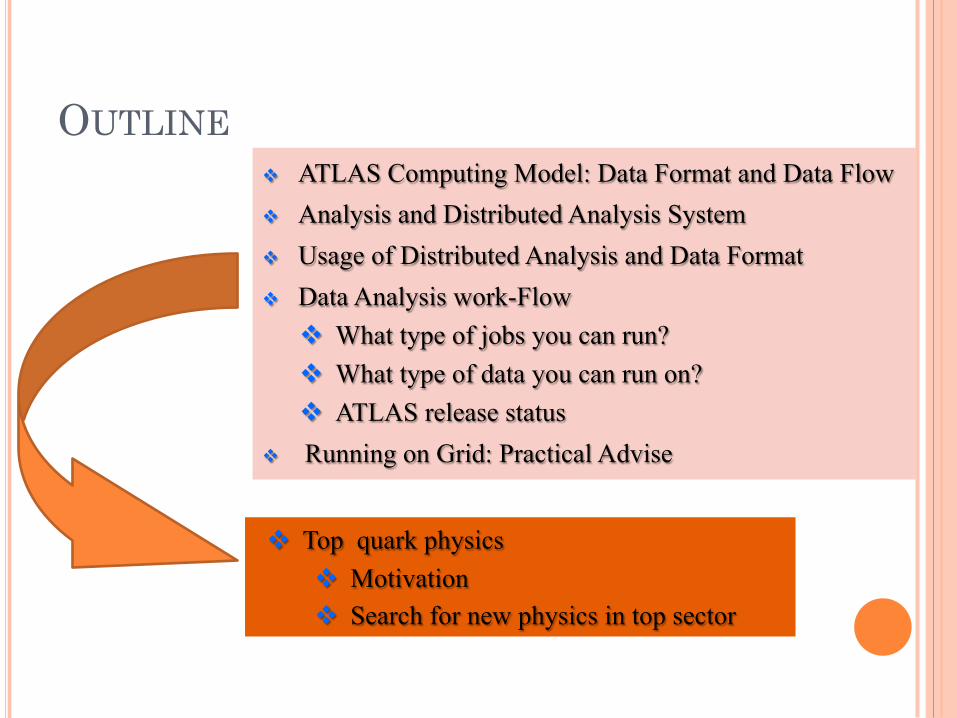
ATLAS Computing Model
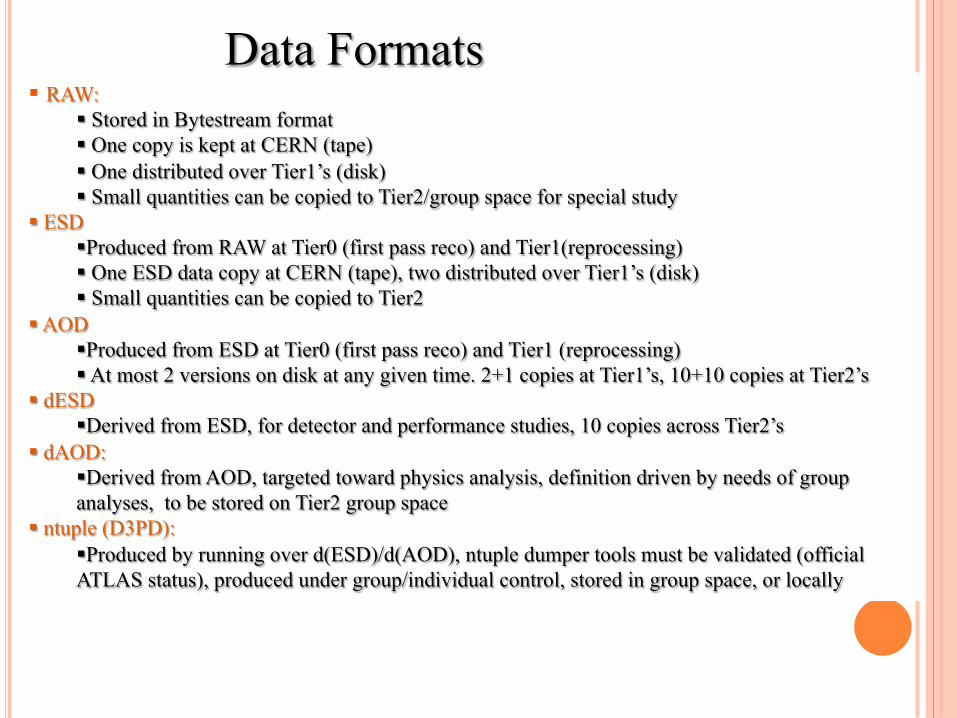
§ RAW: § Stored in Bytestream format § One copy is kept at CERN (tape) § One distributed over Tier1’s (disk) § Small quantities can be copied to Tier2/group space for special study
§ ESD § Produced from RAW at Tier0 (first pass reco) and Tier1(reprocessing) § One ESD data copy at CERN (tape), two distributed over Tier1’s (disk) § Small quantities can be copied to Tier2
§ AOD § Produced from ESD at Tier0 (first pass reco) and Tier1 (reprocessing) § At most 2 versions on disk at any given time. 2+1 copies at Tier1’s, 10+10 copies at Tier2’s
§ dESD § Derived from ESD, for detector and performance studies, 10 copies across Tier2’s
§ dAOD: § Derived from AOD, targeted toward physics analysis, definition driven by needs of group analyses, to be stored on Tier2 group space
§ ntuple (D3PD): § Produced by running over d(ESD)/d(AOD), ntuple dumper tools must be validated (official ATLAS status), produced under group/individual control, stored in group space, or locally
Data Formats
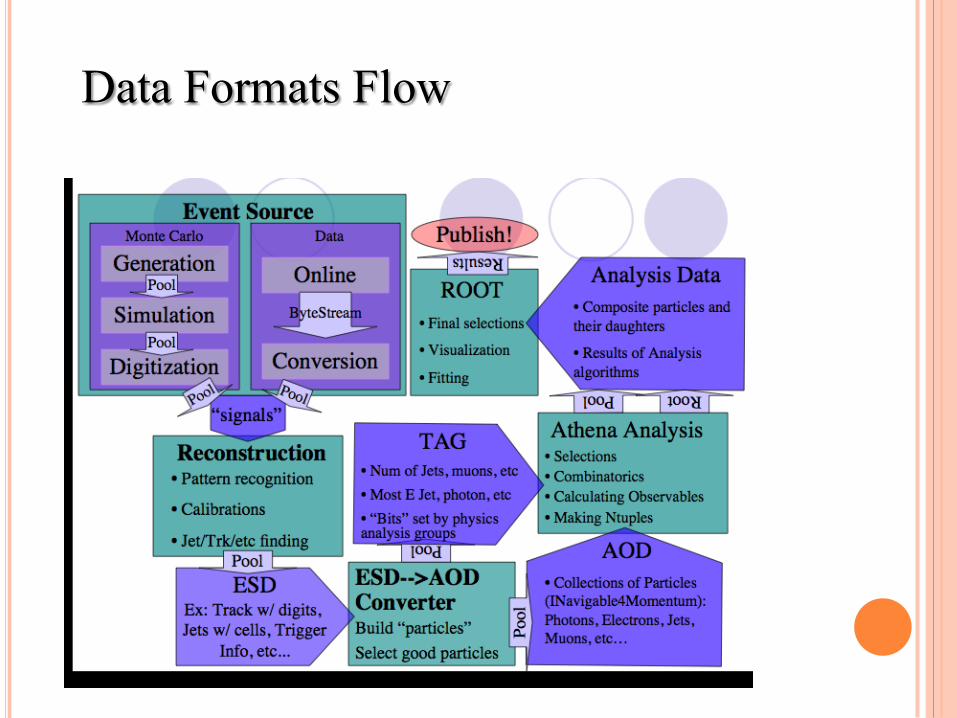
Data Formats Flow
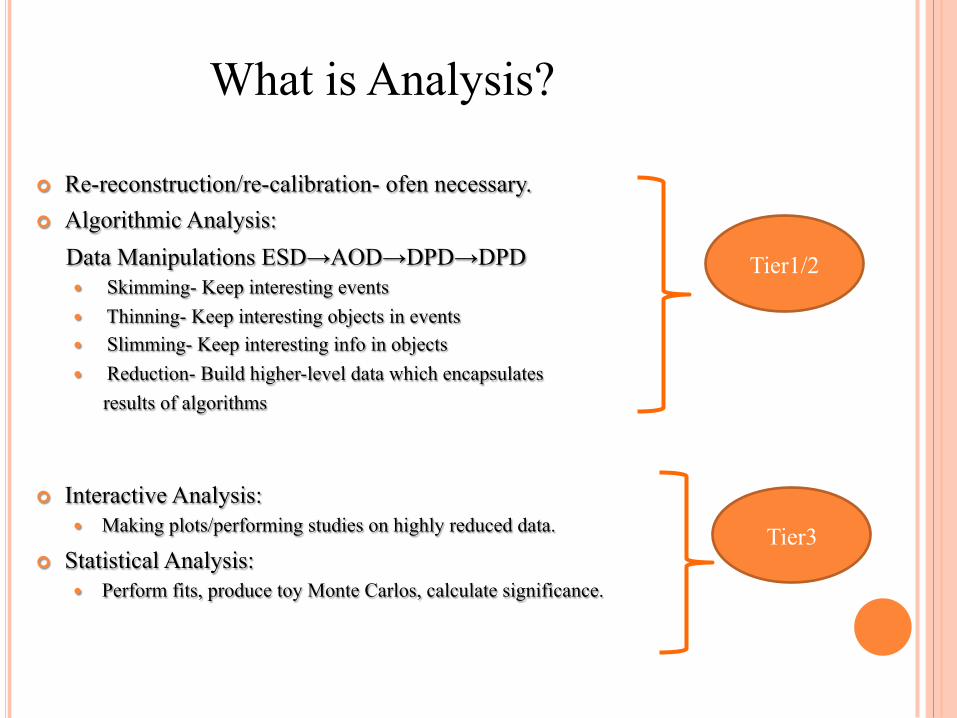
¢ Re-reconstruction/re-calibration- ofen necessary. ¢ Algorithmic Analysis: Data Manipulations ESD→AOD→DPD→DPD
� Skimming- Keep interesting events � Thinning- Keep interesting objects in events � Slimming- Keep interesting info in objects � Reduction- Build higher-level data which encapsulates results of algorithms
¢ Interactive Analysis: � Making plots/performing studies on highly reduced data.
¢ Statistical Analysis: � Perform fits, produce toy Monte Carlos, calculate significance.
Tier1/2
Tier3
What is Analysis?
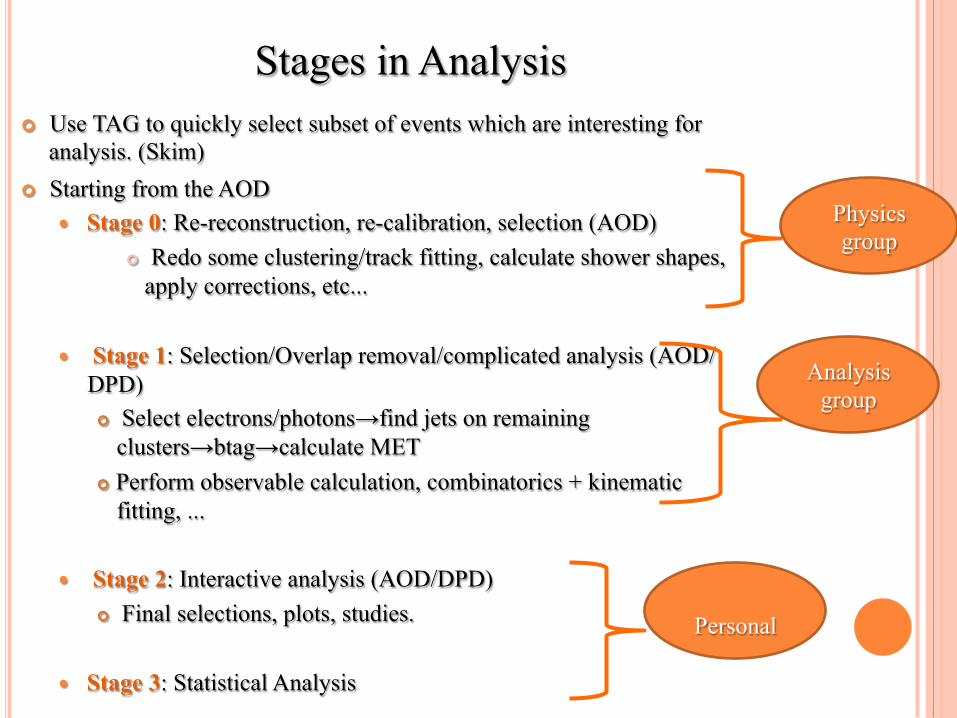
¢ Use TAG to quickly select subset of events which are interesting for analysis. (Skim)
¢ Starting from the AOD � Stage 0: Re-reconstruction, re-calibration, selection (AOD)
¢ Redo some clustering/track fitting, calculate shower shapes, apply corrections, etc...
� Stage 1: Selection/Overlap removal/complicated analysis (AOD/DPD) ¢ Select electrons/photons→find jets on remaining
clusters→btag→calculate MET ¢ Perform observable calculation, combinatorics + kinematic
fitting, ... � Stage 2: Interactive analysis (AOD/DPD)
¢ Final selections, plots, studies.
� Stage 3: Statistical Analysis
Physics group
Analysis group
Personal
Stages in Analysis
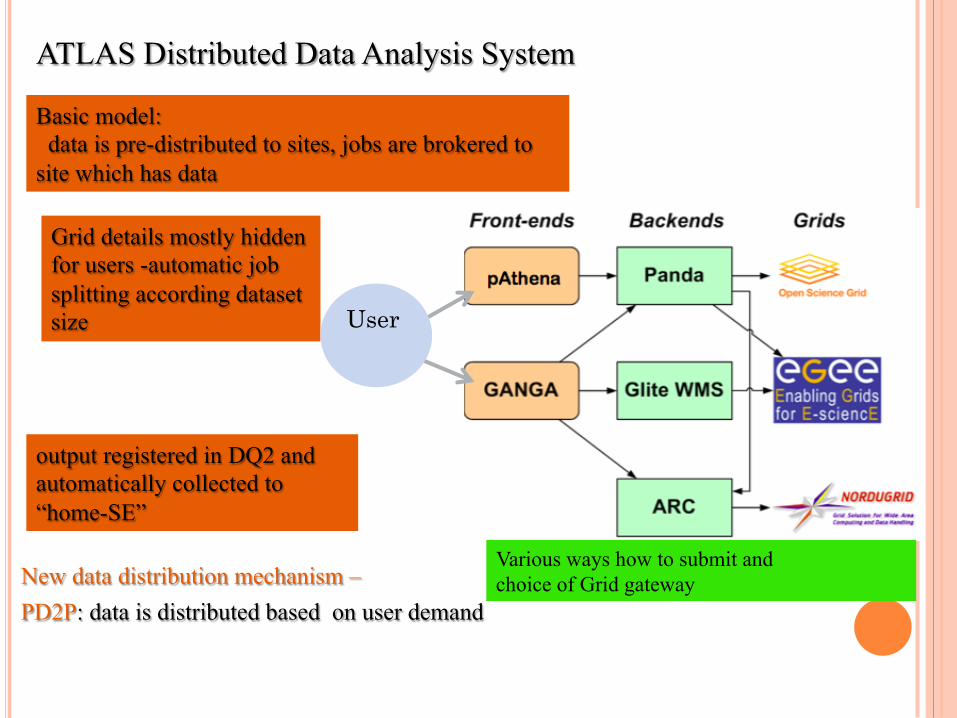
New data distribution mechanism – PD2P: data is distributed based on user demand
ATLAS Distributed Data Analysis System
Basic model: data is pre-distributed to sites, jobs are brokered to site which has data
Grid details mostly hidden for users -automatic job splitting according dataset size
output registered in DQ2 and automatically collected to “home-SE”
User
Various ways how to submit and choice of Grid gateway
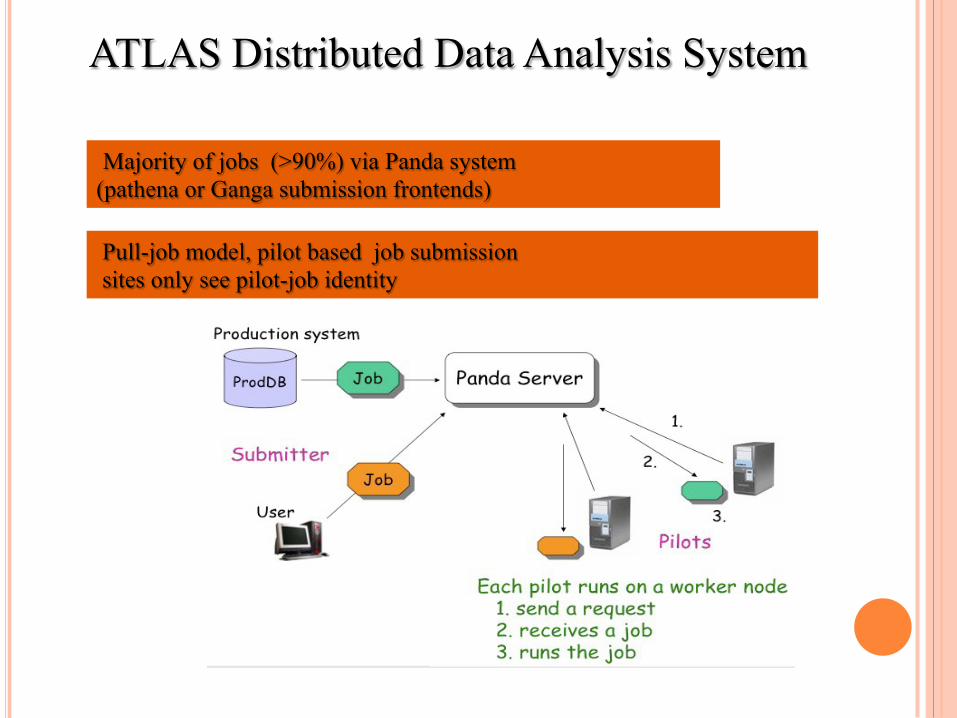
Pull-job model, pilot based job submission sites only see pilot-job identity
Majority of jobs (>90%) via Panda system (pathena or Ganga submission frontends)
ATLAS Distributed Data Analysis System
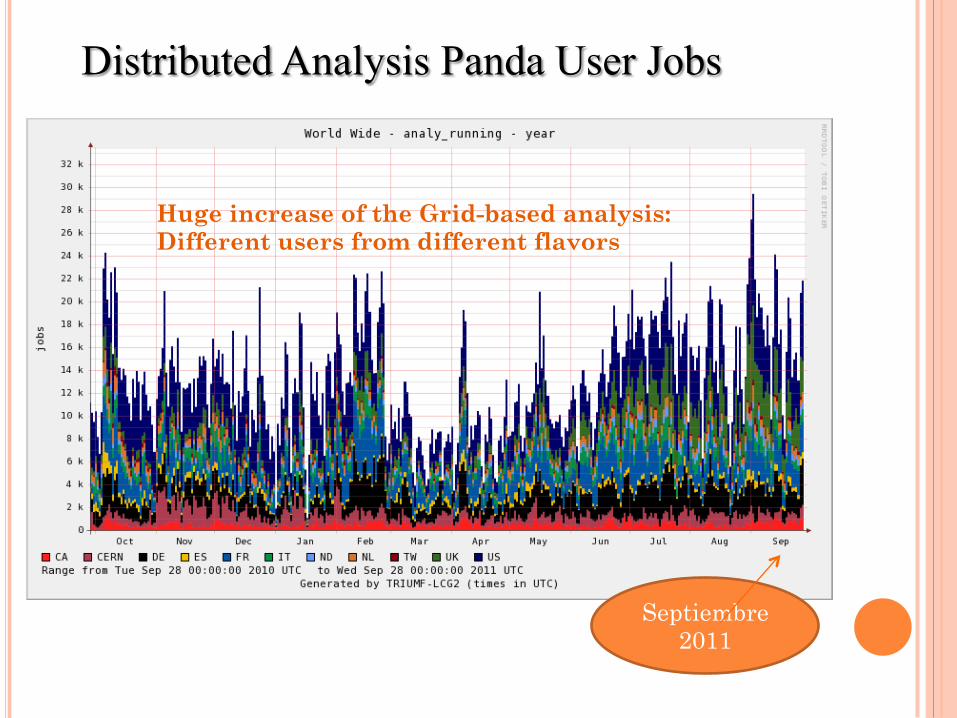
Huge increase of the Grid-based analysis: Different users from different flavors
Distributed Analysis Panda User Jobs
Septiembre 2011
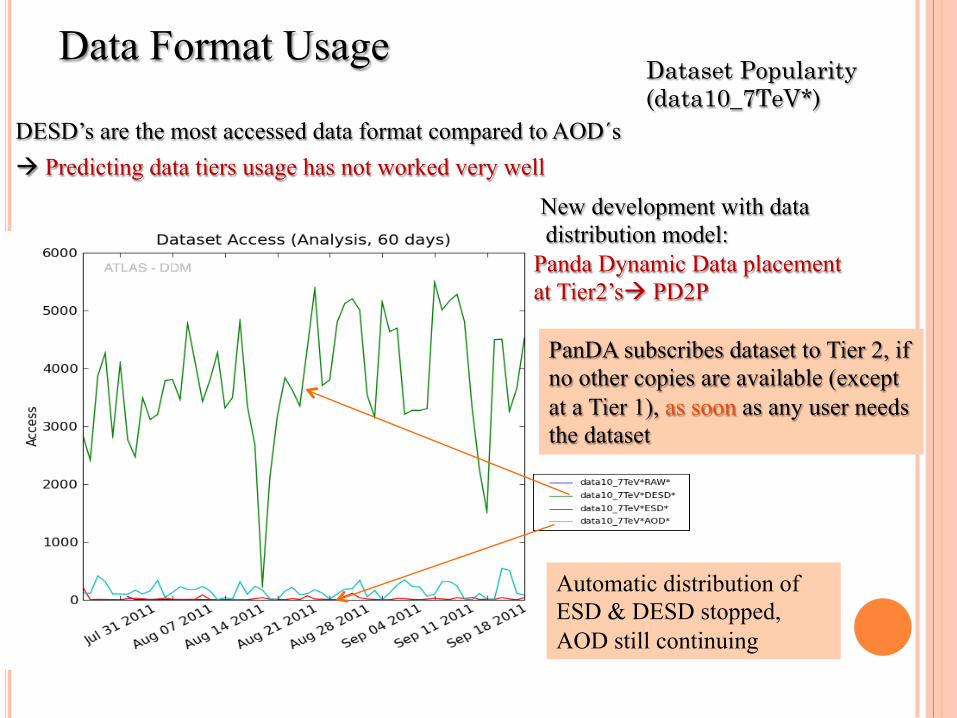
Dataset Popularity (data10_7TeV*)
DESD’s are the most accessed data format compared to AOD´s à Predicting data tiers usage has not worked very well New development with data
distribution model: Panda Dynamic Data placement at Tier2’sà PD2P PanDA subscribes dataset to Tier 2, if
no other copies are available (except at a Tier 1), as soon as any user needs the dataset
Automatic distribution of ESD & DESD stopped, AOD still continuing
Data Format Usage

AOD’s are the most accessed as expected
Dataset Popularity
MC Data Format Usage
AOD

Locate the data
Submit to the Grid
Setup the analysis code
Setup the analysis job
Retrieve the
results Analyze the results
1
2
3
4
5
Data Analysis Work-flow
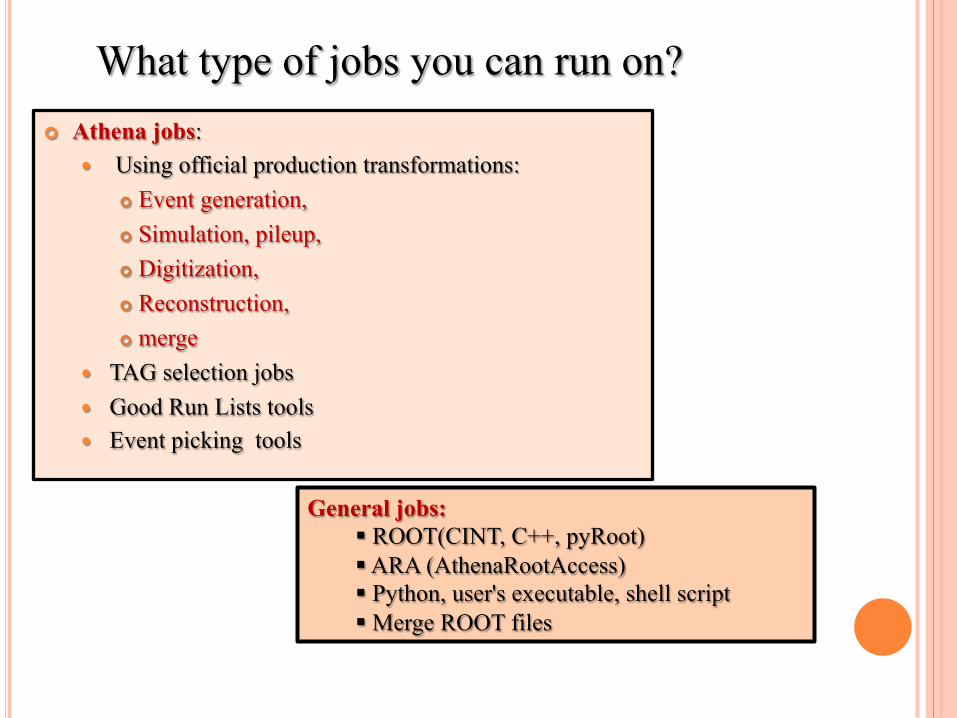
¢ Athena jobs: � Using official production transformations:
¢ Event generation, ¢ Simulation, pileup, ¢ Digitization, ¢ Reconstruction, ¢ merge
� TAG selection jobs � Good Run Lists tools � Event picking tools
General jobs: § ROOT(CINT, C++, pyRoot) § ARA (AthenaRootAccess) § Python, user's executable, shell script § Merge ROOT files
What type of jobs you can run on?
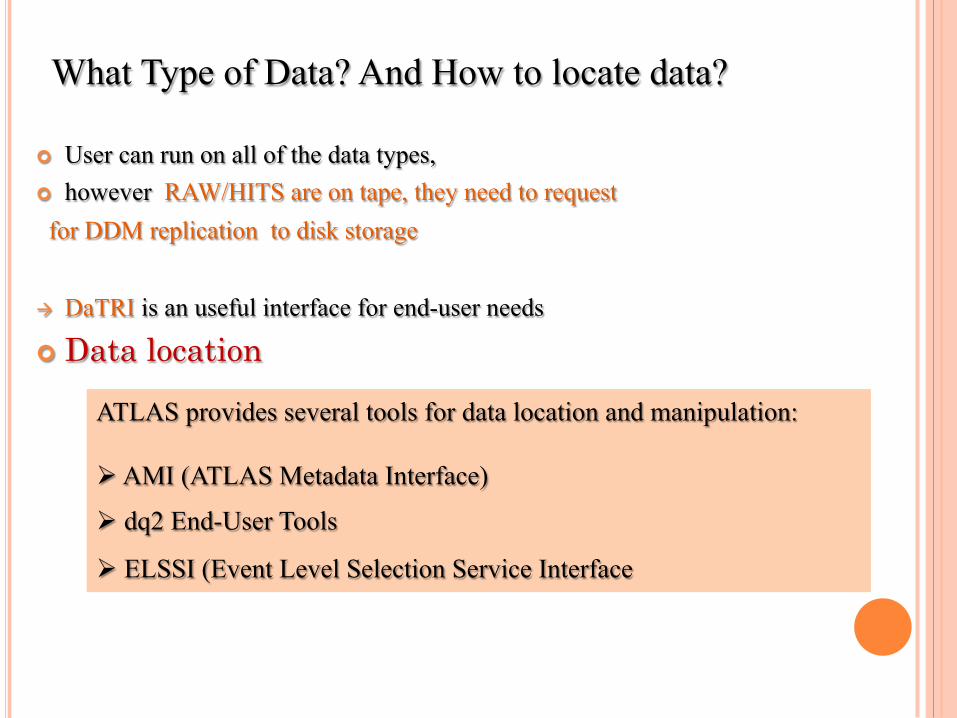
¢ User can run on all of the data types, ¢ however RAW/HITS are on tape, they need to request for DDM replication to disk storage à DaTRI is an useful interface for end-user needs
¢ Data location
ATLAS provides several tools for data location and manipulation: Ø AMI (ATLAS Metadata Interface)
Ø dq2 End-User Tools
Ø ELSSI (Event Level Selection Service Interface
What Type of Data? And How to locate data?

type here to search for datasets. Example:
data10_7TeV%physics_Muons.merge.NTUP_TOP%
How to locate the data? (1) § AMI is a generic cataloging system § ATLAS datasets are collections of files containing events since it is not possible to put all the data from one run into one file § Dataset Discovery means finding the names of valid datasets to use in your analysis
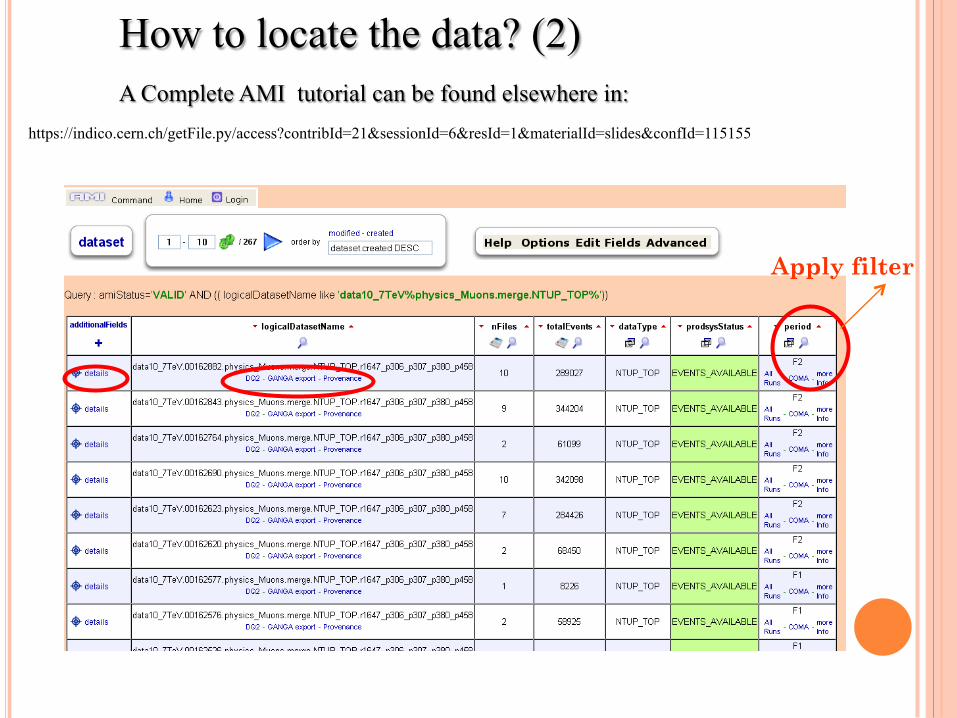
Apply filter
How to locate the data? (2) A Complete AMI tutorial can be found elsewhere in: https://indico.cern.ch/getFile.py/access?contribId=21&sessionId=6&resId=1&materialId=slides&confId=115155
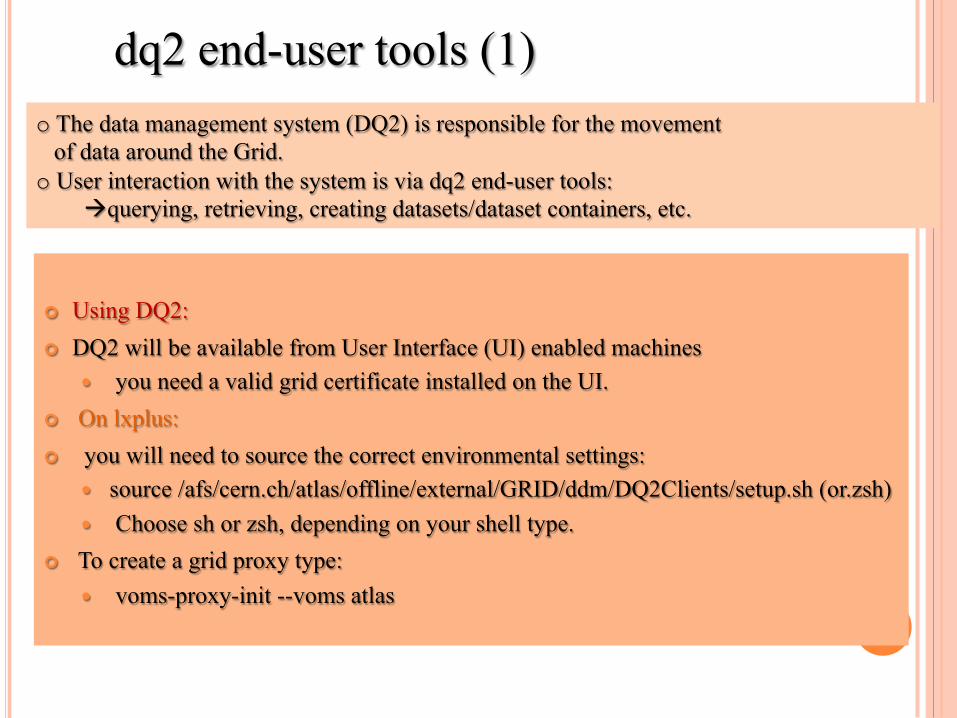
¢ Using DQ2: ¢ DQ2 will be available from User Interface (UI) enabled machines
� you need a valid grid certificate installed on the UI. ¢ On lxplus: ¢ you will need to source the correct environmental settings:
� source /afs/cern.ch/atlas/offline/external/GRID/ddm/DQ2Clients/setup.sh (or.zsh) � Choose sh or zsh, depending on your shell type.
¢ To create a grid proxy type: � voms-proxy-init --voms atlas
dq2 end-user tools (1) o The data management system (DQ2) is responsible for the movement of data around the Grid. o User interaction with the system is via dq2 end-user tools:
àquerying, retrieving, creating datasets/dataset containers, etc.
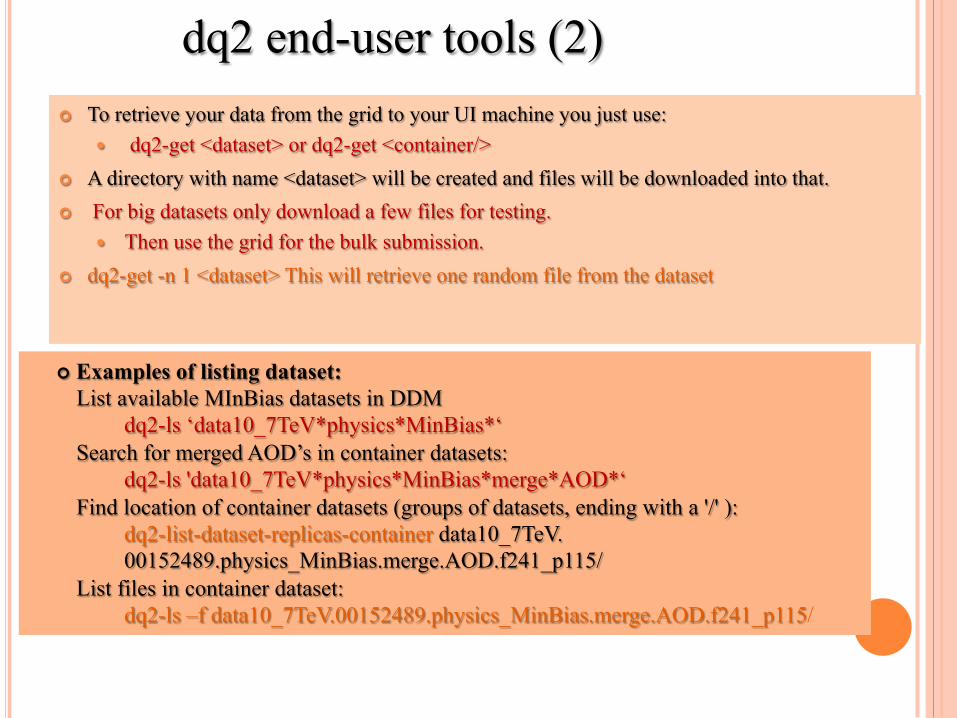
¢ To retrieve your data from the grid to your UI machine you just use: � dq2-get <dataset> or dq2-get <container/>
¢ A directory with name <dataset> will be created and files will be downloaded into that. ¢ For big datasets only download a few files for testing.
� Then use the grid for the bulk submission. ¢ dq2-get -n 1 <dataset> This will retrieve one random file from the dataset
dq2 end-user tools (2)
¢ Examples of listing dataset: List available MInBias datasets in DDM
dq2-ls ‘data10_7TeV*physics*MinBias*‘ Search for merged AOD’s in container datasets:
dq2-ls 'data10_7TeV*physics*MinBias*merge*AOD*‘ Find location of container datasets (groups of datasets, ending with a '/' ):
dq2-list-dataset-replicas-container data10_7TeV.00152489.physics_MinBias.merge.AOD.f241_p115/
List files in container dataset: dq2-ls –f data10_7TeV.00152489.physics_MinBias.merge.AOD.f241_p115/
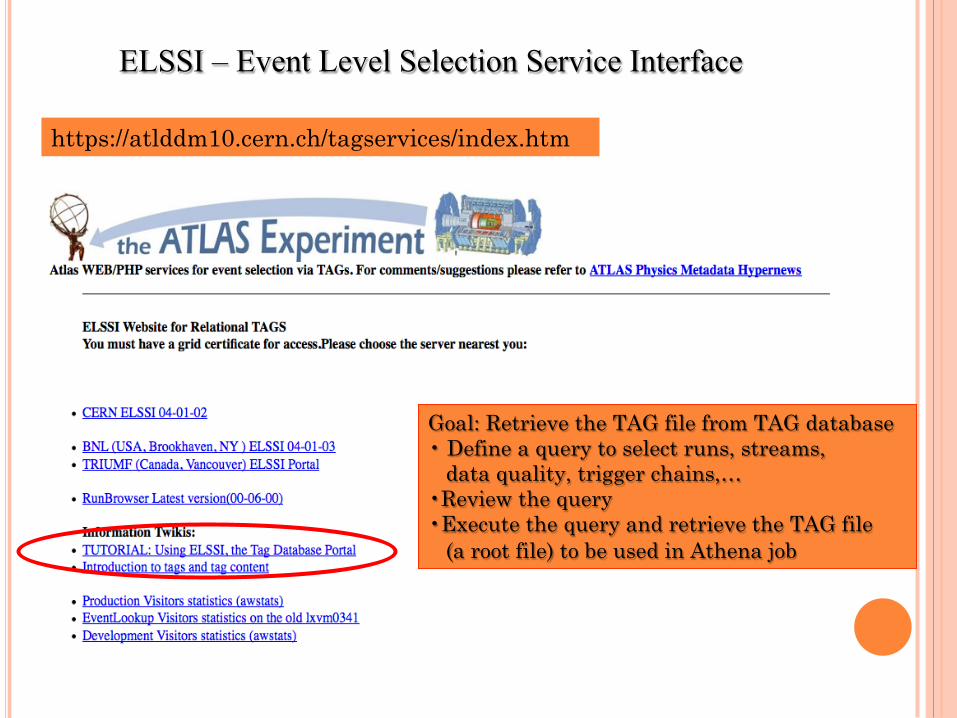
https://atlddm10.cern.ch/tagservices/index.htm
Goal: Retrieve the TAG file from TAG database • Define a query to select runs, streams, data quality, trigger chains,… • Review the query • Execute the query and retrieve the TAG file (a root file) to be used in Athena job
ELSSI – Event Level Selection Service Interface
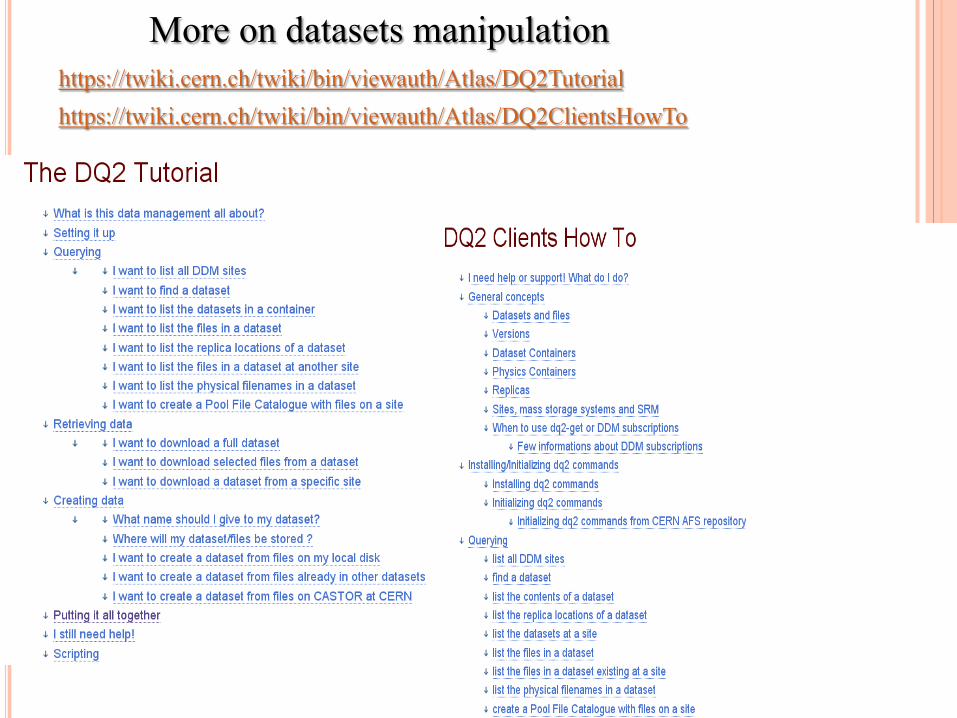
https://twiki.cern.ch/twiki/bin/viewauth/Atlas/DQ2Tutorial https://twiki.cern.ch/twiki/bin/viewauth/Atlas/DQ2ClientsHowTo
More on datasets manipulation
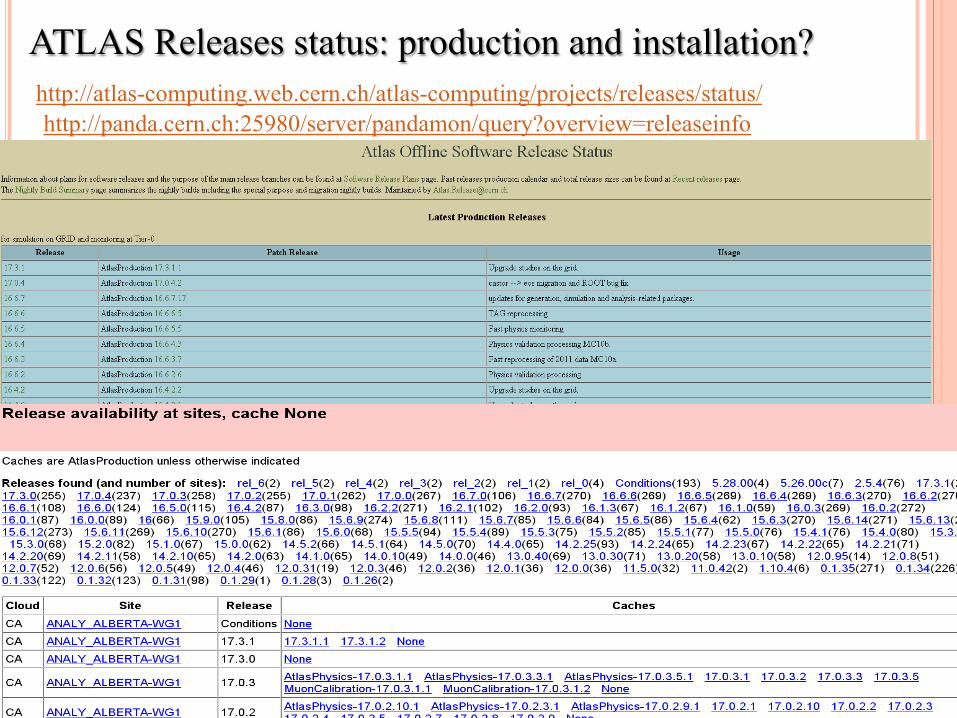
ATLAS Releases status: production and installation? http://atlas-computing.web.cern.ch/atlas-computing/projects/releases/status/ http://panda.cern.ch:25980/server/pandamon/query?overview=releaseinfo
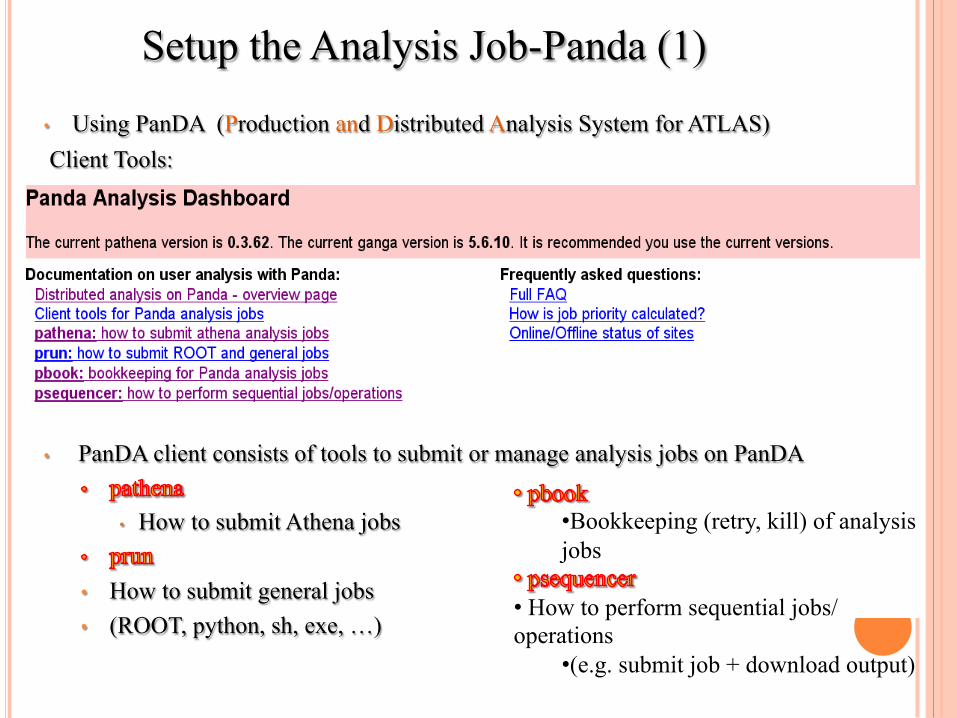
• Using PanDA (Production and Distributed Analysis System for ATLAS) Client Tools:
• PanDA client consists of tools to submit or manage analysis jobs on PanDA
• How to submit Athena jobs
• How to submit general jobs • (ROOT, python, sh, exe, …)
• Bookkeeping (retry, kill) of analysis jobs
• How to perform sequential jobs/operations
• (e.g. submit job + download output)
Setup the Analysis Job-Panda (1)
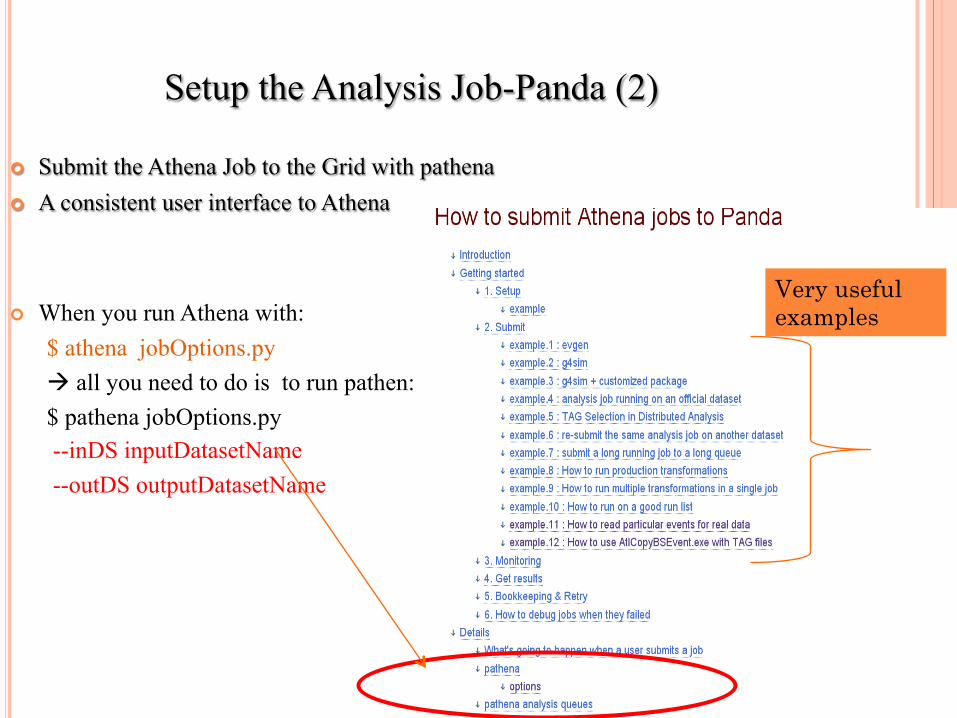
¢ Submit the Athena Job to the Grid with pathena ¢ A consistent user interface to Athena
¢ When you run Athena with:
$ athena jobOptions.py à all you need to do is to run pathen: $ pathena jobOptions.py --inDS inputDatasetName --outDS outputDatasetName
Very useful examples
Setup the Analysis Job-Panda (2)
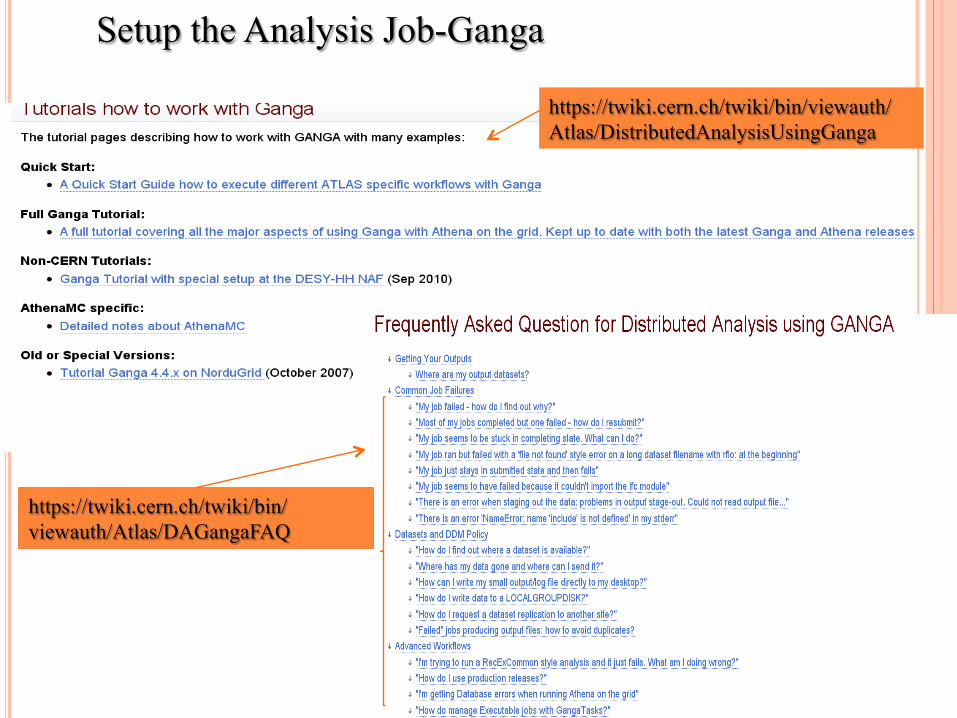
https://twiki.cern.ch/twiki/bin/viewauth/Atlas/DAGangaFAQ
https://twiki.cern.ch/twiki/bin/viewauth/Atlas/DistributedAnalysisUsingGanga
Setup the Analysis Job-Ganga
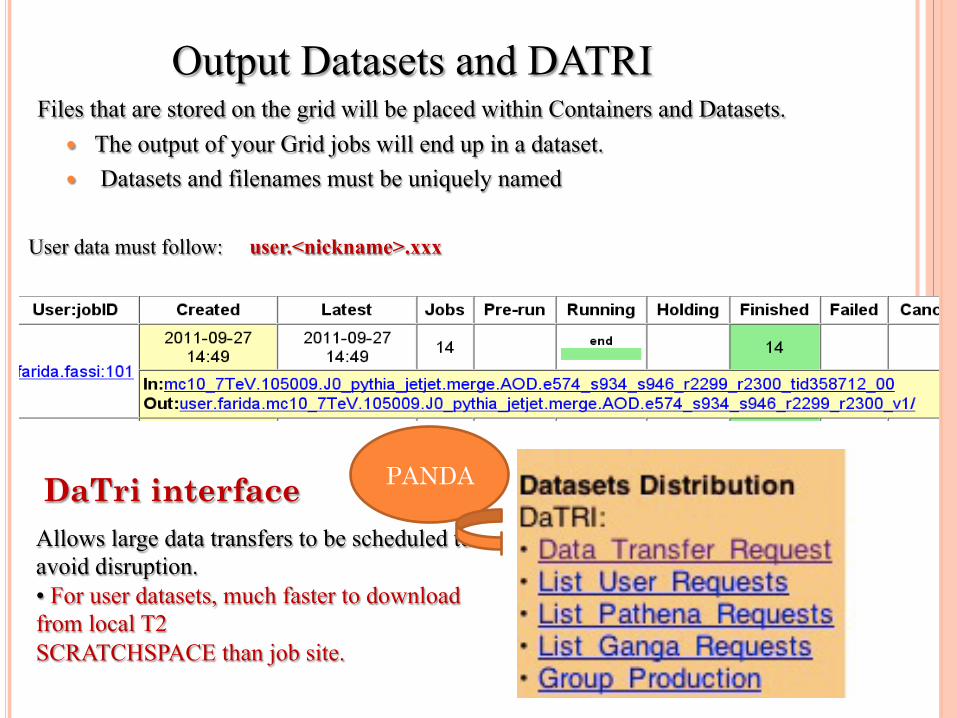
Files that are stored on the grid will be placed within Containers and Datasets. � The output of your Grid jobs will end up in a dataset. � Datasets and filenames must be uniquely named
User data must follow: user.<nickname>.xxx
Allows large data transfers to be scheduled to avoid disruption. • For user datasets, much faster to download from local T2 SCRATCHSPACE than job site.
DaTri interface PANDA
Output Datasets and DATRI
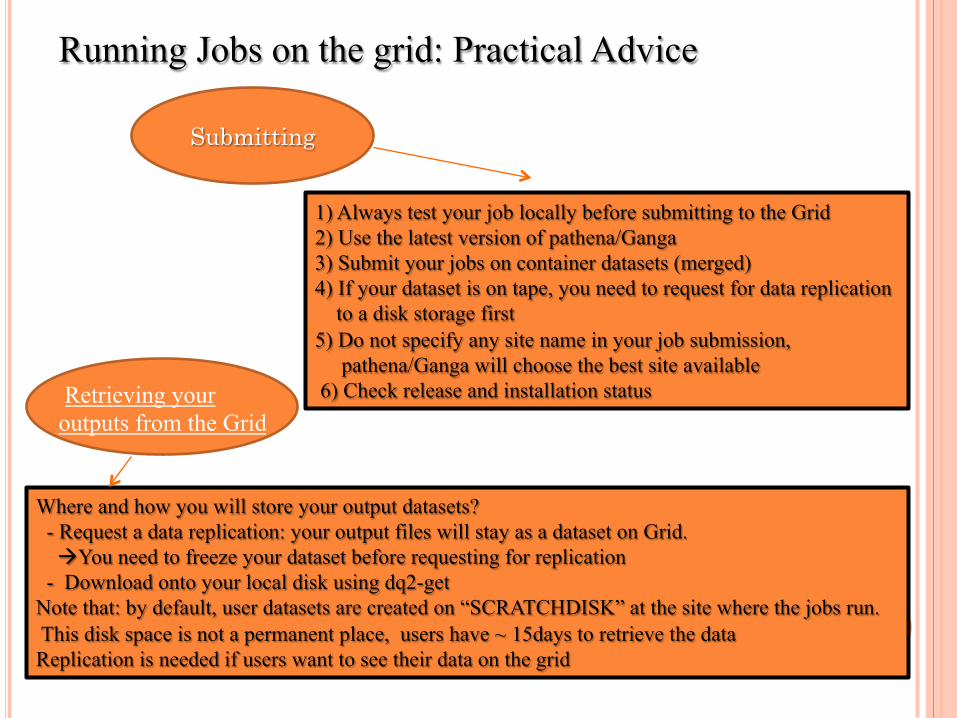
Running Jobs on the grid: Practical Advice
1) Always test your job locally before submitting to the Grid 2) Use the latest version of pathena/Ganga 3) Submit your jobs on container datasets (merged) 4) If your dataset is on tape, you need to request for data replication to a disk storage first 5) Do not specify any site name in your job submission, pathena/Ganga will choose the best site available 6) Check release and installation status
Submitting
Where and how you will store your output datasets? - Request a data replication: your output files will stay as a dataset on Grid. àYou need to freeze your dataset before requesting for replication - Download onto your local disk using dq2-get Note that: by default, user datasets are created on “SCRATCHDISK” at the site where the jobs run. This disk space is not a permanent place, users have ~ 15days to retrieve the data Replication is needed if users want to see their data on the grid
Retrieving your outputs from the Grid
¢ https://twiki.cern.ch/twiki/bin/viewauth/Atlas/EventTagTutorial2008OctoberBrowser ¢ https://twiki.cern.ch/twiki/bin/view/Atlas/RegularComputingTutorial
¢ DQ2: � https://twiki.cern.ch/twiki/bin/view/Atlas/DQ2ClientsHowTo � https://twiki.cern.ch/twiki/bin/view/Atlas/DQ2Tutorial
¢ DA on PanDA: ¢ https://twiki.cern.ch/twiki/bin/viewauth/Atlas/DAonPanda ¢ https://twiki.cern.ch/twiki/bin/view/Atlas/FullGangaAtlasTutorial ¢ https://twiki.cern.ch/twiki/bin/view/Atlas/DQ2ClientsHowTo#AfterCreatingDataset ¢ Get help ¢ Subscribe to atlas-dist-analysis-help forum : ¢ https://twiki.cern.ch/twiki/bin/view/Atlas/AtlasDAST
Useful links
Tutorials

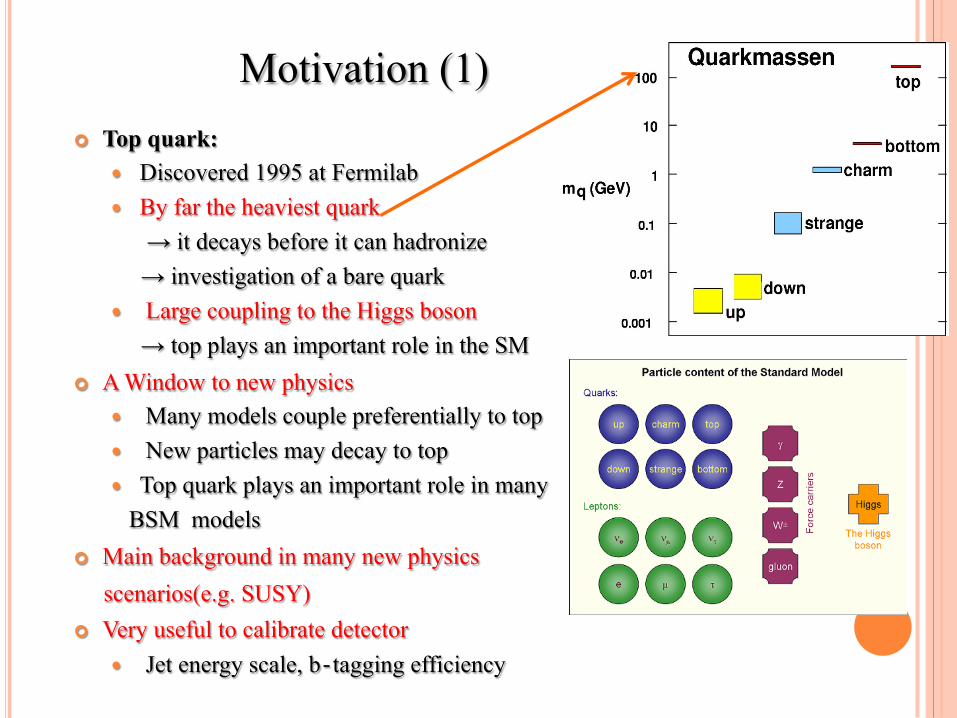
¢ Top quark: � Discovered 1995 at Fermilab � By far the heaviest quark → it decays before it can hadronize → investigation of a bare quark � Large coupling to the Higgs boson → top plays an important role in the SM
¢ A Window to new physics � Many models couple preferentially to top � New particles may decay to top � Top quark plays an important role in many BSM models
¢ Main background in many new physics scenarios(e.g. SUSY) ¢ Very useful to calibrate detector
� Jet energy scale, b‐tagging efficiency
Motivation (1)
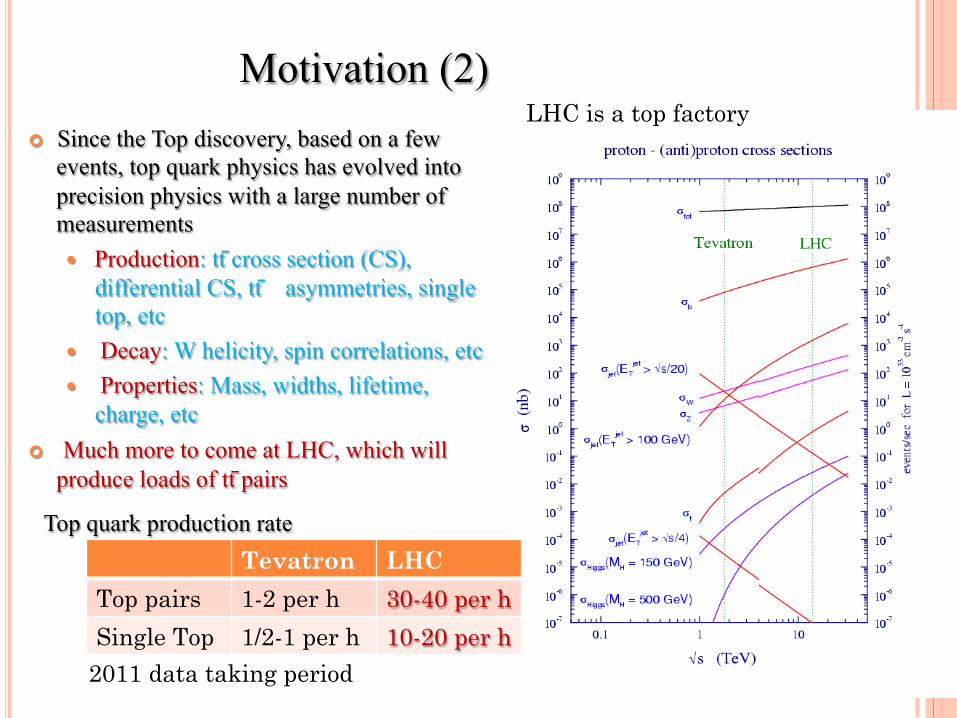
¢ Since the Top discovery, based on a few events, top quark physics has evolved into precision physics with a large number of measurements � Production: tt̄ cross section (CS),
differential CS, tt̄ asymmetries, single top, etc
� Decay: W helicity, spin correlations, etc � Properties: Mass, widths, lifetime,
charge, etc ¢ Much more to come at LHC, which will
produce loads of tt̄ pairs
Motivation (2)
Tevatron LHC
Top pairs 1-2 per h 30-40 per h
Single Top 1/2-1 per h 10-20 per h
2011 data taking period
Top quark production rate
LHC is a top factory

¢ Top decay ~100% àWb ¢ decay channels: (3 leptons, 2 quark families, 3 colour, 2 branches)
¢ dileptonic: 3x3 = 9 → 11 % ¢ semileptonic:3x2x3x2 = 36 → 44 % ¢ all-hadronic :2x2x3x3 = 36 → 44 %
Top pairs Decay Channels
¢ Dilepton channel (without tau) ¢ 5%: 2 charged leptons, 2 jets, 2 ν
¢ lepton+jets channel (without tau) ¢ 30%: 1 charged leptons, 4 jets, 1 ν
¢ all-jets channel ¢ 44%: 6 jets (At least 2 jets are b jets)
Analysis strategy depends on W decay modes:
¢ Experimantal Signatures Σ = 81
¢ Top quark pair production via strong interaction(dominant process)
¢ Electroweak production of single top quarks (factor 2-3 smaller than pair prod.)
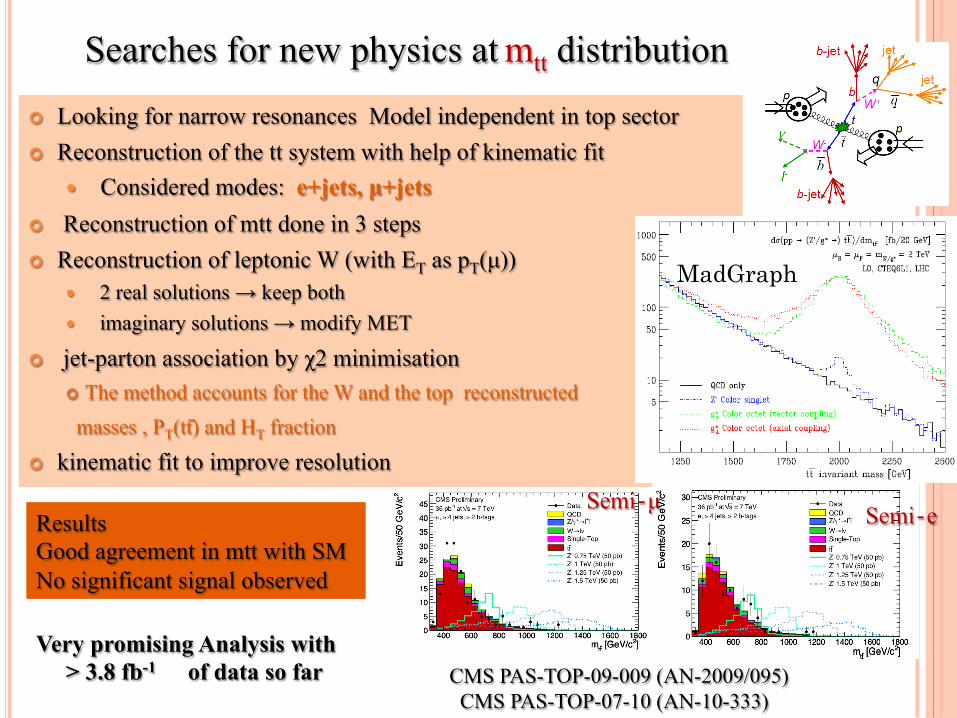
¢ Looking for narrow resonances Model independent in top sector ¢ Reconstruction of the tt system with help of kinematic fit
� Considered modes: e+jets, µ+jets ¢ Reconstruction of mtt done in 3 steps ¢ Reconstruction of leptonic W (with ET as pT(µ))
� 2 real solutions → keep both � imaginary solutions → modify MET
¢ jet-parton association by χ2 minimisation ¢ The method accounts for the W and the top reconstructed masses , PT(tt̄) and HT fraction
¢ kinematic fit to improve resolution
Results Good agreement in mtt with SM No significant signal observed
Semi‐e Semi‐µ
MadGraph
Very promising Analysis with > 3.8 fb-1 of data so far
Searches for new physics at mtt distribution
CMS PAS-TOP-09-009 (AN-2009/095) CMS PAS-TOP-07-10 (AN-10-333)

¢ Charge asymmetry is sensitive to the left-right couplings in top pair production ¢ Different left and right handed couplings of a beyond-SM resonance lead to different rapidity distributions of top and anti-top. ¢ Z' or axigluons are candidates for this effect
Searches for new physics at Charge asymmetry tt production (1)
¢ At Tevatron a forward-backward asymmetry is measured using tt rapidity difference Δy
¢ Large asymmetry value found with a deviation from SM of ~2σ. ¢ For events with Mtt>450 GeV the deviation from SM is ~4σ [hep-ex/1101.0034]
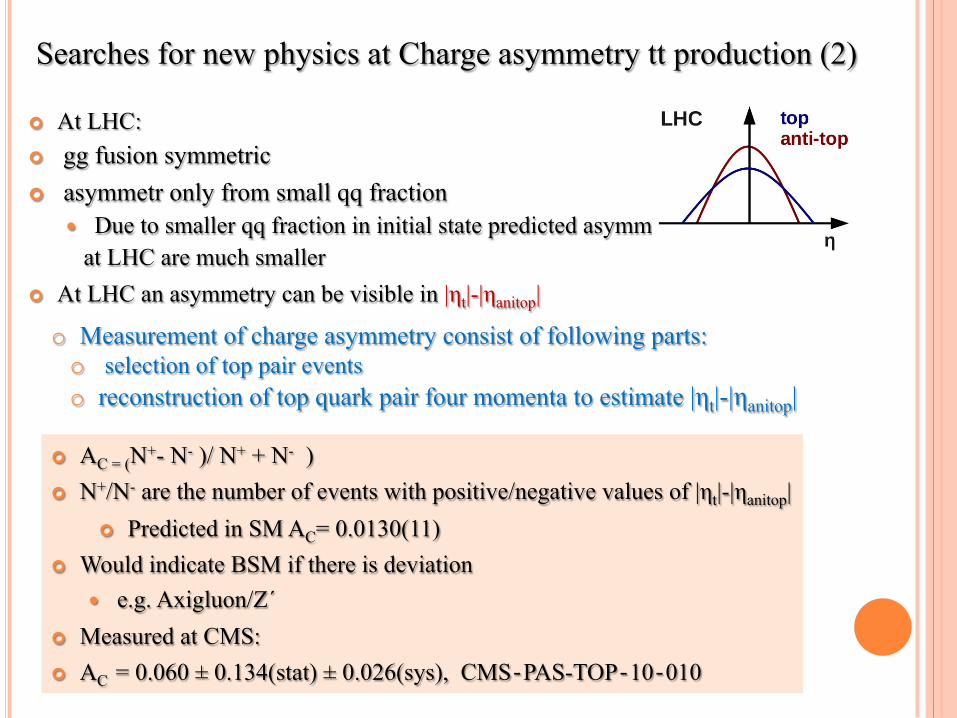
¢ At LHC: ¢ gg fusion symmetric ¢ asymmetr only from small qq fraction
� Due to smaller qq fraction in initial state predicted asymmetries at LHC are much smaller
¢ At LHC an asymmetry can be visible in |ηt|-|ηanitop|
Searches for new physics at Charge asymmetry tt production (2)
o Measurement of charge asymmetry consist of following parts: o selection of top pair events o reconstruction of top quark pair four momenta to estimate |ηt|-|ηanitop|
¢ AC = (N+- N- )/ N+ + N- )
¢ N+/N- are the number of events with positive/negative values of |ηt|-|ηanitop| ¢ Predicted in SM AC= 0.0130(11)
¢ Would indicate BSM if there is deviation � e.g. Axigluon/Z´
¢ Measured at CMS: ¢ AC = 0.060 ± 0.134(stat) ± 0.026(sys), CMS‐PAS-TOP‐10‐010
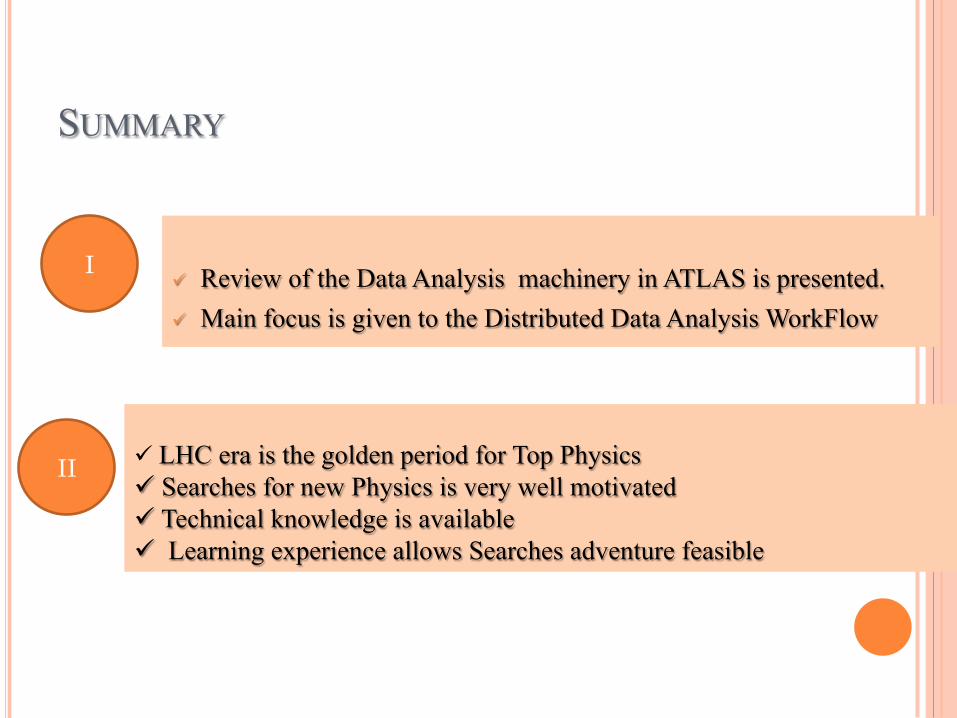
SUMMARY
ü Review of the Data Analysis machinery in ATLAS is presented. ü Main focus is given to the Distributed Data Analysis WorkFlow
ü LHC era is the golden period for Top Physics ü Searches for new Physics is very well motivated ü Technical knowledge is available ü Learning experience allows Searches adventure feasible
I
II
Dynamic data placement: ¢ Pre-defined, static data distribution according to fixed shares of certain data
types found to be inefficient � lots of data is centrally distributed to many sites but hardly used � lots of data gets used but not covered by central distribution
¢ DatRI: User/group dataset replication triggered by users ¢ System in DQ2, large volumes must be confirmed by local managers ¢ – users copy only data they really need (in general …) ¢ PD2P: Panda dynamic data placement replication based on analysis request
� triggers replication of popular datasets to different site most T2 data to be replicated this way
ATLAS Computing changes