Embed Size (px)
Citation preview

Distr. RESTRICTED
LC/R. 675 2 August 1988
ORIGINAL: ENGLISH
E C L A C
Economic Commission for Latin America and the Caribbean
WATER SUPPLY AND SANITATION FOR THE POOR: THE ACHIEVEMENTS OF THE INTERNATIONAL DRINKING WATER SUPPLY AND SANITATION
DECADE IN LATIN AMERICA AND THE CARIBBEAN
*/ This document has been prepared by the Water Resources Unit, Division of Natural Resources and Energy, Economic Commission for Latin America and the Caribbean, for the Seminar on Water Supply and Sanitation for Low-Income Populations in Rural and Periurban Areas to be held in Olinda, Pernambuco, Brazil, 29 September-5 October 1988.
88-8-1046


iii
Page
1. Introduction 1
(a) The situation at the beginning of the decade 1 (b) The targets of the Decade 2 (c) The financial restraint 3
2. The achievements so far 4
(a) The reasons for the lack of progress 4 (b) The significance of the negative economic climate 4
3. The poor and the Decade 6
(a) Who are the poor? 6 (b) Where do the poor live? .8
4. What can be done? 10
5, Conclusions 11


1
1. Introduction
At the beginning of the International Water Drinking Water Supply and Sanitation Decade, Latin America and the Caribbean were relatively well provided with water supply and sanitation facilities compared with the other regions of the developing world. Nevertheless, many millions of the citizens of the countries of the region remained without a protected source of drinking water and even more suffered the absence of safe and decent facilities for the disposition of excreta. This was especially true for the low income population in both urban and rural areas. The programmes developed under the Alliance for Progress and continued in the 1970's were largely directed towards the provision of urban supply and to the delivery of water and sewerage services by traditional means.
It can Justifiably be claimed that this conventional technology centred around large piped systems served the region well. The reduction in the expansion of service in more recent years in most countries of the region raises questions, however, about the nature of the policies being applied. There is a need to reconsider the approach being taken and, perhaps, to introduce innovations in the means of delivery of drinking water supply and services.
This paper critically examines the recent behavior of the sector within the context of the goals of the International Drinking Water Supply and Sanitation Decade (IDWSSD). Consideration is given to the achievements of the sector and to its failures. Specifically, attention is drawn to the needs of the poor rural and peri-urban populations. The satisfaction of the needs of the poor is discussed with reference to the wider social and economic problems facing the region, particularly the recession and the accompanying problem of capital shortage.
(a) The situation at the beginning of the decade
By 1980, relatively well organized water supply and sanitation institutions were operating in most of the countries of the region. Usually, these institutions were organized within the central government with responsibility for both drinking water supply and sanitation. There were exceptions as in Brazil where the institutions were organized within the states and in Colombia where the municipalities continue to be the most important providers of water supply and sanitation services. It was characteristic everywhere, however, that the institutions primarily directed their efforts towards the satisfaction of the needs of the urban population through the use high capital cost centralized water supply and sewerage systems

the satisfaction of the needs of the urban population through the use high capital cost centralized water supply and sewerage systems.
In the urban areas of most countries of the region high levels of service had been achieved, particularly in water supply where 71 percent of the population were served with house connections (Table 1). The situation was not, ^Y£M?fkn§9sjsatisfactory in the provision of sewerage, only 59 p e r c é n t ^ - ^ ^ r ^ i r b a n population with service, although mrjm>s the,4daU understates, the ,realrtexistence pi adequate iíftfvtduáí^cfSta a t ëà r^ s s progress had Í M Í P f e ; í t ó h M h ^ in many
SÜptí|rsysterris; were being ¥mW$è0ê witnottt à safe
support for
M . r i p t | : " ^ h â ü ê r f i | a f e i In^evîiirgef^f^^^ in many
{^kjFÍ< rr"very-'WnMn^ssSSs?W "Mptut̂ hal
m^ "Brwrwmml w^w&fâtòn- of fe %<kikr\W%*M^*rmm fròpòrtíon of
rural population, and lower incomes, Háíft^/fa^agüay1, Bolívia and Wmm. mfWm 0hèm m¥mtâ**$ "W* W levels of fèrvicrto" be sana fòF^hirrurâl p< l íOfH ÏU 316SV î a s O S ' l S l u m i l ! y*?ÎY133
te ciïftsm 3íii ni sfíoiífivonni ^Di.¿boiJni oj By 1980, the majority ¿gbf-fòfe $8pç.tr£q< #t the region had set
a#^nat£íarftetsio(ojéi4^f Pfiçade. ^ e s ^ ^ g s t ç Çay£jbe$n .adjusted since %&çmm$k$MiJ$ f^sffen^iiirngactïoofeiihi gfipecally-s^egatiye overall e^^fis^^tfcojjQifcb^ mm&mislmff^mAíWmi M W*ímtâtt& p^nlhftf^lnaisftoal^ejiaîj ^ ^ time9pf^he0Ma^5í|el Plata Cfáaf&M&Bluqaq n6d.iu-iisq bas lóií.j-1 iooq $>ni io ^-.-¡i -v.f.= -.. adi oi yonsiatsa riiiw bszziryeib ei IÜOQ sríj ïo zuma OÍÚ L ^v-..:", <.;'.".• srií vft»»!#fe<fn jawj|&M#& Wteg^£^«MâU&&i**&u9te. quality a»d basic sanitarY9J|<$|Jes [$ |WBl?f rff^0^íf!^^tix^ Vfoj V** ^ ^ privileged.1 "'
The differeriPiafPt#4érJ th#üêiíéaw%^pteâfe-by^'1 the" èduritries of Latin America and the Caribbean can be summarized as follows, rioi jàflíjifcThèrtfcròAhSlètt ÔP- %àfe DdrÍtt!tM| water1 to j9i$ of the urban ptfpüíatíoíí ¡- êS% WW&ïvëêilhïm&mouik aótóieefâòns; íí.üa^fl) The prdvlgtón W:lsâ^è"°driftKihg \^áte¥ í!tb 56% of the rural
ííoí^(f^'iThe^provïâdry of "sewerage %r 6tM^è£erèíà disposai services to &^ of^lhê^úrM^ pTó^atfôh; n'"" ? ^ « Í

Tahlo i LATIN AMERICA AND THE CARIBBEAN, PROVISION OF WATER SUPPLY & SANITATION. 1900
WATER SUPPLT SEWCRAGC AND SANITATION Total Paa» latían eerved" Urtaa Papulation Rarol Popalatlaa
Total Houca Eeeu, Total Total Hou sa Eeoy Total Total Total TotOl Urban Rural Country Population Connection Accasa Servad X Population Connection X Acema X Served X Population Served X Served X Served X Served X
Argentina 27.94 13.38 1.44 14.82 53 23.19 13.30 58 0.65 3 14.03 61 4.75 0.79 17 20.21 72 1656 80 1.65 35 Bahamas 022 0.11 0.02 0.13 59 0.14 0.11 79 0.02 14 0.13 93 0.00 - 0 0.12 55 0.12 06 -Barbados 024 0.08 0.16 0.24 100 0.08 0.08 100 0.00 0 0.00 100 0.17 0.16 94 - 100 . - -Balte» 0.15 0.05 0.05 0.10 67 0.07 0.03 71 0.03 43 0.00 114 0.07 0.03 43 0.10 67 0.05 71 0.06 06 Bolivia 560 0.60 145 2.05 37 2.40 0.60 24 1.13 45 1.73 69 3.11 0.32 10 1.04 19 0.92 37 0.12 4 Brazil 119.10 64.61 22.00 06.61 73 00.48 64.61 80 2.40 3 67.01 83 38.62 19.60 51 26.30 22 25.91 32 0.39 1 Colombia 27 00 1104 11.27 23.11 66 17.28 11.84 69 416 24 16.00 93 9.72 7.11 73 16.37 61 16 00 93 0.37 < Costa Rice 222 1.30 0.76 2.06 93 1.33 1.30 90 0.03 2 133 100 0.09 0.73 02 2.07 93 1.32 99 0.75 64 Chila 1120 8.42 1.01 9.43 04 9.07 8.42 93 0.65 7 9.07 100 2.13 0.36 17 9.24 83 9.03 100 0.21 10 Dominican Rap 543 1.64 159 3.23 59 2.75 1.64 60 0.69 25 233 85 2.60 0.90 34 0.80 13 0.69 25 0.11 4 Ecuador 8 12 2.77 1.10 387 40 3.82 2.77 73 0.25 7 3.02 79 4.30 0.85 20 3.54 44 2.80 73 0 7 4 17 El Salvador 4.34 1.17 1.16 2.33 51 1.90 1.17 62 0.11 6 1.20 67 2.64 1.05 40 1.60 35 0 91 40 0.69 26 Guatemala 726 1.38 1.86 3.24 45 2.69 1.30 51 1.03 38 2.41 90 4.57 0.03 10 2.14 29 1 22 45 0.92 20 Guyana 0.79 0.35 0.20 0.63 00 0.39 0.33 90 0.04 10 0.39 100 0.40 0.24 60 0.61 77 0.28 72 0.32 00 Halt! 4.91 0.33 0.56 0.89 10 1.20 0.33 20 0.20 23 0.61 51 3.71 0.20 8 0.87 10 050 42 0.37 10 Honduras 3.75 0 70 1.52 2.22 59 1.36 0.70 51 0.96 41 1.26 93 2.39 0.96 40 1.29 34 0.67 49 0.62 26 Jamaica 225 0.62 0.51 1.13 SO 1.13 0.62 55 0.00 0 0.62 55 1.12 0.31 46 0.15 7 0 13 12 0.02 2 Maxico 70 12 20.39 2276 51.15 73 45.79 20.39 62 13.03 28 41.42 90 24.33 9.73 40 38.37 35 33 45 77 292 12 Nicaragua 273 0.97 0.08 1.05 30 1.46 0.97 66 0.01 1 0.90 67 1.27 0.07 6 0.50 10 050 34 -Panama 192 0.84 0.72 1.56 01 0.94 0.04 89 0.11 12 0.95 101 0.90 0.61 62 1.36 71 0 78 03 aso 39 Paraguay 306 0.45 0.17 0.62 20 1.15 0.45 39 0.00 0 0.45 39 1.91 0.r7 9 2.61 05 1.09 95 1.52 00 Paru 16.02 5 82 2.31 8 13 40 10.21 5.82 57 1.10 11 692 68 661 1.21 10 5.88 33 5.86 57 0.02 0 Suri ñama 035 0.09 0.22 0.31 09 0.10 0.09 90 0.01 10 0.10 100 0:25 0.20 80 0.30 86 0.10 100 0.20 00 Trinidad 1.10 0.55 0.32 1.07 97 0.70 0.5S 79 0.15 21 0.70 100 0.40 0.37 93 1.02 93 0.67 96 0 35 08 Uruguay 2.94 2.19 0.17 ¿36 00 2.44 2.19 90 0.16 7 2.35 96 0.50 0.01 2 1.47 50 1.44 59 0.03 6 Venezuela 15.02 9.80 2.87 12.67 04 11.89 9.00 02 1.20 10 11.00 93 3.13 1.67 53 7.47 SO 7.09 60 0.30 12
TOTAL 344.78 150.45 76.56 235.01 60 22405 158.45 71 27.80 12 166.23 83 120.73 48.76 40 143.43 42 13209 59 13.34 11 Source: PAHO 'Population In millions

4 (iv) The provision of means for the sanitary disposition of
excreta to 31% of the rural population.2
The Pan American Health Organization has estimated that the achievement of these targets implies the need to provide water supplies to 99 million people in urban areas and 21 million in rural areas. Some 85 million uçrban dwellers and 26 million rural must be provided with sanitation.3
It was estimated in 1985, again by PAHO, that the total investment required during the remainder of the Decade in order to reach the national targets would be some 30 billion united states dollars. In addition, however, considerable sums will be required for the maintenance of the existing systems. The cost of maintenance of existing systems probably lies between US$2 billion and US$8 billion a year. Taking new investment and maintenance requirements together, there is an additional demand of from US$40 to US$70 billion for the sector In the rest of the Decade.
(c) The financial restraint
At the beginning of the Decade, it was obvious that, for many countries in the région, the achievements of the goals of the Decade and even of the specific national targets would be very dependent on the financial resources made available. The very existence of the Decade implied a reconsideration of the priority given water supply and sanitation Investments even beyond that already given during the 1960's and 1970's.
It was estimated that, for the region as a whole, the level of Investment required, using conventional technology, to achieve the targets set for the Decade by the countries in 1980 was some one and half to two half times the level achieved between 1970 and 1977.4 In some, mainly poorer, countries it would be very much higher. Such increases in the amount of investment, it was hazarded, could be achieved in most countries of the region if the target was other than complete coverage.5 There would be exceptions, however, particularly among the smaller and poorer countries.
Moreover, it was concluded that the bulk of the required financing would have to be found within the countries themselves. It could not be expected that external sources of finance would provide more than a small amount of the capital required. At the end of the seventies the externar contribution to the sector was equivalent to only 8% of the total and this contribution was heavily concentrated in the larger countries of the region and in urban areas.
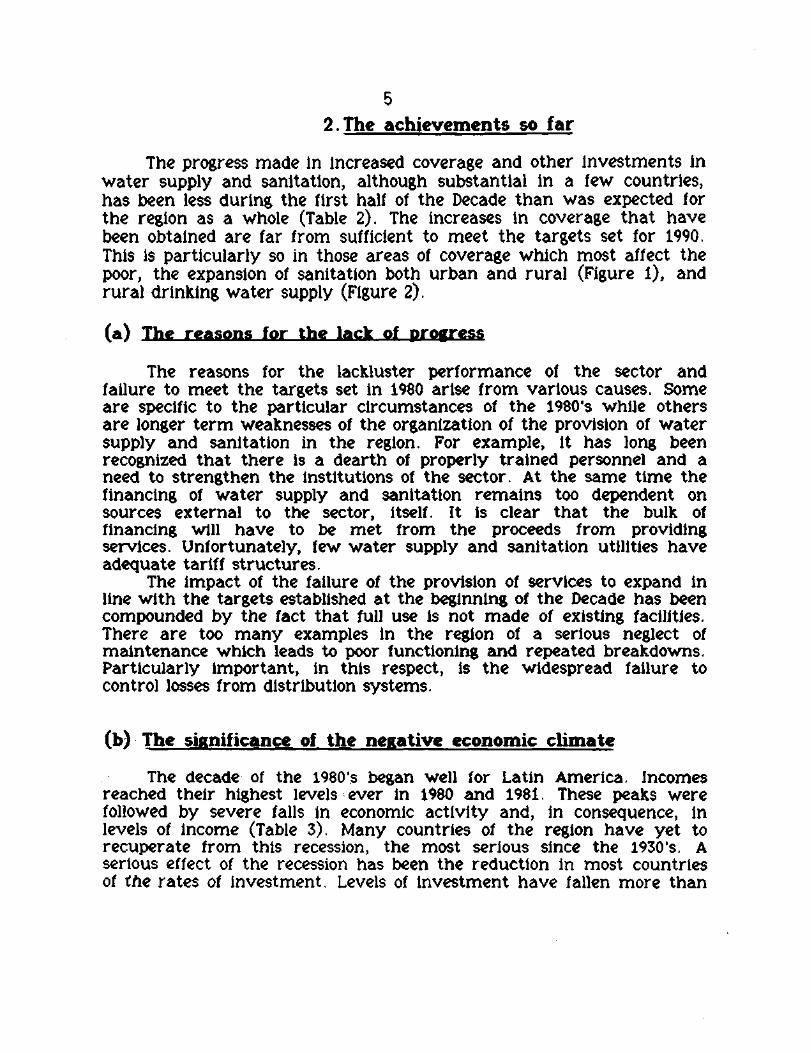
5 2.The achievements so far
The progress made In Increased coverage and other Investments in water supply and sanitation, although substantial in a few countries, has been less during the first half of the Decade than was expected for the region as a whole (Table 2). The increases in coverage that have been obtained are far from sufficient to meet the targets set for 1990. This is particularly so in those areas of coverage which most affect the poor, the expansion of sanitation both urban and rural (Figure 1), and rural drinking water supply (Figure 2).
(a) The reasons for the lack of progress
The reasons for the lackluster performance of the sector and failure to meet the targets set in 1980 arise from various causes. Some are specific to the particular circumstances of the 1980's while others are longer term weaknesses of the organization of the provision of water supply and sanitation in the region. For example, it has long been recognized that there is a dearth of properly trained personnel and a need to strengthen the institutions of the sector. At the same time the financing of water supply and sanitation remains too dependent on sources external to the sector, itself. It is clear that the bulk of financing will have to be met from the proceeds from providing services. Unfortunately, few water supply and sanitation utilities have adequate tariff structures.
The impact of the failure of the provision of services to expand in line with the targets established at the beginning of the Decade has been compounded by the fact that full use is not made of existing facilities. There are too many examples in the region of a serious neglect of maintenance which leads to poor functioning and repeated breakdowns. Particularly important, in this respect, is the widespread failure to control losses from distribution systems.
(b) The significance of the negative economic climate
The decade of the 1980's began well for Latin America. Incomes reached their highest levels ever in 1980 and 1981. These peaks were followed by severe falls in economic activity and, in consequence, in levels of income (Table 3). Many countries of the region have yet to recuperate from this recession, the most serious since the 1930's. A serious effect of the recession has been the reduction in most countries of the rates of investment. Levels of investment have fallen more than

LATIN AMERICA i I THE CAR» To* l« 2
EAR. PROVISION OF WATER SUPPLT * SARITATIOR. I M S
WATER S U m t SEWERA6E ARO SARITATIOR Tatal Papalatlaa aarvaO» l i r b a » * Ranal •
ratal Houaa Eaay Total Urban Houaa Eoau Total Total Total Total Urban Rural Countru PooulatlonConnactlonAccaa» Sarvad S PoaalattonCamMctton RAccaaa « Sarvad S Papulation Sarvad 11 Sarvad S Sarvad «Sarvad xl
ArganMna 3037 I960 1.26 16.06 99 2937 1930 01 0.40 2 16.00 03 5.00 0 3 6 17 21.05 69 19.30 75 1.79 33 Banamaa 055 0.12 0.03 O.IS 69 0.19 0.12 00 0.03 20 0.13 100 0.08 - 0 0.15 65 0.15 100 . Barbado* 0.29 0.00 0.17 0.29 100 0.09 0.09 100 0.00 0 0.09 100 0.16 0.16 100 0.1O too 0.10 111 -Ballca 0.1ft 0.0ft 0.09 0.11 69 0.07 0.06 60 0.02 29 0.00 - 0.09 0.O2 22 0.10 63 0.06 06 0.04 44 Bolivia 6.43 2.11 0.64 2.79 43 3.07 211 09 0.20 7 2.31 75 3.36 0.44 13 1.34 21 1.02 33 032 10 Brazil 134.48 79.90 23.94 103.44 77 97.40 79.90 02 2.91 3 02.01 05 37.08 2033 96 32.50 24 32.10 33 0.40 1 Colombia 27.S0 13.97 11.22 29.19 92 10.10 13.97 77 4.11 23 10.08 100 9.40 7.11 76 1039 60 17.34 96 155 13 Coals Rica 2.46 1.49 0.64 2.29 93 1.40 1.49 00 0.03 2 1.40 100 096 0 3 1 03 2.34 95 1.47 99 037 09 CMla 1217 934 0.99 10.93 07 10.19 9.94 94 0.41 4 9.95 90 1.98 0 3 0 29 1057 04 10.19 100 0.00 4 Dominican Rap 596 («2 1.09 3.67 62 550 1.02 55 0.96 29 2.70 05 £68 0 3 9 33 130 27 1.34 41 056 10 Ecuador 9.30 3.71 1.63 934 97 430 3.71 70 0.22 5 3.93 01 4.30 1.41 31 6.00 65 4.76 90 132 29 El Salvador 4.77 1.51 1.07 230 54 230 1.91 03 0.11 S 132 60 2.39 0.96 40 2.97 62 1.94 02 143 43 Buatamala 7.96 ios 1.04 237 3ft ¿90 1.03 61 0.33 11 2.10 72 4.98 0.71 14 132 23 1.22 41 030 12 6uyana 0.B2 037 031 0.60 03 0.40 0.37 93 0.04 10 0.41 103 0.42 0.27 64 0.73 09 0.40 100 033 79 Haiti 5.27 0.49 1.99 ZOO 30 1.41 0.49 32 0.30 27 0.03 99 3.06 1.17 30 1.10 21 0.59 42 031 13 Hondura» 407 035 1.49 2.00 49 1.44 0.99 30 0.26 10 0.81 56 2.83 1.19 43 155 31 0.33 24 0.90 34 Jamaica 2.10 0.99 1.03 2.02 90 1.10 a99 90 0.10 9 1.09 99 1.00 0.93 99 1.91 91 1.01 92 0.90 90 rtaxlco 79.24 37.45 20.00 69.93 03 9424 37.49 69 16.23 30 53.60 99 25.00 1133 47 44.06 37 41.70 77 3.10 13 Nicaragua 3.27 130 0.27 137 40 137 1.30 70 0.12 6 1.42 7ft 140 0.15 I I 0.00 27 0.65 35 053 16 Panama 2.14 1.04 0.72 1.76 02 1.09 1.04 95 0.05 5 1.09 100 1.09 037 64 0.72 34 1.00 99 034 01 Paraguay 3.39 0.99 0.21 0.00 24 1.10 0.99 SO 0.03 3 0.62 53 Z I 7 0.10 0 2 3 5 05 1.05 09 1.00 03 Paru 19.70 732 2.75 1039 93 1239 732 01 1.93 12 9.19 73 7.19 1.20 17 9 5 9 47 0.40 07 039 12 Sun ñama 0.90 0.24 0.19 0.39 70 034 0.24 71 0.00 0 0.24 71 0.16 0.15 94 0 5 0 56 0.27 79 0.00 SO Trinidad 1.76 0J67 0.40 1.15 60 030 0.67 04 0.13 16 0.80 100 0.30 0 3 6 99 1.16 66 0.00 100 036 99 Uruguay 297 2.19 0.2B 2.47 03 2.46 219 09 0.14 6 2.33 95 0.31 0.14 27 1.74 59 1.44 59 030 59 Vanaiuala 16.47 1155 3.09 14.34 f? 12.73 11.29 00 0.66 5 11.01 90 3.72 2.43 69 7.47 45 7 5 7 57 050 9
TOTAL 303.08 196.41 0*08 201.09 ** 26157 196.42 75 29.40 11 22S32 06 1*2.13 99.27 4S 173.15 45 156.00 60 1052 19 Seurca: PAHO "Populattor In miltona
CTv
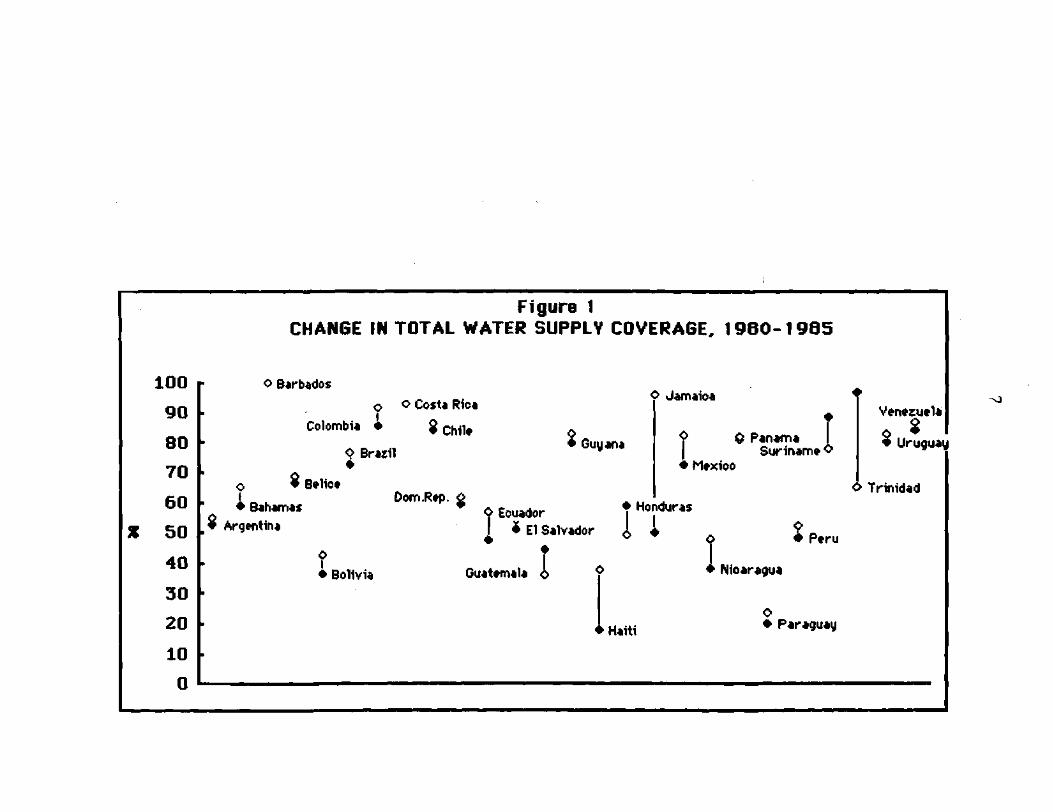
Figure 1 CHANGE IN TOTAL WATER SUPPLY COVERAGE, 1 9 6 0 - 1 9 8 5
100 r
90 •
80
70
60 h
50
40 Y
30
20 -
10 •
0
O Barbados
Colombia •
o o Costa Rica O Jamaica
S Chile
O Brazil I Guyana
o * Belice l • Bahamas
Dom .Rep. O
$ Panama Suriname O
• Mexico
, * Argentina 9 Ecuador I «El
O I • Bolivia
Ecuador Salvador •
• Honduras
A 1
Venezuela o
o • • Uruguay
O Trinidad
9 • Peru
Guatemala o • Nioaragua
• Haiti • Paraguay

Figuro 2 CHANGE IN RURAL WATER SUPPLY COVERAGE, 1 9 8 0 - 1 9 8 5
100 r î • Barbados o Jamaica O $ Trinidad 90
r î • Barbados o Jamaica O $ Trinidad
80 O Costa Rica
g Colombia • Suriname
70
O Costa Rica
g Colombia
60 <> Guyana Ô Panama
% 50
40
30
% Brazil _ Venezuela • Honduras o • J
B e , , C e O El Salvador * •Mexico Dom .Rep ô
O ? Ecuador o Haiti i l l ^ Uruguay
20 " o Argentina A • Chile J Guatemala © Peru
10
0 1 C"Bahama
* Bolivia i J O Paraguay Nicaragua • ^
10
0 1 C"Bahama
oo

9 proportionate with the decline in gross domestic product at the beginning of the decade. Moreover, levels of investment have remained low in many countries (Table 4). This fall in the level of investment is one of the consequences of the large transfers of resources involved in the payment of interest on the external debt.
Table 3 PER CAPITA GROSS DOMESTIC PRODUCT, AT CONSTANT
MARKET PRICES*
Dollars at 1980 prices Countrv 1970 1976 1980 1981 1982 1983 1984 1985 1986 1?87*>
Argentina 2694 2848 2951 2700 2519 2542 2565 2412 2523 2549
Barbados 2726 2697 3340 3249 3057 3033 3120 3123 3275 3239 Bolivia 686 785 766 749 708 645 622 595 562 556 Brazil 1312 1639 2056 1941 1915 1827 1889 2001 2119 2140 Colombia 925 1090 1265 1266 1251 1248 1268 1288 1335 1376 Costa Rica 1205 1409 1557 1476 1328 1324 1388 1362 1383 1386 Chile 2129 1777 2324 2405 2055 2010 2095 2110 2187 2266 Ecuador 758 1206 1421 1432 1407 1350 1375 1401 1404 1323 £1 Salvador 722 824 775 702 656 654 663 666 661 664 Guatemala 856 978 1128 1107 1040 984 957 925 900 896 Guyana 658 713 616 600 524 461 479 479 . . . Haiti 180 196 235 225 213 211 208 205 203 202 Honduras 548 561 667 650 615 592 584 575 566 572 Jamaica 1601 1567 1216 1226 1207 1205 1188 1112 1120 1159 México 1807 2099 2538 2694 2612 2443 2473 2478 2327 2299 Nicaragua 977 1068 750 702 656 654 663 666 661 650 Panamá 1378 1498 1766 1797 1844 1804 1758 1791 1806 1797 Paraguay 767 951 1318 1388 1333 1253 1253 1263 1222 1237 Perú 1066 1181 1190 1210 1182 1016 1038 1035 1090 1139 Rep. Dominicana 756 1021 1141 1158 1145 1174 1150 1098 1093 1143 Trinidad&Tobago 3392 4175 5390 5349 5320 4757 4398 4215 * t t . . * Uruguay 1790 1990 2415 2434 2174 2028 1989 1970 2085 2187 Venezuela 4695 3598 3377 3243 3112 2861 2742 2648 2716 2686
1937 Average 1518 1761 2045 2012 1944 1852 1878 1901 1928
2686
1937
Source: ECLAC a Figures in bold indicate peak levels of per capita income b Preliminary estimate
It can be expected that the fall in the overall level of investment, by upto half compared with the peaks years at the beginning of the 1980's in many countries, has been felt in the water supply and sanitation sector. Moreover, it can be anticipated that the impact of lower capital investment has not only affected the expansion of water

10 supply and sewerage networks, but also the maintenance of existing systems. Unfortunately, precise information on the effects of the recession on the levels of investment in the sector are not available, but the impact can be seen in the slowing down of the impetus of expansion in the population served that had been achieved in the 1970's. PAHO has estimated, on the basis oí the provision oí counterpart funds to the loans of the InterAmerican Development Bank and the World Bank, that there was an overall investment shortfall in the first half of the Decade of some US$4.5 billion if the original national targets are to be met.6
3. The poor and the Decade
The relatively poor performance of the sector raises fears that the lower income groups of the population, the poor, have borne the brunt of the loss. The poor form a large proportion of the population of the majority of the countries of the region and have been in general the major sufferers from the recession of the 1980's.
(a) Who are the poor?
Estimating the number of poor people is not easy. It is obvious that large numbers of the population of Latin America and the Caribbean are poor, even destitute. To go, however, from this qualitative statement to a more precise estimate of the size and distribution of the poor has rarely been done. There is in fact only one regional study using comparative data and this study only provides information for around 1970.7 In this study, it is estimated that approximately 40 percent of the population of Latin America is poor in an absolute sense (Table 4). This proportion of the population are incapable of satisfying their basic needs for food, shelter, clothing, health, education etc.,8 Some 20 percent of the population were estimated to be destitute, that is unable even to buy a minimum basket of foods.
Altimir could only provide estimates, however, for a small group of countries (Table 4). The countries included in the study accounted, however, for more than 82 percent of the total population of the region, some 231 millions. The Incidence of poverty shown by the study is depressing, particularly in those countries where half or more of the population were unable to satisfy their basic needs, reaching even 65 percent.of the whole population of Honduras.
Does the situation revealed by Altimir still exist almost twenty years later? The answer would seem, unfortunately, to be, yes The situation may be worse as there are indications that the distribution of income has worsened with the recession of the 1980's as per capita incomes have declined and unemployment increased. In many countries

11 per capita incomes are little or no higher than they were in the 1970's (Table 3). In Argentina, Bolivia, El Salvador, Guyana, Jamaica, Nicaragua and Venezuela per capita incomes in 1986 were actually below the level of 1970.
Table 4: SELECTED COUNTRIES: ESTIMATES OF THE INCIDENCE
OF POVERTY AROUND 1970
% of households below the poverty line Urban Rural Total
Argentina 5 Brazil 35 Colombia 38 Costa Rica 15 Chile 12 Honduras 40 Mexico 20 Peru 28 Uruguay 10 Venezuela 20
Latin America 26 JLL JSL
% oí households below the destitution line Urban Rural Total
19 8 1 73 49 15 54 45 14 30 24 5 25 17 3 75 65 15 49 34 6 $8 50 8
4 6 36 25
8 4 6
i£L
1 1 42 25 23 18 7 6
11 6 57 45 18 12 39 25
19
.31
10
li
Source: Altimir
There is, in addition, more direct evidence that the distribution of income generally worsened during the 1970's and that the subsequent recession would only have strengthened this trend. For example in Argentina the share of the poorest half of the population has declined from 25.1 percent to 21 percent of total income between 1970 and 1981. In none of the 6 countries for which such data is available for the two periods was there any improvement in the distribution of income over the last decade.
Moreover, it is the case that in many countries, the adjustment process is far from complete. It can be expected that incomes will decline further, and the distribution become more regressive, with any

12 increase in the levels of unemployment caused through changes in economic structure.
(b) Where do the poor live?
There is a lack of specific information for the region as a whole on the rural-urban distribution of poverty. In general, however it can be stated that the majority of the lowest income groups are urban dwellers, although the poorest people are to be found living in the countryside. This assertion is supported by various partial studies. For example, two recent studies in Central America illustrate one of the major differences between rural and urban levels of living even in poorer countries.9 In Guatemala, 85 percent of the population with the highest rates of infant mortality, more than 120 deaths per 1000 children under two years old, live in rural areas, compared with 15 percent in urban areas and none in Guatemala City. In Honduras, a higher proportion of urban population in a region is not only associated with a lower rate of infant mortality, but was also accompanied by a more rapid decline in the death rate between 1960 and 1980 (Table 5).
Table5 REGIONAL VARIATIONS IN INFANT MORTALITY,
HONDURAS, 1980
% Urban Infant % Decline Reaion Population Mortality 1960-1980
Occidental 11.0 102 33 Norte 49.6 82 39 Centro 28.5 91 33 CentroSur 58.9 63 48 Sur 22.6 84 37 SurOrlental 14.9 81 27 NorOriental 32.0 87 31 Oriental 75 32
Source: CELADE
In general in Latin America and the Caribbean, traditionally the poor have been more concentrated in rural areas. The rural population has been not only poorer than the urban, but the distribution of income

13 has been more unequal.10 The rise in unemployment accompanying the recession has largely been an urban phenomenon and has increased, to an unknown degree, the numbers of urban poor. The poorest groups within the population are still found in rural areas. One caveat must be made, in those countries with a lower incidence of overall poverty the lot of therural poor maybe be considerably ameliorated due to their own food production.
(c) Have the poor benefited from the Decade so far?
It is not readily evident that the poor have benefited in any general or particular way from the water supply and sanitation programmes executed so far during the Decade. The statistics on the growth of coverage show only a marginal increase in the provision of services to the rural population even in drinking water supply. Moreover, much of the increase is to that portion of the rural population living in larger villages. In urban areas specific statistics on the provision of water supply and sewerage to the poor are not available, but the small expansion in the number of urban households with house connections for either water supply or sewerge would suggest that the poor have not clearly been provided with improved facilities.
There is much sporadic and indirect evidence that would support such a conclusion. The continuance of very high rates of infant mortality, and the dramatic reductions achieved in a few countries, particularly Chile, Cost Rica and Cuba,11 the few and isolated examples that can be cited of innovative supply practices,12 the absence of significant change in the sector in recent years etc. all suggest a failure to reach out to the poorer sections of the population.
Moreover in general, it is a reasonable assumption that In countries with half or more of the population living in poverty that it is theses poor households that are without drinking water and sanitation services. The higher income groups, given their levels of absolute income, can satisfy their own needs should the public services fail to do so. As the public service does fail to do so then the poor remain without service.
4.What can be done?
It is clear that if current tendencies continue the national targets set at the beginning of the Decade will not be met. It is equally clear that the conventional approach to the provision of drinking water supply and sanitation will not achieve adequate water supply and sanitation for the poor. There is a need to seriously consider what can be done both to increase the rhythm of expansion of service, especially
14 to the lower income groups, and to put the sector in a situation where it is less dependent on the ups and downs of the economy as a whole and of the public sector, in particular.
There appear to be four areas, sector administration, system management, tariffs, and technology, where innovation is needed. It is not meant to imply, in such a short review, tha t it is possible to arrive at definitive proposals for the reform. Rather, these proposals are meant as factors that need to be taken into account in any effort to improve the provision of service to the, poor, Thi2specific requirements of change in each area go beyond the possibilities of the present paper, but it is suggested that the following changes are needed,
(Ï) Greater administrative decentralization, (ii) More businesslike system management; (iii) The adoption of a tariff structure that will permit the
generation of revenues to cover capital as well as operation and maintenance costs;
(iv) The wider use of cost-minimizing technology.
It is not suggested that any of these proposals are new. They have been made before and there exist examines of the application of such changes in different countries. Rather |hey are reiterated here to remind us that the achievement of change is a complex process and requires multiple innovations. We are here to discuss only some aspects of drinking water supply and sanitation, particularly the possibilities for the use of certain low cost technologies for the better provision of drinking water and sanitation to the poor. Such innovations, as necessary as they are, will not, nor cannot, of themselves, produce better service unless accdrripanied by change in the other three areas mentioned. Technology has to be used in an appropriate environment and such an environment does not widely exist in Latin America and the Caribbean at the moment. Perhaps this seminar can mark the beginning of the creation of a more propitious environment and the redirection of the sector towards the satisfaction of the needs of all the people of the region.
5 . Conclusions
The conclusions that can be drawn from this short review of the current state of the drinking water supply and sanitation sector halfway through the International Drinking Water Supply and Sanitation Decade are the following:
(1) Investment in drinking water supply and sanitation in most countries of the region has been seriously reduced by the genera! economic recession prevailing in Latin America and the Caribbean since

15 1981;
(il) The effect of the reduced resources available to the sector has been to curtail both the expansion of services and the maintenance of existing systems;
(ill) The impact of the reduction of resources has been felt most severely by lower income groups;
(iv) There is an urgent need, therefore, to develop specific programmes to improve services to lower income groups;
(v) These special programmes should be built around cost minimizing technology so as to liberate them, as far as possible, from dependence on resources external to the sector.
Notes
1 United Nations, Report on the United Nations Conference on Water. Mar del Piala, 14-25 March, 1977, New York, p. 2 Pan American Health Organization-World Health Organization, Environmental Health Programme, International Drinking Water Supply and Sanitation Decade. Regional Progress Report. Environmental Health Series No.6, Washington, 1987, p.5. 3ibid. ^United Nations, Economic Commission for Latin America and the Caribbean, Drinking Water Supply and Sanitation In Latin America. 1981-1990. Estudios e Informes de la Cepal, No. 25, p. 91. 5 ibid
6PAH0, QSL£& p. 7. 7 Oscar Altlmlr, The Extent of Poverty in Latin America, World Bank Staff Working Papers. Number 522, Washington, 1982, 111pp. 8 The definition of poverty was based on the ability to purchase a minimum basket of food. A seperate basket was defined for each country included in the study. The proportion of the population whose income did not permit the purchasing of twice the basket was declared to be poor. Those who could not even purchase the basket were declared destitute. 9 United Nations, CELADE, Guatemala: Diferencias socioeconómicas de la mortalidad de los menores de dos años. 1968-1976. Santiago de Chile, 1984, and United Nations, CELADE, Honduras 10 Altimír, Op.cit. p.85 11 See, José Miguel Guzmán and Hernán Orellana, "Mortalidad infantil, neonatal y posneonatal en algunos países de America Latina", Notas de Población. No.44, August, 1987, pp.31-66 for an analysis of the reductions achieved. *2 See the discussion for example in, Tim Campbell, "Water Supply and Waste Disposal to Low-Income Urban Settlements in Latin America and the Caribbean",
16
paper presented at the Regional Symposium on Drinking Water Supply Sanitary Disposal of Excreta in Urban Slum Areas, Santiago, Chile, November 5-9, 1984.