Embed Size (px)
Citation preview

JOURNAL OF MOLECULAR SPECTROSCOPY 37, 109-130 (1071)
Dissociation Energies and Long-Range Potentials
of Diatomic Molecules From Vibrational
Spacings: The Halogens’
ROBERT J. LE ROY’ AR~U RICHARD B. BERNSTEIN
Theoretical Chemistry Institute and Chemistry Departmen.t, University of Wisconsin, Madison, Wisconsin 53706
A recent,ly-developed met,hod for obtaining dissociation limits and long- range internuclear potentials from the distribution of the uppermost vibra- tional levels of diatomic molecules is applied to existing data for the B 3n:, states of Clz, Brs, and IS, and the ground X 2, + state of Cl,. Values of the asympt.otic long-range potential constants (C,) are deduced from t,he data; they compare well with the best theoretical estimates. The analysis yields improved D, values for the ground X lZg+ states of 35*36C12, r9r79Brz, s1*81Br2, and 127~12712, respectively, as follows: 19 997.25 (i 0.3), 15 894.5 (& 0.4), 15 896.6 (Z!E 0.5), and 12 440.9(f 1.2) cm-i. Presented also are: (i) a convenient graphical approximation procedure for utilizing the method, and (ii) a graphical means of making vibrational assignments for higher levels when gaps exist in the observed vibrational sequence. The latt’er approach suggests certain vibra- tional reassignments for ground-stat,e Clp(X Q,+) and for Br2(B II&).
I. INTRODUCTION
An expression has recently been derived which relates the distribution of
vibrational levels near the dissociation limit D of a diatomic molecule to the
attractive long-range part of its internuclear potential (1, 2). For the common situation where the outer branch of the potential may be closely approximated
by the attractive inverse-power functionality:
V(R) = D - C&/R”, (1)
the distribution of vibrational eigenvalues E(v) near D is closely approximated
by
$ [E(v)] = K,[D - E(z#~+~“~~~_
1 Work supported by National Science Foundation Grant GB-16665 and Nat,ional Aero- nautics and Space Administration Grant NGL 59002-001.
2 National Research Council of Canada Postgraduate Scholar. Present address: Depart- ment of Physics, University of Toronto, Toronto 181, Ontario, Canada.
109
110 LE ROY AND BERNSTEIN
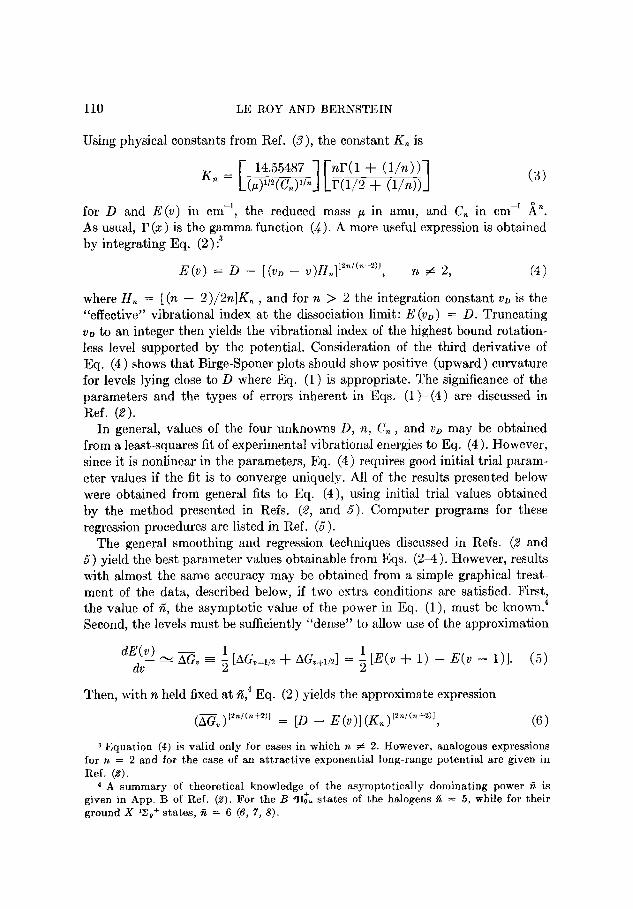
TJsing physical constants from Ref. (3), the constant K, is
(3)
for D and E(v) in cm-‘, the reduced mass P in amu, and C, in cm-l in. As usual, I’ (x) is the gamma function (4). A more useful expression is obtained
by integra.ting Eq. (2) :
E(v) = D - [(v. - v)H,]~~‘+~)~, n # 2, (4)
where H, = [(n - 2)/2n]K, , and for n > 2 the integration constant VD is the
“effective” vibrational index at the dissociation limit: E (vD> = D. Truncating
vD to an integer then yields the vibrational index of the highest bound rotation-
less level supported by the potential. Consideration of the third derivative of
Eq. (4) shows that Birge-Sponer plots should show positive (upward) curvature
for levels lying close to D where Eq. (1) is appropriate. The significance of the parameters and the types of errors inherent in Eqs. (1 )- (4) are discussed in
Ref. (2). In general, values of the four unknowns D, n, C, , and vD may be obtained
from a least-squares fit of experimental vibrational energies to Eq. (4). However,
since it is nonlinear in the parameters, Eq. (4) requires good initial trial param-
eter values if the fit is to converge uniquely. All of the results presented below
were obtained from general fits to Eq. (4), using initial trial values obtained
by the method presented in Refs. (2, and 5). Computer programs for these
regression procedures are listed in Ref. (5).
The general smoothing and regression techniques discussed in Refs. (9 and
5) yield the best parameter values obtainable from Eqs. (2-4). However, results
with almost the same accuracy may be obtained from a simple graphical treat-
ment of the data, described below, if two extra conditions are satisfied. First, the value of A, the asymptotic value of the power in Eq. (l), must be known.4
Second, the levels must be sufficiently “dense” to allow use of the approximation
dE(v)
dv ‘v iiG, = ; [AG,_l,z + AG,,,,,] = ; WV + 1) - E(v - I)]. (5)
Then, with n held fixed at ??,4 Eq. (2) yields the approximate expression
(=, ) Pnl(n+Vl = [D - E(v)] (K,)[2n’(n+2’1, (6)
3 Equation (4) is valid only for cases in which n # 2. However, analogous expressions for n = 2 and for t.he case of an attractive exponential long-range potential are given in
Ref. (8). 4 A summary of theoretical knowledge of the asymptotically dominating power 7i. is
given in App. B of Ref. (8). For the B Sn & states of the halogens fi = 5, while for their ground X S,+ states, 11. = 6 (6, 7, 8).

POTENTIALS OF THE HALOGENS 111
suggesting a plot of (Z,)‘2”““+2” vs E (v). For the highest levels this should be
linear with intercept D, while for the relatively deeper levels it should show
negative curvature. Hence, a linear extrapolation from such a plot should always give an upper bound to D. Once D has been determined in this manner, Eq. (4)
may be rewritten as
[D - E(zJ)][(“-2)‘2nl = (VD - o)H, . (7)
With n = A, a plot of the left hand side vs v yields 80 as the intercept, and H, (and hence C,) from the slope. The usefulness of Eqs. (5-7) is demonstrated
below.
In Sect. II, Eq. (4) is fitted to the experimental vibrational energies of the
B “I$~ states of CL, Br2, and 12, yielding estimates of the asymptotic long-range
potential constants, Cg , and improved values of the ground-state dissociation
energies.5 A further application of Eq. (4) is introduced in Sect. III, which sug-
gests vibrational reasssignments for the highest observed levels of Br2 (B “I&)
and of ground state Cl2 (X ‘&+). In the latter case, a fit to Eq. (4) then yields
estimates of vD and of the long-range C6 constant.
II. GROUND-STATE DISSOCIATION ENERGIES AND B %;u STATE
POTENTIAL TAILS OF THE HALOGENS
A. Chbrine’
,4 detailed discussion of the fitting of theexperimental data (9) for Cl2 (B “ntU)
to Eq. (4) has been presented (2). However, the reported (1,.2) uncertainties in
the parameters were incorrectly described as 95 % statistical confidence intervals;
they were actually two standard deviations, corresponding to the 95 % confidence level only in the limit of many degrees of freedom. Parameter values obtained on
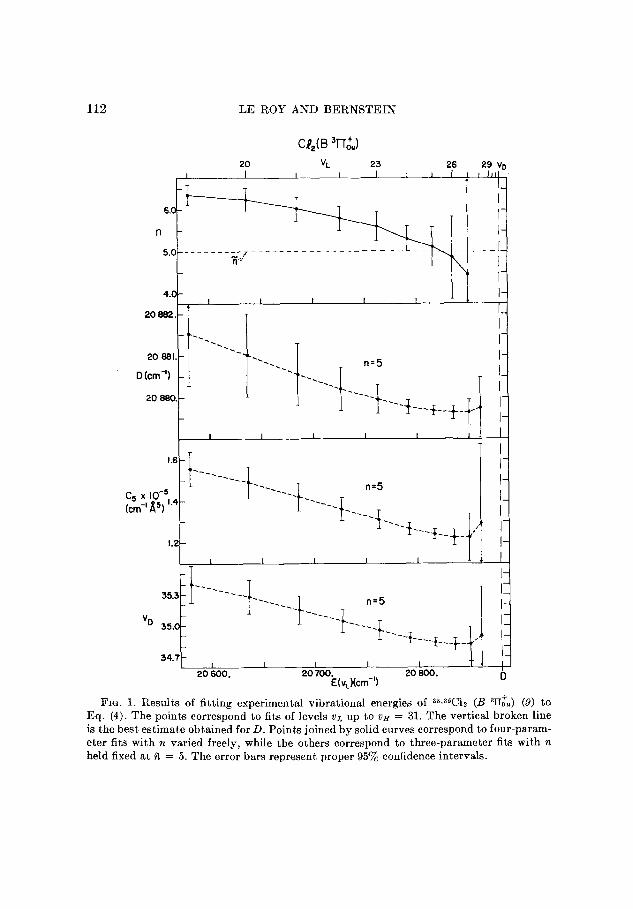
fitting the experimental energies (9) to Eq. (4) with n free or fixed* at ii = 5
are given in Fig. 1, together with the proper 95 % confidence intervals.?
It was concluded in Ref. (2) that the highest observed levels of Cl2 (B “ntU) depend mainly on the theoretical asymptotic 6 = 5 inverse-power term in the
Iong-range potential.4 The disagreement with the 6 = 6 suggestion of Byrne
et al. (IO) is discussed in Sect. IV. The values of D, CS , and uD reported in Ref.
(2) (which also gave predicted energies of the unobserved highest bound levels of this state) are listed for the sake of completeness in Table I, together with the
5 Unless otherwise stated, throughout, this paper all energies are expressed relative to
the z) = 0, J = 0 level of the ground electronic state of the designated isotopic molecular
species.
6 The present, discussion of chlorine considers only the most common isotopic species, W3WJ2.
7 Unless otherwise stated, all uncertainties given in this paper correspond to 95% statis-
t,ical confidence int,ervals.
112 LE ROY AND BERNSTEIN
Cl&B 3T-TTo+u) 20 “L 23 26 26 VD
I I I I I I I I , III
I-
n - I-
I_
I I-
4.0- I- I I I I I 1
I I
n=5 I-
_.._ __.
---___ T / ----J-__lm
‘“Ii I I- --__ --__
c5 x 1o-5,.4_
- -._ i _.__ I
n=5 l-
_ -\_
f
I-
(cm-’ A5) --1 __--__
+
1.2-
““++ cj /
, i:::
LT
‘, D
FIG. 1. Results of fitting experimental vibrational energies of 36*35C1~ (B ‘Hi,,) (9) to Eq. (4). The points correspond to fits of levels e)L up to as = 31. The vertical broken line is the best estimate obtained for D. Points joined by solid curves correspond to four-param- eter fits with n varied freely, while the others correspond to three-parameter fits with n held fixed at fi = 5. The error bars represent proper 95% confidence intervals.

POTENTIALS OF THE HALOGENS 113
TABLE I
SUMMARY OF RESULTS FOR THE HALOGI”NS~
+ B 3&u states D (cm-l)b n=iz C, (cm+ An) Z’D
35.36C12 20879.76 (f0.30) 5 1.29 (&0.2C) x 105 34.90 (fO.2”) 79,79Br2 19579.71 (~0.27) 5 1.7, (f0.2) x 106 60.51 (f0.3) Sl,*lBr, 19581.7, (f0.35) 5 1.79 (f0.2) x 105 61.28 (f0.3) 127.121I? 20044.0 (ztl.2) 5 3.1, (ztO.2) x 105 87.7 (ztO.4)
X3,+ states CD = Do)
36.36Cl? 19997.2s (f0.3C) 6 0.74 (f0.3d) x 105 61.0 (x!~1.2)~ 79.79Br2 15894.5 (ztO.4) 6 - - WlBr, 15896.6 (jzO.5) 6 - -
12’1,nq * 12440.9 (f1.2) 6 -
a See footnote 7. b See footnotes 5 and 9. c See footnote 8. d These uncertainties are only estimates.
improved estimates of their uncertainties.8 Similarly included are the results
for the other halogen systems, to be discussed below.g
While the parameters given in Table I are the best values obtainable from
the available experimental data (9) using the present method, results of nearly the same quality are obtained on utilizing these data (9) directly in the simple
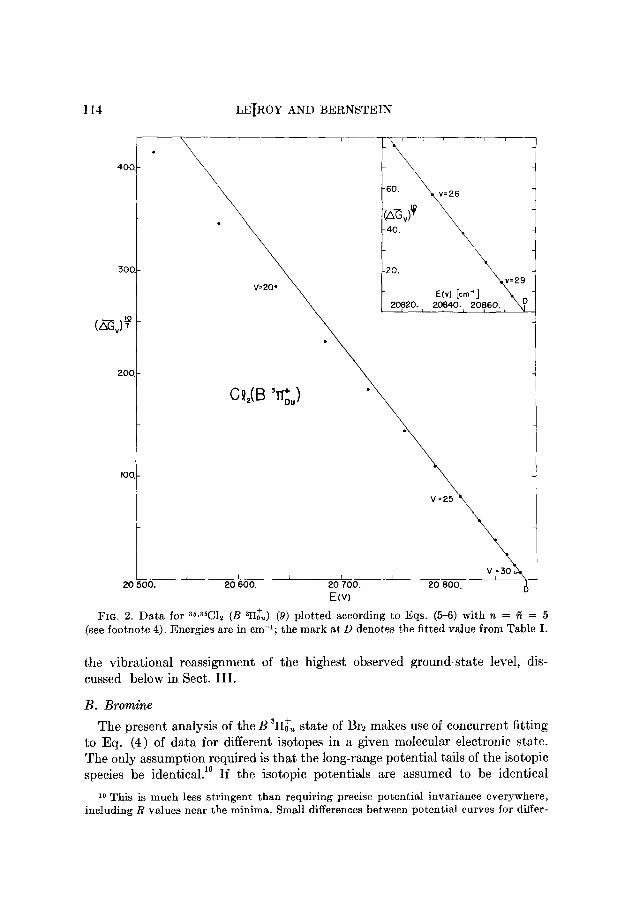
graphical manner suggested by Eqs. (5-7). For this case the theoretical ri = 5,
and Fig. 2 shows the plot suggested by Eq. (6); the intercept is indistinguishable
from the value of D obtained from the fits to Eq. (4) (see Table I). Using this
D and n = 6 = 5, Fig. 3 shows the plot suggested by Eq. (7); its slope and
intercept are very close to the fitted values of H, and uD (from Table I).
Combining the fitted D value for Cl2 (B “lieu) with the 2P1,2 - 2P3p atomic
Cl spin-orbit splitting of 882.50 cm-’ (12, IS) yields a ground-state dissociation
energy of D, = 19 997.25 (~0.3) cm-‘. This diiers significantly from both the
estimate of D, = 20 062 (~40) cm‘-’ obtained by Rao and Venkateswarlu (14) from a Birge-Sponer extrapolation of their ground-state vibrational data, and
from the D, = 30 040 (~t20) cm-’ which Clyne and Coxon (15) obtained on
reinterpreting the data of Ref. (14). However, the discrepancy is removed by
8 The final uncertainties in the best parameter values for Cl2 (B 3&,) differ from both the previously-reported values (1, 2) and the true 95y0 statistical confidence intervals shown in Fig. 1. The values given are best estimates based on the 95% confidence int,ervals for the last few points to the right in Fig. 1.
9 The uncertainties in these D values differ from those reported previously (1, 2, If) because of the incorrect 950/, confidence intervals in the earlier work.
LEfROY AND BERNSTEIN
IOO-
I I I I I
20 500. 20600. 20700. 20800. I
EW D
FIG. 2. Data for 36*36C12 (B ala) (9) plotted according to Eqs. (5-6) with 7t = A = 5
(see footnote 4). Energies are in em-‘; the mark at, D denotes the fitted value from Table I.
the vibrational reassignment of the highest observed ground-state level, dis- cussed below in Sect. III.
B. Bromine
3 The present analysis of the B II & state of Brz makes use of concurrent fitting to Eq. (4) of data for different isotopes in a given molecular electronic state. The only assumption required is that the long-range potential tails of the isotopic species be identical.” If the isotopic potentials are assumed to be identical
10 This is much less stringent than requiring precise potential invariance everywhere, including R values near the minima. Small differences between potential curves for differ-

POTENTIALS OF THE HALOGENS 115
FIN. 3. Data for 35%X2 (B %lJ (9) plotted according to Eq. (7) with n = fi = 5 (see footnote 4). Energies are in cm- ]; the mark at z)D denotes the fitted value from Table I.
everywhere, the number of free parameters in the problem is reduced further,
since the ratio of 80 values for isotopic species i and j is then determined solely
by the reduced mass ratio:
vD(j>/vD@ = b(j>/,(i)l”2.
To obtain trial parameter values for a multi-isotope case (5), Eq. (8) is assumed
and the relative isotope shifts are estimated.” (Alternately, trial parameter
values may be estimated separately by applying Eqs. (5-7) or the method of
Ref. (2) to the data for the individual isotopic molecules.) However, in the final
fits to Eq. (4), D, n, C,, VD for each isotope, and the relative energy shifts
(ground-state zero-point energy shifts5) for the different species were the free
parameters. Horsley and Barrow (18) have measured vibrational energies of four adjacent
vibrational levels, v = 50-53, near the dissociation limits of the B “Ilzu states of 7%i9Br2 and 81,81 Brp. (It is proposed in Sect. III that their vibrational assignment
for these levels is one unit too small; the new numbering is used here.) Un-
ent, isotopic species in a given state arise from the coupling of nuclear and electronic mot,ion. In their a priori calculations for the ground state of H 2 , Kolos and Wolniewicz (f6) showed t.hat the effect of such coupling disappeared at long range. More generally, the effect of this coupling on an eigenvalue depends on the expectation value of the nuclear kinet,ic
energy, and this goes to zero for levels approaching the dissociation limit [e.g., for ground statue Hz , see Table III of Ref. (f7)].
I1 These shifts were estimated in two ways: (a) by comparing vibrational zero-point energies, and (b) by separately smoothing the level energies for the different isotopic molecules as functions of a common abscissa x, related to the vibrational quantum number
by: x = v(i) Ml)/~(~)l”“, and comparing the calculated ordinates at any chosen x value.

116 LE ROY AND BERNSTEIN
TABLE II
CALCULATED ENERGIES (cm-l) OF THE HIGHEST BOUND LEVELS OF ISOTOPIC Br2(B %iU)
Numbers in parentheses are experimental; for (79,79) and (81,81) these are from Ref. (I@, while for (79,81) they are taken from Ref. (,%I)*.
21 (79,79) (79,81) (81981)
41 19 453.44 19 448.89 (19 470.3) 19 444.00 42
43
44
45
46 47
48 49
50 51 52
53 54
55
56 57
58
59 60
61
473.76 469.72 491.66 488.13 507.34 504 .28 520.94 518.36 532.65 530.51 542.62 540.90 551 .Ol 549.68 557.97 557 .Ol 563.65 (19 563.65) 563.04 568.20 (568.20) 567.90 571.76 (571.77) 571.74 574.47 (574.47) 574.69 576.46 576.89 577.84 578.46
578.75 579.51 579.29 580.1,
579.5~ 580.53
579.69 580.69
579. ,I 580.7,
(486.2) 465.37
(499.5) 484.31
(512.5) 500.97 (524.3) 515.53
(531.5) 528.15 (542.2) 538.98 (551.4) 548.18
555.90 562.28 (19 562.28)
567.46 (567.45) 571.60 (571.61)
574.82 (574.81) 577.24 579.00 580.22
581 .oo
581.45
581.68
581.16 581.11
* See footnote 13.
fortunately, a fit of these eight observations to Eq. (4) with all six parameters free did not yield a reliable value of fi. However, since all the levels considered lie within 20 cm-’ of the dissociation limit, it is probable that they depend primarily on the theoretical4 asymptotic potential behavior (V(R) - R-‘). The plausibility of this assumption is strengthened by consideration of Fig. 2 which shows that for CIZ (B “II~~)>, the levels within ca. 40 cm-’ of D accord with A = 5, while the theoretical Cg for Clz is considerably smaller than that for Br2.12
Fixing n = 8 = 5, the eight data were fitted to Eq. (4), yielding the param- eters given in Table I, and an isotopic zero-point energy shift of 2.05 (~~0.12) cm-l.’ The latter is in good agreement with the more precise value of 2.03 cm-‘, the difference between the ground-state isotopic zero-point energies calculated from the vibrational constants of Ref. (18).
12 Values of long-range CS constants may be expressed as the product of a fact,or peculiar to the electronic state in question, and the expectation values of the square of the radii of the valence electrons (9) on the interacting atoms (6). Knipp (6) and Chang (7) have presented tables of these numerical factors for a wide range of situations, and Fischer (19) has recently presented accurate Hartree-Fock values of (+) for the shells of most atoms.

POTENTIALS OF THE HALOGENS 117
FIG. 4. Data for the (79,79) and (81,Sl) isotopes of Brz (B 3IIlU) (18) plotted according to Eq. (7) with n = A = 5 (see footnote 4); as in Fig. 3. The slopes of the lines differ b? the amount predicted by the reduced mass factor in Eq. (3).
The ratio of the Brt isotopic uD’s in Table I agrees well within the uncertaint>
of the fit with that predicted by Eq. (S), confirming its validity for this case.
Hence, Eq. (8) may be applied for the mixed isotopic molecule 7s’81Br2, yielding
wD = 60.89. Furthermore, the (79,79)-(81,Sl) isotope shift suggests a value of
D = 19 580.74 cm-’ for the mixed isotope (79,Sl). Using these interpolated
parameters and the constants given in Table I, the energies of the highest vibrn-
tional levels of the B 311i$u potential may be predicted from Eq. (4) for all three isotopic species. In Table II these are compared to the experimental energies of
Ref. (18) for the pure (79,79) and (S1,81) isotopes, and of Brown (20) for
(79,81) .13 As in the discussion of Cl*, it is interesting to compare the best fitted parameter
values with the estimates of them which would have been obtained from Eqs.
(5-7), with n = fi = 5. In this case the two isotopes must be considered sepa-
rately; for each, the four observed energies yield only two z, values, uniquely
determining the intercepts D. These resultant D values for (79,79) and (81,81)
are, respectively, only 0.05 and 0.15 cm-’ larger than the best fitted values
(Table I). Using these (approximate) D's and fixing n = ti, Eq. (7) then yields Fig. 4. As before (for Clz, see Fig. 3), the slopes and intercepts lie within the
statistical uncertainties in the fitted Table I parameter values.
l3 Brown (20) stated that: “In general the measurements are not accurate to better than 2 cm-‘, and in cases where the isotope effect has not been identified, the error is toll- siderably greater.” Furthermore, consideration of Table II suggests t,hat some of his band heads might more properly be reassigned to the pure isotopes and/or to different vibrational levels. If this is done, for 6 of the 8 experimental (79,81) energies given in Table II the agreement is better than 2 cm-l, while for the other two (v = 44 and 45) the disagreement is at worst 3.5 cm-l. In any case, the calculated (Table II) energies for the deeper levels (e.g., u ;5 43) are likely to be increasingly in error.

118 LE ROY AND BERNSTEIN
Combining the fitted D values for the pure isotopes with the 3685.2 (f0.3) cm-’ spin-orbit splitting (21) yields ground-state dissociation energies of D, (79,79) = 15 894.5 (AO.4) cm-‘, and D, (81,Sl) = 15 896.6 (f0.5) cm-‘. The consistent estimated value for the mixed isotope is D, (79,81) = 15 895.5 (f0.5) cm-l.
C. Iodine14
The only quantitative data for this state extending above v = 58 appear to be Brown’s (22) band-head measurements for levels 2) = 48 to 72.15 Since a Birge-Sponer plot of his vibrational spacings shows positive curvature every- where, these data are suitable for treatment by the present method.
As for Cl2 (B “I&) (2), the vibrational energies were repeatedly fitted to Eq. (4) while the deeper levels were successively omitted from consideration. This was done in turn with all four parameters being varied freely, and with n fixed at A = 5. The resulting parameter values are shown in Fig. 5, plotted against the energy of the lowest level included in a given fit, E (vL).’ Unfortunately, the scatter in the data is such that the four-parameter fits become unstable when fewer than 10 levels are considered at once, precluding a direct determination of A. Even when n is held fixed at 7i: = 5, the three-parameter fits become erratic when fewer than 9 levels are considered at once.
While reliable “local values” of n cannot be determined directly, the flattening of the three broken line curves in Fig. 5 for VL 2 55 strongly suggests that the highest ca. 18 observed levels lie in the asymptotic (6 = 5) region. This is quali- tatively confirmed by the fact that the fitted Cs values are within 30% of the theoretical value12 of 4.54 X lo5 cm-’ A”. The present best estimates of D, C’S, and trD, presented in Table I, were obtained by weighting the results for vL = 55 to 64 by the squared inverse of their uncertainties? The tiD value suggests that this state has 15 vibrational levels above the highest one observed by Brown (22); predicted values of their energies, generated from Eq. (4) and the parameters in Table I, are given in Table III.
As in the previous cases, the best fitted parameter values can be compared to estimates of them obtainable from Eqs. (5-7). Figure 6, based on Eqs. (5-6), yields an estimate of D indistinguishable from the value in Table I. Furthermore, the linearity of this plot for v 2 55 confirms the dominant 5 = 5 influence in this region. The ensuing plot based on Eq. 7 (Fig. 7) yields estimates of VD and H, lying well within the statistical uncertainties in the Table I values.
Combining the fitted value of D with the 7603.15 cm-’ atomic 2P11~ - 2P3/2
splitting (12, 25) yields a ground-state dissociation energy of D, = 12 440.9
I4 The present discussion of iodine considers only the most common isotopic species 127,12q2,
16 The original vibrational numbering of these levels has since been revised (23, 64); thus the numbering used by Brown (~2.8) has been decreased by one unit.

POTENTIALS OF THE HALOGENS 119
63.1 ( I I I I I , ‘it i,-j
19 700. 19 600. 19 900. 20 000. b
E(v,) (cm-‘)
FIG. 5. Results of fitting experimental vibrational energies of 127~12712 (B Q,‘,A) (88) 10 Eq. (4); as in Fig. 1.
(f1.2) cm-‘.’ The source of the disagreement between this result and Verma’s
(26) Do = 12 452.5 (~1.5) cm-’ is discussed elsewhere (II ).
III. PROPOSED VIBRATIONAL REASSIGNMENTS
il. General
Frequently the energies and indexing of the deeper vibrational levels of a given electronic state are accurately known, while near its dissociation limit D the data are often relatively sparse, with gaps of several vibrational quantum numbers between observed levels. In the absence of additional information, this may lead to errors in vibrational assignments.

120 LE ROY AND BERNSTEIN
One constraint which may be applied to the data is to require that the Birge-
Sponer plot for the species in question should have positive curvature for levels
near D (I, 2). The present approach implicitly includes this constraint while
making more explicit use of Eq. (4). The necessary assumptions are a value for
TABLE III
CMAXJLATED ENERGIES (cm-l) OF THE HIGHEST BOUND LEVELS OF 127,12712(B Wb’u) Brown’s (.@) experimental energies for u S 72 are given in parentheses.
v E(v) V E(v)
66 19 987.2 (19 986.9) 77 20 038.6 67 19 995.5 (19 995.5) 78 040.1 68 20 002.8 (20 002.7) 79 041.3 69 009.4 (009.6) 80 042.2 70 015.2 (015.5) 81 042.9 71 020.2 (020.2) 82 043.8 72 024.7 (024.4) 83 043.6 73 028.5 84 043.84 74 031.7 85 043.9, 75 034.4 86 043 * 9% 76 036.7 87 044.00
FIG. 6. Data for 127r12T2 (B ?&) (,%) plotted according to Eqs. (5-6) with n = ii = 5 (see footnote 4); as in Fig. 2.

POTENTIALS OF THE HALOGENS 121
FIG. 7. Data for 127,1271~ (B %tU) (22) plotted according to Eq. (7) with 12 = 6 = 5 (see foot,note 4); as in Fig. 3.
fi, and a good estimate of D which is independent of the vibrational numbering
under dispute. Then [according to Eq. (7)], for n fixed at fi, a plot of [D - E (u)][(~-~)‘~~~ vs v should be linear for levels very near D, while showing progres-
sively stronger negative curvature for deeper levels (see discussion in Sect. I).
Since the long-range interatomic interaction may be expressed (d’?, 28) as a
sum of inverse (integer)-power terms in R (of lowest order ri), the effective
“local” n at the outer turning points increases with the binding energy. However, consideration of Eq. (4) shows that in the limit of very large n, [D - E(v)]
varies directly as (u. - u)“. Thus, a plot of [D - E(v)]“’ vs v should have
strong positive curvature near the dissociation limit (for A > 4 this curvature
becomes infinite at D), while becoming increasingly linear for the deeper levels. The present approach consists of requiring the vibrational assignment to be
such that the two types of plot discussed above show the appropriate curved and
linear regions. A3 a check, in Fig. 8 this approach was applied to the data of Douglas et al. (9) for (31~ (B %I~~), for which 5 = 5. Clearly, even had there
been a gap of 10 unobserved levels somewhere in the range, Fig. 8 would have
unambiguously fixed the vibrational assignments.
B. Vibrational Rea.ssignment and Potential Tail oj Ground-State Cl, (-7,’ ‘Z,+)
The only experimental data for highly excited vibrational levels of ground state
Cl2 are the UV resonance emission doublets reported by Rao and Venkateswarlu (1-G). The rotational assignment for these doublets has recently been revised

122 LE ROY AND BERNSTEIN
FIG. 8. [D - E(v)]l(n*)‘2nl vs v for observed levels of 36*3Q~ (B QiU) (9) with D from
Table I, for both n = m (0, left ordinate scale); and n = ii = 5 (A, right ordinates). All energies are in cm-‘. The broken lines are tangents to the two curves in their linear regions.
(15) yielding slightly different energies, and these are used here. However, the
validity of the present discussion does not hinge on this change.
In Ref. (14), the extrapolation of a Birge-Sponer plot gave a value for the ground-state dissociation energy 65 (f10) cm-’ larger than that of Sect. IIA.‘”
Furthermore, this plot showed growing negative curvature near the dissociation
limit, which would be worsened if the extrapolation were constrained to yield
the present D, . This is the opposite of the expected behavior in this region,
especially since the vibrational spacings for the analogous (but shallower) ground electronic state of 12 (29) show positive curvature for levels lying within
1000 cm-’ of the dissociation limit. Although one expects the long-range inverse-
power attractive potential tail to be somewhat weaker for CL than for IZ , its influence on the highest vibrational levels should not disappear altogether.
Ref. (14) reported observations of all adjacent or semiadjacent ground-state levels from v = 9 to 42. Above this point four other levels were observed, sepa- rated by gaps assigned, respectively, as two, three, two, and one unobserved levels. The anomalous increasingly negative Birge-Sponer curvature is explained if these gaps are too small. Using the theoretical A = 6 and the ground-state dissociation energy obtained in Sect. IIA, the observed level energies [reevalu-
16 From the same data Clyne and Coxon (16) obtained a Do value 43 cm-1 larger than the present estimate; however, t,his change does not affect the arguments presented here.
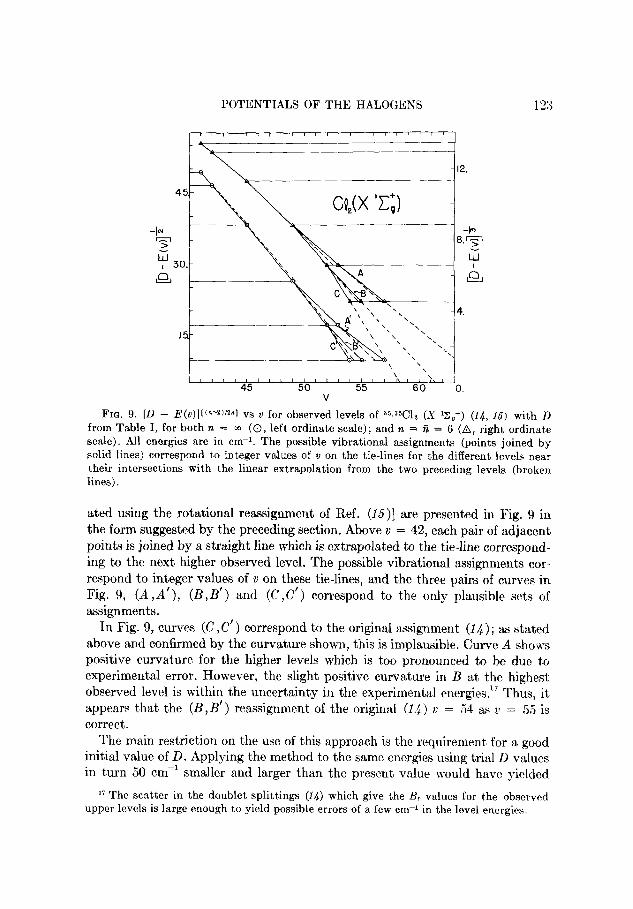
POTENTIALS OF THE HALOGENS 123
FIG. 9. [D - E(~)]l(“-~)‘2~1 vs v for observed levels of 35,3Gl? (S ‘z,+) (14, 15) with D from Table I, for both n = m (0, left ordinate scale); and n = A = 6 (A, right ordinate
scale). All energies are in cm-i. The possible vibrational assignments (points joined by solid lines) correspond to integer values of o on the tie-lines for the different levels near their intersections with the linear extrapolation from the two preceding levels (broken
lines).
ated using the rotational reassignment of Ref. (15)] are presented in Fig. 9 in
the form suggested by the preceding section. Above v = 42, each pair of adjacent points is joined by a straight line which is extrapolated to the tie-line correspond-
ing to the next higher observed level. The possible vibrational assignments cor-
respond to integer values of v on these tie-lines, and the three pairs of curves in
Fig. 9, (A,A’), (B,B’) and (C ,C’) correspond to the only plausible sets of
assignments. In Fig. 9, curves (C ,C’) correspond to the original assignment (14) ; as stated
above and confirmed by the curvature shown, this is implausible. Curve A shows positive curvature for the higher levels which is too pronounced to be due to
experimental error. However, the slight positive curvature in B at the highest observed level is within the uncertainty in the experimental energies.17 Thus, it
appears that the (B,B’) reassignment of the original (14) u = 54 as 2’ = 55 is
correct. The main restriction on the use of this approach is the requirement for a good
initial value of D. Applying the method to the same energies using trial D values in turn 50 cm-’ smaller and larger than the present value would have yielded
I7 The scatter in the doublet splittings (14) which give the B, values for the observed upper levels is large enough to yield possible errors of a few cm+ in the level energies.

124 LE ROY AND BERNSTEIN
(C,C’) and @,A’), respectively, as the most probable assignments. On the other hand, using D, = 20 012 cm-‘, the best estimate available previous to Ref. (14), the present reassignment is obtained.
It is important to note that this reassignment negates the speculation corl-
cerning a possible barrier maximum (9, 15). No such maximum is expected
theoretically, since for the ground states of the halogens, at least the first two
nonzero inverse-power potential terms are attractive [see the argument presented
for IZ in Ref. (II)], as well as the exchange forces which give rise to the chemical
binding.
Using the known ii = G and D, for the ground state, Eq. (4) was fitted to the
three highest experimental energies (v = 49, 52, and 55) yielding the values of
Cs and vD given in Table I. The C6 obtained is in fortuitously good agreement with
the theoretical C, = 0.82 X 10’ cm-l 8”, estimated by Caldow and Coulson (30).
However, fitting the highest two levels using the (A, A’) and (C, C’ ) vibrational
assignments would yield CS values respectively 7 times larger and 5s as large
as the theoretical estimate. This lends credence to both the present vibrational reassignment and the significance of the fit itself. Table IV presents the energies
predicted by the constants in Table I for the highest bound levels of
Clz (X l&+)?’
Cr. VibrationaE Reassipmmt _fo~ Bn (B ?I$~ )
The four vibrational levels observed near the dissociation limit of the B “I& state of each of 7g~7gBr2 and *‘S81B rz were originally assigned as v = 49-52 (18). The only other measurements of the upper vibrational levels of this state are
Brown’s (.%‘O) observation of levels up to v = 48 of 7g,81Br2. In order to compare
these results, the (79,79) and (81,81) energies (18) were averaged to yield ap-
TABLE IV
CALCULATED ENERGIES (cm-i) OF THE HIGHEST BOUND LEVELS OF GROUND-STATE
~~~w12(s’z,+)
The experimental level energies are given in parentheses.
v E(v) 21 E(v)
48 19 119. 55 19 911. (19 905.“) 49 306. (19 305.8) 56 947. 50 465. 57 972.
51 597. 58 986. 52 506. (19 711.8) 59 994.
53 792. 60 996.8”
54 860. 61 997. zsb
* Calculated from the data in Table I of Ref. (1.4) using the rotational reassignment of Ref. (16) and the ground-state rotational constants of Ref. (9).
b Because of the uncertainty in en (see Table I), these levels may not exist.

POTENTIALS OF THE HALOGENS 1%
FIG. 10. [D - E(u)] [(RS)‘2nl vs v for observid ((20) solid points). and interpolated ((18) open points) levels of 79,81Br2 (B Qlu) with D from iect. IIB, for doth n = m (circles, lef; ordinate scale), and n = A = 5 (triangles, right ordinates scale). All energies are in cm-l; “old” and “new” refer t.o the vibrational assignment.s of the four highest. levels.
proximate (79,81) energies for the levels considered. Yor this species (E = .5
and D mxs obtained in Sect. IIB), Fig. 10 is the plot suggested by Sect. IIIA. The solid points are from Ref. (20) and the open points are the interpolated
energies mentioned above. It, is apparent that the original (18) vibrational
numbering of the latter four levels must be increased by one. This reassignment
was used in Sect. IIB.
IT:. I>IW.XJsSI0S
A. Compwison of B “ICfu State D T;alues with I’,,evious Resulfs
Ilost of the results in Table I differ somewhat from previous dissociation
limits and conclusions about the nature of the long-range potentials, despite being based on the same data. For the D values, the appropriate quantity for
comparison is [D - E(u,)], the binding energy of the highest observed level.
Table V compares the present and best previous values of this quantity for thcb B “I& states of the halogens.
In the case of 12, the discrepancy originates in the graphical extrapolation of Ref. (22) beyond the highest observed levels. This illustrates the errors which may arise from use of the Birge-Sponer (31 ) and Birge (J2) rxtrapolation procedures.”
I8 For an excellent review of these methods, see Chap. V of the book by Gaydon (ssj

126 LE ROY AND BERNSTEIN
The previous best estimates of the dissociation limits of the (79,79) and (81,Sl)
isotopes of Brz (B “II&, ) (18) were based on limiting curves of dissociation [e.g.,
see Chap. VI of Ref. (SS)]. The discrepancy with the present results implies that the absorption series were incomplete; i.e., they did not extend to the pre-
dissociation limit. It has been shown (34) that for vibrational levels lying near
the dissociation limit, the energies at which the rotational series for the different
vib;Ty_;J levels break off due to predissociation should vary as [J,(J, +
111” n where n = fi, and J, is the rotational quantum number of the last unpredissdciated level. For Brz (B “II&), (for which A = 5) the theoretical Cs
coefficient? yields a predicted slope of 2.0 X lop5 [cm-‘] for plots of E (Jm) vs [J,(J, + 1)]5’3. S’ mce the data (18) do not conform to this behavior, it is
inferred that the experimenters did not observe the very highest nonpredissociat-
ing levels. This is consistent with their lack of observation of any broadened lines. One further effect to be considered is the effect on the fitted D value of an
error in the chosen value of ii. Fitting the data to Eq. (4) in the manner de-
scribed in Sect. II, but with n set equal to 6 instead of 5, one obtains D values
for CL, Brz, and Iz, respectively, which are only 0.36, 0.50, and 2.7 cm-’ smaller
than the best values (Table I).
B. The B “I$,, State Potential Tails; ComparismL with Previous Results and with Theory
Byrne et al. (IO) concluded that the outer RKR turning points (35) for the
B “I& states of both Cl, and Br2 followed an R-6 dependence, rather than the theoretical” asymptotic RW5 form. However, the validity of this conclusion is
contingent on the accuracy of the RKR potential and of the value of D assumed,
For Cl2 the reported turning points (55) are plotted against binding energy in
Fig. 11, using both the present D and the experimenters’ (9) D [presumably the
value used in Ref. (lo)].‘” The small difference between these D’s has a negligible
effect on this plot, and it appears that the previous ri. = 6 deduction is wrong since it requires ignoring the last few levels. [This also implies that the reported
(10) “Cs” is spurious.] The difference between the intercepts of curves A and B
in Fig. 11 indicates that either the present best Cg is ca. 40% small, or that the RKR results are slightly in error. The latter is plausible since no experimental
data were available for the lowest six levels of this state, spanning the lower 40 %
of the potential well. The RKR potential for Brz (B “I&) from which Byrne et al. (10) concluded
r?. = 6 appears to have been calculated (35) for the mixed isotope (79,Sl) from the averaged Ref. (18) data for (79,79) and (81,81). However, these results
19 The v = 32 turning point reported by Todd et al. (35) is ignored here as being spurious, since there is no published observation of this level. This point would lie well above all the lines in Fig. 11, since their extrapolated [E(32) - E(31)] is some 30% smaller than that predicted (2) on substituting the constants of Table I into Eq. (4).

POTENTIALS OF THE HALOGENS 127
TABLE V
BINDING ENERGIES (cm-‘) OF HIGHEST OBSERVED LINEI, (uH) OF THI,: B 311TU ST.\TPX OP
THE H.~LOGENS
Species 2)X Present Previous
“5,3qy,
‘9,‘9&.?
WIBrx le,,l*iI,!
_~___ tL See footnote 8. t From Ref. (9). D From Ref. (f8). d From Ref. (26).
31 2.8s (f0.3):’ 3.I (zt2.)‘J 53 5.24 (~~0.271 2.7 (kO.5)” 53 6.96 (~k0.3~) -1.1 (fO.5,~ 72 19.G (jzl.2) 12.V
____--
‘:, -7--y
. -I
o FIG. 11. Log-log plot of binding energies (cm-l) vs calculated (55) RKIZ turning points
(A) for 35,35C19 (S ‘Z,+) using both the present (X) and the previous (9) (0) estimates of D (see footnote 19). The straight lines have slope of -n; the intercept of A corresponds to the present (Table I) CS , while line B is the best, n = 5 fit, to the points for the upper- most levels.
only span levels 9 5 v 5 19 and those reassigned as 50 5 u 5 53, and u = 9 lies ca. 37% of the well depth above the minimum. In addition to using the in- correct original (18) vibrational assignment for the four high levels, the inter- polation over the large gaps in the spectrum is quite unreliable. For example, the interpolated v = 30 and 45 (79,Sl) energies are, respectively, 6 and 9 cm-’ higher than the values reported by Brown (20), while the extrapolated (36)

128 LE ROY AND BERNSTEIN
[E (9) - E (0)] is 8 cm-’ larger than the value obtained from the data of Darby- shire (36). Since the unreliability of the RKR potential (35) appears to be the
source of the previous (10) anomalous 6 = 6 conclusion, log-log plots similar
to Fig. 11 are not presented here. However, it is noted that increasing D by
2.4 cm-’ from the previous value (18) to the present one altered the binding
energies for the highest levels sufficiently for the last two points on such a log-
log plot to display the proper slope of -5.
Steinfeld et al. (37) calculated RKR turning points for levels 43 s u 5 50
of I, (B 31$U)>, and on analyzing them, concluded that the potential was dis-
playing its theoretical fi = 5 behavior in this region. On the other hand, the
results presented in Figs. 5 and 6 suggest that the potential deviates significantly
from this asymptotic behavior for v 5 55; moreover their (37) apparent CS coefficient is more than 100% larger than the theoretical value.12 Thus, their
li = 5 conclusion appears fortuitous. Their turning points for 43 5 v 5 51 were
based on the measurement of two vibrational bands whose upper states they
assigned as v = 43 and 49. However, their ensuing v = 49 energy is 11.4 cm-’
lower than the value observed by Brown @.Z), suggesting a reassignment of
their 49-l band as 57-2 [see footnote 4, Ref. (II)]. This error in energy errone-
ously compressed the levels 43 < v < 49, and this is the probable source of their
apparent Re5 behavior. In Table VI, the “experimental” Cg values obtained by the present method
are compared to the theoretical values.” Also given are the approximate binding energies beyond which deviations from simple R-’ behavior become apparent, as
indicated by Table II and Figs. 2 and 6. These quantities will depend mainly on
the relative strengths of the contributing Rm5, Rp6, and R-’ potential terms. It
appears that for Brz this range is anomalously small in relation to the relative
TABLE VI
COMPARISON OF PRIZSITNT EXPERIMENTALLY DERIVED CS VALUES (cm-l Ad) WITH THEO- RETICAL ESTIMATES (SEE FOOTNOTIG 12) FOR THE B %o’, STATES OF THE HALOGENS Eb (?I = 5) is the approximate binding energy beyond which deviations from R5 behavior
become apparent in Figs. 2 and 6 and Table II.
Species
Cs , experi- mental
theoretical8
Cl2 Brz I2
1.29 (zkO.2) x 106 1.79 (ztO.2) x 105 3.1, (ztO.2) x 106
1.44 x 10⁵ 2.3s x 105 4.54 x 10⁶
Ea (fi = 5) 60 50b 200
[cm-l]
a See footnote 12. b As discussed in footnote 13, the isotopic assignments of Brown’s (20) levels may be in
error, in which case this 50 cm-’ is a lower bound to & (ii = 5).

POTENTIALS OF THE HALOGENS 129
strengths of the Cg coefficients. However, this may be spurious, due to errors in
either the energies or the assignments of the (79,81) levels of Ref. (20).‘” While the present “experimental” Cg values are seen to be in reasonable
agreement with theory, they are consistently small. Since there may be some
residual bias inherent in the present method (2) it is difficult to make an appraisal
of the theoretical values, although a potential weakness in them was mentioned
in footnote 46 of Ref. (2). However, the qualitative agreement shown in Table
VI does strongly confirm that the highest levels considered in the present analysis
do depend mainly upon the asymptotically dominant R-” potential tail.
V. CONCLUDING REMARKS
The main restriction on the use of the present method (fits to Eq. (4))” is
that the levels considered must lie close enough to the dissociation limit that
their Birge-Sponer plot shows positive curvature. It has also been found very
advantageous to know the theoretical rt for the state under consideration.4 If in
addition the level density is great enough to satisfy the linear approximation of
Eq. (5), then application of Eqs. (6, 7) may yield good approximations to the
best parameter values (see Sect. II). Where appropriate, therefore, plots of the form of Eq. (6) should replace conventional Birge-Sponer extrapolations as a
means of determining the dissociation limit D. It is believed that the present methodology is now sufficiently well docu-
mented2’ to become another everyday tool in the spectroscopists’ data analysis
kit.
RECEIVED: June 26, 1970
REFERENCES
1. R. J. LEROY AND R. B. BERNSTEIN, Chem. Phys. Left. 6, 42 (1970).
2. R. J. LEROY AND R. B. BERNSTEIN, J. Chem. Phys. 62, 3869 (1970).
3. B. N. TAYLOR, W. H. PARKER, AND D. N. LANGENBERG, Rev. Mod. Phys. 41, 375 (1969). 4. M. ARR.~MOWITZ .~ND I. A. STEGUN, “Handbook of Mat,hematical Functions,” Nat.
Bur. Stand. (U.S.) Appl. Math. Ser. 66, U. S. Dept. of Commerce, Washington, I). C. (1964); also available from Dover Publications Inc., New York (1965).
5. R. J. LEROY SND R. B. BERNSTEIN, Univ. Wis. Theoret. Chew Inst. Rep. WIS-TCI-369
(1970), Appendices. 6. J. K. KNIPP, Phys. Rev. 63, 734 (1938).
2o Recently Stwalley (38) presented an alternate derivation of Eq. (4) which he then applied to data for the B ‘Z,+ state of HZ (for which ii = 3j by performing fits t,o Eq. (7) while varying the value of D to minimize deviations. In his more approximate derivation, a numerical factor of ?r/2 occurs in the place of the ratio of gamma functions in Eq. (3) (38). For a given fitted value of H,, , use of hi s numerical fact,or would give values of (‘,, for n = 3 and 6 which are too large by factors of 1.41 and 4.68, respect,ively. However.
Stwalley (38) verified the present Eqs. (3-4) for t)he exact calculat’ed eigenvalues of an LJ (12, 3) potential (i.e., a well with an R3 potent,ial tail), obtaining t,he same good agreement as had previously been found for a model Rfi-t,ailed potential (2).
130 LE ROY AND BERNSTEIN
7. T. Y. CH:\NG, Rev. Mod. Phys. 39, 911 (1967). 8. T. Y. CHANG, Mol. Phys. 13, 487 (1967).
9. A. E. DOIJGL~S, C. K. M$LLER, .~ND B. P. STOICHEFF, Can. J. Phys. 41, 1174 (1963). 10. M. A. BYRNE, W. G. RICHARDS, AND J. A. HORSLEY, Mol. Phys. 12, 273 (1967). 11. R. J. LEROY, J. Chenz. Phys. 62, 2678 (1970). 12. C. E. MOORE, “Atomic Energy Levels,” Vol. 3, Nat. Bur. Stand. (U.S.) C,irc. 467 (1958).
1s. S. AVELLEN, Ark. Fys. 8, 211 (1954). 14. Y. 1’. Rao :~ND P. T:ENI;ATESWARLU, J. Mol. Spectrosc. 9, 173 (1962). 15. M. A. A. CLYNE AND J. A. COXON, J. Mol. Spectrosc. 33, 381 (1970).
16. W. KOLOS AND L. WOLNIEWICZ, J. Chew Phys. 41, 3663 (1964). 17. R. J. LEROY .~ND R. B. BERNSTEIN, J. Chem. Phys. 49, 4312 (1968).
18. J. A. HORSLEY SND It. F. BURROW, Trans. Faraday Sot. 63, 32 (1967). 19. C. F. FISCHER, Can. J. Phys. 46, 2336 (1968), and the report mentioned therein.
20. W. G. BROWN, Phys. Rev. 38, 1179 (1931).
21. J. L. TECH, J. Res. Nat. Bur. Stand., Sect. A 67, 505 (1963). 22. W. G. BROWN, Phys. Rev. 38, 709 (1931).
23. J. I. STEINFELD, R. N. ZSRE, L. JONES, M. LESK, AND W. KLEMPERER, J. Chew Phys. 42, 25 (1965).
24. R. L. BROWN SND T. C. JAMES, J. Chem. Phys. 42, 33 (1965). 25. C. C. KIESS AND C. H. CORLISS, J. Res. Nat. Bur. Stand., Ser. A 63, 1 (1959).
26. R. D. VERMS, J. Chem. Phys. 32, 738 (1960). 27. J. 0. HIRSCHFELDER, C. F. CURTISS, AND R. B. BIRD, “Molecular Theory of Gases and
Liquids,” Wiley, New York, 1964. 28. J. 0. HIRSCHFELDER .~ND W. J. MEBTH, &van. Chem. Phys. 12, 3 (1967).
29. It. 6. LEROY, J. Chew Phys. 62, 2683 (1970). 90. G. L. CILDO~ .\ND C. A. COULSON, Trans. Faraday Sot. 68, 633 (1962).
31. It. T. BIRGE .\ND H. SPONER, Phys. Rev. 28, 259 (1926). 32. R. T. BIRGE, Trans. Faraday Sot. 26, 707 (1929). %‘. A. G. G.\YDON, “Dissociation Energies And Spectra of Diatomic Molecules,” 3rd ed.,
Chapman and Hall, London, 1968. 5’4, R. B. BERNSTEIN, Ph+~. Rev. Lett. 16, 385 (1966). 35. J. A. C. TODD, W. G. RICHaRDS, AND M. A. BYRNE, Trans. Faraday Sot. 63, 2081 (1967).
S6. 0. I~IHI~YSHJRE. Proc. Roy. Sot., Ser. A 169, 93 (1937). 37. J. I. STEINFELD, J. D. CAMPBELL, AND N. A. WEISS, J. Mol. Spectrosc. 29, 204 (1969). 38. W. C. STW.\LLEY, Chem. Phys. Left. 6, 2-H (1970).