Embed Size (px)
Citation preview
Dissemination and Harvesting of Urban Data usingVehicular Sensing Platforms
Uichin Lee†, Eugenio Magistretti∗, Mario Gerla†, Paolo Bellavista∗, Antonio Corradi∗†Department of Computer Science ∗Dipartimento di Elettronica, Informatica e Sistemistica
University of California University of BolognaLos Angeles, CA 90095 Bologna, Italy 40136
{uclee,gerla}@cs.ucla.edu, {emagistretti,pbellavista,acorradi}@deis.unibo.it
Abstract— Recent advances in vehicular communications makeit possible to realize vehicular sensor networks, i.e., collaborativeenvironments where mobile vehicles equipped with sensors ofdifferent nature (from toxic detectors to still/video cameras)inter-work to implement monitoring applications. In particular,there is an increasing interest in proactive urban monitoringwhere vehicles continuously sense events from urban streets,autonomously process sensed data, e.g., recognizing license plates,and possibly route messages to vehicles in their vicinity toachieve a common goal, e.g., to permit police agents to trackthe movements of specified cars. This challenging environmentrequires novel solutions, with respect to those of more traditionalwireless sensor nodes. In fact, different from conventional sen-sor nodes, vehicles exhibit constrained mobility, have no strictlimits on processing power and storage capabilities, and hostsensors that may generate sheer amounts of data, thus makinginapplicable already known solutions for sensor network datareporting. The paper describes MobEyes, an effective middlewarespecifically designed for proactive urban monitoring, that exploitsnode mobility to opportunistically diffuse sensed data summariesamong neighbor vehicles and to create a low-cost index to querymonitoring data. We have thoroughly validated the originalMobEyes protocols and have demonstrated their effectiveness interms of indexing completeness, harvesting time, and overhead.In particular, the paper includes i) analytic models for MobEyesprotocol performance and their consistency with simulation-based results, ii) evaluation of performance as a function ofvehicle mobility, iii) effects of concurrent exploitation of multipleharvesting agents with single/multi-hop communications, iv) eval-uation of network overhead and overall system stability, and v)MobEyes validation in a challenging urban tracking applicationwhere the police reconstructs the movements of a suspiciousdriver, say, by specifying the car license number.
I. INTRODUCTION
Vehicular Ad Hoc Networks (VANETs) are acquiring com-mercial relevance because of recent advances in inter-vehicularcommunications and decreasing costs of related equipment.This is stimulating a brand new family of visionary services forvehicles, from entertainment applications to tourist/advertisinginformation, from driver safety to opportunistic transient con-nectivity to the fixed Internet infrastructure [1], [2], [3], [4].In particular, Vehicular Sensor Networks (VSN) are emergingas a new tool for effectively monitoring the physical world,
This research is supported through participation in the International Tech-nology Alliance sponsored by the U.S. Army Research Laboratory and theU.K. Ministry of Defense under Agreement Number W911NF-06-3-0001,and; by ARMY MURI under funding W911NF0510246
especially in urban areas where a high concentration of vehi-cles equipped with on board sensors is expected [5]. Vehiclesare typically not affected by strict energy constraints and canbe easily equipped with powerful processing units, wirelesstransmitters, and sensing devices even of some complexity,cost, and weight (GPS, chemical spill detectors, still/videocameras, vibration sensors, acoustic detectors, etc.). VSNrepresent a significantly novel and challenging deploymentscenario, considerably different from more traditional wirelesssensor network environments, thus requiring innovative spe-cific solutions. In fact, differently from wireless sensor nodes,vehicles usually exhibit constrained mobility patterns due tostreet layouts, junctions, and speed limitations. In addition,they usually have no strict limits on processing power andstorage capabilities. Most important, they can host sensorsthat may generate huge amounts of data, such as multimediavideo streams, thus making impractical the instantaneous datareporting solutions of conventional wireless sensor networks.
VSN offer a tremendous opportunity for different large scaleapplications, from traffic routing and relief to environmentalmonitoring and distributed surveillance. In particular, there isan increasing interest in proactive urban monitoring serviceswhere vehicles continuously sense events from urban streets,maintain sensed data in their local storage, autonomously pro-cess them, e.g., recognizing license plates, and possibly routemessages to vehicles in their vicinity to achieve a commongoal, e.g., to permit police agents to track the movements ofspecified cars. For instance, proactive urban monitoring couldusefully apply to post-facto crime scene investigation. Reflect-ing on tragedies such as 9/11 and the London bombings, VSNcould have actually helped emergency recovery and forensicinvestigation/criminal apprehension. In the London bombingspolice agents were able to track some of the suspects in thesubway using closed-circuit TV cameras, but they had a hardtime finding helpful evidence from the double-decker bus;this has motivated the installation of more cameras in fixedlocations along London streets. VSN could be an excellentcomplement to the deployment of fixed cameras/sensors. Thecompletely distributed and opportunistic cooperation amongsensor-equipped vehicles has the “deterrent” effect of makingit harder for potential attackers to disable surveillance. Anotherless sensational but relevant example is the need to track themovements of a car, used for a bank robbery, in order to
identify thieves, say. It is highly probable that some vehicleshave spotted the unusual behavior of thieves’ car in the hoursbefore the robbery, and might be able to identify the threat by“opportunistic” correlation of their data with other vehiclesin the neighborhood. It would be much more difficult for thepolice to extract that information from the massive numberof multimedia streams recorded by fixed cameras. As forprivacy, let us briefly note that people are willing to sacrificeprivacy and to accept a reasonable level of surveillance whenthe data can be collected and processed only by recognizedauthorities (with a court order), for forensic purposes and/orfor counteracting terrorism and common crimes.
As shown by the above examples, the reconstruction of acrime and, more generally, the forensic investigation of anevent monitored by VSN require the collection, storage, andretrieval of massive amounts of sensed data. This is a majordeparture from conventional sensor network operations wheredata is dispatched to “sinks” under predefined conditions suchas alarm thresholds. Obviously, it is impossible to deliver allthe streaming data collected by video sensors to a policeauthority sink because of sheer volume. Moreover, inputfiltering is not possible because a priori nobody knows whichdata will be of use for future investigations. The problembecomes one of searching for sensed data in a massive, mobile,opportunistically collected, and completely decentralized stor-age. The challenge is to find a completely decentralized VSNsolution, with low impact on other services, good scalability(up to thousands of nodes), and tolerance of disruption causedby mobility and attacks.
To that purpose, we have designed and implementedMobEyes, a novel middleware that supports VSN-basedproactive urban monitoring applications. MobEyes exploitswireless-enabled vehicles equipped with video cameras anda variety of sensors to perform event sensing, process-ing/classification of sensed data, and inter-vehicle ad hocmessage routing. Since it is impossible to directly reportthe sheer amount of sensed data to the authority, MobEyeskeeps sensed data in mobile node storage; on board processingcapabilities are used to extract features of interest, e.g., licenseplates; mobile nodes periodically generate data summarieswith extracted features and context information such as times-tamps and positioning coordinates; mobile agents, e.g., policepatrolling cars, move and opportunistically harvest summariesas needed from neighbor vehicles. MobEyes adopts VSN cus-tom designed protocols for summary diffusion/harvesting thatexploit intrinsic vehicle mobility and simple single-hop inter-vehicle communications. In that way, MobEyes harvestingagents can create a low-cost opportunistic index to query thedistributed sensed data storage, thus enabling us to answerquestions such as: which vehicles were in a given place at agiven time? which route did a certain vehicle take in a giventime interval?, and which vehicle collected and stored the dataof interest?
In this paper, we make the following contributions:• We define a vehicular sensing platform and propose
MobEyes vehicular sensing architecture. We synthesize
the existing techniques to build a MobEyes system thatsatisfies the key design principles, namely disruptiontolerance, scalability, and non-intrusiveness.
• We propose an analytic model that can accurately pre-dict MobEyes performance, and formally show that ourprotocol is scalable and non-intrusive.
• We provide extensive simulation results as follows: i)evaluation of performance dependence on vehicle mo-bility models, ii) effects of concurrent exploitation ofmultiple harvesting agents with single/multi-hop com-munications, iii) evaluation of network overhead andoverall system stability, and iv) MobEyes validation in achallenging urban tracking application where the policeobtain the route followed by a car by simply specifyingits plate number.
• We overview the primary security requirements stemmingfrom VSN-based proactive urban monitoring applications,and show how they can be addressed via state-of-the-artsolutions in the literature. MobEyes integrates these so-lutions and permits to enable/disable them at deploymenttime depending on the required degree of security/privacy.
The rest of the paper is organized as follows. Section IIdescribes background and related work, by positioning theoriginal MobEyes contributions. Section III presents the over-all MobEyes architecture, while Section IV details our origi-nal protocols for opportunistic summary diffusion/harvesting.Section V analytically models the performance of MobEyesprotocols, which are extensively evaluated via simulationsin Section VI. Section VII gives a rapid overview of secu-rity/privacy issues and related solutions. Finally, Section VIIIconcludes the paper.
II. BACKGROUND AND RELATED WORK
The idea of embedding sensors in vehicles is very novel.To our knowledge, the only research project dealing with theMobEyes-addressed challenging issues of car-based sensingand distributed opportunistic search of sensed data is MIT’sCarTel [6], [7]. In CarTel users submit their queries aboutsensed data on a portal hosted on the wired Internet. Then, anintermittently connected database is in charge of dispatching“queries” to vehicles and of receiving replies when vehiclesmove in the proximity of open access points to the Internet.Other interesting research projects have focused on the closearea of providing mobile Internet access to vehicles. Forinstance, InternetCar aims to provide vehicles with seamlessInternet connectivity, by envisioning various applications suchas a traffic information dissemination service where “raw”sensed data from vehicles are collected in a central serverand traffic information is distributed to the drivers [8], [9].Differently from CarTel and InternetCar, MobEyes exploitsmobile collector agents instead of relying on the wired Internetinfrastructure, thus improving robustness. Note that also theFleetNet project, which aims to develop an inter-vehicle com-munication platform for vehicular applications, recognized thepotential of services that distribute location-tagged information(e.g., traffic jam warning) by collecting and processing data
2
from cars in a distributed fashion [10], [11]. In this paper,we originally propose how to design and implement suchapplications using vehicular sensor networks.
Related work has recently emerged in two other relatedfields: VANET and “opportunistic” sensor networks. Finally,to permit the full understanding of the MobEyes proposal, weprovide a brief illustration of how Bloom filters work and oftheir exploitation in networking fields.
A. VANET
Recent research is envisioning a large number of appli-cations specifically designed for VANET, including: (i) safecooperative driving where emergency information is diffusedto neighbor vehicles and real-time response is required to avoidaccidents [3]; (ii) entertainment support, e.g., content shar-ing [1], advertisements [2], peer-to-peer marketing [12]; and(iii) distributed data collection, e.g., parking lot [13] or trafficcongestion info [14]. So far, however, most VANET researchhas focused on routing issues. Several VANET applications,e.g., related to safety or traffic/commercial advertising, callfor the delivery of messages to all nodes located close tothe sender, with high delivery rate and short delay. Recentresearch addressed this issue by proposing original broad-cast strategies [15], [3]. However, single-hop broadcast doesnot provide full support to advertising applications; effectivemulti-hop dissemination solutions should be also investigated[16].
Packet delivery issues in areas with sparse vehicles havestimulated several recent research contributions to investi-gate carry-and-forward strategies. In [17], authors simulatea straight highway scenario to compare two ideal strategies:pessimistic (i.e., synchronous), where sources send packets todestinations only as soon as a multi-hop path is available,and optimistic (i.e., carry-and-forward), where intermediatenodes hold packets until a neighbor closer to the destinationis detected. Under the implicit assumptions of i) unboundedmessage buffers and bandwidth, and ii) of easily predictablemobility patterns as for vehicles on a highway, the latter hasdemonstrated to achieve a lower delivery delay. However, inmore realistic situations, carry-and-forward protocols call forcareful design and tuning. MaxProp [18], part of the UMassDieselNet project [19], is a ranking strategy to determinepacket delivery order when node encounters occasionallyoccur, as well as dropping priorities in the case of fullbuffers. Precedence is given to packets destined to the otherparty, then to routing information, to acknowledgements, topackets with small hop-counts, and finally to packets with ahigh probability of being delivered through the other party.VADD [20] rests on the assumption that most node encountershappen in intersection areas. Effective decision strategies areproposed, highly reducing packet delivery failures and delay.
Applications for distributed data collection in VANET callfor geographic dissemination strategies that deliver packets toall nodes belonging to target remote areas, despite possiblyinterrupted paths [21], [14]. MDDV [21] exploits geographicforwarding to the destination region, favoring paths where
vehicle density is higher. In MDDV, messages are carried byhead vehicles, i.e., best positioned toward the destination withrespect to their neighbors. As an alternative, [14] proposesseveral strategies based on virtual potential fields generatedby propagation functions: any node estimates its positionin the field and retransmits packets until nodes placed inlocations with lower potential values are found; this procedureis repeated until minima target zones are detected.
B. Opportunistic Sensor Networking
Traditionally, sensor networks have been deployed in staticenvironments, with application-specific monitoring tasks. Re-cently, opportunistic sensor networks have emerged, whichexploit existing devices and sensors, such as cameras in mobilephones [22], [23], [24], [25]. Several of these networks arerelevant to our research because they can easily implementopportunistic dissemination protocols [26], [27].
Dartmouth’s MetroSense [28], [22] is closely related toMobEyes. [22] describes a three tier architecture for Met-roSense: servers in the wired Internet are in charge ofstoring/processing sensed data; Internet-connected stationarySensor Access Points (SAP) act as gateways between serversand mobile sensors (MS); MS move in the field opportunis-tically delegating tasks to each other, and “muling” [29],[30] data to SAP. MetroSense requires infrastructure support,including Internet-connected servers and remotely deployedSAP. Similarly, Wang et al. proposed data delivery schemesin Delay/Fault-Tolerant Mobile Sensor Network (DFT-MSN)for human-oriented pervasive information gathering [31]. Thetrade-off between data delivery ratio/delay and replicationoverhead is mainly investigated in the case of buffer andenergy resource constraints. In contrast, MobEyes does notrequire any fixed infrastructure by using mobile sinks (oragents) and addresses VANET-specific deployment scenarios;e.g., powerful sensing platforms, distributed index collection,etc.
Application-level protocols for the resolution of queriesto sensed data have been proposed in [23], [24]. Contoryabstracts the network as a database and can resolve declarativequeries; Spatial Programming hides remote resources, suchas nodes, under local variables, thus enabling transparentaccess; finally, Migratory Services are components that reactto changing context, e.g., the target moving out of range bymigrating to other nodes [23]. [24] presents VITP, a query-response protocol to obtain traffic-related information fromremote areas: the primary idea is that the source specifies thetarget area when injecting a query in the environment,; nodesin the target area form a virtual ad hoc query server.
Among recent research projects about opportunistic sensing,we mention Intel IrisNet [32] and Microsoft SenseWeb [33].Both projects investigate the integration of heterogeneoussensing platforms in the Internet via a common data publishingarchitecture. Finally, we point out CENS’ Urban Sensingproject [34], [25], a recently started multi-disciplinary projectaddressing “participatory” sensing, where urban monitoring
3
applications receive data from mobile sensors operated bypeople.
Finally, regarding dissemination of sensed data throughpeers, we can mention two solutions from the naturalisticenvironment, namely ZebraNet [26] and SWIM [27]. ZebraNetaddresses remote wildlife tracking, e.g., zebras in MpalaResearch Center in Kenya, by equipping animals with collarsthat embed wireless communication devices, GPS, and biomet-ric sensors. As GPS-equipped animals drift within the park,their collars opportunistically exchange sensed data, whichmust make its way to the base station (the ranger’s truck).ZebraNet proposes two dissemination protocols: a flooding-based approach where zebras exchange all the data withintheir buffers (either locally generated or received from otheranimals) with neighbors, and a history-based protocol wheredata is uploaded only to zebras with good track record of basestation encounters. SWIM [27] addresses sparse mobile sensornetworks with fixed Infostations as collecting points. Senseddata is epidemically disseminated via single-hop flooding toencountered nodes and offloaded when Infostations are inreach.
While all the above schemes implement peer-to-peer dis-semination, none fits the performance requirements of theMobEyes target scenario. Flooding generates excessive over-head, while history-based is ineffective in the very dynamicVANET where the base station (the agent’s vehicle) rapidlymoves without following a specific mobility pattern [26]. Inaddition, let us note that MobEyes nodes do not transmit rawcollected data but, thanks to abundance of on board computingresources, they locally process data and relay only shortsummaries. That is a relevant advantage since data collectedin VSN, e.g., from video cameras, may be order-of-magnitudelarger than data sensed in naturalistic scenarios.
C. Bloom Filter and Its Applications
Bloom filter [35] is a space-efficient randomized data struc-ture for representing a set and is mainly used for membershipchecking. A Bloom filter for representing a set of ω elements,S = {s1, s2, · · · , sω}, consists of m bits, which are initiallyset to 0. The filter uses � independent random hash functionsh1, · · · , h� within m bits. By applying these hash functions,the filter records the presence of each element into the m bitsby setting � corresponding bits; to check the membership ofthe element x, it is sufficient to verify whether all hi(x) areset to 1. Although membership checking in a Bloom filteris probabilistic and false positives are possible, it has beenwidely used for applications where “space saving” outweighsthe drawback of errors.
Bloom filters have gained momentum in networking fieldsby virtue of their space efficiency, thus reducing the amount oftransmitted data and consequently saving energy. Readers canfind a survey of Bloom filter-based networking applications in[36]. Bloom filters are mostly used for: simple membershipchecking [37], [38], set difference (or reconciliation) [39],and set intersection [40]. Fan et al. proposed a SummaryCache where a set of distributed Web proxies use Bloom
MSI (Sensor Interface)
DSRC Compliant Driver
MDP (Data Processing)
J2SE
JMF API Java Comm. API
Java Loc. API
GPSRadio Transceiver
Bio/ChemSensors
A/VSensors
MDHP (Diffusion/Harvesting)
SummaryDatabase
Raw DataStorage
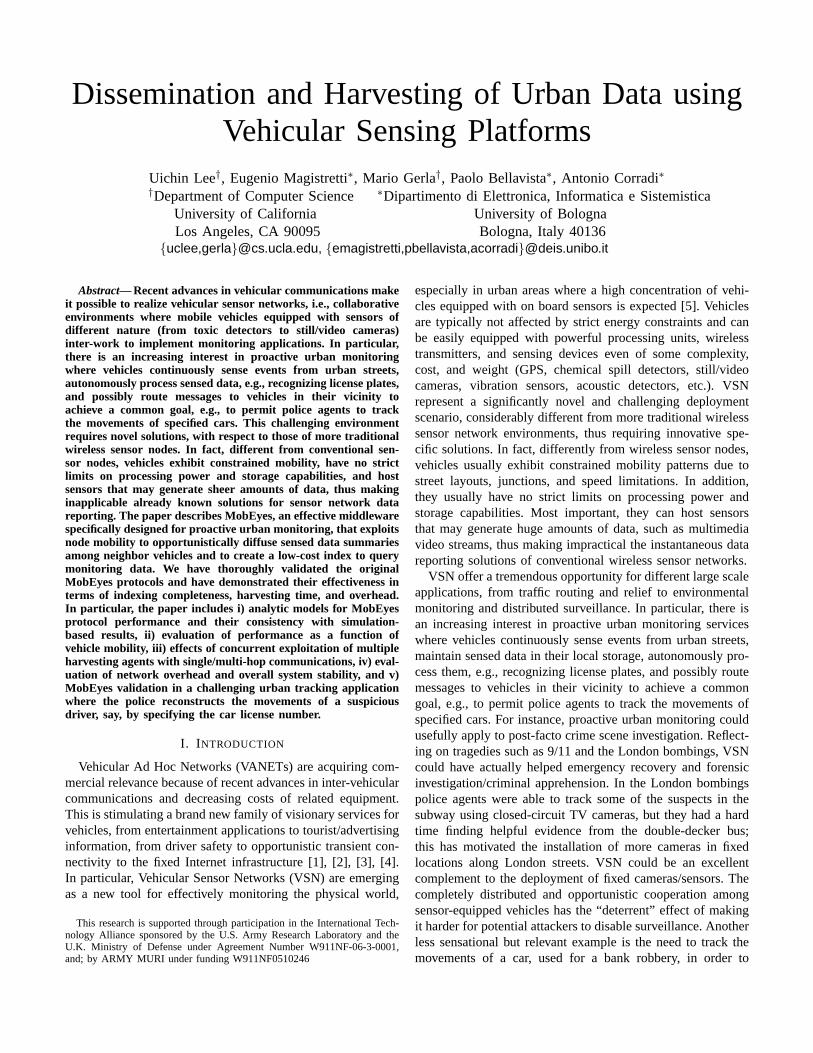
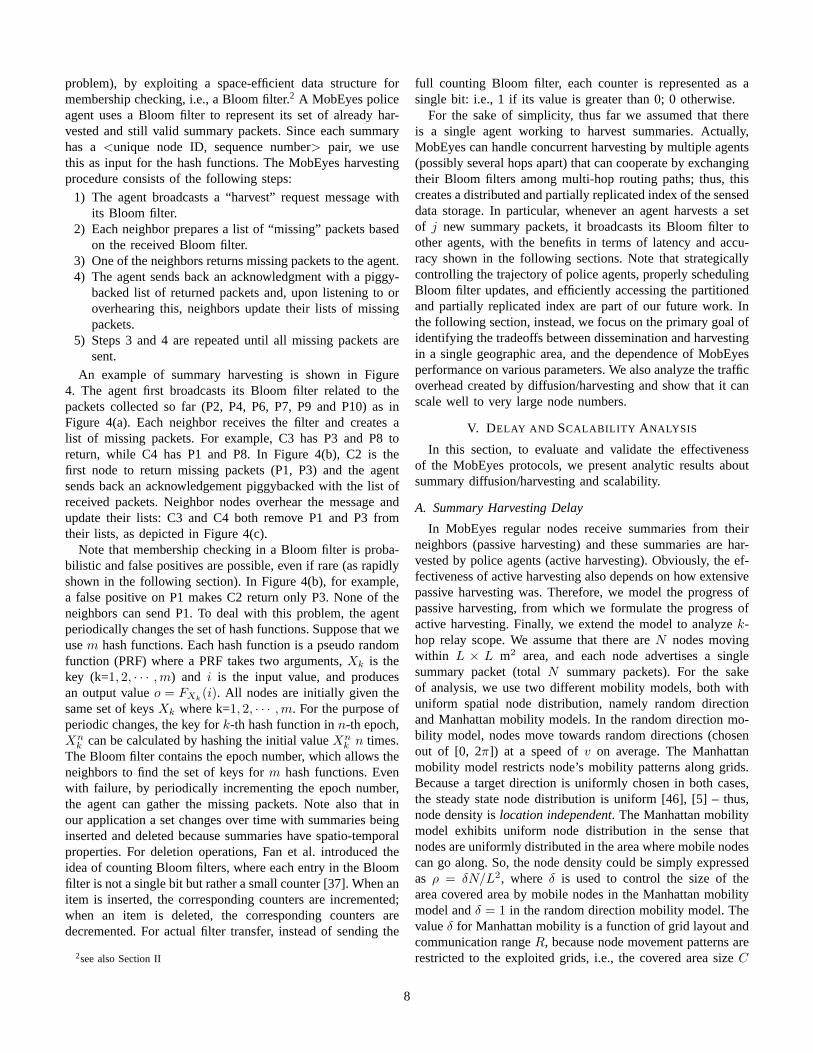
Fig. 1. MobEyes sensor node architecture.
filters to disseminate the content of their cache [37]. Similarly,Ye et al. exploited them to store MAC addresses for simplemembership checking in wireless sensor networks [38]. Forset reconciliation, Byers et al. proposed a method that usesa comparison tree over a Bloom filter [39], which allows forfaster search of elements in the difference set (when differencesets are small). To find set intersection without transmissionentire sets, Reynolds et al. used Bloom filters for keywordsearch in a P2P overlay network [40].
III. MOBEYES ARCHITECTURE
For the sake of clarity, we present the MobEyes solu-tion using one of its possible practical application scenarios:collecting information from MobEyes-enabled vehicles aboutcriminals that spread poisonous chemicals in a particularsection of the city (say, subway station). We suspect that thecriminals have used vehicles for the attack. Thus, MobEyeswill help detect the vehicles and permit tracking and capture.Here, we assume that vehicles are equipped with cameras andchemical detection sensors. Vehicles continuously generate ahuge amount of sensed data, store it locally, and periodi-cally produce short summary chunks obtained by processingsensed data, e.g., license plate numbers or aggregated chemicalreadings. Summary chunks are aggregated in summaries thatare opportunistically disseminated to neighbor vehicles, thusenabling metadata harvesting by the police in order to create adistributed metadata index, useful for forensic purposes suchas crime scene reconstruction and criminal tracking.
To support all the above tasks, we have developed MobEyesaccording to the component-based architecture depicted inFigure 1. The key component is the MobEyes Diffu-sion/Harvesting Processor (MDHP) which will be discussedin detail in the next section. MDHP works by opportunis-tically disseminating/harvesting summaries produced by theMobEyes Data Processor (MDP), which accesses sensor datavia the MobEyes Sensor Interface (MSI). Since vehicles arenot strictly resource-constrained, our MobEyes prototype isbuilt on top of the Java Standard Edition (J2SE) virtual ma-chine. MDP is in charge of reading raw sensed data (via MSI),processing it, and generating chunks. Chunks include metadata(vehicle position, timestamp, vehicle ID number and possibleadditional context such as simultaneous sensor alerts) andfeatures of interest extracted by local filters (See Figure 2). Forinstance, in the above application scenario, MDP includes afilter determining license plate numbers from multimedia flowstaken by cameras [41]. Finally, MDP commands the storage
4
UIDMsg.Type
HEADER
SEQ # X-loc Y-loc
SUMMARY CHUNK 1
TimeStamp X-loc Y-loc Summary Chunk Payload
TimeStamp X-loc Y-loc Summary Chunk Payload
TimeStamp
SUMMARY CHUNK N
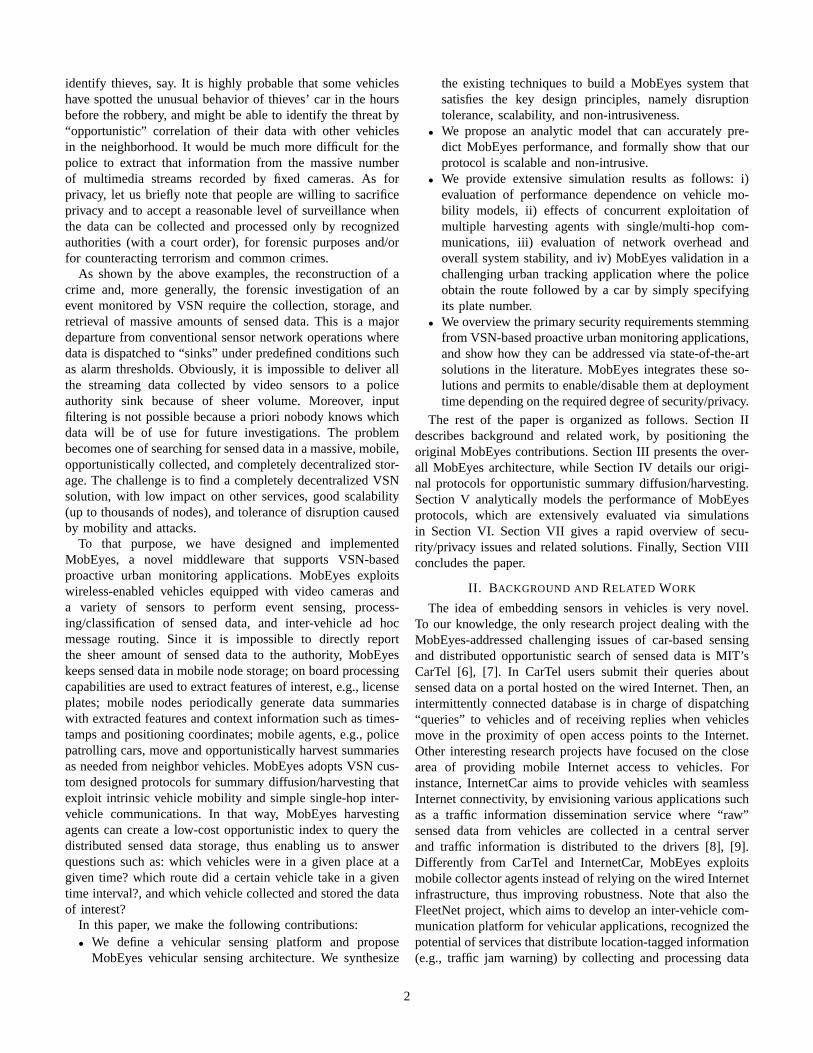
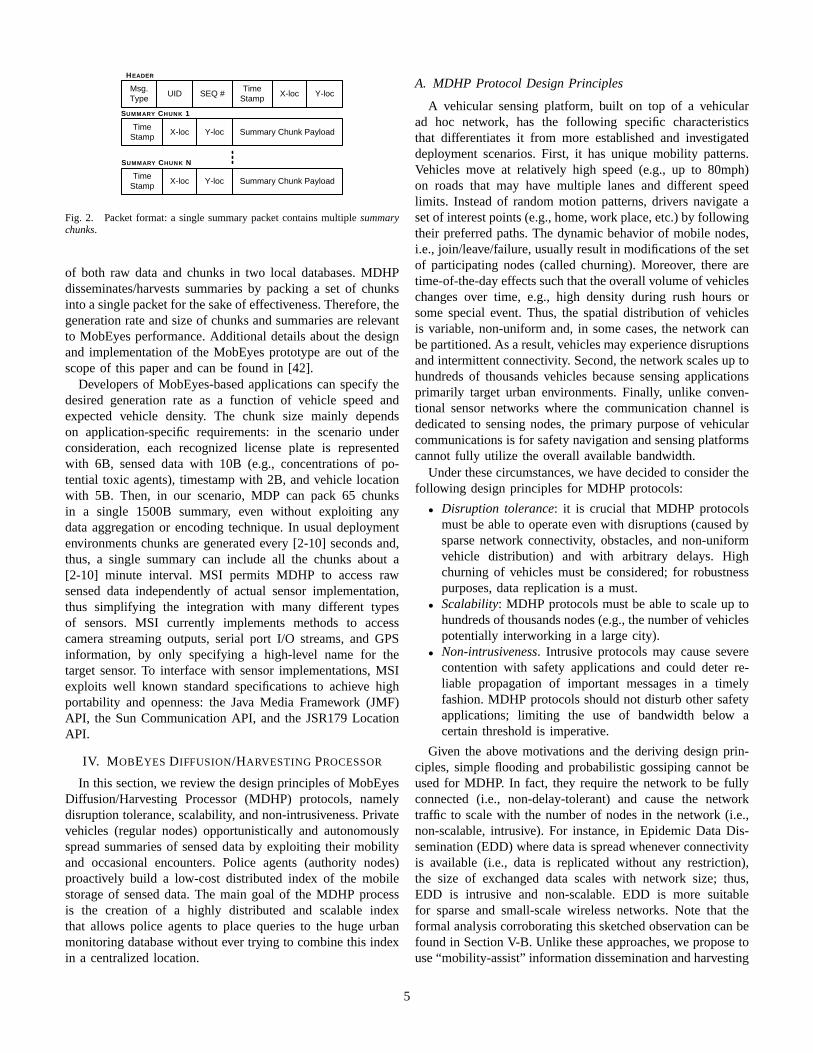
Fig. 2. Packet format: a single summary packet contains multiple summarychunks.
of both raw data and chunks in two local databases. MDHPdisseminates/harvests summaries by packing a set of chunksinto a single packet for the sake of effectiveness. Therefore, thegeneration rate and size of chunks and summaries are relevantto MobEyes performance. Additional details about the designand implementation of the MobEyes prototype are out of thescope of this paper and can be found in [42].
Developers of MobEyes-based applications can specify thedesired generation rate as a function of vehicle speed andexpected vehicle density. The chunk size mainly dependson application-specific requirements: in the scenario underconsideration, each recognized license plate is representedwith 6B, sensed data with 10B (e.g., concentrations of po-tential toxic agents), timestamp with 2B, and vehicle locationwith 5B. Then, in our scenario, MDP can pack 65 chunksin a single 1500B summary, even without exploiting anydata aggregation or encoding technique. In usual deploymentenvironments chunks are generated every [2-10] seconds and,thus, a single summary can include all the chunks about a[2-10] minute interval. MSI permits MDHP to access rawsensed data independently of actual sensor implementation,thus simplifying the integration with many different typesof sensors. MSI currently implements methods to accesscamera streaming outputs, serial port I/O streams, and GPSinformation, by only specifying a high-level name for thetarget sensor. To interface with sensor implementations, MSIexploits well known standard specifications to achieve highportability and openness: the Java Media Framework (JMF)API, the Sun Communication API, and the JSR179 LocationAPI.
IV. MOBEYES DIFFUSION/HARVESTING PROCESSOR
In this section, we review the design principles of MobEyesDiffusion/Harvesting Processor (MDHP) protocols, namelydisruption tolerance, scalability, and non-intrusiveness. Privatevehicles (regular nodes) opportunistically and autonomouslyspread summaries of sensed data by exploiting their mobilityand occasional encounters. Police agents (authority nodes)proactively build a low-cost distributed index of the mobilestorage of sensed data. The main goal of the MDHP processis the creation of a highly distributed and scalable indexthat allows police agents to place queries to the huge urbanmonitoring database without ever trying to combine this indexin a centralized location.
A. MDHP Protocol Design Principles
A vehicular sensing platform, built on top of a vehicularad hoc network, has the following specific characteristicsthat differentiates it from more established and investigateddeployment scenarios. First, it has unique mobility patterns.Vehicles move at relatively high speed (e.g., up to 80mph)on roads that may have multiple lanes and different speedlimits. Instead of random motion patterns, drivers navigate aset of interest points (e.g., home, work place, etc.) by followingtheir preferred paths. The dynamic behavior of mobile nodes,i.e., join/leave/failure, usually result in modifications of the setof participating nodes (called churning). Moreover, there aretime-of-the-day effects such that the overall volume of vehicleschanges over time, e.g., high density during rush hours orsome special event. Thus, the spatial distribution of vehiclesis variable, non-uniform and, in some cases, the network canbe partitioned. As a result, vehicles may experience disruptionsand intermittent connectivity. Second, the network scales up tohundreds of thousands vehicles because sensing applicationsprimarily target urban environments. Finally, unlike conven-tional sensor networks where the communication channel isdedicated to sensing nodes, the primary purpose of vehicularcommunications is for safety navigation and sensing platformscannot fully utilize the overall available bandwidth.
Under these circumstances, we have decided to consider thefollowing design principles for MDHP protocols:
• Disruption tolerance: it is crucial that MDHP protocolsmust be able to operate even with disruptions (caused bysparse network connectivity, obstacles, and non-uniformvehicle distribution) and with arbitrary delays. Highchurning of vehicles must be considered; for robustnesspurposes, data replication is a must.
• Scalability: MDHP protocols must be able to scale up tohundreds of thousands nodes (e.g., the number of vehiclespotentially interworking in a large city).
• Non-intrusiveness. Intrusive protocols may cause severecontention with safety applications and could deter re-liable propagation of important messages in a timelyfashion. MDHP protocols should not disturb other safetyapplications; limiting the use of bandwidth below acertain threshold is imperative.
Given the above motivations and the deriving design prin-ciples, simple flooding and probabilistic gossiping cannot beused for MDHP. In fact, they require the network to be fullyconnected (i.e., non-delay-tolerant) and cause the networktraffic to scale with the number of nodes in the network (i.e.,non-scalable, intrusive). For instance, in Epidemic Data Dis-semination (EDD) where data is spread whenever connectivityis available (i.e., data is replicated without any restriction),the size of exchanged data scales with network size; thus,EDD is intrusive and non-scalable. EDD is more suitablefor sparse and small-scale wireless networks. Note that theformal analysis corroborating this sketched observation can befound in Section V-B. Unlike these approaches, we propose touse “mobility-assist” information dissemination and harvesting
5
in MobEyes. Data are replicated via periodic “single-hop”broadcasting (i.e., only the data originator can broadcast itsdata) for a given period of time. Through the mobility ofcarriers, the data will be delivered to a set of harvesting agents.Mobility-assist dissemination and harvesting per se are delay-and disruption-tolerant, and, as extensively detailed in the fol-lowing, single-hop broadcasting-based localized informationexchange makes our protocols non-intrusive and scalable.
B. Summary Diffusion
By following the above guidelines, in MobEyes any regularnode periodically advertises a new packet with generatedsummaries to its current neighbors in order to increase theopportunities for agents to harvest summaries. Clearly, ex-cessive advertising will introduce too much overhead (as inEDD), while no advertising at all (i.e., direct contact) willintroduce unacceptable delays, as agents will need to directlycontact each individual source of monitoring information tocomplete the harvesting process. Thus, MobEyes tries to tradeoff delivery latency with advertisement overhead. As depictedin Figure 2, a packet header includes packet type, generator ID,locally unique sequence number, packet generation timestamp,and generator’s current position. Each packet is uniquelyidentified by a <generator ID,sequence number> pair andcontains a set of summaries locally generated during a fixedtime interval.1
Neighbor nodes receiving a packet store it in their localsummary databases. Therefore, depending on the mobility andthe encounters of regular nodes, packets are opportunisticallydiffused into the network (passive diffusion). MobEyes can beconfigured to perform either single-hop passive diffusion (onlythe original source of the data advertises its packet to currentsingle-hop neighbors) or k-hop passive diffusion (the packettravels up to k-hop as it is forwarded by j-hop neighbors withj < k). Other diffusion strategies could be easily included inMobEyes, for instance single-hop active diffusion where anynode periodically advertises all packets (generated by itselfand received from others) in its local summary databases,at the expense of a greater traffic overhead. As detailed inthe experimental evaluation section, in a usual urban VANET(node mobility restricted by roads), it is sufficient for MobEyesto exploit the lightweight k-hop passive diffusion strategy withvery small k values to achieve the desired diffusion levels.
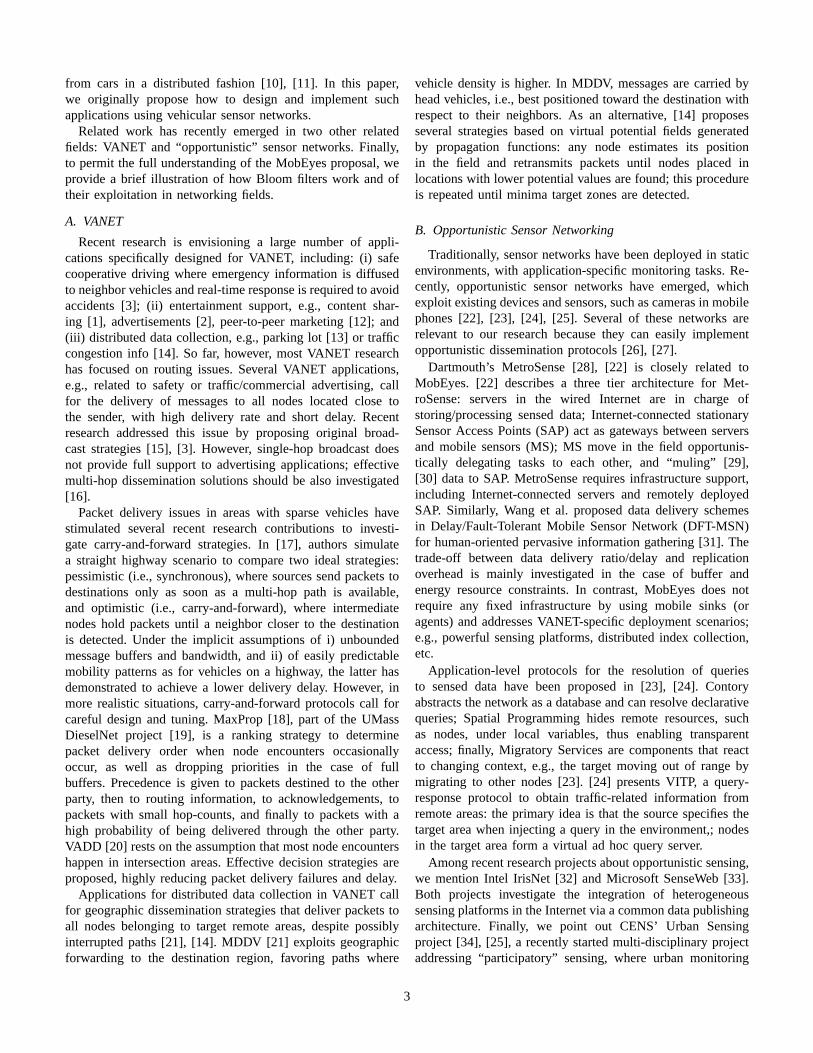
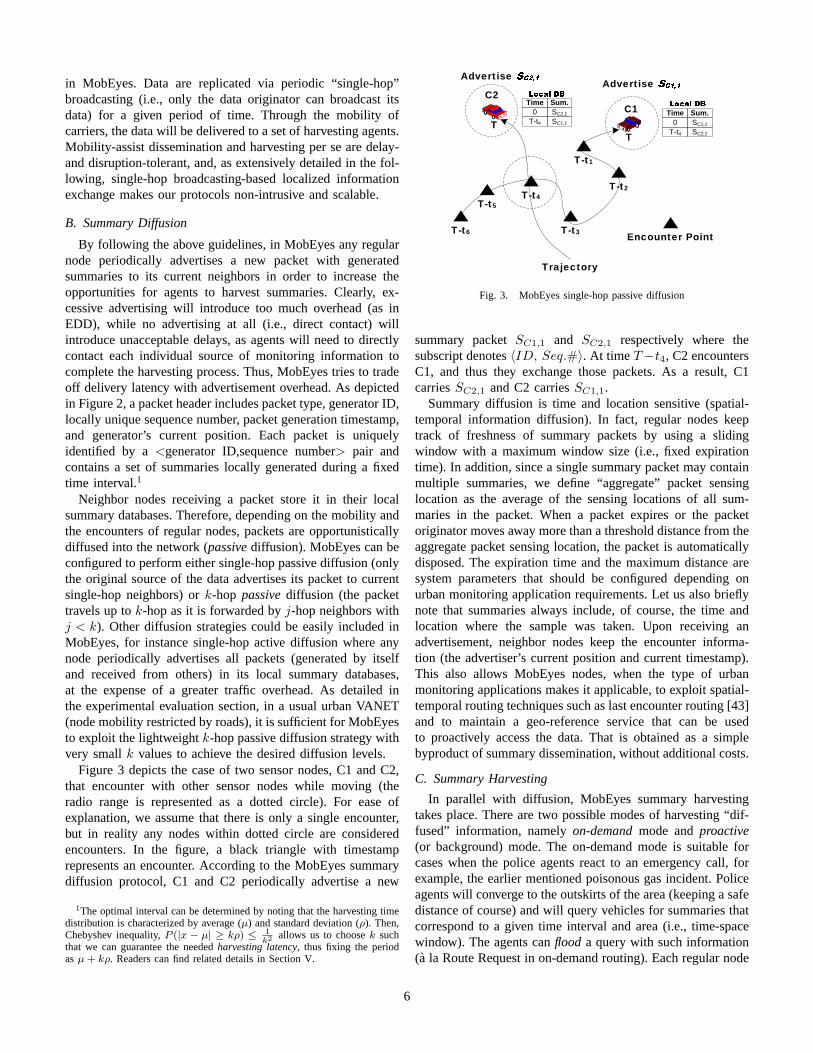
Figure 3 depicts the case of two sensor nodes, C1 and C2,that encounter with other sensor nodes while moving (theradio range is represented as a dotted circle). For ease ofexplanation, we assume that there is only a single encounter,but in reality any nodes within dotted circle are consideredencounters. In the figure, a black triangle with timestamprepresents an encounter. According to the MobEyes summarydiffusion protocol, C1 and C2 periodically advertise a new
1The optimal interval can be determined by noting that the harvesting timedistribution is characterized by average (μ) and standard deviation (ρ). Then,Chebyshev inequality, P (|x − μ| ≥ kρ) ≤ 1
k2 allows us to choose k suchthat we can guarantee the needed harvesting latency, thus fixing the periodas μ + kρ. Readers can find related details in Section V.
TT
T-t6
T-t5T-t4
T-t3
T-t2
T-t1
Trajectory
C1C2
Advertise Advertise
Encounter Point
Time Sum.0
T-t4SC1,1
SC2,1
Time Sum.0
T-t4SC2,1
SC1,1
Fig. 3. MobEyes single-hop passive diffusion
summary packet SC1,1 and SC2,1 respectively where thesubscript denotes 〈ID, Seq.#〉. At time T−t4, C2 encountersC1, and thus they exchange those packets. As a result, C1carries SC2,1 and C2 carries SC1,1.
Summary diffusion is time and location sensitive (spatial-temporal information diffusion). In fact, regular nodes keeptrack of freshness of summary packets by using a slidingwindow with a maximum window size (i.e., fixed expirationtime). In addition, since a single summary packet may containmultiple summaries, we define “aggregate” packet sensinglocation as the average of the sensing locations of all sum-maries in the packet. When a packet expires or the packetoriginator moves away more than a threshold distance from theaggregate packet sensing location, the packet is automaticallydisposed. The expiration time and the maximum distance aresystem parameters that should be configured depending onurban monitoring application requirements. Let us also brieflynote that summaries always include, of course, the time andlocation where the sample was taken. Upon receiving anadvertisement, neighbor nodes keep the encounter informa-tion (the advertiser’s current position and current timestamp).This also allows MobEyes nodes, when the type of urbanmonitoring applications makes it applicable, to exploit spatial-temporal routing techniques such as last encounter routing [43]and to maintain a geo-reference service that can be usedto proactively access the data. That is obtained as a simplebyproduct of summary dissemination, without additional costs.
C. Summary Harvesting
In parallel with diffusion, MobEyes summary harvestingtakes place. There are two possible modes of harvesting “dif-fused” information, namely on-demand mode and proactive(or background) mode. The on-demand mode is suitable forcases when the police agents react to an emergency call, forexample, the earlier mentioned poisonous gas incident. Policeagents will converge to the outskirts of the area (keeping a safedistance of course) and will query vehicles for summaries thatcorrespond to a given time interval and area (i.e., time-spacewindow). The agents can flood a query with such information(a la Route Request in on-demand routing). Each regular node
6
P2 P4 P6P7 P9 P10
C1
C2
C3
C4
(a) Broadcast a harvest request
C1
C2
C3
C4
P5 P8 P3 P8
P1 P3
P1P3
P1 P8
(b) C2 first returns missing packets
C1
C2
C3
C4
ACK: P1 P3
P5 P8 P8
P8
(c) Broadcast acknowledgement
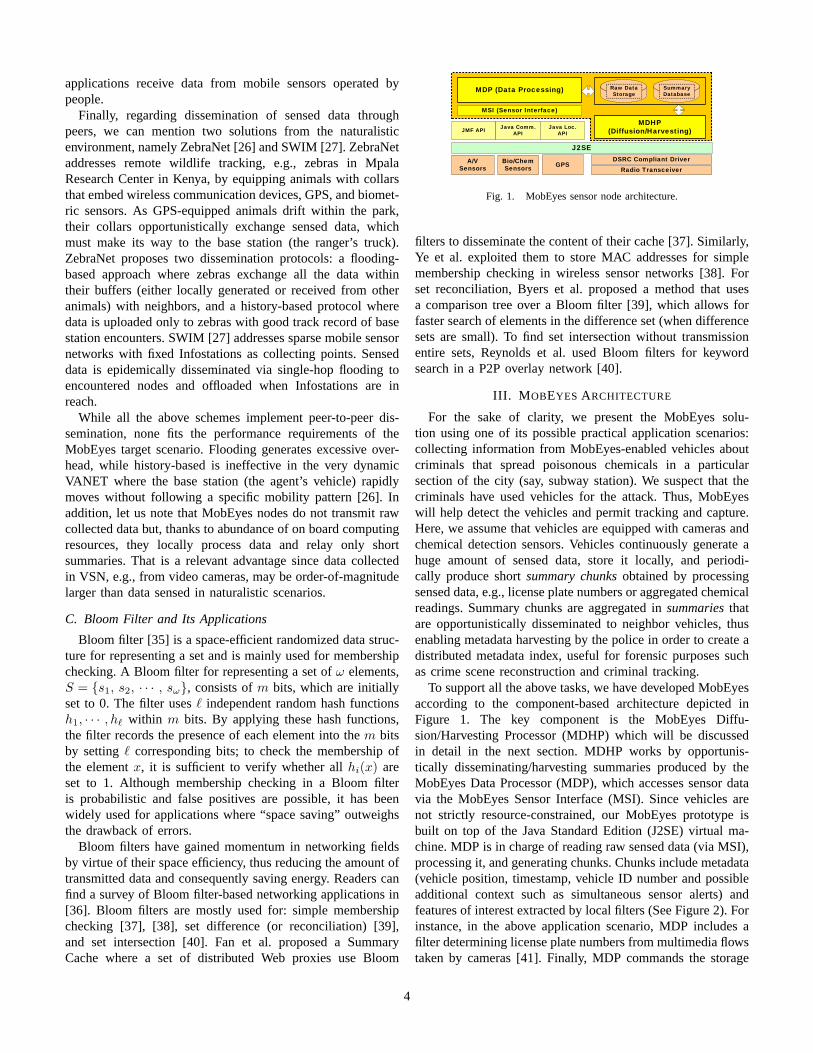
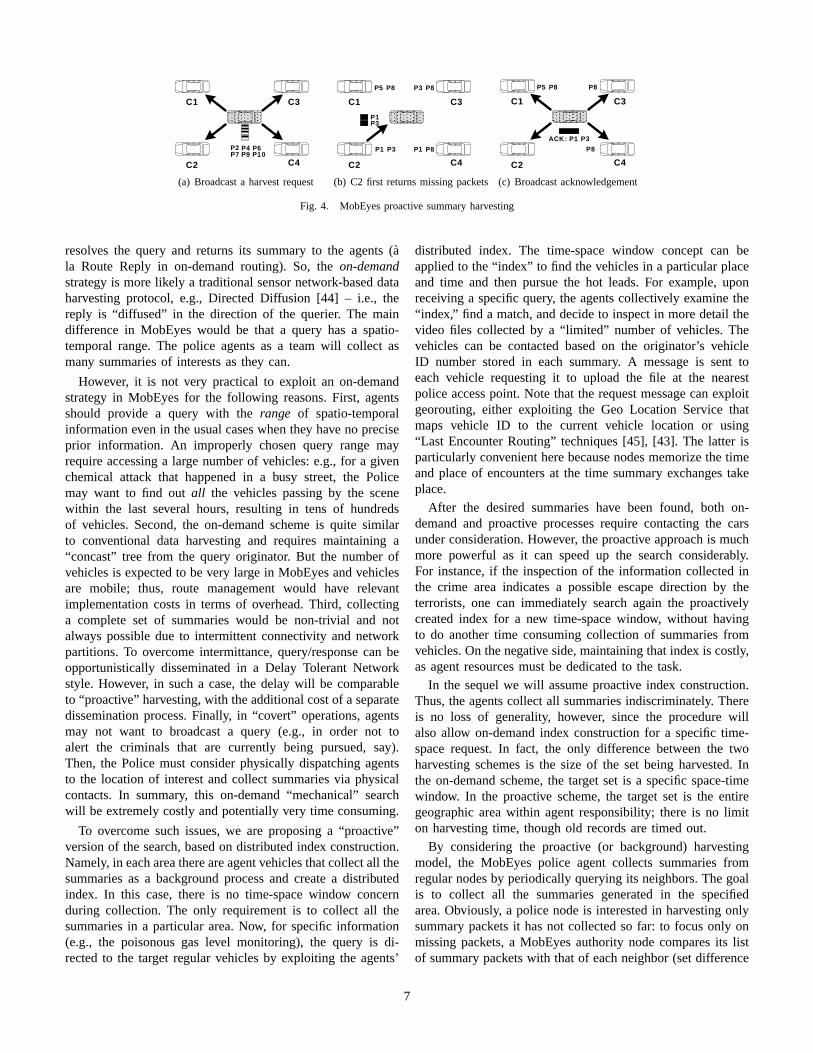
Fig. 4. MobEyes proactive summary harvesting
resolves the query and returns its summary to the agents (ala Route Reply in on-demand routing). So, the on-demandstrategy is more likely a traditional sensor network-based dataharvesting protocol, e.g., Directed Diffusion [44] – i.e., thereply is “diffused” in the direction of the querier. The maindifference in MobEyes would be that a query has a spatio-temporal range. The police agents as a team will collect asmany summaries of interests as they can.
However, it is not very practical to exploit an on-demandstrategy in MobEyes for the following reasons. First, agentsshould provide a query with the range of spatio-temporalinformation even in the usual cases when they have no preciseprior information. An improperly chosen query range mayrequire accessing a large number of vehicles: e.g., for a givenchemical attack that happened in a busy street, the Policemay want to find out all the vehicles passing by the scenewithin the last several hours, resulting in tens of hundredsof vehicles. Second, the on-demand scheme is quite similarto conventional data harvesting and requires maintaining a“concast” tree from the query originator. But the number ofvehicles is expected to be very large in MobEyes and vehiclesare mobile; thus, route management would have relevantimplementation costs in terms of overhead. Third, collectinga complete set of summaries would be non-trivial and notalways possible due to intermittent connectivity and networkpartitions. To overcome intermittance, query/response can beopportunistically disseminated in a Delay Tolerant Networkstyle. However, in such a case, the delay will be comparableto “proactive” harvesting, with the additional cost of a separatedissemination process. Finally, in “covert” operations, agentsmay not want to broadcast a query (e.g., in order not toalert the criminals that are currently being pursued, say).Then, the Police must consider physically dispatching agentsto the location of interest and collect summaries via physicalcontacts. In summary, this on-demand “mechanical” searchwill be extremely costly and potentially very time consuming.
To overcome such issues, we are proposing a “proactive”version of the search, based on distributed index construction.Namely, in each area there are agent vehicles that collect all thesummaries as a background process and create a distributedindex. In this case, there is no time-space window concernduring collection. The only requirement is to collect all thesummaries in a particular area. Now, for specific information(e.g., the poisonous gas level monitoring), the query is di-rected to the target regular vehicles by exploiting the agents’
distributed index. The time-space window concept can beapplied to the “index” to find the vehicles in a particular placeand time and then pursue the hot leads. For example, uponreceiving a specific query, the agents collectively examine the“index,” find a match, and decide to inspect in more detail thevideo files collected by a “limited” number of vehicles. Thevehicles can be contacted based on the originator’s vehicleID number stored in each summary. A message is sent toeach vehicle requesting it to upload the file at the nearestpolice access point. Note that the request message can exploitgeorouting, either exploiting the Geo Location Service thatmaps vehicle ID to the current vehicle location or using“Last Encounter Routing” techniques [45], [43]. The latter isparticularly convenient here because nodes memorize the timeand place of encounters at the time summary exchanges takeplace.
After the desired summaries have been found, both on-demand and proactive processes require contacting the carsunder consideration. However, the proactive approach is muchmore powerful as it can speed up the search considerably.For instance, if the inspection of the information collected inthe crime area indicates a possible escape direction by theterrorists, one can immediately search again the proactivelycreated index for a new time-space window, without havingto do another time consuming collection of summaries fromvehicles. On the negative side, maintaining that index is costly,as agent resources must be dedicated to the task.
In the sequel we will assume proactive index construction.Thus, the agents collect all summaries indiscriminately. Thereis no loss of generality, however, since the procedure willalso allow on-demand index construction for a specific time-space request. In fact, the only difference between the twoharvesting schemes is the size of the set being harvested. Inthe on-demand scheme, the target set is a specific space-timewindow. In the proactive scheme, the target set is the entiregeographic area within agent responsibility; there is no limiton harvesting time, though old records are timed out.
By considering the proactive (or background) harvestingmodel, the MobEyes police agent collects summaries fromregular nodes by periodically querying its neighbors. The goalis to collect all the summaries generated in the specifiedarea. Obviously, a police node is interested in harvesting onlysummary packets it has not collected so far: to focus only onmissing packets, a MobEyes authority node compares its listof summary packets with that of each neighbor (set difference
7
problem), by exploiting a space-efficient data structure formembership checking, i.e., a Bloom filter.2 A MobEyes policeagent uses a Bloom filter to represent its set of already har-vested and still valid summary packets. Since each summaryhas a <unique node ID, sequence number> pair, we usethis as input for the hash functions. The MobEyes harvestingprocedure consists of the following steps:
1) The agent broadcasts a “harvest” request message withits Bloom filter.
2) Each neighbor prepares a list of “missing” packets basedon the received Bloom filter.
3) One of the neighbors returns missing packets to the agent.4) The agent sends back an acknowledgment with a piggy-
backed list of returned packets and, upon listening to oroverhearing this, neighbors update their lists of missingpackets.
5) Steps 3 and 4 are repeated until all missing packets aresent.
An example of summary harvesting is shown in Figure4. The agent first broadcasts its Bloom filter related to thepackets collected so far (P2, P4, P6, P7, P9 and P10) as inFigure 4(a). Each neighbor receives the filter and creates alist of missing packets. For example, C3 has P3 and P8 toreturn, while C4 has P1 and P8. In Figure 4(b), C2 is thefirst node to return missing packets (P1, P3) and the agentsends back an acknowledgement piggybacked with the list ofreceived packets. Neighbor nodes overhear the message andupdate their lists: C3 and C4 both remove P1 and P3 fromtheir lists, as depicted in Figure 4(c).
Note that membership checking in a Bloom filter is proba-bilistic and false positives are possible, even if rare (as rapidlyshown in the following section). In Figure 4(b), for example,a false positive on P1 makes C2 return only P3. None of theneighbors can send P1. To deal with this problem, the agentperiodically changes the set of hash functions. Suppose that weuse m hash functions. Each hash function is a pseudo randomfunction (PRF) where a PRF takes two arguments, Xk is thekey (k=1, 2, · · · ,m) and i is the input value, and producesan output value o = FXk
(i). All nodes are initially given thesame set of keys Xk where k=1, 2, · · · ,m. For the purpose ofperiodic changes, the key for k-th hash function in n-th epoch,Xn
k can be calculated by hashing the initial value Xnk n times.
The Bloom filter contains the epoch number, which allows theneighbors to find the set of keys for m hash functions. Evenwith failure, by periodically incrementing the epoch number,the agent can gather the missing packets. Note also that inour application a set changes over time with summaries beinginserted and deleted because summaries have spatio-temporalproperties. For deletion operations, Fan et al. introduced theidea of counting Bloom filters, where each entry in the Bloomfilter is not a single bit but rather a small counter [37]. When anitem is inserted, the corresponding counters are incremented;when an item is deleted, the corresponding counters aredecremented. For actual filter transfer, instead of sending the
2see also Section II
full counting Bloom filter, each counter is represented as asingle bit: i.e., 1 if its value is greater than 0; 0 otherwise.
For the sake of simplicity, thus far we assumed that thereis a single agent working to harvest summaries. Actually,MobEyes can handle concurrent harvesting by multiple agents(possibly several hops apart) that can cooperate by exchangingtheir Bloom filters among multi-hop routing paths; thus, thiscreates a distributed and partially replicated index of the senseddata storage. In particular, whenever an agent harvests a setof j new summary packets, it broadcasts its Bloom filter toother agents, with the benefits in terms of latency and accu-racy shown in the following sections. Note that strategicallycontrolling the trajectory of police agents, properly schedulingBloom filter updates, and efficiently accessing the partitionedand partially replicated index are part of our future work. Inthe following section, instead, we focus on the primary goal ofidentifying the tradeoffs between dissemination and harvestingin a single geographic area, and the dependence of MobEyesperformance on various parameters. We also analyze the trafficoverhead created by diffusion/harvesting and show that it canscale well to very large node numbers.
V. DELAY AND SCALABILITY ANALYSIS
In this section, to evaluate and validate the effectivenessof the MobEyes protocols, we present analytic results aboutsummary diffusion/harvesting and scalability.
A. Summary Harvesting Delay
In MobEyes regular nodes receive summaries from theirneighbors (passive harvesting) and these summaries are har-vested by police agents (active harvesting). Obviously, the ef-fectiveness of active harvesting also depends on how extensivepassive harvesting was. Therefore, we model the progress ofpassive harvesting, from which we formulate the progress ofactive harvesting. Finally, we extend the model to analyze k-hop relay scope. We assume that there are N nodes movingwithin L × L m2 area, and each node advertises a singlesummary packet (total N summary packets). For the sakeof analysis, we use two different mobility models, both withuniform spatial node distribution, namely random directionand Manhattan mobility models. In the random direction mo-bility model, nodes move towards random directions (chosenout of [0, 2π]) at a speed of v on average. The Manhattanmobility model restricts node’s mobility patterns along grids.Because a target direction is uniformly chosen in both cases,the steady state node distribution is uniform [46], [5] – thus,node density is location independent. The Manhattan mobilitymodel exhibits uniform node distribution in the sense thatnodes are uniformly distributed in the area where mobile nodescan go along. So, the node density could be simply expressedas ρ = δN/L2, where δ is used to control the size of thearea covered area by mobile nodes in the Manhattan mobilitymodel and δ = 1 in the random direction mobility model. Thevalue δ for Manhattan mobility is a function of grid layout andcommunication range R, because node movement patterns arerestricted to the exploited grids, i.e., the covered area size C
8
is smaller than L2. Thus, we have δ = L2/C. For instance, letus say that given a L×L area, the mobility pattern is restrictedto a single strip: the covered area size is 2R × L (where2R is the radio range of mobile nodes), instead of L2; thus,δ = L×L
2R×L = L2R . Let v∗ denote the average relative speed of
nodes. As shown in [47], v∗ = v2π
R 2π
0
p(1 + cos θ)2 + sin2 θdθ
= 1.27v. In general, we simply assume that the averagerelative speed can be modeled as proportional to the averagespeed: v∗ = cv where c is a constant.
By extending [48], we now develop a deterministic discrete-time model. Let us first reason on how many summaries a nodecan receive for a given time slot. For ease of exposition, weassume that all nodes are static except one regular node. Thisnode randomly moves and collects summaries by passivelylistening to advertisements from encountered nodes. In thiscase, the node (or the passive harvester) behaves just as adata mule in traditional sensor networks [29]. During the timeslot Δt, a regular node travels a distance r = vΔt and thecovered area size is vΔt2R where R is the radio range. Theexpected number of encountered nodes in this area is simplyα = ρvΔt2R. Since each of these nodes will advertise itssummaries, the regular node will receive α summaries. Thedual scenario is when all nodes are mobile but the passiveharvesting node is static. Without loss of generality, if all nodesare mobile, we can simply replace the average speed with theaverage relative speed: α = ρv∗Δt2R where v∗ is the averagerelative speed.3
Given α, we can estimate the progress of passive harvestingas follows. Let Et denote the number of distinct summariescollected by a regular node by time slot t. As described above,during time slot Δt a regular node will receive α summaries.Since the node has Et summaries, the probability that thereceived summary is new is simply 1 − Et/N . Thus, theexpected number of new summaries out of α is given asα(1−Et/N). It is obvious that restricted movement patterns(e.g., two nodes moving together along the same path in aManhattan mobility model) will affect the effective number ofneighbors. Since we are interested in the average behavior,we can model this by simply multiplying α with a constantcompensation factor η. Therefore, we have the followingrelationship:
Et − Et−1 = αη
„1 − Et−1
N
«(1)
Equation 1 is a standard difference equation with solution:
Et = N − (N − αη)“1 − αη
N
”t
(2)
Equation 2 tells us that the distinct number of collected sum-maries is geometrically increasing. As time tends to infinity,
3We can think of this as follows. Let us say that in front of a freeway(where everybody is driving in one direction at a constant speed v), we countthe number of vehicles passing by. During Δt, it will be ρvΔt. Now, let usassume that an observer is moving also. If it moves on the same direction, i.e.,the relative speed is 0, it always observes the same vehicles. On the contrary,if it moves on the opposite direction, the relative speed is 2v and it will seeρ2vΔt vehicles.
Et = N . Let us define a random variable T to denote thetime for a regular node to encounter any random node, thusreceiving a summary from it. The cumulative distribution ofrandom variable T can be derived by dividing Equation 2 byN .
FT (t) = 1 −“1 − αη
N
”t+1
(3)
From this, we can derive the Probability Mass Function fT (t)as follows
fT (t) =αη
N
“1 − αη
N
”t
(4)
Equation 4 is a modified geometric distribution with successprobability p = αη
N . The average is given as E[T ] = 1p− 1 =
Nαη
− 1. Since α = ρv∗Δt2R, by replacing ρ = δN/L2 we haveα = N/L2v∗Δt2R. Thus, we have:
E[T ] =N
αη− 1 =
L2
δv∗Δt2Rη− 1 (5)
As shown in Equation 5, given a square area of L2, theaverage time for a regular node to collect a summary isindependent of node density. In fact, it is a function of averagerelative speed and communication range. Intuitively, as nodedensity increases (N increases), a node can collect moresummaries during a given time slot. However, higher densitymeans that the total number of summaries to collect is higher.Thus, the two factors compensate each other.
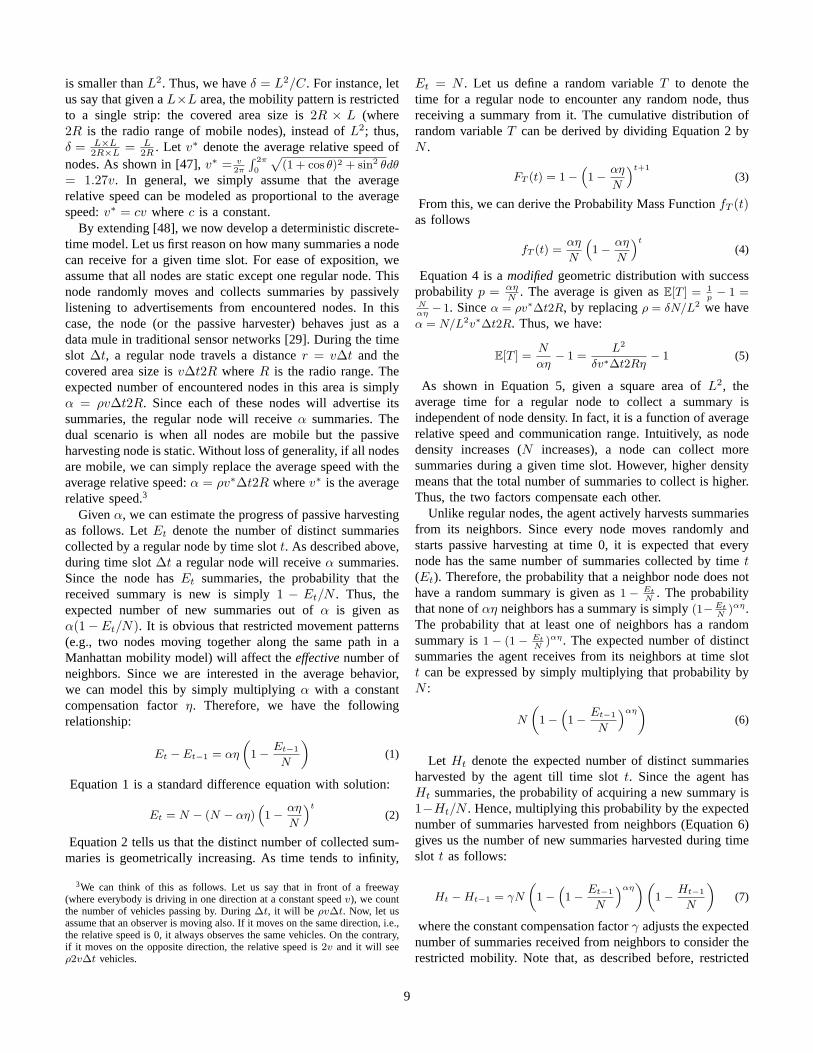
Unlike regular nodes, the agent actively harvests summariesfrom its neighbors. Since every node moves randomly andstarts passive harvesting at time 0, it is expected that everynode has the same number of summaries collected by time t(Et). Therefore, the probability that a neighbor node does nothave a random summary is given as 1 − Et
N. The probability
that none of αη neighbors has a summary is simply (1− EtN
)αη.The probability that at least one of neighbors has a randomsummary is 1 − (1 − Et
N)αη. The expected number of distinct
summaries the agent receives from its neighbors at time slott can be expressed by simply multiplying that probability byN :
N
„1 −
“1 − Et−1
N
”αη«
(6)
Let Ht denote the expected number of distinct summariesharvested by the agent till time slot t. Since the agent hasHt summaries, the probability of acquiring a new summary is1−Ht/N . Hence, multiplying this probability by the expectednumber of summaries harvested from neighbors (Equation 6)gives us the number of new summaries harvested during timeslot t as follows:
Ht − Ht−1 = γN
„1 −
“1 − Et−1
N
”αη« „
1 − Ht−1
N
«(7)
where the constant compensation factor γ adjusts the expectednumber of summaries received from neighbors to consider therestricted mobility. Note that, as described before, restricted
9

mobility such as in the Manhattan model reduces the rateof new encounters (adjusted by η) and also exerts balefulinfluence on the rate of active harvesting since neighbors tendto carry overlapping summaries (adjusted by γ).
From Equation 7, we see that Ht grows much faster thanEt. During a time slot, the number of collected summariesin Equation 2 is constant (α), whereas in Equation 7 it is afunction of time. Moreover, Equation 6 is a function of thenumber of neighbors, i.e., related to node density. As N (ornode density) increases, we can see that the harvesting delayalso decreases.
The growing rates of Et and Ht depend on mobility models.The above equations are based on the random motion model,but for restricted mobility models such as the Manhattanmodel, the rate will be smaller than for the others (as shownin Section VI). In this case, MobEyes decides to use k-hoplimited scope flooding where a summary is forwarded up tok hop neighbors as long as there is connectivity. As statedbefore, we are assuming a rectangular area, Δt2R. Increasingby k-hop the relay scope is the same as multiplying the areaby k times.
Let Ek denote the number of summaries collected by timeslot t with k-hop relay scope. Thus, we have:
Ekt − Ek
t−1 = kαη
„1 − Ek
t−1
N
«(8)
This tells us that even though Et grows rather slowly dueto the mobility model, by increasing the hop count we canincrease the Et rate (from α to k ∗ α). Let Hk denote thenumber of summaries harvested by the agent by time slot twith k-hop relay scope. Then, we have:
Hkt − Hk
t−1 = γN
„1 −
“1 − Ek
t−1
N
”kαη« „
1 − Hkt−1
N
«(9)
For illustration, we assume that we have total N = 200nodes within an area of 2400m × 2400m. The transmissionrange is R = 250m, and node relative speed is 10m/s onaverage. For system parameters, we used η = 1, γ = 0.2and Δt = 1s. The iterative solutions of both Et and Ht arepresented in Figure 5. The figure shows that the agent canharvest summaries much faster than a regular node. The figurealso shows that k-hop relay relevantly decreases the overalldelay.
B. Scalability
The feasibility of MobEyes strictly depends on its scalabilityover wide VSN, in terms of the network traffic due to bothpassive diffusion when the number of regular nodes grows andthe number of regular nodes that a single harvesting agent canhandle with a reasonable latency.
About passive diffusion network traffic, it is possible toanalytically estimate the MobEyes radio channel utilization.In the diffusion process, nodes periodically advertise theirpackets, without any synchronization among them. Therefore,we can model the process by considering a packet randomly
0
0.1
0.2
0.3
0.4
0.5
0.6
0.7
0.8
0.9
1
0 500 1000 1500 2000Fraction of harvested summaries
Time (seconds)
Agent (k=2)Agent (k=1)
Regular Node (k=2)Regular Node (k=1)
Fig. 5. Fraction of harvested summaries with k = 1, 2
sent within [iTa, (i + 1)Ta) time slot for all i, where Ta isthe advertisement period. So, the number of packets receivedby a node is bounded by the number of its neighbors whileit is traveling for Ta, thus depending on node density but noton the overall number of nodes. In contrast, any “flooding”-based diffusion protocol is not scalable because a node couldpotentially receive a number of packets proportional to thenetwork size.
To give a rough idea of the traffic generated by MobEyesdiffusion, let us simply use Ta = 2R/v∗ (the time for amobile node to traverse the diameter of its coverage area)where R is the transmission range and v∗ denotes the relativespeed of two nodes. In fact, for a given speed, the Ta intervalshould be neither too short nor too long compared to theaverage connection duration among nodes: if it is too short,then we are unnecessarily sending out more packets to thesame set of nodes, thus increasing link bandwidth utilization;on the contrary, if it is too long, a node misses chancesto send packets to encountered nodes, thus slowing downdissemination. In our target deployment environment, v∗ =20m/s, R = 250m, the advertisement period Ta = 12.5s,and the fixed packet size S = 1500B. Consequently, thetransmission time for one packet is about Tx = 1ms. Whiletraveling for Ta, a node moves 2R and the covered rectangulararea size is 4R2. In addition, the covered area includes twohalf circles at the beginning and ending of the rectangle (due tothe wireless communication range). Thus, a regular node willbe exposed to advertisements from an area of A = πR2+4R2.In the worst case, all nodes within this area are distinct andpotentially send their generated packets to the considered node(potential senders n = Aρ). Therefore, the worst case linkutilization could be estimated as nTx/Ta where Tx is thetransmission time of a packet: for instance, given a relativelyhigh populated area with N = 2, 000, the number of potentialsenders is n � 179, and the MobEyes protocol has a verylow worst case link utilization of 0.014, thus showing highscalability in terms of link bandwidth exploitation.
10
Similarly, we can give an approximated idea of the scala-bility of the harvesting process via a simple queuing model.Consider the usual situation of a police agent that harvestsonly fresh summaries, i.e., generated in the last Texp seconds.Let us assume that the summary arrival rate is Poisson withrate λ = Nλ′ and the harvesting rate is deterministic withrate μ. Given that the harvesting rate is limited by the channelutilization ϑ, the maximum μ is simply ϑTexp
Tx. As a result, the
system can be modeled using an M/D/1 queue. The stabilitycondition, Nλ′ <
ϑTexp
Tx, gives us the upper bound N <
ϑTexp
λ′Tx.
Therefore, it is possible to conclude that for a given Texp andarrival rate, there is a limit in the number of regular nodesthat a single harvesting agent can handle. For instance, in theconsidered scenario (ϑ = 0.01, λ′ = 2, and Texp = 250s),that number is N < 0.01×250
2×0.001 = 1, 250. As a consequence, inthe case of node numbers equal or not far from 1,250, there isthe need to deploy more than one harvesting agent to maintainthe system stable, i.e., to be able to harvest summaries morerapidly than regular nodes generate them.
VI. MOBEYES PERFORMANCE EVALUATION
We evaluated MobEyes protocols via extensive ns-2 [49]simulations. This section shows the most important results,with the goal of investigating MobEyes performance from thefollowing perspectives:
1) Analysis Validation. We simulate MobEyes protocols forsummary collection on regular nodes as well as for agentharvesting and show that they confirm our main analyticresults;
2) Effect of k-hop Relay and Multiple Agents. We examinehow MobEyes effectiveness can be increased by lever-aging k-hop passive diffusion and the deployment ofmultiple agents;
3) Summary Diffusion Overhead. We investigate the tradeoffbetween harvesting delay and the load imposed on thecommunication channel;
4) Stability and Scalability Check. We verify that the systemis stable/scalable, even in the worst case of a singleharvesting agent and of highest summary generation ratereported in Section V;
5) Tracking Application. We prove MobEyes effectivenessin supporting a challenging tracking application, wheretrajectories of regular nodes are locally reconstructed bya police agent based on harvested summaries;
6) Border Effects and Turn Over. We show that MobEyesperformance does not dramatically change in case ofmore dynamic mobility models, where nodes are allowedto enter/exit from the simulated area.
Additional experimental results and MobEyes implementationdetails are available at http://www.lia.deis.unibo.it/Research/MobEyes/.
A. Simulation Setup
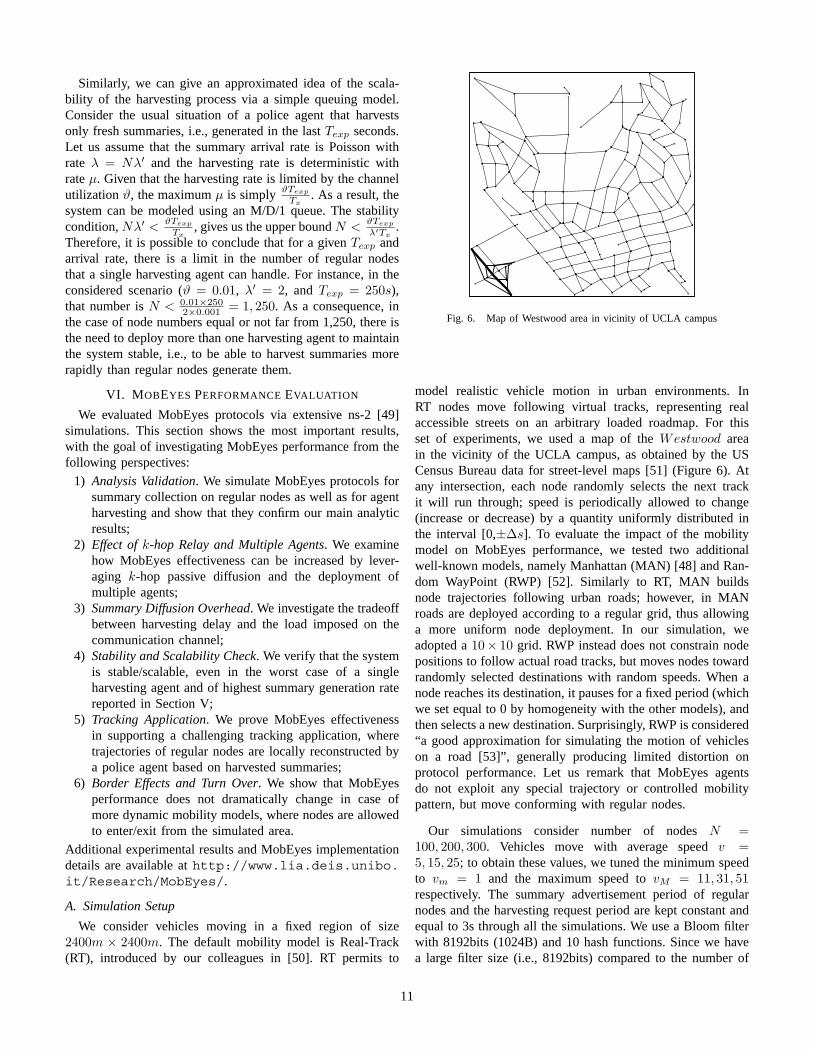
We consider vehicles moving in a fixed region of size2400m × 2400m. The default mobility model is Real-Track(RT), introduced by our colleagues in [50]. RT permits to
Fig. 6. Map of Westwood area in vicinity of UCLA campus
model realistic vehicle motion in urban environments. InRT nodes move following virtual tracks, representing realaccessible streets on an arbitrary loaded roadmap. For thisset of experiments, we used a map of the Westwood areain the vicinity of the UCLA campus, as obtained by the USCensus Bureau data for street-level maps [51] (Figure 6). Atany intersection, each node randomly selects the next trackit will run through; speed is periodically allowed to change(increase or decrease) by a quantity uniformly distributed inthe interval [0,±Δs]. To evaluate the impact of the mobilitymodel on MobEyes performance, we tested two additionalwell-known models, namely Manhattan (MAN) [48] and Ran-dom WayPoint (RWP) [52]. Similarly to RT, MAN buildsnode trajectories following urban roads; however, in MANroads are deployed according to a regular grid, thus allowinga more uniform node deployment. In our simulation, weadopted a 10× 10 grid. RWP instead does not constrain nodepositions to follow actual road tracks, but moves nodes towardrandomly selected destinations with random speeds. When anode reaches its destination, it pauses for a fixed period (whichwe set equal to 0 by homogeneity with the other models), andthen selects a new destination. Surprisingly, RWP is considered“a good approximation for simulating the motion of vehicleson a road [53]”, generally producing limited distortion onprotocol performance. Let us remark that MobEyes agentsdo not exploit any special trajectory or controlled mobilitypattern, but move conforming with regular nodes.
Our simulations consider number of nodes N =100, 200, 300. Vehicles move with average speed v =5, 15, 25; to obtain these values, we tuned the minimum speedto vm = 1 and the maximum speed to vM = 11, 31, 51respectively. The summary advertisement period of regularnodes and the harvesting request period are kept constant andequal to 3s through all the simulations. We use a Bloom filterwith 8192bits (1024B) and 10 hash functions. Since we havea large filter size (i.e., 8192bits) compared to the number of
11
summaries, the false positive probability is negligible.4 Wenote that if the value of this parameter is too large, MobEyeseffectiveness is reduced since it is possible that two nodesdo not exchange messages, even if they occasionally enter ineach other transmission range; this effect is magnified, as nodespeed v increases. The chosen value has been experimentallydetermined to balance the effectiveness of our protocol andthe message overhead, even in the worst case, i.e., v = 25. Adeeper and more formal investigation of the optimal value ofthe advertisement period is object of future work.
Finally, we modeled communications as follows: MACprotocol IEEE 802.11, transmission band 2.4 GHz, bandwidth11Mbps, nominal radio range equal to 250m, and Two-ray Ground propagation model [54]. The values of theseparameters have been chosen similar to other work in thefield [20] [17]. Where not differently stated, reported resultsare average values out of 35 repetitions. Other MobEyesconfiguration parameters will be introduced in the followingsub-sections, when discussing the related aspects of MobEyesperformance.
B. Analysis Validation
Our first goal is to validate the results obtained in Section V.In particular, we investigate the regular node collection andagent harvesting processes, as described respectively by Equa-tions 2 and 7. Without loss of generality (see Section VI-E), letus assume that new summaries are synchronously generatedby all regular nodes. A generation epoch is the time intervalbetween two successive summary generations. In this set ofexperiments, every regular node continuously advertises thesingle summary it generated in the epoch t = 0 for the restof the simulation run. Since Equations 2 and 7 characterizethe spreading processes of all summaries generated in thesame epoch, it is not necessary that regular nodes generateadditional summaries. We remark that this assumption doesnot undermine the relevance of our results because the processis stationary as described in Section VI-E.
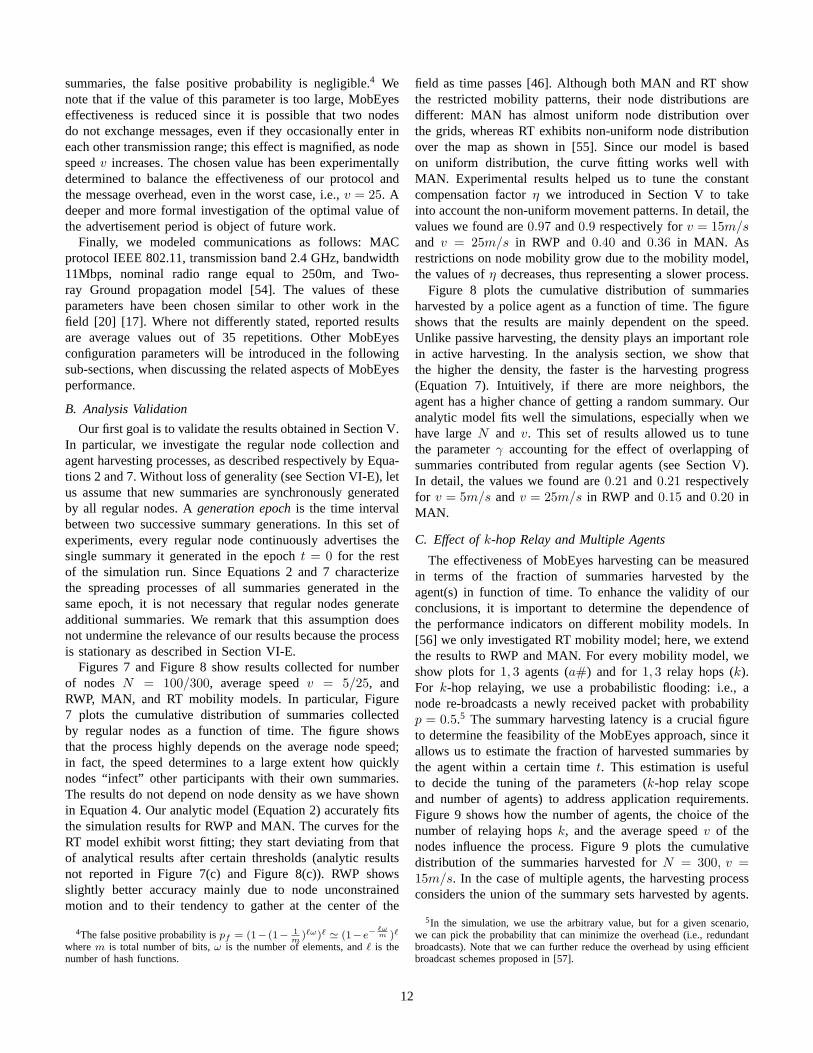
Figures 7 and Figure 8 show results collected for numberof nodes N = 100/300, average speed v = 5/25, andRWP, MAN, and RT mobility models. In particular, Figure7 plots the cumulative distribution of summaries collectedby regular nodes as a function of time. The figure showsthat the process highly depends on the average node speed;in fact, the speed determines to a large extent how quicklynodes “infect” other participants with their own summaries.The results do not depend on node density as we have shownin Equation 4. Our analytic model (Equation 2) accurately fitsthe simulation results for RWP and MAN. The curves for theRT model exhibit worst fitting; they start deviating from thatof analytical results after certain thresholds (analytic resultsnot reported in Figure 7(c) and Figure 8(c)). RWP showsslightly better accuracy mainly due to node unconstrainedmotion and to their tendency to gather at the center of the
4The false positive probability is pf = (1− (1− 1m
)�ω)� � (1−e−�ωm )�
where m is total number of bits, ω is the number of elements, and � is thenumber of hash functions.
field as time passes [46]. Although both MAN and RT showthe restricted mobility patterns, their node distributions aredifferent: MAN has almost uniform node distribution overthe grids, whereas RT exhibits non-uniform node distributionover the map as shown in [55]. Since our model is basedon uniform distribution, the curve fitting works well withMAN. Experimental results helped us to tune the constantcompensation factor η we introduced in Section V to takeinto account the non-uniform movement patterns. In detail, thevalues we found are 0.97 and 0.9 respectively for v = 15m/sand v = 25m/s in RWP and 0.40 and 0.36 in MAN. Asrestrictions on node mobility grow due to the mobility model,the values of η decreases, thus representing a slower process.
Figure 8 plots the cumulative distribution of summariesharvested by a police agent as a function of time. The figureshows that the results are mainly dependent on the speed.Unlike passive harvesting, the density plays an important rolein active harvesting. In the analysis section, we show thatthe higher the density, the faster is the harvesting progress(Equation 7). Intuitively, if there are more neighbors, theagent has a higher chance of getting a random summary. Ouranalytic model fits well the simulations, especially when wehave large N and v. This set of results allowed us to tunethe parameter γ accounting for the effect of overlapping ofsummaries contributed from regular agents (see Section V).In detail, the values we found are 0.21 and 0.21 respectivelyfor v = 5m/s and v = 25m/s in RWP and 0.15 and 0.20 inMAN.
C. Effect of k-hop Relay and Multiple Agents
The effectiveness of MobEyes harvesting can be measuredin terms of the fraction of summaries harvested by theagent(s) in function of time. To enhance the validity of ourconclusions, it is important to determine the dependence ofthe performance indicators on different mobility models. In[56] we only investigated RT mobility model; here, we extendthe results to RWP and MAN. For every mobility model, weshow plots for 1, 3 agents (a#) and for 1, 3 relay hops (k).For k-hop relaying, we use a probabilistic flooding: i.e., anode re-broadcasts a newly received packet with probabilityp = 0.5.5 The summary harvesting latency is a crucial figureto determine the feasibility of the MobEyes approach, since itallows us to estimate the fraction of harvested summaries bythe agent within a certain time t. This estimation is usefulto decide the tuning of the parameters (k-hop relay scopeand number of agents) to address application requirements.Figure 9 shows how the number of agents, the choice of thenumber of relaying hops k, and the average speed v of thenodes influence the process. Figure 9 plots the cumulativedistribution of the summaries harvested for N = 300, v =15m/s. In the case of multiple agents, the harvesting processconsiders the union of the summary sets harvested by agents.
5In the simulation, we use the arbitrary value, but for a given scenario,we can pick the probability that can minimize the overhead (i.e., redundantbroadcasts). Note that we can further reduce the overhead by using efficientbroadcast schemes proposed in [57].
12
0
0.1
0.2
0.3
0.4
0.5
0.6
0.7
0.8
0.9
1
0 1000 2000 3000 4000 5000
Frac. of passively harvested summaries
Time (seconds)
RWP N=300 v=25RWP N=100 v=25v=25 AnalyticRWP N=300 v=5RWP N=100 v=5v=5 Analytic
(a) RWP
0
0.1
0.2
0.3
0.4
0.5
0.6
0.7
0.8
0.9
1
0 1000 2000 3000 4000 5000
Frac. of passively harvested summaries
Time (seconds)
MAN N=300 v=25MAN N=100 v=25v=25 AnalyticMAN N=300 v=5MAN N=100 v=5v=5 Analytic
(b) MAN
0
0.1
0.2
0.3
0.4
0.5
0.6
0.7
0.8
0.9
1
0 1000 2000 3000 4000 5000
Frac. of passively harvested summaries
Time (seconds)
RT N=300 v=25RT N=100 v=25RT N=300 v=5RT N=100 v=5
(c) RT
Fig. 7. Fraction of passively harvested summaries by a regular node
0
0.1
0.2
0.3
0.4
0.5
0.6
0.7
0.8
0.9
1
0 100 200 300 400 500 600 700 800 900
Frac. of actively harvested summaries
Time (seconds)
N=300/v=25 SimN=300/v=25 ModelN=100/v=25 Sim
N=100/v=25 ModelN=300/v=5 Sim
N=300/v=5 ModelN=100/v=5 Sim
N=100/v=5 Model
(a) RWP
0
0.1
0.2
0.3
0.4
0.5
0.6
0.7
0.8
0.9
1
0 200 400 600 800 1000 1200 1400
Frac. of actively harvested summaries
Time (seconds)
N=300/v=25 SimN=300/v=25 ModelN=100/v=25 Sim
N=100/v=25 ModelN=300/v=5 Sim
N=300/v=5 ModelN=100/v=5 Sim
N=100/v=5 Model
(b) MAN
0
0.1
0.2
0.3
0.4
0.5
0.6
0.7
0.8
0.9
1
0 200 400 600 800 1000 1200 1400
Frac. of actively harvested summaries
Time (seconds)
N=300/v=25 SimN=100/v=25 SimN=300/v=5 SimN=100/v=5 Sim
(c) RT
Fig. 8. Fraction of actively harvested summaries by an agent
0
0.2
0.4
0.6
0.8
1
0 100 200 300 400 500 600 700 800Fraction of harvested summaries
Time (seconds)
#a=3/k=3#a=3/k=1#a=1/k=3#a=1/k=1
(a) RWP
0
0.2
0.4
0.6
0.8
1
0 100 200 300 400 500 600 700 800Fraction of harvested summaries
Time (seconds)
#a=3/k=3#a=3/k=1#a=1/k=3#a=1/k=1
(b) MAN
0
0.2
0.4
0.6
0.8
1
0 100 200 300 400 500 600 700 800Fraction of harvested summaries
Time (seconds)
#a=3/k=3#a=3/k=1#a=1/k=3#a=1/k=1
(c) RT
Fig. 9. Fraction of actively harvested summaries by multiple agents with k-hop relay (N = 300 and v = 15)
The figure clearly shows that k-hop relay scope and multipleagents highly impact harvesting latency.
By carefully inspecting the results in Figure 9, it is possibleto obtain some guidelines for the choice of MobEyes parame-ters. For example, given as a baseline a network with N = 300nodes moving with an average speed v = 15m/s, fixed k = 1,a single agent employs 530s, 236s, and 116s to harvest 95%of the summaries generated respectively in RT, MAN, andRWP mobility models. By increasing k to 3, times respectivelyreduce to 420s, 176s, 86s, showing an improvement of about20−30% in all cases. Instead, increasing the number of agentsto three, times become respectively 280s, 123s, and 68s; inthis case, the improvement is in the 40− 50% range. Finally,if we set v = 25m/s, times become 211s, 67s, and 43s; the
improvement is around 60 − 70%. Interestingly, the relativeimpact of the three parameters (harvesting team size, multihopforwarding, and speed) shows a limited dependence on themobility model. This holds also for the results we collectedfor different cases (different values of N and v): in particular,speed has a larger impact than the number of agents, and k isthe less decisive factor.
D. Summary Diffusion Overhead
The study of the diffusion overhead helps us understand therequirements imposed on the underlying vehicular communi-cation technology and to determine if MobEyes can coexistwith other applications. For example, the parameter k showsthe largest impact on the performance; the effect due to a
13
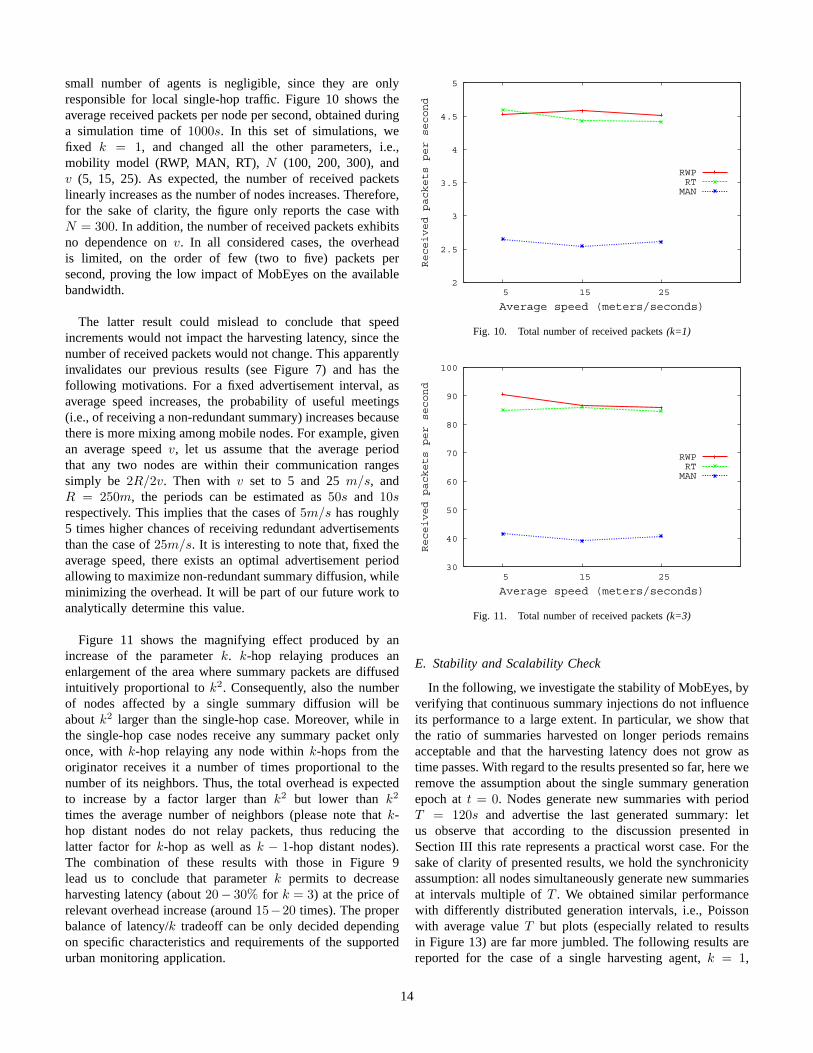
small number of agents is negligible, since they are onlyresponsible for local single-hop traffic. Figure 10 shows theaverage received packets per node per second, obtained duringa simulation time of 1000s. In this set of simulations, wefixed k = 1, and changed all the other parameters, i.e.,mobility model (RWP, MAN, RT), N (100, 200, 300), andv (5, 15, 25). As expected, the number of received packetslinearly increases as the number of nodes increases. Therefore,for the sake of clarity, the figure only reports the case withN = 300. In addition, the number of received packets exhibitsno dependence on v. In all considered cases, the overheadis limited, on the order of few (two to five) packets persecond, proving the low impact of MobEyes on the availablebandwidth.
The latter result could mislead to conclude that speedincrements would not impact the harvesting latency, since thenumber of received packets would not change. This apparentlyinvalidates our previous results (see Figure 7) and has thefollowing motivations. For a fixed advertisement interval, asaverage speed increases, the probability of useful meetings(i.e., of receiving a non-redundant summary) increases becausethere is more mixing among mobile nodes. For example, givenan average speed v, let us assume that the average periodthat any two nodes are within their communication rangessimply be 2R/2v. Then with v set to 5 and 25 m/s, andR = 250m, the periods can be estimated as 50s and 10srespectively. This implies that the cases of 5m/s has roughly5 times higher chances of receiving redundant advertisementsthan the case of 25m/s. It is interesting to note that, fixed theaverage speed, there exists an optimal advertisement periodallowing to maximize non-redundant summary diffusion, whileminimizing the overhead. It will be part of our future work toanalytically determine this value.
Figure 11 shows the magnifying effect produced by anincrease of the parameter k. k-hop relaying produces anenlargement of the area where summary packets are diffusedintuitively proportional to k2. Consequently, also the numberof nodes affected by a single summary diffusion will beabout k2 larger than the single-hop case. Moreover, while inthe single-hop case nodes receive any summary packet onlyonce, with k-hop relaying any node within k-hops from theoriginator receives it a number of times proportional to thenumber of its neighbors. Thus, the total overhead is expectedto increase by a factor larger than k2 but lower than k2
times the average number of neighbors (please note that k-hop distant nodes do not relay packets, thus reducing thelatter factor for k-hop as well as k − 1-hop distant nodes).The combination of these results with those in Figure 9lead us to conclude that parameter k permits to decreaseharvesting latency (about 20− 30% for k = 3) at the price ofrelevant overhead increase (around 15−20 times). The properbalance of latency/k tradeoff can be only decided dependingon specific characteristics and requirements of the supportedurban monitoring application.
2
2.5
3
3.5
4
4.5
5
5 15 25
Received packets per second
Average speed (meters/seconds)
RWPRT
MAN
Fig. 10. Total number of received packets (k=1)
30
40
50
60
70
80
90
100
5 15 25
Received packets per second
Average speed (meters/seconds)
RWPRT
MAN
Fig. 11. Total number of received packets (k=3)
E. Stability and Scalability Check
In the following, we investigate the stability of MobEyes, byverifying that continuous summary injections do not influenceits performance to a large extent. In particular, we show thatthe ratio of summaries harvested on longer periods remainsacceptable and that the harvesting latency does not grow astime passes. With regard to the results presented so far, here weremove the assumption about the single summary generationepoch at t = 0. Nodes generate new summaries with periodT = 120s and advertise the last generated summary: letus observe that according to the discussion presented inSection III this rate represents a practical worst case. For thesake of clarity of presented results, we hold the synchronicityassumption: all nodes simultaneously generate new summariesat intervals multiple of T . We obtained similar performancewith differently distributed generation intervals, i.e., Poissonwith average value T but plots (especially related to resultsin Figure 13) are far more jumbled. The following results arereported for the case of a single harvesting agent, k = 1,
14
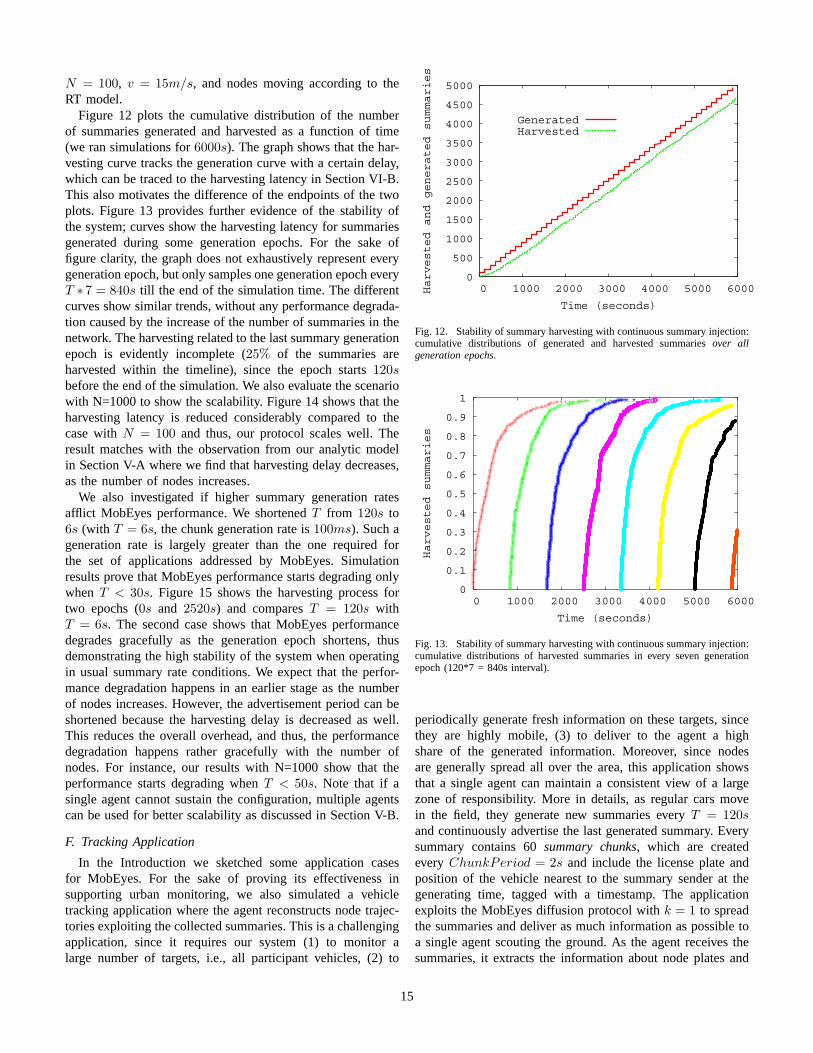
N = 100, v = 15m/s, and nodes moving according to theRT model.
Figure 12 plots the cumulative distribution of the numberof summaries generated and harvested as a function of time(we ran simulations for 6000s). The graph shows that the har-vesting curve tracks the generation curve with a certain delay,which can be traced to the harvesting latency in Section VI-B.This also motivates the difference of the endpoints of the twoplots. Figure 13 provides further evidence of the stability ofthe system; curves show the harvesting latency for summariesgenerated during some generation epochs. For the sake offigure clarity, the graph does not exhaustively represent everygeneration epoch, but only samples one generation epoch everyT ∗ 7 = 840s till the end of the simulation time. The differentcurves show similar trends, without any performance degrada-tion caused by the increase of the number of summaries in thenetwork. The harvesting related to the last summary generationepoch is evidently incomplete (25% of the summaries areharvested within the timeline), since the epoch starts 120sbefore the end of the simulation. We also evaluate the scenariowith N=1000 to show the scalability. Figure 14 shows that theharvesting latency is reduced considerably compared to thecase with N = 100 and thus, our protocol scales well. Theresult matches with the observation from our analytic modelin Section V-A where we find that harvesting delay decreases,as the number of nodes increases.
We also investigated if higher summary generation ratesafflict MobEyes performance. We shortened T from 120s to6s (with T = 6s, the chunk generation rate is 100ms). Such ageneration rate is largely greater than the one required forthe set of applications addressed by MobEyes. Simulationresults prove that MobEyes performance starts degrading onlywhen T < 30s. Figure 15 shows the harvesting process fortwo epochs (0s and 2520s) and compares T = 120s withT = 6s. The second case shows that MobEyes performancedegrades gracefully as the generation epoch shortens, thusdemonstrating the high stability of the system when operatingin usual summary rate conditions. We expect that the perfor-mance degradation happens in an earlier stage as the numberof nodes increases. However, the advertisement period can beshortened because the harvesting delay is decreased as well.This reduces the overall overhead, and thus, the performancedegradation happens rather gracefully with the number ofnodes. For instance, our results with N=1000 show that theperformance starts degrading when T < 50s. Note that if asingle agent cannot sustain the configuration, multiple agentscan be used for better scalability as discussed in Section V-B.
F. Tracking Application
In the Introduction we sketched some application casesfor MobEyes. For the sake of proving its effectiveness insupporting urban monitoring, we also simulated a vehicletracking application where the agent reconstructs node trajec-tories exploiting the collected summaries. This is a challengingapplication, since it requires our system (1) to monitor alarge number of targets, i.e., all participant vehicles, (2) to
0
500
1000
1500
2000
2500
3000
3500
4000
4500
5000
0 1000 2000 3000 4000 5000 6000Harvested and generated summaries
Time (seconds)
GeneratedHarvested
Fig. 12. Stability of summary harvesting with continuous summary injection:cumulative distributions of generated and harvested summaries over allgeneration epochs.
0
0.1
0.2
0.3
0.4
0.5
0.6
0.7
0.8
0.9
1
0 1000 2000 3000 4000 5000 6000
Harvested summaries
Time (seconds)
Fig. 13. Stability of summary harvesting with continuous summary injection:cumulative distributions of harvested summaries in every seven generationepoch (120*7 = 840s interval).
periodically generate fresh information on these targets, sincethey are highly mobile, (3) to deliver to the agent a highshare of the generated information. Moreover, since nodesare generally spread all over the area, this application showsthat a single agent can maintain a consistent view of a largezone of responsibility. More in details, as regular cars movein the field, they generate new summaries every T = 120sand continuously advertise the last generated summary. Everysummary contains 60 summary chunks, which are createdevery ChunkPeriod = 2s and include the license plate andposition of the vehicle nearest to the summary sender at thegenerating time, tagged with a timestamp. The applicationexploits the MobEyes diffusion protocol with k = 1 to spreadthe summaries and deliver as much information as possible toa single agent scouting the ground. As the agent receives thesummaries, it extracts the information about node plates and
15
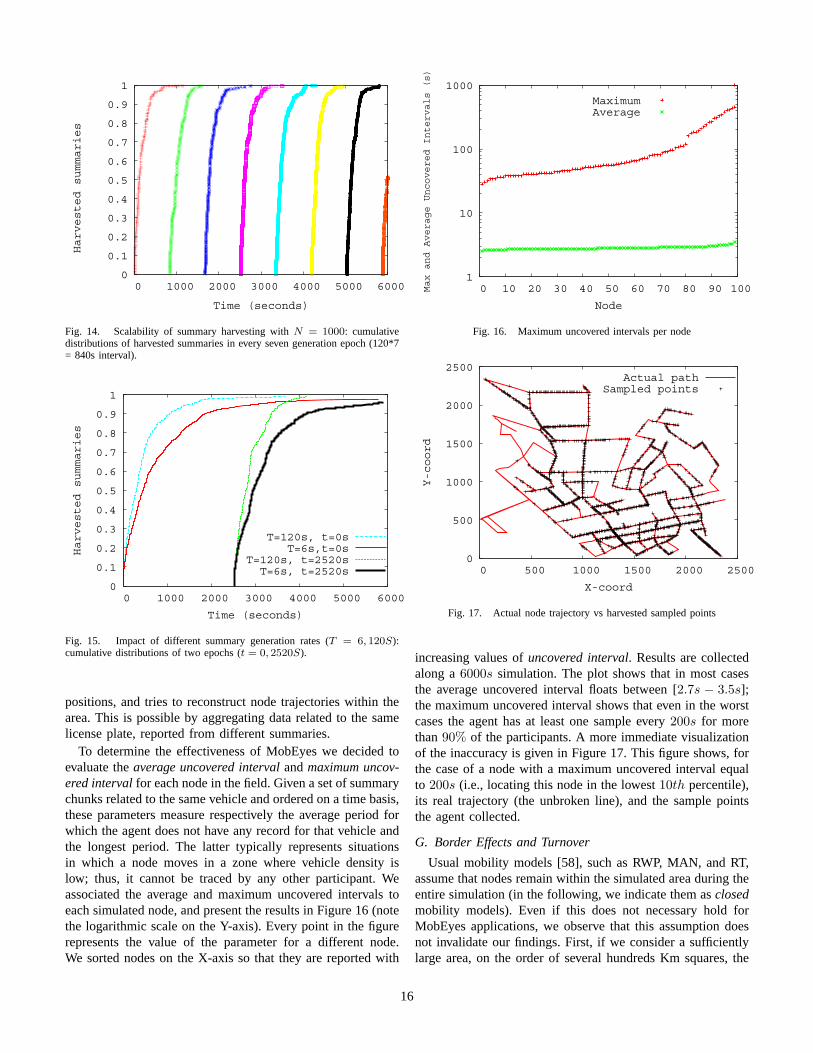
0
0.1
0.2
0.3
0.4
0.5
0.6
0.7
0.8
0.9
1
0 1000 2000 3000 4000 5000 6000
Harvested summaries
Time (seconds)
Fig. 14. Scalability of summary harvesting with N = 1000: cumulativedistributions of harvested summaries in every seven generation epoch (120*7= 840s interval).
0
0.1
0.2
0.3
0.4
0.5
0.6
0.7
0.8
0.9
1
0 1000 2000 3000 4000 5000 6000
Harvested summaries
Time (seconds)
T=120s, t=0sT=6s,t=0s
T=120s, t=2520sT=6s, t=2520s
Fig. 15. Impact of different summary generation rates (T = 6, 120S):cumulative distributions of two epochs (t = 0, 2520S).
positions, and tries to reconstruct node trajectories within thearea. This is possible by aggregating data related to the samelicense plate, reported from different summaries.
To determine the effectiveness of MobEyes we decided toevaluate the average uncovered interval and maximum uncov-ered interval for each node in the field. Given a set of summarychunks related to the same vehicle and ordered on a time basis,these parameters measure respectively the average period forwhich the agent does not have any record for that vehicle andthe longest period. The latter typically represents situationsin which a node moves in a zone where vehicle density islow; thus, it cannot be traced by any other participant. Weassociated the average and maximum uncovered intervals toeach simulated node, and present the results in Figure 16 (notethe logarithmic scale on the Y-axis). Every point in the figurerepresents the value of the parameter for a different node.We sorted nodes on the X-axis so that they are reported with
1
10
100
1000
0 10 20 30 40 50 60 70 80 90 100Max and Average Uncovered Intervals (s)
Node
MaximumAverage
Fig. 16. Maximum uncovered intervals per node
0
500
1000
1500
2000
2500
0 500 1000 1500 2000 2500
Y-coord
X-coord
Actual pathSampled points
Fig. 17. Actual node trajectory vs harvested sampled points
increasing values of uncovered interval. Results are collectedalong a 6000s simulation. The plot shows that in most casesthe average uncovered interval floats between [2.7s − 3.5s];the maximum uncovered interval shows that even in the worstcases the agent has at least one sample every 200s for morethan 90% of the participants. A more immediate visualizationof the inaccuracy is given in Figure 17. This figure shows, forthe case of a node with a maximum uncovered interval equalto 200s (i.e., locating this node in the lowest 10th percentile),its real trajectory (the unbroken line), and the sample pointsthe agent collected.
G. Border Effects and Turnover
Usual mobility models [58], such as RWP, MAN, and RT,assume that nodes remain within the simulated area during theentire simulation (in the following, we indicate them as closedmobility models). Even if this does not necessary hold forMobEyes applications, we observe that this assumption doesnot invalidate our findings. First, if we consider a sufficientlylarge area, on the order of several hundreds Km squares, the
16
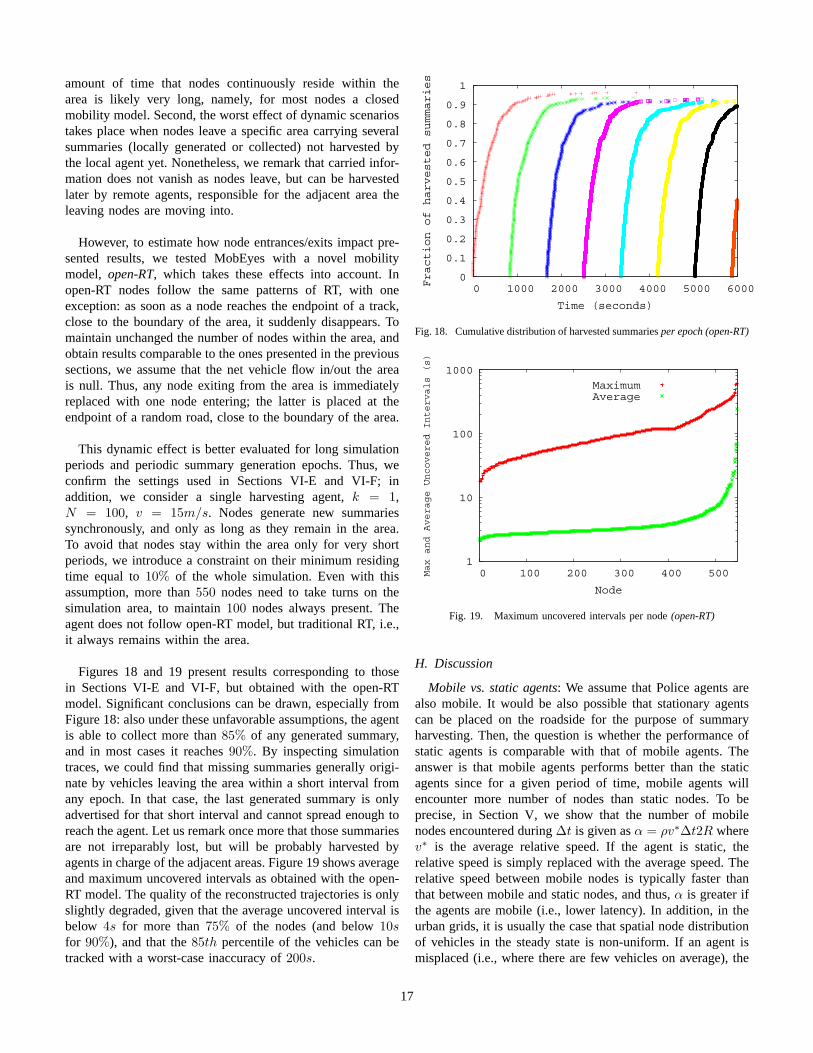
amount of time that nodes continuously reside within thearea is likely very long, namely, for most nodes a closedmobility model. Second, the worst effect of dynamic scenariostakes place when nodes leave a specific area carrying severalsummaries (locally generated or collected) not harvested bythe local agent yet. Nonetheless, we remark that carried infor-mation does not vanish as nodes leave, but can be harvestedlater by remote agents, responsible for the adjacent area theleaving nodes are moving into.
However, to estimate how node entrances/exits impact pre-sented results, we tested MobEyes with a novel mobilitymodel, open-RT, which takes these effects into account. Inopen-RT nodes follow the same patterns of RT, with oneexception: as soon as a node reaches the endpoint of a track,close to the boundary of the area, it suddenly disappears. Tomaintain unchanged the number of nodes within the area, andobtain results comparable to the ones presented in the previoussections, we assume that the net vehicle flow in/out the areais null. Thus, any node exiting from the area is immediatelyreplaced with one node entering; the latter is placed at theendpoint of a random road, close to the boundary of the area.
This dynamic effect is better evaluated for long simulationperiods and periodic summary generation epochs. Thus, weconfirm the settings used in Sections VI-E and VI-F; inaddition, we consider a single harvesting agent, k = 1,N = 100, v = 15m/s. Nodes generate new summariessynchronously, and only as long as they remain in the area.To avoid that nodes stay within the area only for very shortperiods, we introduce a constraint on their minimum residingtime equal to 10% of the whole simulation. Even with thisassumption, more than 550 nodes need to take turns on thesimulation area, to maintain 100 nodes always present. Theagent does not follow open-RT model, but traditional RT, i.e.,it always remains within the area.
Figures 18 and 19 present results corresponding to thosein Sections VI-E and VI-F, but obtained with the open-RTmodel. Significant conclusions can be drawn, especially fromFigure 18: also under these unfavorable assumptions, the agentis able to collect more than 85% of any generated summary,and in most cases it reaches 90%. By inspecting simulationtraces, we could find that missing summaries generally origi-nate by vehicles leaving the area within a short interval fromany epoch. In that case, the last generated summary is onlyadvertised for that short interval and cannot spread enough toreach the agent. Let us remark once more that those summariesare not irreparably lost, but will be probably harvested byagents in charge of the adjacent areas. Figure 19 shows averageand maximum uncovered intervals as obtained with the open-RT model. The quality of the reconstructed trajectories is onlyslightly degraded, given that the average uncovered interval isbelow 4s for more than 75% of the nodes (and below 10sfor 90%), and that the 85th percentile of the vehicles can betracked with a worst-case inaccuracy of 200s.
0
0.1
0.2
0.3
0.4
0.5
0.6
0.7
0.8
0.9
1
0 1000 2000 3000 4000 5000 6000Fraction of harvested summaries
Time (seconds)
Fig. 18. Cumulative distribution of harvested summaries per epoch (open-RT)
1
10
100
1000
0 100 200 300 400 500Max and Average Uncovered Intervals (s)
Node
MaximumAverage
Fig. 19. Maximum uncovered intervals per node (open-RT)
H. Discussion
Mobile vs. static agents: We assume that Police agents arealso mobile. It would be also possible that stationary agentscan be placed on the roadside for the purpose of summaryharvesting. Then, the question is whether the performance ofstatic agents is comparable with that of mobile agents. Theanswer is that mobile agents performs better than the staticagents since for a given period of time, mobile agents willencounter more number of nodes than static nodes. To beprecise, in Section V, we show that the number of mobilenodes encountered during Δt is given as α = ρv∗Δt2R wherev∗ is the average relative speed. If the agent is static, therelative speed is simply replaced with the average speed. Therelative speed between mobile nodes is typically faster thanthat between mobile and static nodes, and thus, α is greater ifthe agents are mobile (i.e., lower latency). In addition, in theurban grids, it is usually the case that spatial node distributionof vehicles in the steady state is non-uniform. If an agent ismisplaced (i.e., where there are few vehicles on average), the
17
harvesting latency will be large. In order to clearly understandthe performance difference and how the position of a staticnode affects the latency, we use a scenario with 100 nodesmoving at the average speed of 25 m/s. We intentionally fixthe location of a random node (as an agent) to its initialposition which is uniformly distributed in the simulated area;i.e., for a given scenario file (N=100, V=25m/s), we generate100 scenario files by fixing a node one by one to its initialposition. Our simulation results show that the average latencyvaries widely depending on the location. We find that the areawith high spatial node distribution minimizes the latency, butthe average latency of mobile agents is still lower than that ofstatic agents.
Impact of radio range: The radio range is an importantperformance parameter. Recall that the radio range controls thenumber of encountered nodes per unit time (α = ρv∗Δt2R).The performance with various radio ranges can be analyticallydetermined using our models in Section V. The large commu-nication range reduces the dissemination/harvesting latency,but this will limit the scalability of network due to increasedchannel contention.
Comparison with other schemes: Let us compare the per-formance with other two naıve schemes, namely direct contactand probabilistic flooding. In direct contact, regular vehicles donot advertise summaries and the agent harvests the summariesonly from the summary originator. CarTel [6] uses directcontact for data uploading. In probabilistic flooding, regularvehicles use probabilistic flooding to broadcast its summary.Upon receiving a message, each node re-broadcast the messagewith certain probability p. The performance of direct contactis the same as that of “passive harvesting.” Recall that aregular node performs passive harvesting since it only storessummaries received from its 1-hop neighbors. Our analyticmodel clearly shows that the agents harvest summaries muchfaster than the regular nodes. Thus, we only consider theperformance of flooding scheme. Given p = 1, we measure thefraction of collected summaries generated for a period of 2000seconds. Each message is generated in every 20 seconds (total100 messages per node). To generate intermittent connectivity,we simulate 50 nodes moving at the average speed of 15m/s.Real Track mobility is used. We measure the completeness ofsummary harvesting, i.e., the fraction of messages harvestedout of total 49,000 (49*100) messages. Our results showthat MobEyes can collect 100% of summaries whereas theprobabilistic scheme collects 32% of summaries. Note that thecompleteness gain of MobEyes comes at the cost of increasedlatency.
VII. MOBEYES PRIVACY AND SECURITY
MobEyes nodes continually generate and diffuse summariescontaining private information, e.g., license plate numbers.Thus, privacy is of critical importance. On the one hand,non authorized nodes must not be allowed access to privateinformation, including vehicle location. On the other hand,the harvesting process should not reveal the information thatis being sought, since this may tip the attackers and/or cause
unnecessary panic in the public. In general, we can summarizethe security requirements of MobEyes as follows:
• Authentication. Harvesting agents (authority nodes) mustauthenticate summary senders and vice versa.
• Non-repudiation. A summary originator cannot deny thetransmission of a summary (liability issue); in that way,upon request from the agent, the summary source mustsubmit the full file with related sensed data.
• Privacy. Only legitimate users (authority nodes) can ac-cess summaries. Moreover, summaries must be privatelyadvertised such that the attackers cannot track users.
• Service Availability. MobEyes summary diffu-sion/harvesting should be protected from Denial ofService (DoS) attacks.
• Data Integrity. MobEyes should be able to filter out falsesummary data injected by attackers.
• Query Confidentiality. In some cases, e.g., bio-attacks andsearch for crime suspects, even the nature of the queryinjected by harvesting agents should not be disclosed, notto create unnecessary panic in the population or to avoidtipping the criminals.
One important aspect that sets apart MobEyes “forensicsensed data” security from conventional VANET security for“safe navigation” is the “real time” and “criticality” of thesafe navigation application. For instance, consider a dangerouscurve on the road monitored by an “e-mirror.” If no car iscoming, the e-mirror tells the driver to proceed at normalspeed, else, it tells her to slow down. An adversary can“intercept and replay” a message from the mirror and tell thedriver that the way is clear, while instead a truck is coming athigh speed behind the curve. In this “safe drive” application,it is mandatory to authenticate alert messages. Thus, in safenavigation applications, message authentication is far moreimportant than privacy. For instance, privacy concerns shouldnot prevent a driver from alerting the vehicles behind her thatthere is a boulder on the road.
MobEyes has strongly different security requirements. Afalse report cannot create much damage since it is not actedupon immediately (for example, a wrong set of license platesat the crime scene). There is plenty of time to detect and, ifnecessary, punish the “impostors.” On the other hand, driversthat propagate summaries want to be assured that their privacywill not be violated. This major difference in security concernsleads to MobEyes security approaches that are quite different(and in fact much simpler and generally more efficient) thanconventional VANET security solutions. Readers can findgeneral security issues for VANET in [59]. For the sake ofbrevity, in this section we will simply outline several MobEyessecurity approaches, reserving the detailed rigorous discussionof MobEyes security to future publications.
In MobEyes, we assume the existence of a Public KeyInfrastructure (PKI). Since standard PKI mechanisms provideauthentication and non-repudiation, we focus on the rest of theMobEyes requirements, namely privacy, service availability,and data consistency, by addressing the following MobEyes-
18
specific attack models and a brief description of possiblesolutions. Readers can find the details for each solution inthe extended version of this paper [60].
• Location Tracking. Periodic broadcasting of identicalsummaries could facilitate attackers in tracking the routeof a vehicle. To change the encrypted summary, one canintroduce perturbation of time and position information.
• Denial of Service (DoS). Attackers could inject a largenumber of bogus summaries in order to slow downcorrect summary harvesting by agents. MobEyes cancheck summary validity using the PKI and the rate ofgenerating valid summaries can be limited using ratelimited summary diffusion, which shares the same ideaof RREQ rate limit in a secure routing protocol [61].
• False Data Injection. Attackers could inject fabricatedsummaries in order to mislead investigations or makethe data inconsistent. Statistical methods in conventionalsensor networks [62], [38], [63] can be used. As notedin [64], mobility of vehicles makes it hard in reality.
• Query Confidentiality. Attackers could infer “important”information from the content of police queries. Privatekeyword searching, proposed by Ostrovsky et al. [65], canbe used. Secure filters can be distributed to the regularvehicles and agents can harvest the resulting encrypteddata .
VIII. CONCLUSIONS
In this paper, we proposed the decentralized and oppor-tunistic MobEyes solution for proactive urban monitoringin VSN. The MobEyes key component is MDHP, whichworks by disseminating/harvesting summaries of sensed dataand uses original opportunistic protocols that exploit intrinsicmobility of regular and authority nodes. One of the reasonsfor using original dissemination protocols is, for instance, toovercome the intermittent connectivity of urban grids in offpeak hours, which precludes the exploitation of conventionalsearch/propagation techniques based on ad hoc multicast andbroadcast. We showed that MDHP protocols are disruption tol-erant, scalable, and non-intrusive via both analytic models andextensive simulations. MobEyes can be configured to achievethe most suitable tradeoff between latency/completeness andoverhead by properly choosing primarily its k-hop relay scopeand the number of harvesting agents. These encouragingresults are stimulating further research activities. In particular,we are extending the MobEyes prototype to determine the besttrajectory of mobile agents when collaborating in summaryharvesting. In addition, we are formally investigating how todetermine the optimal value for the summary advertisementperiod depending on node speed/population and on urbanmonitoring requirements about traffic/latency. Finally, we willexplore hybrid strategies that combine broadcast with epidemicdissemination, even dynamically adapting to urban densityconditions and application needs.
ACKNOWLEDGEMENT
We would like to thank Xiaoyan Hong and Jiejun Kong forsparing their valuable time to review the security section of thepaper. We are also thankful to Giulio Galante for reviewingan earlier version of this manuscript.
REFERENCES
[1] Alok Nandan, Shirshanka Das, Giovanni Pau, Mario Gerla, and Medy Y.Sanadidi. Co-operative Downloading in Vehicular Ad-Hoc WirelessNetworks. In IEEE WONS, St. Moritz, Swiss, Jan. 2005.
[2] Alok Nandan, Saurabh Tewari, Shirshanka Das, Giovanni Pau, MarioGerla, and Leonard Kleinrock. AdTorrent: Delivering Location Cog-nizant Advertisements to Car Networks. In IFIP WONS, Les Menuires,France, Jan. 2006.
[3] Qing Xu, Tony Mak, Jeff Ko, and Raja Sengupta. Vehicle-to-vehiclesafety messaging in DSRC. In ACM VANET, Philadelphia, PA, USA,Oct. 2004.
[4] Jorg Ott and Dirk Kutscher. A Disconnection-Tolerant Transport forDrive-thru Internet Environments. In IEEE Infocom, Miami, FL, USA,Apr. 2005.
[5] Uichin Lee, Eugenio Magistretti, Biao Zhou, Mario Gerla, Paolo Bellav-ista, and Antonio Corradi. Efficient Data Harvesting in Mobile SensorPlatforms. In IEEE PerSeNS, Pisa, Italy, Mar. 2006.
[6] MIT’s CarTel Central. http://cartel.csail.mit.edu/.[7] Bret Hull, Vladimir Bychkovsky, Kevin Chen, Michel Goraczko, Allen
Miu, Eugene Shih, Yang Zhang, Hari Balakrishnan, and Samuel Mad-den. CarTel: A Distributed Mobile Sensor Computing System. In ACMSenSys, Boulder, CO, USA, Oct.-Nov. 2006.
[8] InternetCAR Project. http://www.icar.wide.ad.jp.[9] Thierry Ernst, Koshiro Mitsuya, and Keisuke Uehara. Network Mobility
from the InternetCAR Perspective. Journal of Interconnection Networks,4(3), Sep. 2003.
[10] FleetNet. http://www.et2.tu-harburg.de.[11] Wilfried Enkelmann. FleetNet – Applications for Inter-vehicle Commu-
nication. In IV’03, Columbus, OH, Jun. 2003.[12] Uichin Lee, Joon-Sang Park, Eyal Amir, and Mario Gerla. FleaNet: A
Virtual Market Place on Vehicular Networks. In IEEE V2VCOM, SanFrancisco, CA, USA, Jul. 2006.
[13] Murat Caliskan, Daniel Graupner, and Martin Mauve. Decentralizeddiscovery of free parking places . In ACM VANET, Los Angeles, CA,USA, Sept. 2006.
[14] Davide Sormani, Gabriele Turconi, Paolo Costa, Davide Frey, MatteoMigliavacca, and Luca Mottola. Towards lightweight information dis-semination in inter-vehicular networks . In ACM VANET, Los Angeles,CA, USA, Sept. 2006.
[15] Marc Torrent-Moreno, Daniel Jiang, and Hannes Hartenstein. Broadcastreception rates and effects of priority access in 802.11-based vehicularad-hoc networks. In ACM VANET, Philadelphia, PA, USA, Oct. 2004.
[16] Gokhan Korkmaz, Eylem Ekici, Fusun Ozguner, and Umit Ozguner.Urban Multi-Hop Broadcast Protocols for Inter-Vehicle CommunicationSystems. In ACM VANET, Philadelphia, PA, USA, Oct. 2004.
[17] Zong Da Chen, H.T. Kung, and Dario Vlah. Ad Hoc Relay WirelessNetworks over Moving Vehicles on Highways. In ACM MOBIHOC,Long Beach, CA, USA, Oct. 2001.
[18] John Burgess, Brian Gallagher, David Jensen, and Brian Neil Levine.MaxProp: Routing for Vehicle-Based Disruption-Tolerant Networks. InIEEE INFOCOM, Barcelona, Spain, Apr. 2006.
[19] UMass’ DieselNet. http://prisms.cs.umass.edu/dome/.[20] Jing Zhao and Guohong Cao. VADD: Vehicle-Assisted Data Delivery
in Vehicular Ad Hoc Networks. In IEEE INFOCOM, Barcelona, Spain,Apr. 2006.
[21] Hao Wu, Richard Fujimoto, Randall Guensler, and Michael Hunter.MDDV: a Mobility-entric Data Dissemination Algorithm for VehicularNetworks. In ACM VANET, Philadelphia, PA, USA, Oct. 2004.
[22] Shane B. Eisenman, Gahng-Seop Ahn, Nicholas D. Lane, EmilianoMiluzzo, Ronald A. Peterson, and Andrew T. Campbell. MetroSenseProject: People-Centric Sensing at Scale. In ACM WSW, Boulder, CO,USA, Oct.-Nov. 2006.
[23] Oriana Riva and Cristian Borcea. The urbanet revolution: Sensor powerto the people! IEEE Pervasive Computing, 6(2), 2007.
19
[24] Marios D. Dikaiakos, Saif Iqbal, Tamer Nadeem, and Liviu Iftode. VITP:an information transfer protocol for vehicular computing . In ACMVANET, Cologne, Germany, Sept. 2005.
[25] Jeff Burke, Deborah Estrin, Mark Hansen, Andrew Parker, NithyaRamanathan, Sasank Reddy, and Mani B. Srivastava. ParticipatorySensing. In ACM WSW, Boulder, CO, USA, Oct.-Nov. 2006.
[26] Philo Juang, Hidekazu Oki, Yong Wang, Margaret Martonosi, Li-ShiuanPeh, and Daniel Rubenstein. Energy-Efficient Computing for WildlifeTracking: Design Tradeoffs and Early Experiences with ZebraNet. InACM ASPLOS-X, San Jose, CA, USA, Oct. 2002.
[27] Tara Small and Zygmunt J. Haas. The Shared Wireless Infostation Model- A New Ad Hoc Networking Paradigm (or Where There is a Whale,There is a Way). In ACM MOBIHOC, Annapolis, Maryland, USA, June2003.
[28] University of Dartmouth MetroSense. http://metrosense.cs.dartmouth.edu/.
[29] Rahul C. Shah, Sumit Roy, Sushant Jain, and Waylon Brunette. DataMULEs: Modeling a Three-tier Architecture for Sparse Sensor Net-works. Elsevier Ad Hoc Networks Journal, 1(2-3):215–233, Sept. 2003.
[30] Qun Li and Daniela Rus. Sending messages to mobile users indisconnected ad-hoc wireless networks. In ACM MOBICOM, Boston,MA, USA, Aug. 2000.
[31] Yu Wang and Hongyi Wu. DFT-MSN: The Delay/Fault-Tolerant MobileSensor Network for Pervasive Information Gathering. In INFOCOM’06,Barcelona, Spain, Apr. 2006.
[32] Phillip B. Gibbons, Brad Karp, Yan Ke, Suman Nath, and SrinivasanSeshan. IrisNet: An Architecture for a Worldwide Sensor Web. IEEEPervasive Computing, 2(4):22–33, Oct.-Dec. 2003.
[33] Suman Nath, Jie Liu, and Feng Zhao. Challenges in Building a Portalfor Sensors World-Wide. In ACM WSW, Boulder, CO, USA, Oct.-Nov.2006.
[34] CENS’ Urban Sensing. http://research.cens.ucla.edu/projects/2006/Systems/Urban Sensing/.
[35] Burton H. Bloom. Space/Time Trade-offs in Hash Coding with Allow-able Errors. CACM, 13(7):422–426, Jul. 1970.
[36] Andrei Broder and Michael Mitzenmacher. Network Applications ofBloom Filters: A Survey. Internet Mathematics, 1(4):422–426, 2003.
[37] Li Fan, Pei Cao, and Jussara Almeida. Summary Cache: A ScalableWide-Area Web Cache Sharing Protocol. In ACM SIGCOMM, Vancou-ver, Canada, Aug.-Sept. 1998.
[38] Fan Ye, Haiyun Luo, Songwu Lu, and Lixia Zhang. Statistical En-routeFiltering of Injected False Data in Sensor Networks. In INFOCOM,Hong Kong, Mar. 2004.
[39] John W. Byers, Jeffrey Considine, Michael Mitzenmacher, and StanislavRost. Informed Content Delivery Across Adaptive Overlay Networks.In ACM SIGCOMM, Pittsburgh, PA, USA, Aug. 2002.
[40] Patrick Reynolds and Amin Vahdat. Efficient Peer-to-Peer KeywordSearching. In Middleware’03, Rio de Janeiro, Brazil, Jun. 2003.
[41] Louka Dlagnekov and Serge Belongie. Recognizing Cars. TechnicalReport CS2005-0833, UCSD CSE, 2005.
[42] Paolo Bellavista, Eugenio Magistretti, Uichin Lee, and Mario Gerla.Standard Integration of Sensing and Opportunistic Diffusion for UrbanMonitoring in Vehicular Sensor Networks: the MobEyes Architecture.In IEEE ISIE, Vigo, Spain, Jun. 2007.
[43] Matthias Grossglauser and Martin Vetterli. Locating Nodes with EASE:Mobility Diffusion of Last Encounters in Ad Hoc Networks. In IEEEINFOCOM, San Francisco, CA, USA, Mar.-Apr. 2003.
[44] Chalermek Intanagonwiwat, Ramesh Govindan, and Deborah Estrin.Directed Diffusion: a Scalable and Robust Communication Paradigm forSensor Networks. In ACM MOBICOM’00, Boston, MA, USA, 2000.
[45] Jinyang Li, John Jannotti, Douglas S. J. De Couto, David R. Karger,and Robert Morris. A Scalable Location Service for Geographic AdHoc Routing. In ACM MOBICOM, Boston, MA, USA, 2000.
[46] Christian Bettstetter, Giovanni Resta, and Paolo Santi. The NodeDistribution of the Random Waypoint Mobility Model for Wireless AdHoc Networks. IEEE Transactions on Mobile Computing, 2(3):257–269,Jul.-Sept. 2003.
[47] Thrasyvoulos Spyropoulos, Konstantinos Psounis, and CauligiRaghavendra. Performance Analysis of Mobility-Assisted Routing. InACM MOBIHOC, Florence, Italy, May 2006.
[48] Fan Bai and Ahmed Helmy. Impact of Mobility on Mobility-AssistedInformation Diffusion (MAID) Protocols. Technical report, USC, July2005.
[49] ns-2 (The Network Simulator). http://www.isi.edu/nsnam/ns/.
[50] Biao Zhou, Kaixin Xu, and Mario Gerla. Group and Swarm MobilityModels for Ad Hoc Network Scenarios Using Virtual Tracks. In IEEEMILCOM, Monterey, CA, USA, Oct.-Nov. 2004.
[51] U.S. Census Bureau. TIGER, TIGER/Line and TIGER-Related Products.Available at. http://www.census.gov/geo/www/tiger/.
[52] Josh Broch, David A. Maltz, David B. Johnson, Yih-Chun Hu, andJorjeta G. Jetcheva. A Performance Comparison of Multi-Hop WirelessAd Hoc Network Routing Protocols. In ACM MOBICOM, Dallas, TX,USA, Oct. 1998.
[53] Amit Kumar Saha and David B. Johnson. Modeling Mobility forVehicular Ad Hoc Networks. In ACM VANET’04, Philadelphia, PA,USA, October 2004.
[54] TS Rappaport. Wireless Communications: Principles and Practice. IEEEPress Piscataway, NJ, USA, 1996.
[55] Uichin Lee, Joon-Sang Park, Eyal Amir, and Mario Gerla. FleaNet: AVirtual Market Place on Vehicular Networks. In V2VCOM’06, San Jose,CA, July 2006.
[56] Uichin Lee, Eugenio Magistretti, Biao Zhou, Mario Gerla, Paolo Bellav-ista, and Antonio Corradi. MobEyes: Smart Mobs for Urban Monitoringwith Vehicular Sensor Networks. IEEE Wireless Communications,13(5):51–57, Sept.-Oct. 2006.
[57] Sze-Yao Ni, Yu-Chee Tseng, Yuh-Shyan Chen, and Jang-Ping Sheu.The Broadcast Storm Problem in a Mobile Ad Hoc Network. InMobiCom’99, Seattle, WA, USA, Aug. 1999.
[58] Tracy Camp, Jeff Boleng, and Vanessa Davies. A survey of mobilitymodels for ad hoc network research. Wireless Communications andMobile Computing (WCMC), 2(5):483–502, 2002.
[59] Maxim Raya and Jean-Pierre Hubaux. The Security of Vehicular AdHoc Networks. In SASN, Alexandria, VA, Nov. 2005.
[60] Uichin Lee, Eugenio Magistretti, Biao Zhou, Mario Gerla, Paolo Bellav-ista, and Antonio Corradi. Dissemination and Harvesting of Urban Datausing Vehicular Sensing Platforms. Technical report, UCLA CSD, 2007.
[61] Yih-Chun Hu, Adrian Perrig, and David B. Johnson. Ariadne: A SecureOn-Demand Routing Protocol for Ad Hoc Networks. In MOBICOM,Atlanta, GA, Sept. 2002.
[62] Sapon Tanachaiwiwat and Ahmed Helmy. Correlation Analysis forAlleviating Effects of Inserted Data in Wireless Sensor Networks. InMobiQuitous, San Diego, PA, Jul. 2005.
[63] Sencun Zhu, Sanjeev Setia, Sushil Jajodia, and Peng Ning. AnInterleaved Hop-by-Hop Authentication Scheme for Filtering False DataInjection in Sensor Networks. In IEEE Symposium on Security andPrivacy, Oakland, CA, May 2004.
[64] Philippe Golle, Dan Greene, and Jessica Staddon. Detecting andCorrecting Malicious Data in VANETs. In VANET’04, Philadelphia,PA, October 2004.
[65] Rafail Ostrovsky and William Skeith. Private Searching on StreamingData. In CRYPTO, Santa Barbara, CA, Aug. 2005.
20