Embed Size (px)
Citation preview

HAL Id: tel-02298397https://hal.archives-ouvertes.fr/tel-02298397
Submitted on 26 Sep 2019
HAL is a multi-disciplinary open accessarchive for the deposit and dissemination of sci-entific research documents, whether they are pub-lished or not. The documents may come fromteaching and research institutions in France orabroad, or from public or private research centers.
L’archive ouverte pluridisciplinaire HAL, estdestinée au dépôt et à la diffusion de documentsscientifiques de niveau recherche, publiés ou non,émanant des établissements d’enseignement et derecherche français ou étrangers, des laboratoirespublics ou privés.
Data Dissemination and Aggregation in VehicularAdhoc Network
Sabri Allani
To cite this version:Sabri Allani. Data Dissemination and Aggregation in Vehicular Adhoc Network. Networking andInternet Architecture [cs.NI]. Université Pau et des Pays de l’Adour; Université de Tunis El Manar,2018. English. �tel-02298397�
UNIVERSITY OF TUNIS EL MANAR
UNIVERSITY OF PAU AND ADOUR COUNTRIES
DOCTORAL THESISA thesis submitted in fulfillment of the requirements
for the degree of Doctor ofCOMPUTER SCIENCE
Defended by SABRI ALLANI
DEFENDED ON 02/11/2018 IN FRONT OF JURY MEMBERS:
HABIB OUNELLI PROF, UNIVERSITY OF TUNIS EL MANAR PRESIDENT
WALID BARHOUMI PROF, UNIVERSITY OF TUNIS CARTHAGE REVIEWER
DJAMAL BENSLIMANE PROF, UNIVERSITY CLAUDE BERNARD LYON 1 REVIEWER
PROF, UNIVERSITY OF MANOUBA EXAMINER
PROF, UNIVERSITY OF TUNIS EL MANAR DIRECTOR
NARJES BELLAMINE SADOK BEN YAHIA RICHARD CHBEIR PROF, UNIVERSITY OF PAU AND ADOUR COUNTRIES DIRECTOR
2017-2018
LIUPPA LAB, University of Pau and Adour Countrie ,64600 Anglet, FranceLIPAH-LR 11ES14, University of Tunis El Manar, 2092 Tunis
Data Dissemination and Aggregation inVehicular Adhoc Network

I dedicate this work: To my parents for education, great love, for their patience and sacrifice.To my sister. To myself and everyone I love.

Acknowledgements
This research work was carried out thanks to the support and encouragement of severalpeople who have each contributed to his way of completing this work. I want to send them avery large thank you.
I want to thank very sincerely my research director Professor Sadok BEN YAHIA for thetrust he gave me. His supervision, his advice and his experience allowed me to acquire theessential knowledge for the development and the result of this work.
Next, I want also to thank very sincerely my research director Professor Richard CHBIERfor the trust he gave me. His supervision, his advice and his experience allowed me to acquirethe essential knowledge for the development and the result of this work.
I also thank my co-supervisor, Dr. Taoufik YEFERNY for his support and guidance. Heoften encouraged me during the realization of this work, and genuinely makes use of hisexperience and knowledge. The work with him was of great value for the realization of thisresearch work.
Abstract
Since the last decade, the emergence of affordable wireless devices in vehicle ad-hoc networkshas been a key step towards improving road safety as well as transport efficiency. Informingvehicles about interesting safety and non-safety events is of key interest. Thus, the design ofan efficient data dissemination protocol has been of paramount importance. A careful scrutinyof the pioneering vehicle-to-vehicle data dissemination approaches highlights that geocastingis the most feasible approach for VANET applications, more especially in safety applications,since safety events are of interest mainly to vehicles located within a specific area, commonlycalled ZOR or Zone Of Relevance, close to the event. Indeed, the most challenging issue ingeocast protocols is the definition of the ZOR for a given event dissemination. In this thesis,our first contribution introduces a new geocast approach, called Data Dissemination Protocolbased on Map Splitting(DPMS). The main thrust of DPMS consists of building the zonesof relevance through the mining of correlations between vehicles’ trajectories and crossedregions. To do so, we rely on the Formal Concept Analysis (FCA), which is a method ofextracting interesting clusters from relational data. The performed experiments show thatDPMS outperforms its competitors in terms of effectiveness and efficiency. In another hand,some VANET applications, e.g., Traffic Information System (TIS), require data aggregationin order to inform vehicles about road traffic conditions, which leads to reduce traffic jamsand consequently CO2 emission while increasing the user comfort. Therefore, the design ofan efficient aggregation protocol that combines correlated traffic information like location,speed and direction known as Floating Car Data (FCD) is a challenging issue. In this thesis,we introduce a new TIS data aggregation protocol called Smart Directional Data Aggregation(SDDA) able to decrease the network overload while obtaining high accurate information ontraffic conditions for large road sections. To this end, we introduce three levels of messagesfiltering: (i) filtering all FCD messages before the aggregation process based on vehicledirections and road speed limitations, (ii) integrating a suppression technique in the phaseof information gathering in order to eliminate the duplicate data, and (iii) aggregating thefiltered FCD data and then disseminating it to other vehicles. The performed experimentsshow that the SDDA outperforms existing approaches in terms of effectiveness and efficiency.
Dans cette thèse nous traitons la problématique de dissémination et d’agrégation des donnéesdans le contexte d’un réseaux véhiculaires VANET (Vehicular Ad-Hoc Networks). D’unecôté la dissémination de données permet d’informer les véhicules mobiles des principauxévénements en un temps acceptable , et de l’autre côté l’agrégation permet de résumerplusieurs données émanant de sources différentes concernant le même événement. Lechallenge de la dissémination consiste à calculer la zone de relevance d’un événement, dedélivrer les messages aux véhicules de cette zone, et de continuer à délivrer les messages encontinu aux véhicules de cette zone. Le challenge de l’agrégation consiste essentiellementà sélectionner les messages à agréger et à qualifier les messages provenant de véhiculeslointains. Pour résoudre le problème de dissémination nous proposons un nouveau protocolede dissémination des données dans les réseaux VANET. La principale idée de ce protocoleest basée sur la définition de zones de relevance ZOR (zone of relevance of a région) pour lamesure de l’intérêt d’une zone par rapport à un évènement donné, et la définition de splitMap permettant de décomposer une grande région en un ensemble de ZORs. L’approche decalcul des ZORs est formalisée, elle est basée sur les techniques de greedy pour l’extractionde la couverture pertinente. D’autre part, certaines applications VANET, par exemple lesystème d’information de trafic (TIS), nécessitent une agrégation de données pour informerles véhicules des conditions de circulation, ce qui réduit les embouteillages et par conséquentles émissions de CO2. Par conséquent, la conception d’un protocole d’agrégation efficacecombinant des informations de trafic corrélées telles que l’emplacement, la vitesse et ladirection, appelées données flottantes sur les voitures (FCD), pose un problème complexe.Dans cette thèse, nous introduisons un nouveau protocole d’agrégation de données dansun réseau VANET appelé SDDA (Smart Directional Data Aggregation). Ce protocole estdédié aussi bien à l’échange de données dans un contexte urbain et autoroutier. Le protocoleproposé est basé sur une sélection des messages à agréger. Trois principaux filtres ont étéutilisés : filtrage basé sur la direction des véhicules, filtrage basé sur la limitation de vitesse,et filtrage basé sur l’élimination des messages dupliqués. Trois algorithmes d’agrégation sontproposés, ils visent à optimiser l’algorithme de SOTIS. Les trois algorithmes traitent des casde routes unidirectionnelles, bidirectionnelles et les réseaux urbains.
Résumé
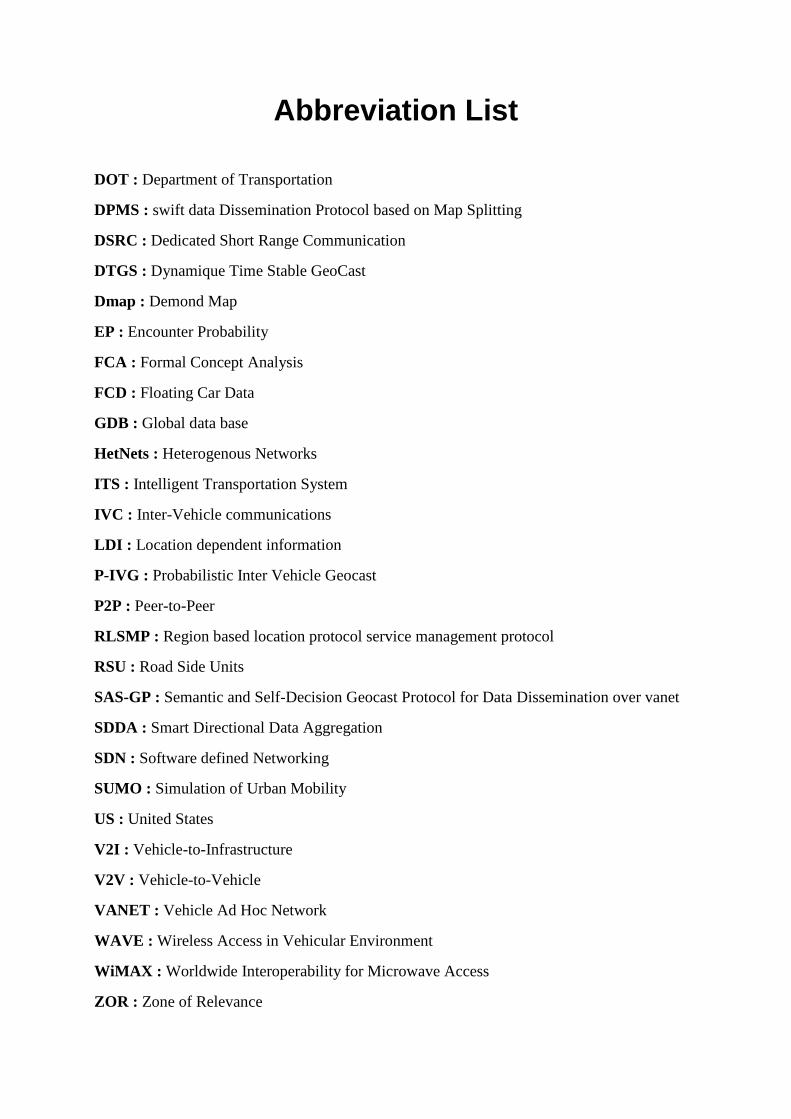
Abbreviation List
DOT : Department of Transportation
DPMS : swift data Dissemination Protocol based on Map Splitting
DSRC : Dedicated Short Range Communication
DTGS : Dynamique Time Stable GeoCast
Dmap : Demond Map
EP : Encounter Probability
FCA : Formal Concept Analysis
FCD : Floating Car Data
GDB : Global data base
HetNets : Heterogenous Networks
ITS : Intelligent Transportation System
IVC : Inter-Vehicle communications
LDI : Location dependent information
P-IVG : Probabilistic Inter Vehicle Geocast
P2P : Peer-to-Peer
RLSMP : Region based location protocol service management protocol
RSU : Road Side Units
SAS-GP : Semantic and Self-Decision Geocast Protocol for Data Dissemination over vanet
SDDA : Smart Directional Data Aggregation
SDN : Software defined Networking
SUMO : Simulation of Urban Mobility
US : United States
V2I : Vehicle-to-Infrastructure
V2V : Vehicle-to-Vehicle
VANET : Vehicle Ad Hoc Network
WAVE : Wireless Access in Vehicular Environment
WiMAX : Worldwide Interoperability for Microwave Access
ZOR : Zone of Relevance
Table of contents
List of figures 11
List of tables 13
1 Introduction 151.1 Context and motivation . . . . . . . . . . . . . . . . . . . . . . . . . . . . 151.2 Contributions . . . . . . . . . . . . . . . . . . . . . . . . . . . . . . . . . 17
1.2.1 Data dissemination in VANETs . . . . . . . . . . . . . . . . . . . 171.2.2 Data aggregation in VANETs . . . . . . . . . . . . . . . . . . . . 18
1.3 List of Publications . . . . . . . . . . . . . . . . . . . . . . . . . . . . . . 191.4 Thesis organization . . . . . . . . . . . . . . . . . . . . . . . . . . . . . . 20
2 Related work 212.1 Introduction . . . . . . . . . . . . . . . . . . . . . . . . . . . . . . . . . . 212.2 Background information . . . . . . . . . . . . . . . . . . . . . . . . . . . 21
2.2.1 Ad Hoc Networks . . . . . . . . . . . . . . . . . . . . . . . . . . 212.2.2 Mobile ad hoc network (MANET) . . . . . . . . . . . . . . . . . . 222.2.3 Vehicle ad hoc network (VANET) . . . . . . . . . . . . . . . . . . 23
2.3 Data dissemination in VANET . . . . . . . . . . . . . . . . . . . . . . . . 272.3.1 Broadcast-based data dissemination . . . . . . . . . . . . . . . . . 272.3.2 Geocast-based data dissemination . . . . . . . . . . . . . . . . . . 30
2.4 Data aggregation in VANET . . . . . . . . . . . . . . . . . . . . . . . . . 342.5 Conclusion . . . . . . . . . . . . . . . . . . . . . . . . . . . . . . . . . . 42
3 Proposed data dissemination protocol for VANET 433.1 Introduction . . . . . . . . . . . . . . . . . . . . . . . . . . . . . . . . . . 433.2 DPMS: A swift data Dissemination Protocol based on Map Splitting . . . . 43
3.2.1 Architecture . . . . . . . . . . . . . . . . . . . . . . . . . . . . . . 453.2.2 Map Splitting and ZOR computation approach . . . . . . . . . . . 46
10 Table of contents
3.2.3 DPMS protocol . . . . . . . . . . . . . . . . . . . . . . . . . . . . 523.3 Performance evaluation . . . . . . . . . . . . . . . . . . . . . . . . . . . . 55
3.3.1 Scenario . . . . . . . . . . . . . . . . . . . . . . . . . . . . . . . . 563.3.2 Evaluation metrics . . . . . . . . . . . . . . . . . . . . . . . . . . 563.3.3 Results . . . . . . . . . . . . . . . . . . . . . . . . . . . . . . . . 59
3.4 Conclusion . . . . . . . . . . . . . . . . . . . . . . . . . . . . . . . . . . 67
4 Proposed data aggregation protocol for VANET 694.1 Introduction . . . . . . . . . . . . . . . . . . . . . . . . . . . . . . . . . . 694.2 Preliminaries . . . . . . . . . . . . . . . . . . . . . . . . . . . . . . . . . 704.3 Aggregation protocol . . . . . . . . . . . . . . . . . . . . . . . . . . . . . 72
4.3.1 Unidirectional road case . . . . . . . . . . . . . . . . . . . . . . . 734.3.2 Bidirectional road case . . . . . . . . . . . . . . . . . . . . . . . . 744.3.3 Urban network case . . . . . . . . . . . . . . . . . . . . . . . . . . 75
4.4 Performance evaluation . . . . . . . . . . . . . . . . . . . . . . . . . . . . 784.4.1 Experimental settings . . . . . . . . . . . . . . . . . . . . . . . . . 804.4.2 Evaluation metrics . . . . . . . . . . . . . . . . . . . . . . . . . . 814.4.3 Results . . . . . . . . . . . . . . . . . . . . . . . . . . . . . . . . 82
4.5 Conclusion . . . . . . . . . . . . . . . . . . . . . . . . . . . . . . . . . . 90
5 Conclusion and future directions 915.1 Conclusion . . . . . . . . . . . . . . . . . . . . . . . . . . . . . . . . . . 915.2 Future directions . . . . . . . . . . . . . . . . . . . . . . . . . . . . . . . 92
References 95
List of figures
1.1 Vehicles broadcasting same events . . . . . . . . . . . . . . . . . . . . . . 161.2 Zone of relevance vs. target region specifications . . . . . . . . . . . . . . 18
2.1 Example of an ad hoc network [23] . . . . . . . . . . . . . . . . . . . . . . 222.2 Example of Mobile Ad Hoc Network (MANET) [57] . . . . . . . . . . . . 232.3 Vehicle Ad Hoc Network (VANET) [56] . . . . . . . . . . . . . . . . . . . 242.4 Example of hybrid V2X communications in VANETs [56] . . . . . . . . . 262.5 The vehicular communication environment . . . . . . . . . . . . . . . . . 272.6 Weighted p-persistence scheme . . . . . . . . . . . . . . . . . . . . . . . . 282.7 Slotted 1-persistence scheme . . . . . . . . . . . . . . . . . . . . . . . . . 292.8 Slotted p-persistence scheme . . . . . . . . . . . . . . . . . . . . . . . . . 292.9 Categories of geocast protocols in VANETs . . . . . . . . . . . . . . . . . 302.10 Self-Organizing Traffic Informational Systems (SOTIS) [46] . . . . . . . . 372.11 Data aggregation with TrafficView [34] . . . . . . . . . . . . . . . . . . . 382.12 Data aggregation and compression with CASCADE [20, 18] . . . . . . . . 39
3.1 General architecture . . . . . . . . . . . . . . . . . . . . . . . . . . . . . . 453.2 Map Splitting and ZOR detection . . . . . . . . . . . . . . . . . . . . . . . 473.3 Pseudo-concept . . . . . . . . . . . . . . . . . . . . . . . . . . . . . . . . 503.4 Protocol Flowchart Diagram . . . . . . . . . . . . . . . . . . . . . . . . . 533.5 Example of different road topologies . . . . . . . . . . . . . . . . . . . . . 573.6 Variation of the average Reachability and Overload of Slotted 1-persistence
w.r.t. the variation of ZOR’s radius . . . . . . . . . . . . . . . . . . . . . . 603.7 Variation of the average Reachability w.r.t. the variation of the number of
vehicles under different maps . . . . . . . . . . . . . . . . . . . . . . . . . 613.8 Variation of the average Precision w.r.t. the variation of the number of
vehicles under different maps . . . . . . . . . . . . . . . . . . . . . . . . . 623.9 Variation of the F-score w.r.t. the variation of the number of vehicles . . . . 63
12 List of figures
3.10 Average Reachability, Precision and F-score . . . . . . . . . . . . . . . . . 643.11 Variation of the Overload w.r.t. the variation of the number of vehicles . . . 653.12 Variation of the Packet loss w.r.t. the variation of the number of vehicles . . 663.13 Variation of the average Latency w.r.t. the variation of the number of vehicles 67
4.1 Unidirectional Road Case . . . . . . . . . . . . . . . . . . . . . . . . . . . 734.2 Bidirectional road case . . . . . . . . . . . . . . . . . . . . . . . . . . . . 754.3 FCD message propagation on a bidirectional road . . . . . . . . . . . . . . 764.4 Urban scenario case . . . . . . . . . . . . . . . . . . . . . . . . . . . . . . 784.5 Example of different road topologies . . . . . . . . . . . . . . . . . . . . . 794.6 Variation of average overload values w.r.t. number of vehicles . . . . . . . 844.7 Variation of average Co2 emission values w.r.t. number of vehicles . . . . . 854.8 Variation in average aggregation precision FCD values w.r.t. number of vehicles 864.9 Variation in average aggregation number of duplicated FCD values w.r.t.
number of vehicles . . . . . . . . . . . . . . . . . . . . . . . . . . . . . . 874.10 Variation of average latency values w.r.t. number of vehicles . . . . . . . . 884.11 Variation of the packet loss values w.r.t. number of vehicles . . . . . . . . 89
List of tables
2.1 Data aggregation use cases . . . . . . . . . . . . . . . . . . . . . . . . . . 362.2 Comparative study between the V2V Floating Car Data aggregation methods 42
3.1 Example of formal context . . . . . . . . . . . . . . . . . . . . . . . . . . 483.2 Simulation settings . . . . . . . . . . . . . . . . . . . . . . . . . . . . . . 563.3 Road topologies characteristics . . . . . . . . . . . . . . . . . . . . . . . . 56
4.1 Road topologies characteristics . . . . . . . . . . . . . . . . . . . . . . . . 804.2 Simulation settings . . . . . . . . . . . . . . . . . . . . . . . . . . . . . . 80

Chapter 1
Introduction
1.1 Context and motivation
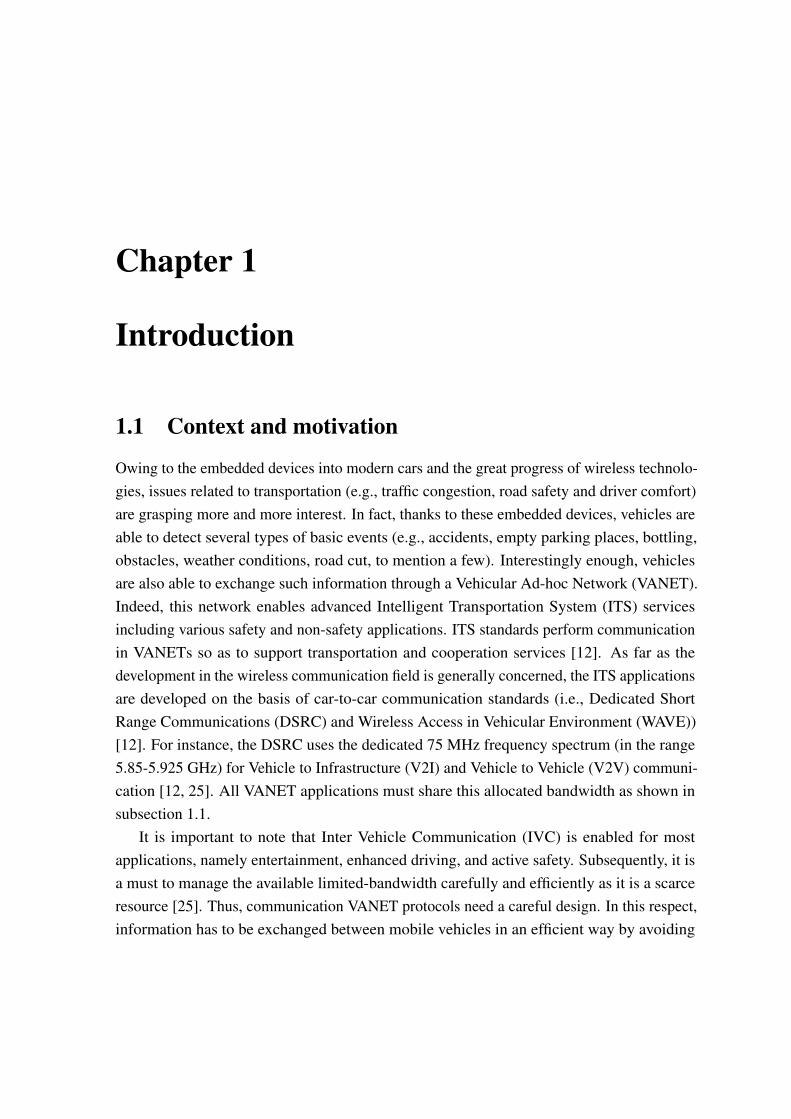
Owing to the embedded devices into modern cars and the great progress of wireless technolo-gies, issues related to transportation (e.g., traffic congestion, road safety and driver comfort)are grasping more and more interest. In fact, thanks to these embedded devices, vehicles areable to detect several types of basic events (e.g., accidents, empty parking places, bottling,obstacles, weather conditions, road cut, to mention a few). Interestingly enough, vehiclesare also able to exchange such information through a Vehicular Ad-hoc Network (VANET).Indeed, this network enables advanced Intelligent Transportation System (ITS) servicesincluding various safety and non-safety applications. ITS standards perform communicationin VANETs so as to support transportation and cooperation services [12]. As far as thedevelopment in the wireless communication field is generally concerned, the ITS applicationsare developed on the basis of car-to-car communication standards (i.e., Dedicated ShortRange Communications (DSRC) and Wireless Access in Vehicular Environment (WAVE))[12]. For instance, the DSRC uses the dedicated 75 MHz frequency spectrum (in the range5.85-5.925 GHz) for Vehicle to Infrastructure (V2I) and Vehicle to Vehicle (V2V) communi-cation [12, 25]. All VANET applications must share this allocated bandwidth as shown insubsection 1.1.
It is important to note that Inter Vehicle Communication (IVC) is enabled for mostapplications, namely entertainment, enhanced driving, and active safety. Subsequently, it isa must to manage the available limited-bandwidth carefully and efficiently as it is a scarceresource [25]. Thus, communication VANET protocols need a careful design. In this respect,information has to be exchanged between mobile vehicles in an efficient way by avoiding
16 Introduction
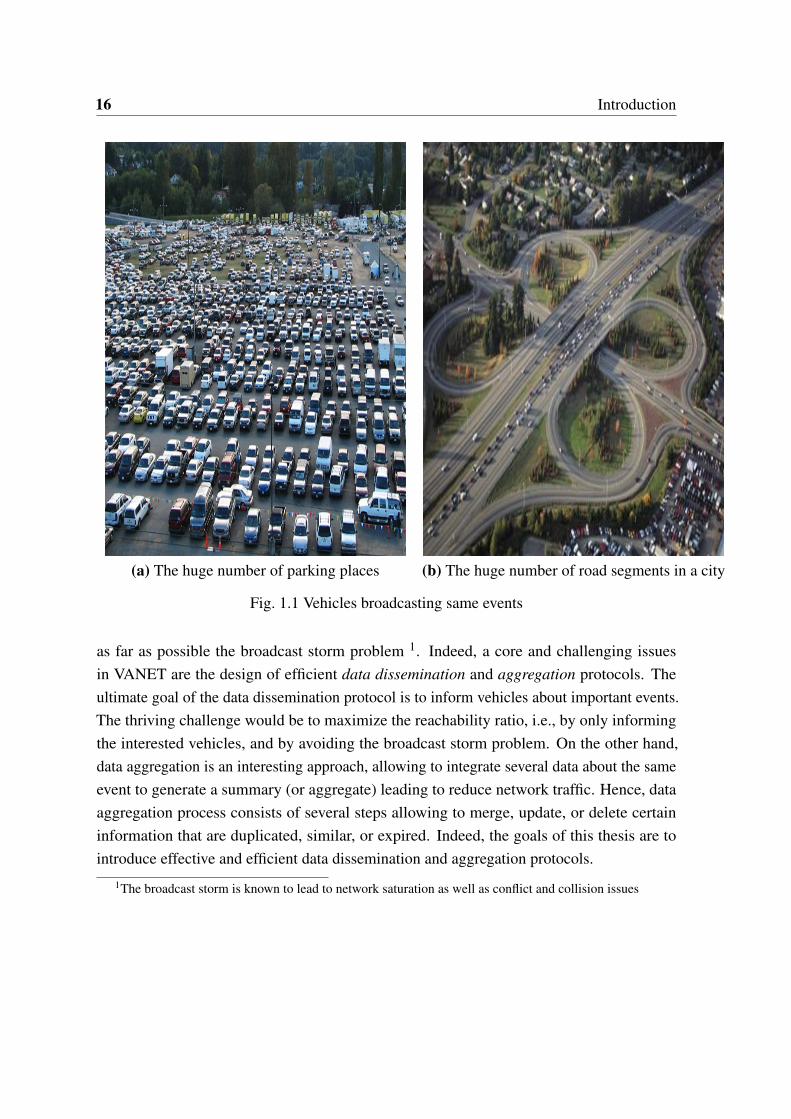
(a) The huge number of parking places (b) The huge number of road segments in a city
Fig. 1.1 Vehicles broadcasting same events
as far as possible the broadcast storm problem 1. Indeed, a core and challenging issuesin VANET are the design of efficient data dissemination and aggregation protocols. Theultimate goal of the data dissemination protocol is to inform vehicles about important events.The thriving challenge would be to maximize the reachability ratio, i.e., by only informingthe interested vehicles, and by avoiding the broadcast storm problem. On the other hand,data aggregation is an interesting approach, allowing to integrate several data about the sameevent to generate a summary (or aggregate) leading to reduce network traffic. Hence, dataaggregation process consists of several steps allowing to merge, update, or delete certaininformation that are duplicated, similar, or expired. Indeed, the goals of this thesis are tointroduce effective and efficient data dissemination and aggregation protocols.
1The broadcast storm is known to lead to network saturation as well as conflict and collision issues
1.2 Contributions 17
1.2 Contributions
The major contributions of this work are shown as follows:
1.2.1 Data dissemination in VANETs
A careful scrutiny of the pioneering vehicle-to-vehicle data dissemination approaches high-lights two main categories to do that: broadcast- or geocast-based techniques. It is worthyto mention that the main moan to be addressed in the broadcast techniques relies on thedissemination of messages to all vehicles in the networks without exception, which is costlyand useless in various scenario since vehicles are not always concerned by all events. Thisdrawback has contributed to the emergence of another alternative: geocast-based techniquesallowing information delivery to vehicles inside a specific region. Indeed, geocasting is themost feasible data dissemination approach for VANET applications, more especially in safetyapplications, since safety events are of interest to vehicles within a specific area standingclose to the event location. Interestingly enough, an geocast-based approach needs to copewith the following requirements:
1. Determine the geocast area, also called Zone Of Relevance (ZOR) of an event;
2. deliver the message to all vehicles within the ZOR; and
3. keep the geocasted message alive in the network for a desired delay, such that thedisseminated information could reach all the arriving vehicles.
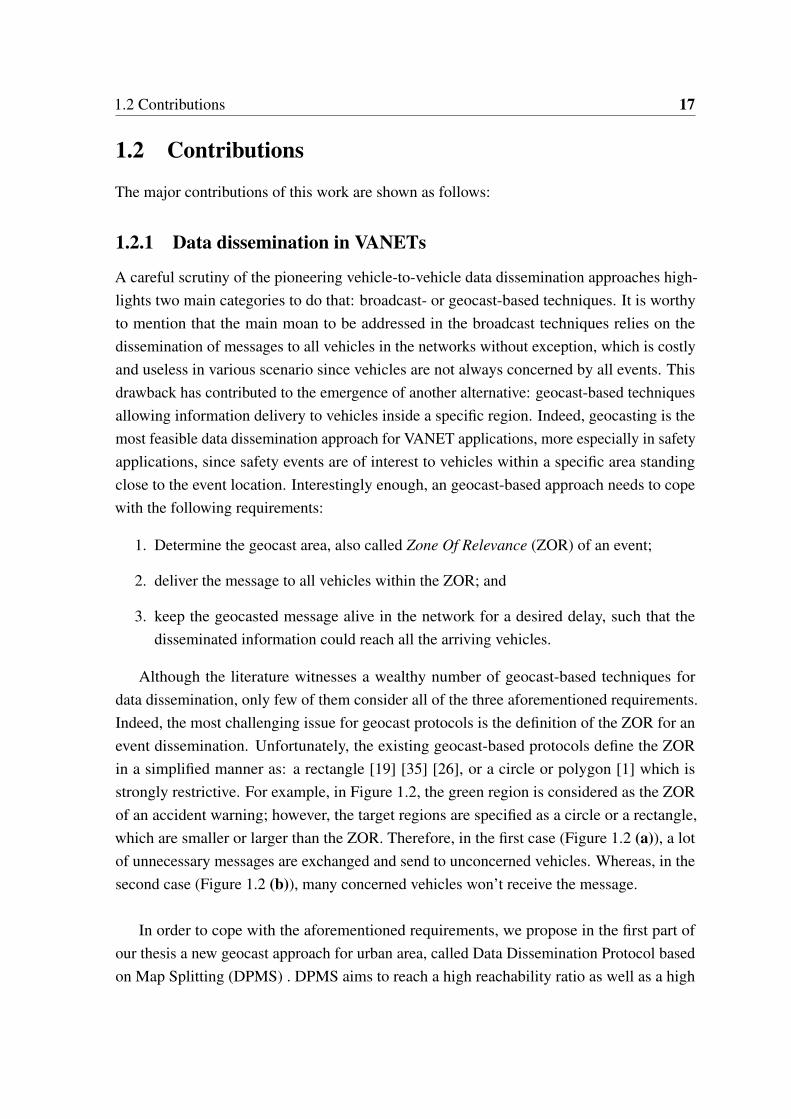
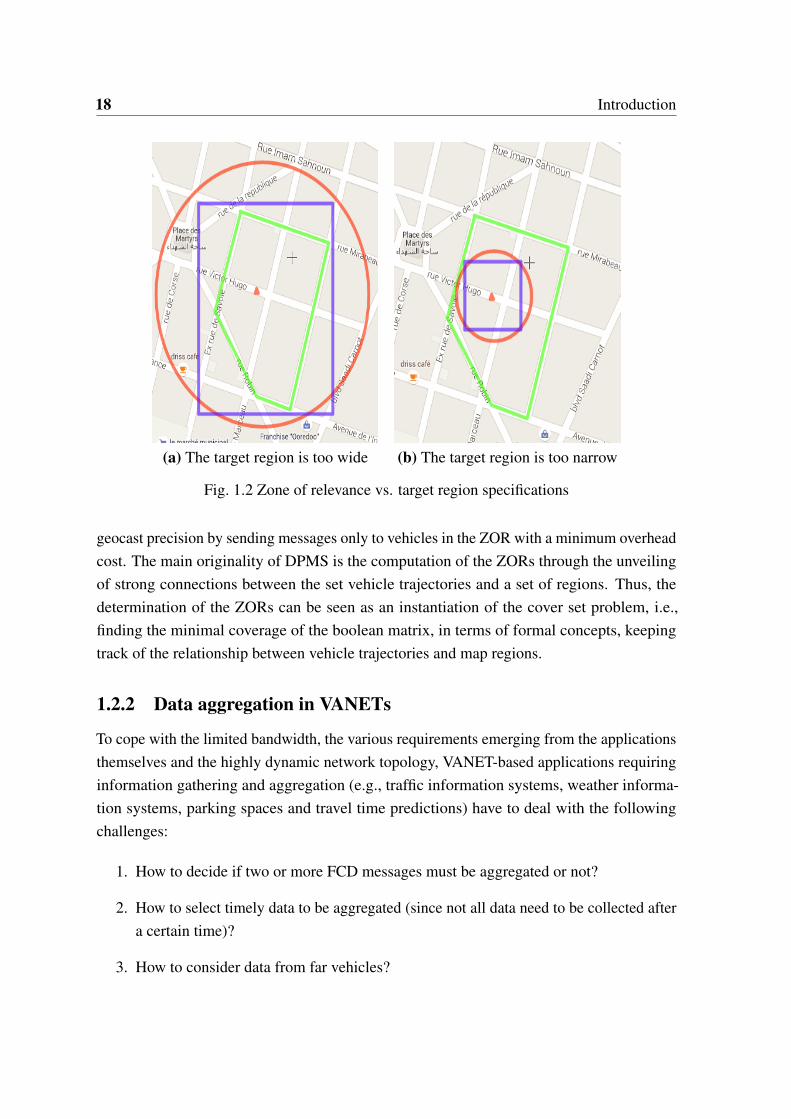
Although the literature witnesses a wealthy number of geocast-based techniques fordata dissemination, only few of them consider all of the three aforementioned requirements.Indeed, the most challenging issue for geocast protocols is the definition of the ZOR for anevent dissemination. Unfortunately, the existing geocast-based protocols define the ZORin a simplified manner as: a rectangle [19] [35] [26], or a circle or polygon [1] which isstrongly restrictive. For example, in Figure 1.2, the green region is considered as the ZORof an accident warning; however, the target regions are specified as a circle or a rectangle,which are smaller or larger than the ZOR. Therefore, in the first case (Figure 1.2 (a)), a lotof unnecessary messages are exchanged and send to unconcerned vehicles. Whereas, in thesecond case (Figure 1.2 (b)), many concerned vehicles won’t receive the message.
In order to cope with the aforementioned requirements, we propose in the first part ofour thesis a new geocast approach for urban area, called Data Dissemination Protocol basedon Map Splitting (DPMS) . DPMS aims to reach a high reachability ratio as well as a high
18 Introduction
(a) The target region is too wide (b) The target region is too narrow
Fig. 1.2 Zone of relevance vs. target region specifications
geocast precision by sending messages only to vehicles in the ZOR with a minimum overheadcost. The main originality of DPMS is the computation of the ZORs through the unveilingof strong connections between the set vehicle trajectories and a set of regions. Thus, thedetermination of the ZORs can be seen as an instantiation of the cover set problem, i.e.,finding the minimal coverage of the boolean matrix, in terms of formal concepts, keepingtrack of the relationship between vehicle trajectories and map regions.
1.2.2 Data aggregation in VANETs
To cope with the limited bandwidth, the various requirements emerging from the applicationsthemselves and the highly dynamic network topology, VANET-based applications requiringinformation gathering and aggregation (e.g., traffic information systems, weather informa-tion systems, parking spaces and travel time predictions) have to deal with the followingchallenges:
1. How to decide if two or more FCD messages must be aggregated or not?
2. How to select timely data to be aggregated (since not all data need to be collected aftera certain time)?
3. How to consider data from far vehicles?
1.3 List of Publications 19
4. How to filter the unnecessary and duplicated FCD messages in order to avoid affectingthe accuracy of the shared traffic information?
5. How to take into consideration the road traffic signals and speed limitations?
In the literature, several data aggregation techniques have been proposed [20, 27, 44, 57].Nevertheless, in a high complex urban and highway network, the large amount of trafficinformation needs smart filtering and selection criteria after the aggregation process. However,the existing techniques mainly focus on combining the correlated items but none of themtries to use a suppression technique in order to eliminate the duplicated messages. Moreover,they take into consideration neither the vehicle directions nor the road speed limitations inthe provided traffic information. To overcome this shortage, we introduce in the second partof our thesis a new data aggregation protocol called Smart Directional Data Aggregation(SDDA) able to decrease the network overload while obtaining high accurate information ontraffic conditions for large road sections. To this end, we introduce three levels of messagesfiltering: (i) filtering all FCD messages before the aggregation process based on vehicledirections and road speed limitations, (ii) integrating a suppression technique in the phaseof information gathering in order to eliminate the duplicate data, and (iii) aggregating thefiltered FCD data and then disseminating it to other vehicles. The performed experimentsshow that the SDDA outperforms existing approaches in terms of effectiveness and efficiency.
1.3 List of Publications
The idea and the contributions presented in this thesis are part of several peer reviewedresearch papers. In this subsection we give the list of our publications grouped by type andsorted by date.
International Journal
• Sabri Allani, Taoufik Yeferny, Richard Chbeir (2017). A scalable data disseminationprotocol based on vehicles trajectories analysis. Ad Hoc Networks, 71:31–44.
International conferences
• Sabri Allani, Taoufik Yeferny, Richard Chbeir, Sadok Ben Yahia (2016). Dpms: A swiftdata dissemination protocol based on map splitting. In Proceedings - International
20 Introduction
Computer Software and Applications Conference (compsac 2016), volume 1, pages817–822.
• Sabri Allani, Taoufik Yeferny, Richard Chbei, Sadok Ben Yahia (2016). A novel VANETdata dissemination approach based on geospatial data. In The 7th International Confer-ence on Emerging Ubiquitous Systems and Pervasive Networks (EUSPN 2016)/The6th International Conference on Current and Future Trends of Information and Com-munication Technologies, pages 572–577.
• Sabri Allani, Taoufik Yeferny, Richard Chbei, Sadok Ben. (2018). Smart directionaldata aggregation in vanet. In Proceedings - International Conference on AdvancedInformation Networking and Applications (In press).
1.4 Thesis organization
The rest of the thesis is in five chapters:
1. In Chapter 2, we describe the pioneering existing approaches of data disseminationand aggregation in order to show their limitations/drawbacks.
2. In Chapter 3, we thoroughly describe our data dissemination protocol, called DataDissemination Protocol based on Map Splitting (DPMS) [5] [4] [3], before presentingin the simulation settings and the evaluation of the proposed DPMS protocol. Also, acomparison between DPMS and other main geocast protocols is presented.
3. In Chapter 4, we introduce a new data aggregation protocol called Smart DirectionalData Aggregation (SDDA) [2]. Performance evaluation of the introduced protocol isthen presented.
4. Chapter 5, concludes this thesis and pins down several future directions.
Chapter 2
Related work
2.1 Introduction
This chapter is devoted to the presentation of vehicular networks (VANETs). Also, we madea comparison between VANETs and Mobile Ad-hoc Networks (MANETs) to emphasize theirdifferent characteristics. Next, we will discuss the architectural concepts of communications,the scope of applications, the characteristics, the constraints and the challenges of VANETs.Finally, we present a detailed overview of data dissemination and aggregation in VANET.
2.2 Background information
Since their inception, Vehicle Ad-Hoc Networks (VANETs) have become a very broad areaof research taking into consideration the specifications of the city and the networks in relationto ad-hoc mobile networks (MANETs) as well as its applications, architectures, capabilitiesand its data management mechanisms.
2.2.1 Ad Hoc Networks
Ad hoc networks, are wireless networks able to organize themselves spontaneously andautonomously in the environment in which they are deployed without previously definedinfrastructure, created on demand to meet a need specific. The task of network managementis distributed over the set of entities communicating over a wireless link, these entities areoften called "nodes" [13].
The IETF MANET group provides a more precise definition in the introduction of[13]: "An ad hoc network includes mobile platforms (for example, a router interconnectingdifferent hosts and wireless devices) called nodes that are free to move without constraint."
22 Related work
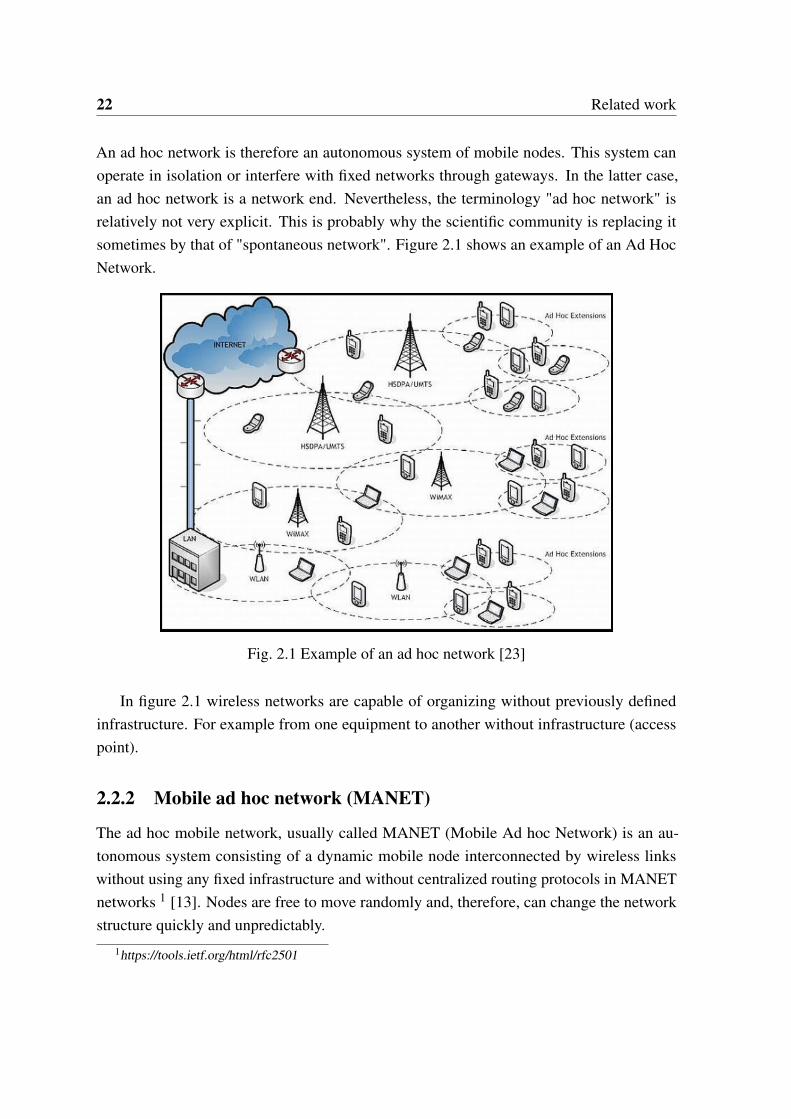
An ad hoc network is therefore an autonomous system of mobile nodes. This system canoperate in isolation or interfere with fixed networks through gateways. In the latter case,an ad hoc network is a network end. Nevertheless, the terminology "ad hoc network" isrelatively not very explicit. This is probably why the scientific community is replacing itsometimes by that of "spontaneous network". Figure 2.1 shows an example of an Ad HocNetwork.
Fig. 2.1 Example of an ad hoc network [23]
In figure 2.1 wireless networks are capable of organizing without previously definedinfrastructure. For example from one equipment to another without infrastructure (accesspoint).
2.2.2 Mobile ad hoc network (MANET)
The ad hoc mobile network, usually called MANET (Mobile Ad hoc Network) is an au-tonomous system consisting of a dynamic mobile node interconnected by wireless linkswithout using any fixed infrastructure and without centralized routing protocols in MANETnetworks 1 [13]. Nodes are free to move randomly and, therefore, can change the networkstructure quickly and unpredictably.
1https://tools.ietf.org/html/rfc2501
2.2 Background information 23
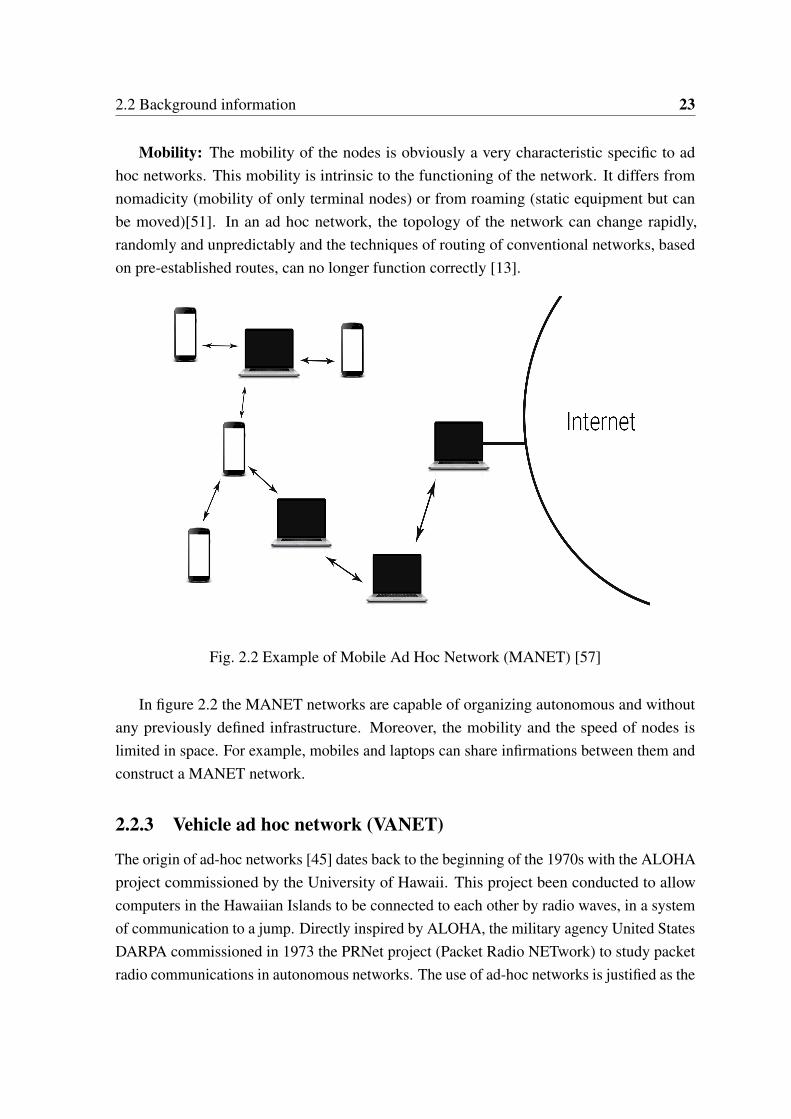
Mobility: The mobility of the nodes is obviously a very characteristic specific to adhoc networks. This mobility is intrinsic to the functioning of the network. It differs fromnomadicity (mobility of only terminal nodes) or from roaming (static equipment but canbe moved)[51]. In an ad hoc network, the topology of the network can change rapidly,randomly and unpredictably and the techniques of routing of conventional networks, basedon pre-established routes, can no longer function correctly [13].
Fig. 2.2 Example of Mobile Ad Hoc Network (MANET) [57]
In figure 2.2 the MANET networks are capable of organizing autonomous and withoutany previously defined infrastructure. Moreover, the mobility and the speed of nodes islimited in space. For example, mobiles and laptops can share infirmations between them andconstruct a MANET network.
2.2.3 Vehicle ad hoc network (VANET)
The origin of ad-hoc networks [45] dates back to the beginning of the 1970s with the ALOHAproject commissioned by the University of Hawaii. This project been conducted to allowcomputers in the Hawaiian Islands to be connected to each other by radio waves, in a systemof communication to a jump. Directly inspired by ALOHA, the military agency United StatesDARPA commissioned in 1973 the PRNet project (Packet Radio NETwork) to study packetradio communications in autonomous networks. The use of ad-hoc networks is justified as the
24 Related work
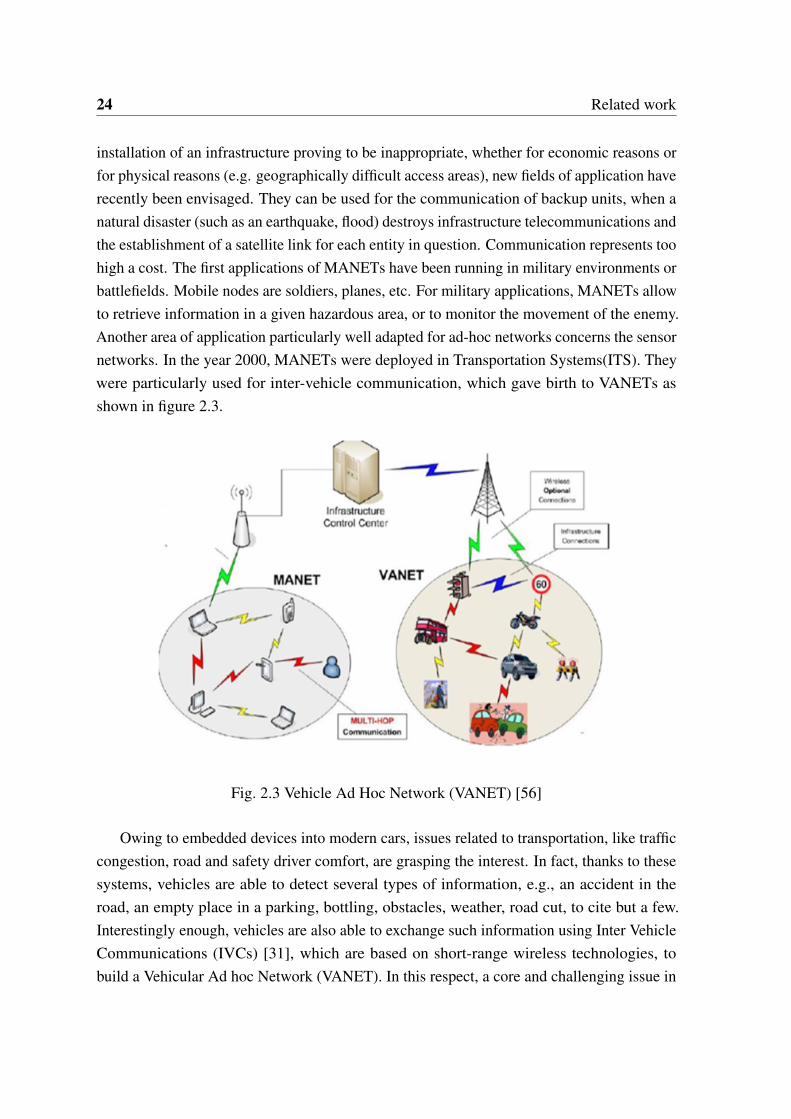
installation of an infrastructure proving to be inappropriate, whether for economic reasons orfor physical reasons (e.g. geographically difficult access areas), new fields of application haverecently been envisaged. They can be used for the communication of backup units, when anatural disaster (such as an earthquake, flood) destroys infrastructure telecommunications andthe establishment of a satellite link for each entity in question. Communication represents toohigh a cost. The first applications of MANETs have been running in military environments orbattlefields. Mobile nodes are soldiers, planes, etc. For military applications, MANETs allowto retrieve information in a given hazardous area, or to monitor the movement of the enemy.Another area of application particularly well adapted for ad-hoc networks concerns the sensornetworks. In the year 2000, MANETs were deployed in Transportation Systems(ITS). Theywere particularly used for inter-vehicle communication, which gave birth to VANETs asshown in figure 2.3.
Fig. 2.3 Vehicle Ad Hoc Network (VANET) [56]
Owing to embedded devices into modern cars, issues related to transportation, like trafficcongestion, road and safety driver comfort, are grasping the interest. In fact, thanks to thesesystems, vehicles are able to detect several types of information, e.g., an accident in theroad, an empty place in a parking, bottling, obstacles, weather, road cut, to cite but a few.Interestingly enough, vehicles are also able to exchange such information using Inter VehicleCommunications (IVCs) [31], which are based on short-range wireless technologies, tobuild a Vehicular Ad hoc Network (VANET). In this respect, a core and challenging issue in
2.2 Background information 25
vehicular networks is the design of an efficient dissemination protocol that informs vehiclesabout interesting safety and non-safety events. The thriving challenge would be to maximizethe delivery ratio by avoiding as far as possible the broadcast storm problem. The latteris known to lead to network saturation as well as conflict issues and collision. A carefulscrutiny of the pioneering vehicle-to-vehicle dissemination approaches highlight that theycan be split into two categories : event-driven, scheduled, or non-demand approach. In theremainder, we will argue for choosing the event-driven approach, where data disseminationis carried out through broadcast or geocast techniques. Worth of mention, the main meanthat can be addressed to the broadcast stands in the costly dissemination of messages to allthe vehicles standing in the neighborhood. This drawback has led us to naturally opt for thegeocasting technique, which is the most feasible data dissemination approach for VANETapplications [39, 50].
Communication architectures
The main purpose of VANETs is to ensure communication and exchanged informationbetween vehicles, as well as between vehicles and road elements, such as intersection lightsand traffic signs. So we can distinguish three types of communications:
• Vehicle Vehicle Communications (V2V): This architectural mode is based on a sim-ple inter-mobile communication that does not involve axes infrastructures. In this typeof communication, a VANET becomes a special case of MANETs.
• Vehicle Communications to Infrastructure (V2I): In this approach, the exchangeinformation involves infrastructure points of the RSU (Road Side Units) route [50].Examples include road signs, intersection lights, satellites, antennas, Internet, etc.
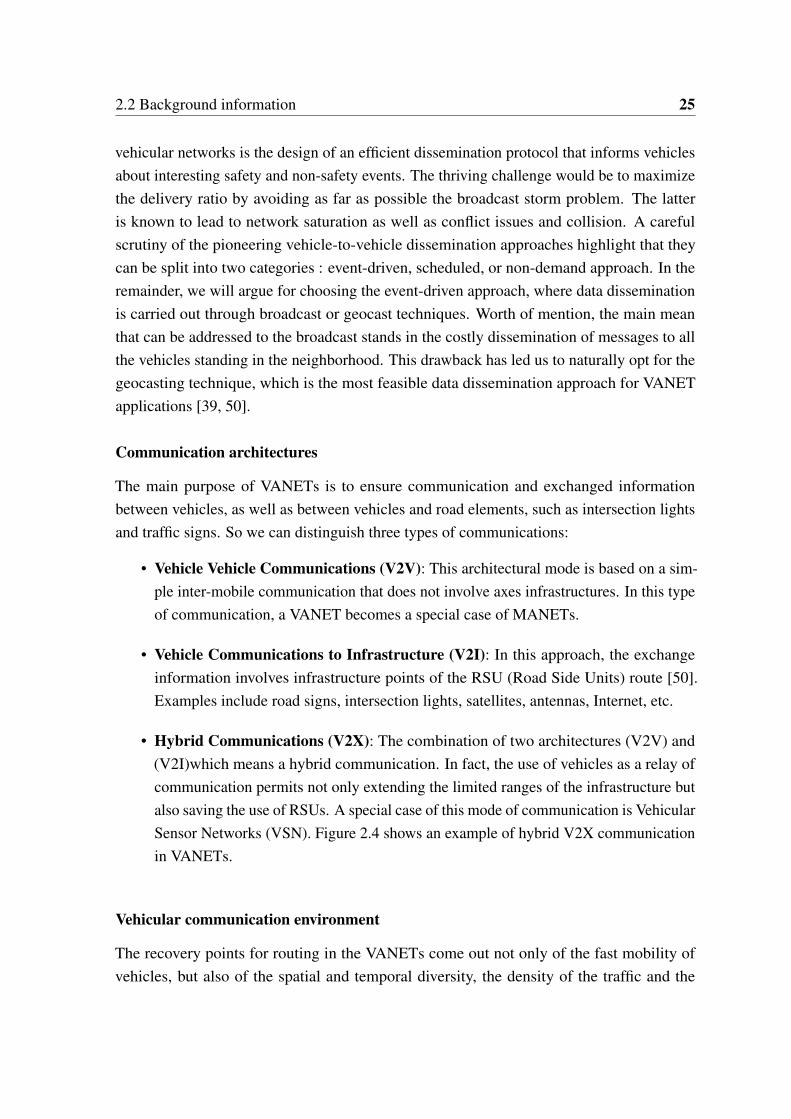
• Hybrid Communications (V2X): The combination of two architectures (V2V) and(V2I)which means a hybrid communication. In fact, the use of vehicles as a relay ofcommunication permits not only extending the limited ranges of the infrastructure butalso saving the use of RSUs. A special case of this mode of communication is VehicularSensor Networks (VSN). Figure 2.4 shows an example of hybrid V2X communicationin VANETs.
Vehicular communication environment
The recovery points for routing in the VANETs come out not only of the fast mobility ofvehicles, but also of the spatial and temporal diversity, the density of the traffic and the
26 Related work
Fig. 2.4 Example of hybrid V2X communications in VANETs [56]
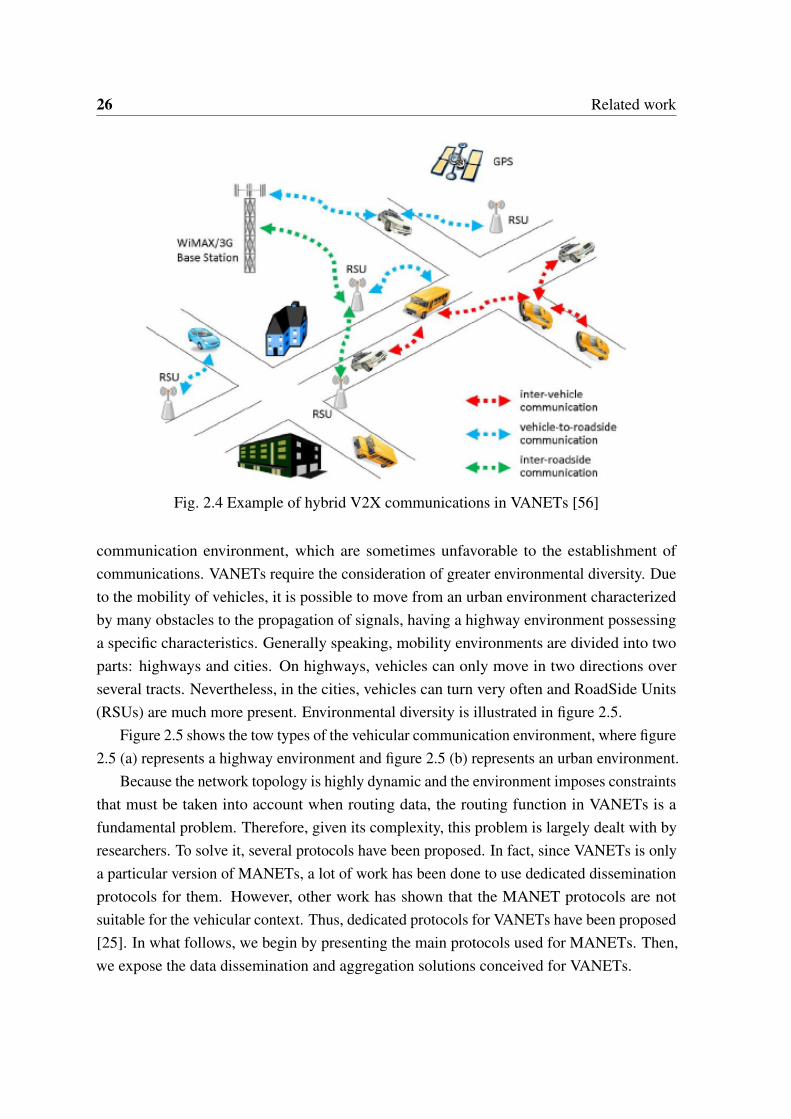
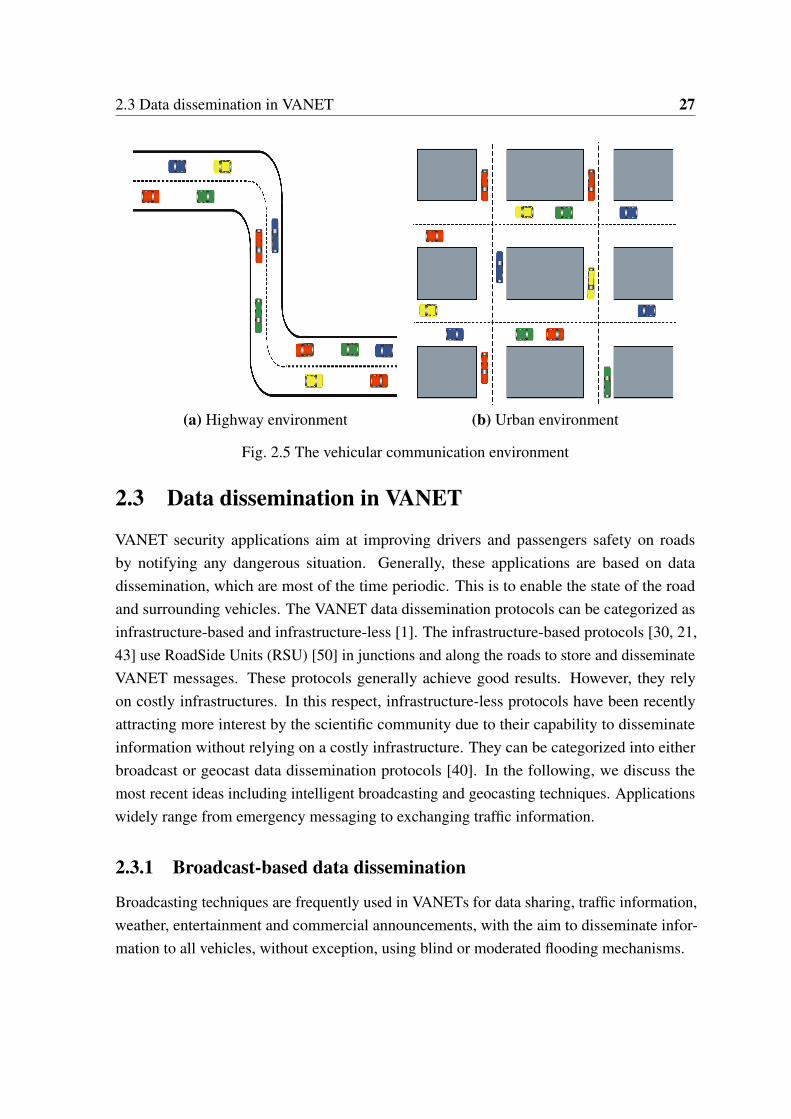
communication environment, which are sometimes unfavorable to the establishment ofcommunications. VANETs require the consideration of greater environmental diversity. Dueto the mobility of vehicles, it is possible to move from an urban environment characterizedby many obstacles to the propagation of signals, having a highway environment possessinga specific characteristics. Generally speaking, mobility environments are divided into twoparts: highways and cities. On highways, vehicles can only move in two directions overseveral tracts. Nevertheless, in the cities, vehicles can turn very often and RoadSide Units(RSUs) are much more present. Environmental diversity is illustrated in figure 2.5.
Figure 2.5 shows the tow types of the vehicular communication environment, where figure2.5 (a) represents a highway environment and figure 2.5 (b) represents an urban environment.
Because the network topology is highly dynamic and the environment imposes constraintsthat must be taken into account when routing data, the routing function in VANETs is afundamental problem. Therefore, given its complexity, this problem is largely dealt with byresearchers. To solve it, several protocols have been proposed. In fact, since VANETs is onlya particular version of MANETs, a lot of work has been done to use dedicated disseminationprotocols for them. However, other work has shown that the MANET protocols are notsuitable for the vehicular context. Thus, dedicated protocols for VANETs have been proposed[25]. In what follows, we begin by presenting the main protocols used for MANETs. Then,we expose the data dissemination and aggregation solutions conceived for VANETs.
2.3 Data dissemination in VANET 27
(a) Highway environment (b) Urban environment
Fig. 2.5 The vehicular communication environment
2.3 Data dissemination in VANET
VANET security applications aim at improving drivers and passengers safety on roadsby notifying any dangerous situation. Generally, these applications are based on datadissemination, which are most of the time periodic. This is to enable the state of the roadand surrounding vehicles. The VANET data dissemination protocols can be categorized asinfrastructure-based and infrastructure-less [1]. The infrastructure-based protocols [30, 21,43] use RoadSide Units (RSU) [50] in junctions and along the roads to store and disseminateVANET messages. These protocols generally achieve good results. However, they relyon costly infrastructures. In this respect, infrastructure-less protocols have been recentlyattracting more interest by the scientific community due to their capability to disseminateinformation without relying on a costly infrastructure. They can be categorized into eitherbroadcast or geocast data dissemination protocols [40]. In the following, we discuss themost recent ideas including intelligent broadcasting and geocasting techniques. Applicationswidely range from emergency messaging to exchanging traffic information.
2.3.1 Broadcast-based data dissemination
Broadcasting techniques are frequently used in VANETs for data sharing, traffic information,weather, entertainment and commercial announcements, with the aim to disseminate infor-mation to all vehicles, without exception, using blind or moderated flooding mechanisms.

28 Related work
Within a blind flooding, a vehicle broadcasts each received or detected information to allneighboring vehicles. This approach can increase reachability by informing all interestedvehicles. However, it undoubtedly leads to network congestion, conflict and collision issues,often named the broadcast storm problem [47] [52].
In the literature, several research studies have attempted to improve this by adoptingvarious suppression techniques, which are probabilistic (e.g., weighted p-persistence) [47],timer-based (i.e., Slotted 1-persistence) [47], or hybrid (i.e., Slotted p-persistence) [47].These techniques have tempted to reduce the broadcast redundancy and the packet loss ratioby decreasing the number of vehicles spreading the same message while ensuring a highreachability.
In weighted p-persistence [47], a forwarding probability is assigned to each neighboringvehicle according to its distance to the message broadcaster. A higher forwarding probabilityis assigned to the vehicles that are located farther away from the broadcaster. After a fixedwaiting time (e.g., 2 ms), the receiver rebroadcasts with the assigned probability if it does notreceive duplicate copies of the message as shown in figure 2.6.
Fig. 2.6 Weighted p-persistence scheme
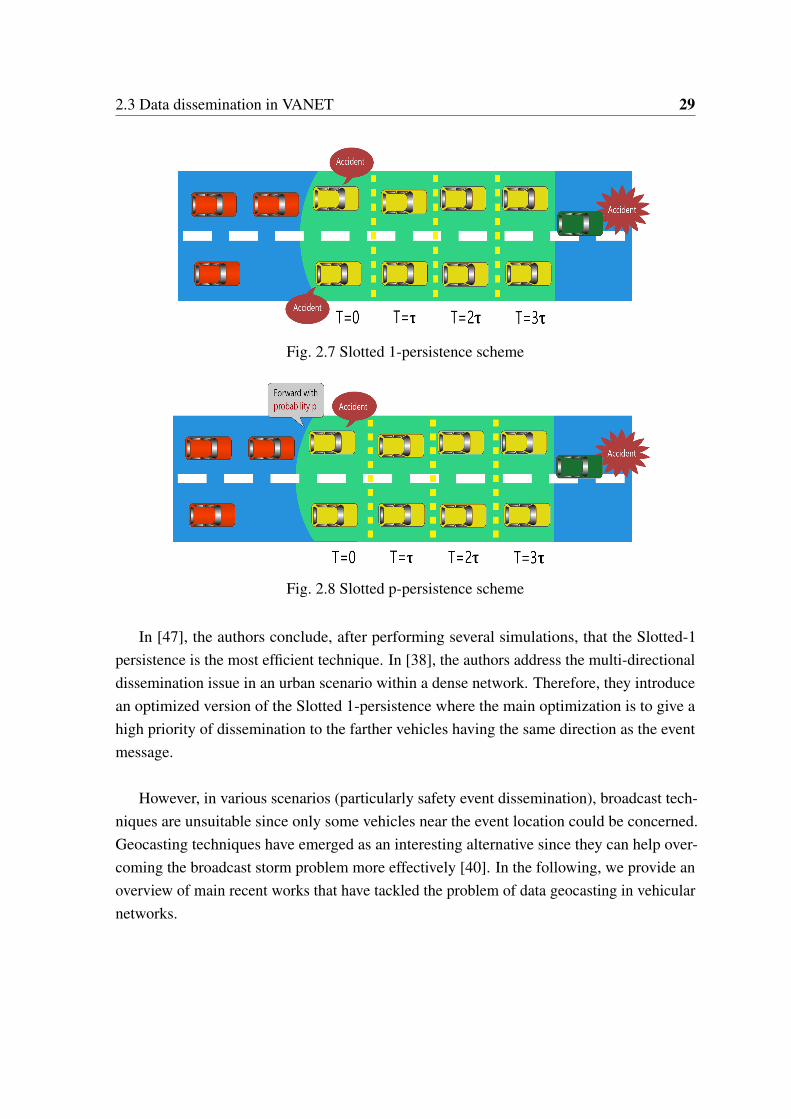
In Slotted 1-persistence [47], different waiting time slots are assigned to the neighboringvehicles depending on their locations. A shorter waiting time is assigned to the vehicleslocated in the farthest region from the broadcaster. Upon receiving a message, the receiverchecks the packet ID and rebroadcasts it with a probability 1 at the assigned time slot if itreceives the packet for the first time and has not received previsouly any duplicates before itsassigned time slot; otherwise, it discards the packet as shown in figure 2.7.
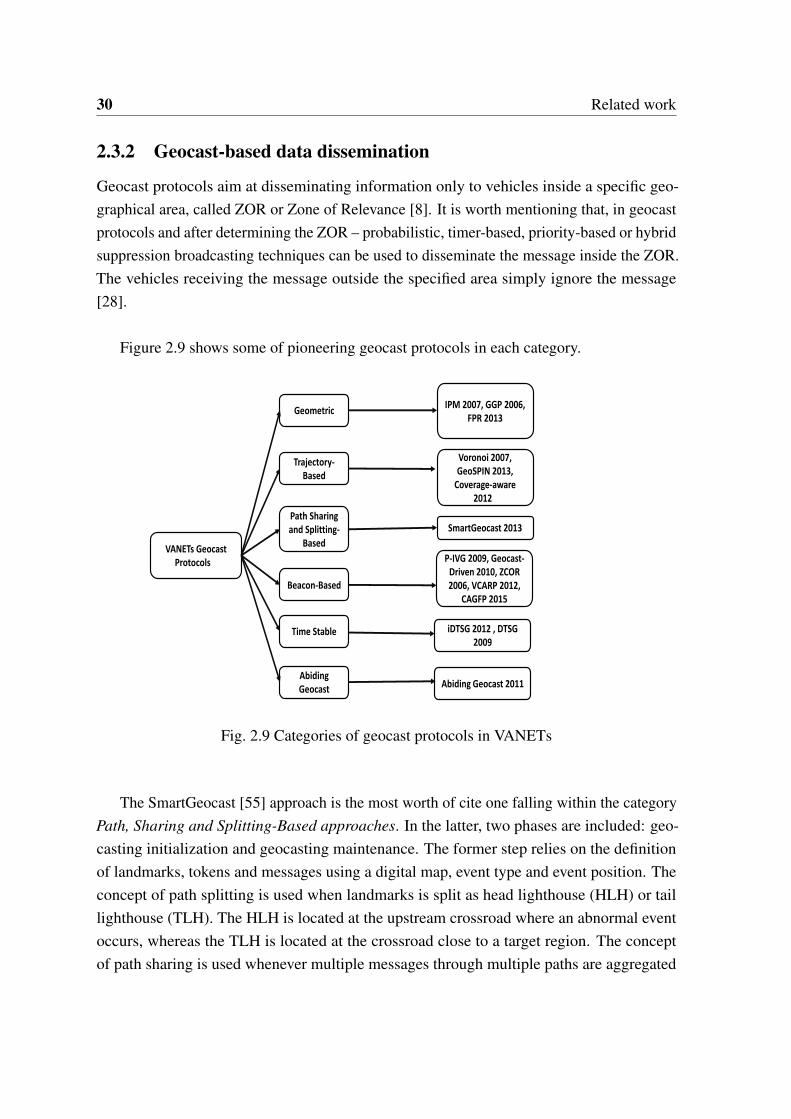
In Slotted p-persistence [47], a forwarding probability and a slotted waiting time are used.Indeed, a higher probability and a shorter slotted waiting time are assigned to the vehicleslocated in the farthest region from the broadcaster. Hence, the receiver rebroadcasts with thepre-determined probability p at the assigned time slot if it does not receive any message echofrom the neighboring vehicles as shown in figure 2.8.
2.3 Data dissemination in VANET 29
Fig. 2.7 Slotted 1-persistence scheme
Fig. 2.8 Slotted p-persistence scheme
In [47], the authors conclude, after performing several simulations, that the Slotted-1persistence is the most efficient technique. In [38], the authors address the multi-directionaldissemination issue in an urban scenario within a dense network. Therefore, they introducean optimized version of the Slotted 1-persistence where the main optimization is to give ahigh priority of dissemination to the farther vehicles having the same direction as the eventmessage.
However, in various scenarios (particularly safety event dissemination), broadcast tech-niques are unsuitable since only some vehicles near the event location could be concerned.Geocasting techniques have emerged as an interesting alternative since they can help over-coming the broadcast storm problem more effectively [40]. In the following, we provide anoverview of main recent works that have tackled the problem of data geocasting in vehicularnetworks.
30 Related work
2.3.2 Geocast-based data dissemination
Geocast protocols aim at disseminating information only to vehicles inside a specific geo-graphical area, called ZOR or Zone of Relevance [8]. It is worth mentioning that, in geocastprotocols and after determining the ZOR – probabilistic, timer-based, priority-based or hybridsuppression broadcasting techniques can be used to disseminate the message inside the ZOR.The vehicles receiving the message outside the specified area simply ignore the message[28].
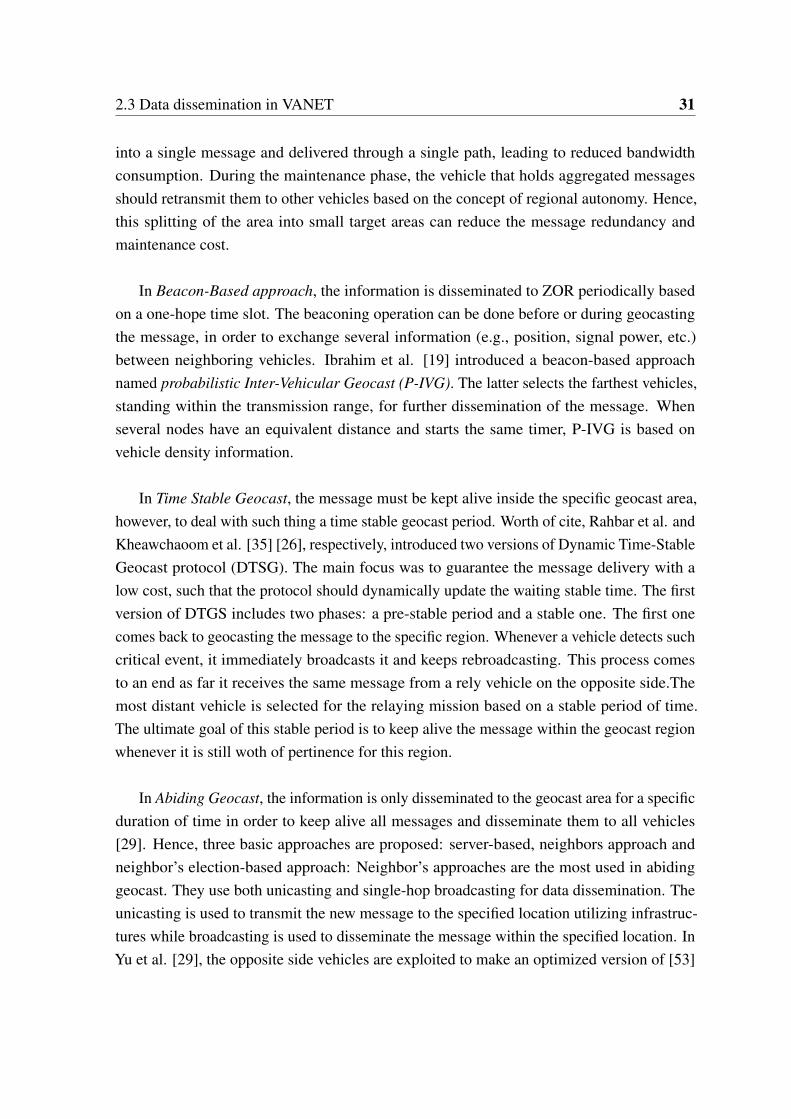
Figure 2.9 shows some of pioneering geocast protocols in each category.
VANETs Geocast Protocols e
Geometric
Abiding Geocast
Time Stable
Beacon-Based
Path Sharing and Splitting-
Based
Trajectory-Based
IPM 2007, GGP 2006, FPR 2013
Voronoi 2007, GeoSPIN 2013,
Coverage-aware2012e
iDTSG 2012 , DTSG 2009
SmartGeocast 2013
P-IVG 2009, Geocast-Driven 2010, ZCOR 2006, VCARP 2012,
CAGFP 2015
Abiding Geocast 2011
Fig. 2.9 Categories of geocast protocols in VANETs
The SmartGeocast [55] approach is the most worth of cite one falling within the categoryPath, Sharing and Splitting-Based approaches. In the latter, two phases are included: geo-casting initialization and geocasting maintenance. The former step relies on the definitionof landmarks, tokens and messages using a digital map, event type and event position. Theconcept of path splitting is used when landmarks is split as head lighthouse (HLH) or taillighthouse (TLH). The HLH is located at the upstream crossroad where an abnormal eventoccurs, whereas the TLH is located at the crossroad close to a target region. The conceptof path sharing is used whenever multiple messages through multiple paths are aggregated
2.3 Data dissemination in VANET 31
into a single message and delivered through a single path, leading to reduced bandwidthconsumption. During the maintenance phase, the vehicle that holds aggregated messagesshould retransmit them to other vehicles based on the concept of regional autonomy. Hence,this splitting of the area into small target areas can reduce the message redundancy andmaintenance cost.
In Beacon-Based approach, the information is disseminated to ZOR periodically basedon a one-hope time slot. The beaconing operation can be done before or during geocastingthe message, in order to exchange several information (e.g., position, signal power, etc.)between neighboring vehicles. Ibrahim et al. [19] introduced a beacon-based approachnamed probabilistic Inter-Vehicular Geocast (P-IVG). The latter selects the farthest vehicles,standing within the transmission range, for further dissemination of the message. Whenseveral nodes have an equivalent distance and starts the same timer, P-IVG is based onvehicle density information.
In Time Stable Geocast, the message must be kept alive inside the specific geocast area,however, to deal with such thing a time stable geocast period. Worth of cite, Rahbar et al. andKheawchaoom et al. [35] [26], respectively, introduced two versions of Dynamic Time-StableGeocast protocol (DTSG). The main focus was to guarantee the message delivery with alow cost, such that the protocol should dynamically update the waiting stable time. The firstversion of DTGS includes two phases: a pre-stable period and a stable one. The first onecomes back to geocasting the message to the specific region. Whenever a vehicle detects suchcritical event, it immediately broadcasts it and keeps rebroadcasting. This process comesto an end as far it receives the same message from a rely vehicle on the opposite side.Themost distant vehicle is selected for the relaying mission based on a stable period of time.The ultimate goal of this stable period is to keep alive the message within the geocast regionwhenever it is still woth of pertinence for this region.
In Abiding Geocast, the information is only disseminated to the geocast area for a specificduration of time in order to keep alive all messages and disseminate them to all vehicles[29]. Hence, three basic approaches are proposed: server-based, neighbors approach andneighbor’s election-based approach: Neighbor’s approaches are the most used in abidinggeocast. They use both unicasting and single-hop broadcasting for data dissemination. Theunicasting is used to transmit the new message to the specified location utilizing infrastruc-tures while broadcasting is used to disseminate the message within the specified location. InYu et al. [29], the opposite side vehicles are exploited to make an optimized version of [53]

32 Related work
safety abiding geocast protocol. Indeed, a dynamic adjustment of waiting time after the nextbroadcast and the selection of the best opposite lanes vehicles to rebroadcast the messagein such critical dangerous event can deal with the broadcast storm problem [47] and avoidunnecessary broadcast.
In this respect, Ibrahim et al. [19] introduce a probabilistic and beacon-based approachnamed p-IVG (probabilistic Inter-Vehicular Geocast). The p-IVG approach tackles thedrawbacks of timer based broadcasting approach (e.g., the Slotted 1-persistence [47]) indense networks. In fact, in a dense network, a very large number of vehicles within a givenarea (e.g., ZOR) have almost the same re-broadcast probability or waiting time, so they re-broadcast the packet at the same time. This would lead to a local spatial broadcast storm. Toovercome this drawback, the authors of the p-IVG proposed to set the re-broadcast decisionprobabilistic based on the surrounding vehicle density. Indeed, as far as several vehicles havean equivalent distance and start the same timer, p-IVG relies on vehicle density informationto set the waiting time at each vehicle in order to solve the spatial broadcast storm problem.However, in p-IVG, vehicles exchange beaconing messages to determine the density of thesurrounding vehicles, what undoubtedly leads to an extra network overload. Furthermore,the p-IVG only focuses on the highways scenario and does not pay attention to the ZORdetermination issue. Indeed, it assumes the existence of a certain number of vehicles, withina rectangular area near to the event location, where the messages should be transmitted.
Rahbar et al. [35] and Kheawchaoom et al. [26] introduce, respectively, two versions ofthe Dynamic Time-Stable Geocast protocol (DTSG) for the highways scenario. The mainfocus is to provide low cost message delivery and to keep the message alive within the ZORfor a specific period of time (e.g., event life time). DTSG includes two phases: a pre-stableperiod and a stable one. The first one consists of geocasting the message to the specificregion. Whenever a vehicle detects such a critical event, it immediately broadcasts (and keepsrebroadcasting) the event. This process ends when the vehicle receives the same messagefrom a rely vehicle on the opposite side. After this period, the protocol moves to the stableperiod; i.e., the protocol tries to maintain the message within the target region for a specifiedperiod of time, whenever it is still worth of pertinence for this region. Like p-IVG, DTSGonly considers the highways scenario and defines the ZOR as a rectangular shape.
Allal et al. [1] split the dissemination area, which is equivalent to a ZOR, into a setof sub-ZORs to deal with the temporal network fragmentation issue. To do so, they usesimple geometrical shapes (e.g., circles, rectangles, triangles and polygons) to cover thesesub-ZORs. In order to lower the message overhead and the processing time, the authorsprovide a technique allowing to determine whether some sub-ZORs are in the same direction
2.3 Data dissemination in VANET 33
so to send them the same message. It is worth mentioning that the authors delegate the affec-tation of the ZOR to a dedicated authority (as road safety services) which would provide thecoordinates or designations of stretches of roads where vehicles could be affected by an event.
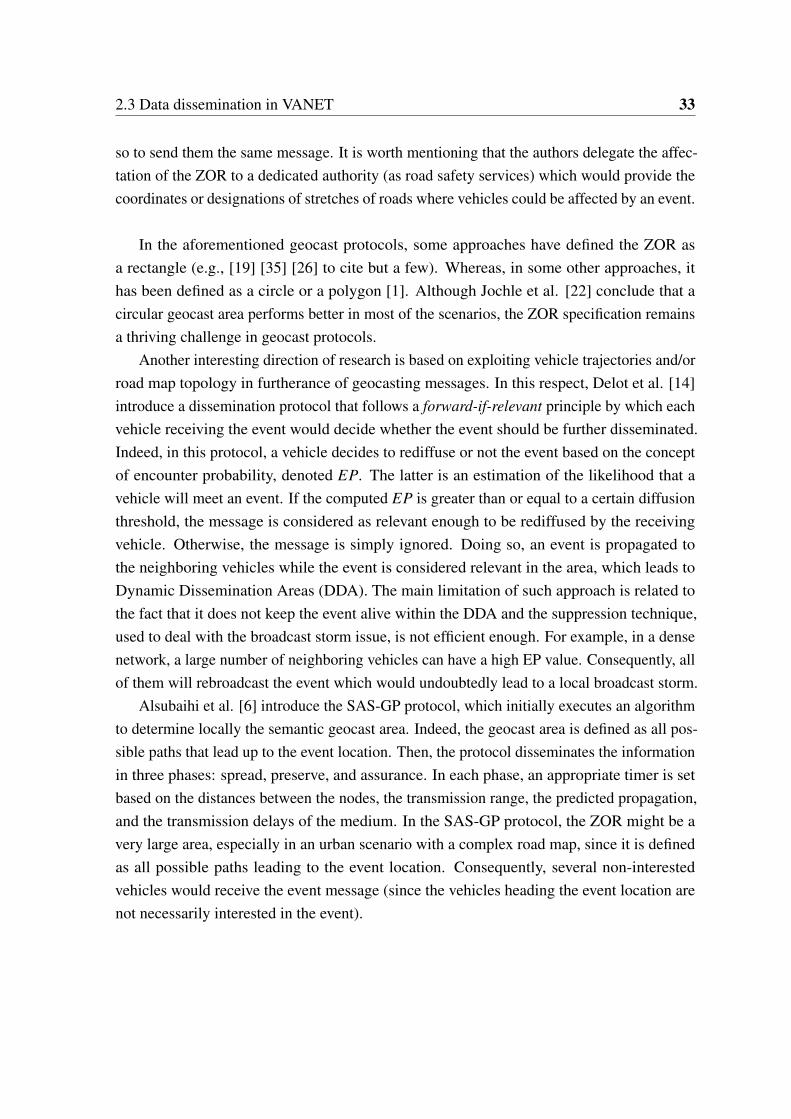
In the aforementioned geocast protocols, some approaches have defined the ZOR asa rectangle (e.g., [19] [35] [26] to cite but a few). Whereas, in some other approaches, ithas been defined as a circle or a polygon [1]. Although Jochle et al. [22] conclude that acircular geocast area performs better in most of the scenarios, the ZOR specification remainsa thriving challenge in geocast protocols.
Another interesting direction of research is based on exploiting vehicle trajectories and/orroad map topology in furtherance of geocasting messages. In this respect, Delot et al. [14]introduce a dissemination protocol that follows a forward-if-relevant principle by which eachvehicle receiving the event would decide whether the event should be further disseminated.Indeed, in this protocol, a vehicle decides to rediffuse or not the event based on the conceptof encounter probability, denoted EP. The latter is an estimation of the likelihood that avehicle will meet an event. If the computed EP is greater than or equal to a certain diffusionthreshold, the message is considered as relevant enough to be rediffused by the receivingvehicle. Otherwise, the message is simply ignored. Doing so, an event is propagated tothe neighboring vehicles while the event is considered relevant in the area, which leads toDynamic Dissemination Areas (DDA). The main limitation of such approach is related tothe fact that it does not keep the event alive within the DDA and the suppression technique,used to deal with the broadcast storm issue, is not efficient enough. For example, in a densenetwork, a large number of neighboring vehicles can have a high EP value. Consequently, allof them will rebroadcast the event which would undoubtedly lead to a local broadcast storm.
Alsubaihi et al. [6] introduce the SAS-GP protocol, which initially executes an algorithmto determine locally the semantic geocast area. Indeed, the geocast area is defined as all pos-sible paths that lead up to the event location. Then, the protocol disseminates the informationin three phases: spread, preserve, and assurance. In each phase, an appropriate timer is setbased on the distances between the nodes, the transmission range, the predicted propagation,and the transmission delays of the medium. In the SAS-GP protocol, the ZOR might be avery large area, especially in an urban scenario with a complex road map, since it is definedas all possible paths leading to the event location. Consequently, several non-interestedvehicles would receive the event message (since the vehicles heading the event location arenot necessarily interested in the event).
34 Related work
To sum up, the aforementioned studies cannot effectively cope with all of the threepredefined requirements of geocast protocols. For the sake of ensuring a high reachabilityratio as well as a high geocast precision, we advocate that only appropriate messages needsto be sent to vehicles interested in the event with a minimum overhead cost. In this paper, weintroduce a novel geocast protocol that highlights the following sighting features:
• Precised detection of the ZOR by applying a data analysis technique on vehicles’trajectories. Actually, in our protocol, the map is split into a set of regions. Then, foreach region, we determine the set of regions composing its ZOR. Hence, a centralizeddatabase is dedicated to store the result of map decomposition and ZOR association.
• Better management of the event lifetime in the ZOR. Indeed, the geocasted messageshould remain in the ZOR for a desired delay, such that arriving vehicles can beinformed. Only few approaches (e.g., [35] and [26]) addressed this issue by rebroad-casting the event during a certain delay, which significantly increases the networkoverload. To tackle this issue in our protocol, when a vehicle enters in a new region, itretrieves events received by other vehicles in the current region. By doing so, perti-nent events are kept alive inside the region, without the need of rebroadcasting eventmessages as the existing geocast approaches do.
• Better event dissemination. In fact, we avoid the broadcast storm during the dis-semination of events to vehicles within the ZOR by using a moderated Slotted-1persistence technique. This suppression technique avoids the broadcast storm problemand guarantees a high reachability.
2.4 Data aggregation in VANET
In larger road networks, urban and highway, there is a huge amount of traffic information thatquickly exceeds reasonable limits. In this respect, an appropriate aggregation mechanismcan reduce the communication cost while obtaining useful aggregated information. Severalrelated approaches have been proposed in the literature. A typical kind of Mobile Ad hocNetworks (MANETs) is Vehicular Ad hoc Networks (VANETs) [12]. In these latter, everynetwork node, which essentially represents one vehicle, can communicate with an existinginfrastructure or with other vehicles, for instance Road Side Units (RSU). In the recent past,there has been a fast development of the technology needed to support VANETs. Such atechnology has been opted for by several pioneering automobile manufacturers [12], such asHonda, Toyota and the US Department of Transportation (DoT). That has helped novel ideas
2.4 Data aggregation in VANET 35
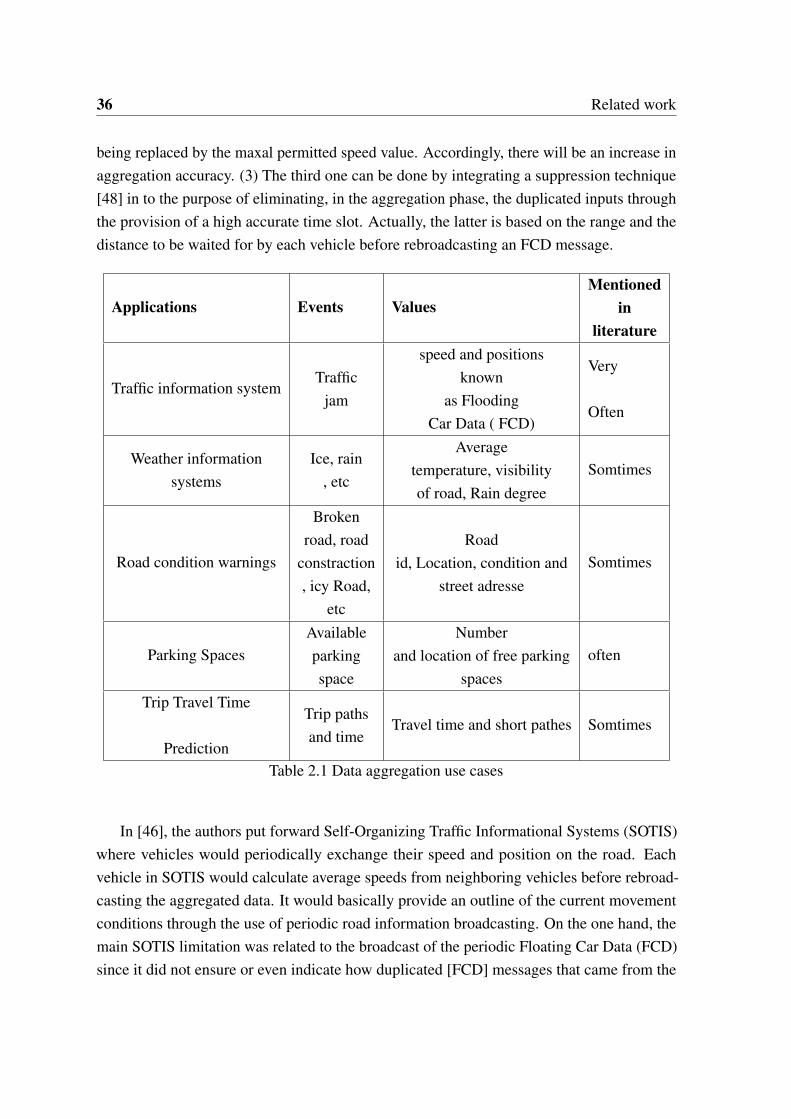
for VANET-based applications to emerge, namely for safety and non safety information. Thelatter includes internet access, P2P file sharing and multimedia streaming [34]. The formerincludes notifying traffic conditions and upcoming roadway hazards, as well as collectingand disseminating weather information [34]. The US DoT has mainly focused on safetyapplications in vehicular networks including both collision warning and assistance [12]. Intel-ligent Transportation System (ITS) standards have carried out communications in VANETsto support cooperation and transportation services [12]. To ameliorate ITS effectivenessand information exchanging, advanced technologies have been incorporated, like gestureand image recognition. To develop wireless communication, ITS applications have beenevolved regarding car-to-car communication standards [12]. For instance, the DSRC uses thededicated 75 MHz frequency spectrum (in the range 5.85-5.925 GHz) for Vehicle to Infras-tructure (V2I) and Vehicle to Vehicle (V2V) communication [12]. All VANET applicationsmust share this allocated bandwidth. In addition to that, Inter Vehicle Communication (IVC)technology is application-enabled for active safety enhanced driving, and entertainment. Asa consequence, the careful and efficient management of the available limited bandwidthis a must, on account of being a scarce resource. As a result, the communication VANETprotocols require a careful design. Thus, in the aim of coping with the limited bandwidth,multiple needs have emerged from the highly dynamic network topology and the applicationsthemselves. In particular, applications based on VANETs, which necessitate informationgathering and aggregation, must consider the following challenges: i) Which FCD messageto aggregate? ii) when to aggregate data? iii) How to deal with information got from farvehicles? iv) How to separate out unneeded or duplicated FCD messages? v) How to accountfor speed limitations and road traffic signals ? data lot of information aggregation techniquesin the literature have been put forward [20, 27, 44, 57]. Data aggregation use cases aresummarized in table 2.1 . Nevertheless, within highly complex urban and highway networks,a big quantity of traffic data need selection criteria and smart filtering after the aggregationprocess. On the other hand, all existing techniques mainly have been chiefly focused oncombining correlated items. However, no technique has eliminated duplicated messages. Inthe target of coping with the previous requirements, Smart Directional Data Aggregation(SDDA), a new aggregation protocol, is introduced [18, 27] . It is properly able to dealwith traffic data in highway and urban conditions. This protocol rightly selects the FCDmessages to aggregate. For this task, SDDA provides 3 filters: (1) The first one utilizes thevehicle’s directions. Indeed, every vehicle aggregates not just information corresponding toits direction but also stores, carries and forwards uninteresting data. (2) The second one iscarried out by using road speed limitations. Therefore, in case an average speed of receivedFCD messages surpasses maximum maximal permitted speed, it will be brushed aside, hence
36 Related work
being replaced by the maxal permitted speed value. Accordingly, there will be an increase inaggregation accuracy. (3) The third one can be done by integrating a suppression technique[48] in to the purpose of eliminating, in the aggregation phase, the duplicated inputs throughthe provision of a high accurate time slot. Actually, the latter is based on the range and thedistance to be waited for by each vehicle before rebroadcasting an FCD message.
Applications Events ValuesMentioned
inliterature
Traffic information systemTraffic
jam
speed and positionsknown
as FloodingCar Data ( FCD)
Very
Often
Weather informationsystems
Ice, rain, etc
Averagetemperature, visibilityof road, Rain degree
Somtimes
Road condition warnings
Brokenroad, road
constraction, icy Road,
etc
Roadid, Location, condition and
street adresseSomtimes
Parking SpacesAvailableparkingspace
Numberand location of free parking
spacesoften
Trip Travel Time
Prediction
Trip pathsand time
Travel time and short pathes Somtimes
Table 2.1 Data aggregation use cases
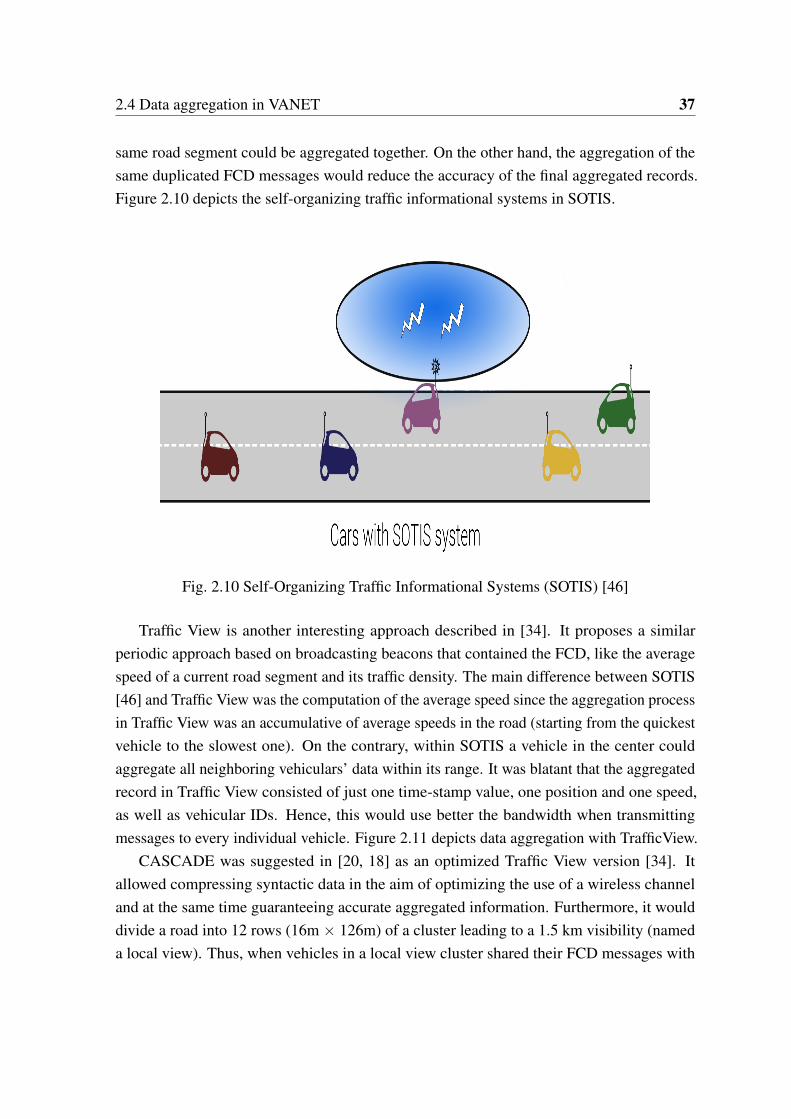
In [46], the authors put forward Self-Organizing Traffic Informational Systems (SOTIS)where vehicles would periodically exchange their speed and position on the road. Eachvehicle in SOTIS would calculate average speeds from neighboring vehicles before rebroad-casting the aggregated data. It would basically provide an outline of the current movementconditions through the use of periodic road information broadcasting. On the one hand, themain SOTIS limitation was related to the broadcast of the periodic Floating Car Data (FCD)since it did not ensure or even indicate how duplicated [FCD] messages that came from the
2.4 Data aggregation in VANET 37
same road segment could be aggregated together. On the other hand, the aggregation of thesame duplicated FCD messages would reduce the accuracy of the final aggregated records.Figure 2.10 depicts the self-organizing traffic informational systems in SOTIS.
Fig. 2.10 Self-Organizing Traffic Informational Systems (SOTIS) [46]
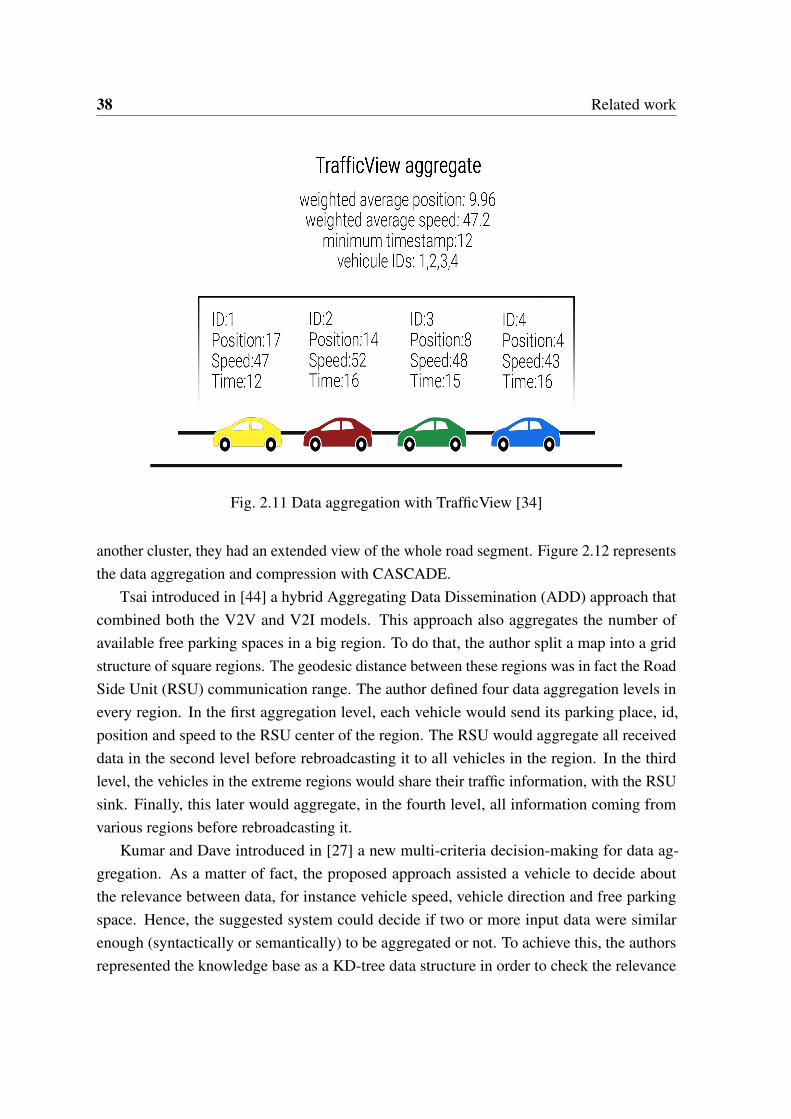
Traffic View is another interesting approach described in [34]. It proposes a similarperiodic approach based on broadcasting beacons that contained the FCD, like the averagespeed of a current road segment and its traffic density. The main difference between SOTIS[46] and Traffic View was the computation of the average speed since the aggregation processin Traffic View was an accumulative of average speeds in the road (starting from the quickestvehicle to the slowest one). On the contrary, within SOTIS a vehicle in the center couldaggregate all neighboring vehiculars’ data within its range. It was blatant that the aggregatedrecord in Traffic View consisted of just one time-stamp value, one position and one speed,as well as vehicular IDs. Hence, this would use better the bandwidth when transmittingmessages to every individual vehicle. Figure 2.11 depicts data aggregation with TrafficView.
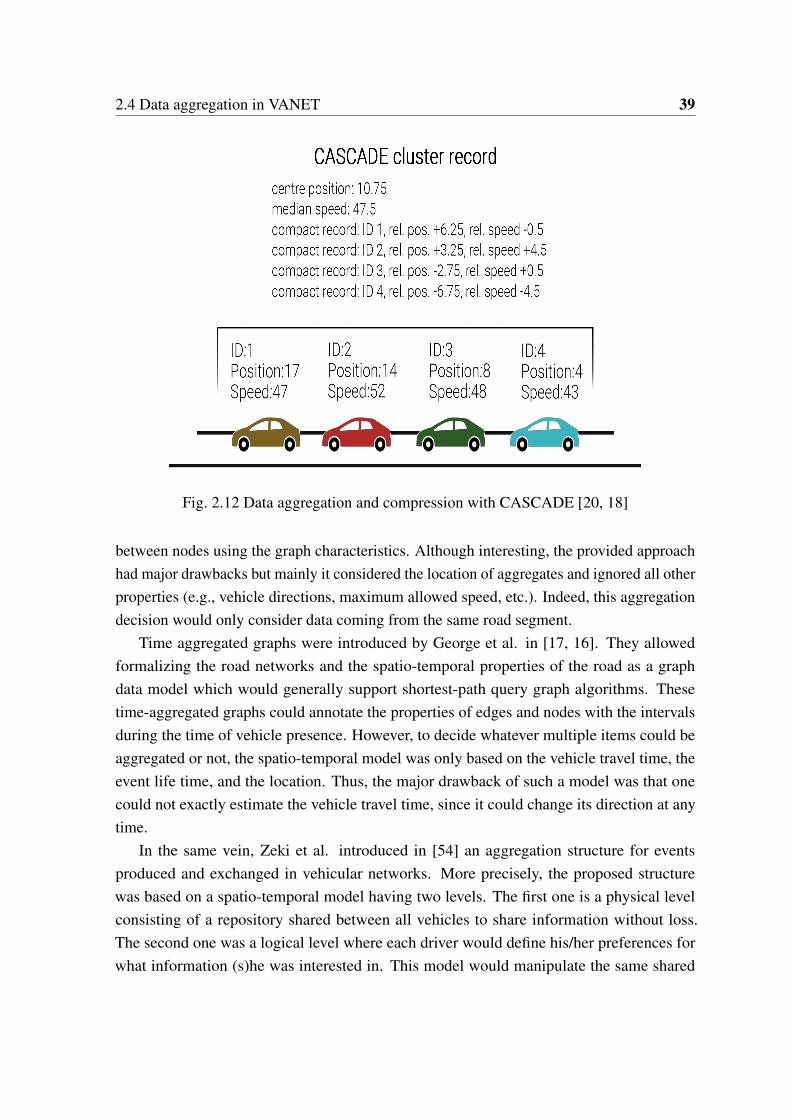
CASCADE was suggested in [20, 18] as an optimized Traffic View version [34]. Itallowed compressing syntactic data in the aim of optimizing the use of a wireless channeland at the same time guaranteeing accurate aggregated information. Furthermore, it woulddivide a road into 12 rows (16m × 126m) of a cluster leading to a 1.5 km visibility (nameda local view). Thus, when vehicles in a local view cluster shared their FCD messages with
38 Related work
Fig. 2.11 Data aggregation with TrafficView [34]
another cluster, they had an extended view of the whole road segment. Figure 2.12 representsthe data aggregation and compression with CASCADE.
Tsai introduced in [44] a hybrid Aggregating Data Dissemination (ADD) approach thatcombined both the V2V and V2I models. This approach also aggregates the number ofavailable free parking spaces in a big region. To do that, the author split a map into a gridstructure of square regions. The geodesic distance between these regions was in fact the RoadSide Unit (RSU) communication range. The author defined four data aggregation levels inevery region. In the first aggregation level, each vehicle would send its parking place, id,position and speed to the RSU center of the region. The RSU would aggregate all receiveddata in the second level before rebroadcasting it to all vehicles in the region. In the thirdlevel, the vehicles in the extreme regions would share their traffic information, with the RSUsink. Finally, this later would aggregate, in the fourth level, all information coming fromvarious regions before rebroadcasting it.
Kumar and Dave introduced in [27] a new multi-criteria decision-making for data ag-gregation. As a matter of fact, the proposed approach assisted a vehicle to decide aboutthe relevance between data, for instance vehicle speed, vehicle direction and free parkingspace. Hence, the suggested system could decide if two or more input data were similarenough (syntactically or semantically) to be aggregated or not. To achieve this, the authorsrepresented the knowledge base as a KD-tree data structure in order to check the relevance
2.4 Data aggregation in VANET 39
Fig. 2.12 Data aggregation and compression with CASCADE [20, 18]
between nodes using the graph characteristics. Although interesting, the provided approachhad major drawbacks but mainly it considered the location of aggregates and ignored all otherproperties (e.g., vehicle directions, maximum allowed speed, etc.). Indeed, this aggregationdecision would only consider data coming from the same road segment.
Time aggregated graphs were introduced by George et al. in [17, 16]. They allowedformalizing the road networks and the spatio-temporal properties of the road as a graphdata model which would generally support shortest-path query graph algorithms. Thesetime-aggregated graphs could annotate the properties of edges and nodes with the intervalsduring the time of vehicle presence. However, to decide whatever multiple items could beaggregated or not, the spatio-temporal model was only based on the vehicle travel time, theevent life time, and the location. Thus, the major drawback of such a model was that onecould not exactly estimate the vehicle travel time, since it could change its direction at anytime.
In the same vein, Zeki et al. introduced in [54] an aggregation structure for eventsproduced and exchanged in vehicular networks. More precisely, the proposed structurewas based on a spatio-temporal model having two levels. The first one is a physical levelconsisting of a repository shared between all vehicles to share information without loss.The second one was a logical level where each driver would define his/her preferences forwhat information (s)he was interested in. This model would manipulate the same shared
40 Related work
knowledge base between all vehicles. The ability of being duplicate insensitive and beingable to guarantee lossless exchanged information was a significant characteristic of theirdata structure. In addition, the storage space, mainly needed for the aggregation structure,was particularly limited to include a governable number of temporal dimensions. The mainlimitation of this solution was the maintenance and the privacy issues of such a sharedknowledge base [32]. Moreover, the overhead level was still high due to the problem ofduplication and the absence of data filtering before the aggregation process.
In [36, 37], the aggregation of the FCD was only based on the geographical characteristicsof the area. For that purpose, the authors introduced the Region-based Location protocol Ser-vice Management Protocol (RLSMP) which aimed to reduce the updated positions as well asreducing the number of messages generated to locate car positions. Although the aggregationsolution clearly reduced the network overload, it resulted in: i) more packet collisions andconsequently more re-transmissions essentially due to the fact that the exchanged packetshad a big size, and ii) longer delays owing to the processing carried out on the data.
In [49], the authors proposed a road real-time visual car navigation system, where a drivercan obtain location-dependent information (LDI). In this system, each vehicle has a Demandmap (Dmap), a data set representing the geographical distribution of the strength of demandsfor LDI. Each vehicle shares a subset of a Dmap with other vehicles using flooding method.However, unneeded or duplicated LDI may be broadcasted in the network then networkresources may be wasted and overload ratio will rise up.
In [58], the decision to aggregate, carry or forward FCD was based on the currentcollected traffic information. The proposed approach relies on data centers to store FCD.Indeed, the authors formulate the FCD gathering issue as a scheduling optimization problemand demonstrate that it is a NP-hard problem. Thus, the filtering process is solved by agenetic-based heuristic algorithm called RIDE and a dynamic programming solution. Themain limitation of RIDE is the high cost of deploying data centers. Also, the amount ofdata to be transferred could be large and the network communication overhead must beconsidered.
In [15], Xiaoyu et al. introduced an adaptive software-defined networking (SDN) schemeof vehicle clustering for aggregated traffic information based on the fifth generation (5G)-VANET. This scheme is based on base stations and access points as a local database (LDB)to store the clustering and FCD information. The information gathered from multiple LDBsconstitutes the global database(GDB). After that, The SDN controller enables the sharingbetween the heterogeneous network (HetNets) through the separation of the control and dataplanes. Nevertheless, this collection scheme raises many challenge. First, the timeliness ofFCD is crucial and data must be collected, aggregated and disseminated within a tolerable
2.4 Data aggregation in VANET 41
delay. Last, in urban scenario, the amount of data could be large and the network overloadmust be considered.
To sum up, the aggregation process in the aforementioned approaches consists of threephases known as decision, fusion and dissemination:
1. The decision phase, where decision regarding the selection of data items to be fused ismade
2. The fusion phase, which is related to the function of fusion. Therefore, all the similardata will be merged in one record
3. The dissemination phase, where aggregated data are broadcasted to other vehicles.
Consequently, the existing aggregation schemes have several limitations, but mainly:
• Security: If the aggregation has the ability to decrease bandwidth consumption prob-lems, it might make security issues harder to manage (e.g., the encryption and thedecryption of multiple aggregated and compressed packets) [32].
• Scalability: The existing schemes have medium aggregation time as well as lowscalability. This is owing to the fact that when the number of the duplicated exchangedmessages goes up, the number of collision problems rises as well [27].
• Genericity: Only few approaches [44, 27] propose a generic model for both aggregationand dissemination mechanisms. In fact, such a combination and synchronisation is ofparamount importance to avoid the broadcast storm problem [48] and to decrease thenetwork overhead.
• Filtering: The input items are not fully filtered out (many duplicated items and irrele-vant items are not neglected) leading to a high level of network overload.
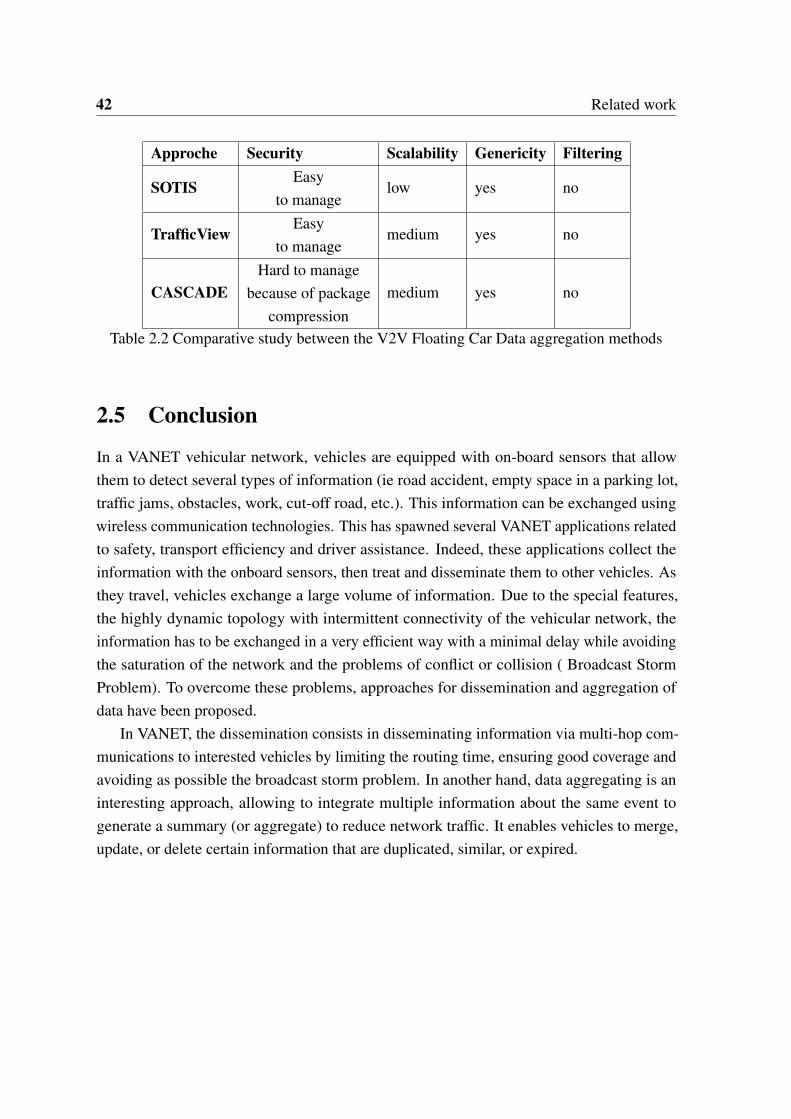
A comparative study is presented in table 2.2 of the existing aggregation methods, whileevaluating them according to the security, the scalability, the genericity and the filtering. Inthe following table we focus only on the V2V Floating Car Data aggregation methods.
42 Related work
Approche Security Scalability Genericity Filtering
SOTISEasy
to managelow yes no
TrafficViewEasy
to managemedium yes no
CASCADEHard to manage
because of packagecompression
medium yes no
Table 2.2 Comparative study between the V2V Floating Car Data aggregation methods
2.5 Conclusion
In a VANET vehicular network, vehicles are equipped with on-board sensors that allowthem to detect several types of information (ie road accident, empty space in a parking lot,traffic jams, obstacles, work, cut-off road, etc.). This information can be exchanged usingwireless communication technologies. This has spawned several VANET applications relatedto safety, transport efficiency and driver assistance. Indeed, these applications collect theinformation with the onboard sensors, then treat and disseminate them to other vehicles. Asthey travel, vehicles exchange a large volume of information. Due to the special features,the highly dynamic topology with intermittent connectivity of the vehicular network, theinformation has to be exchanged in a very efficient way with a minimal delay while avoidingthe saturation of the network and the problems of conflict or collision ( Broadcast StormProblem). To overcome these problems, approaches for dissemination and aggregation ofdata have been proposed.
In VANET, the dissemination consists in disseminating information via multi-hop com-munications to interested vehicles by limiting the routing time, ensuring good coverage andavoiding as possible the broadcast storm problem. In another hand, data aggregating is aninteresting approach, allowing to integrate multiple information about the same event togenerate a summary (or aggregate) to reduce network traffic. It enables vehicles to merge,update, or delete certain information that are duplicated, similar, or expired.
Chapter 3
Proposed data dissemination protocol forVANET
3.1 Introduction
In this chapter, we thoroughly describe our data dissemination protocol DPMS. Indeed, themain originality of DPMS is the formalization of the ZORs through the unveiling of strongconnections between the set vehicle trajectories and a set of regions. Thus, the determinationof the ZORs can be seen as an instantiation of the cover set problem [33], i.e., finding theminimal coverage of the boolean matrix, in terms of formal concepts, keeping track of therelationship between vehicle trajectories and map regions.
The remainder of this chapter is organized as follows. In Section 3.2, we thoroughlydescribe the main idea of our dissemination protocol DPMS. In Section 3.3 the simulationsettings and the evaluation of the proposed DPMS protocol are presented. Also, a comparisonbetween DPMS and other main geocast protocols is presented here. The last section concludesthis chapter.
3.2 DPMS: A swift data Dissemination Protocol based onMap Splitting
In the following, we first define the main concepts and functions used in our approach beforedetailing the architecture, the map splitting and the dissemination protocol.
44 Proposed data dissemination protocol for VANET
Definition 1 Road (rd): is a path that connects two junctions. We denote by rd∗ the set ofjunctions connected to the road rd. For example, let rd be a road connecting two junctionsj1 and j2, then rd∗ = { j1, j2}.
In the sequel, we say that two roads rdi and rd j are connected if they share at least onecommon junction, i.e., rd∗i ∩ rd∗j ̸= /0 �
Definition 2 Region (r): is a finite set of connected roads. Formally,
r = {rd1,rd2, ...,rdn}.
Where:
- rdi denotes a road in the region r
- ∀ rdi ∈ r ∃ rd j ̸=i ∈ r such that rd∗i ∩ rd∗j ̸= /0 �
Definition 3 City (c): is a finite set of connected regions. Formally,
c = {r1,r2, ...,rn}.
Where:
- ri denotes a region in the city c
- ∀ ri ∈ c ∃ r j ∈ c such that ∃ rdp ∈ ri ∃ rdk ̸=p ∈ r j and rd∗p∩ rd∗k ̸= /0 �
The following functions are used in our approach.
Definition 4 Zone Of Relevance (ZOR):The zone of relevance of a region r, denoted ZOR(r), is the set of regions having a certaininterest regarding events occurring in region r. Formally, let R be a set of regions and P(R)
the powerset of R, we define ZOR(r) as follows:
ZOR : R→P(R)
r 7→ {r1,r2, ...,rn}.
where ri (1 ≤ i ≤ n) is a region having a certain interest regarding what happens inregion r �
3.2 DPMS: A swift data Dissemination Protocol based on Map Splitting 45
Definition 5 (Split Map)The split map of a city c, denoted SP(c), is the set of regions composing the city c with theircorresponding ZOR. Formally, let C be a set of cities and R a set of regions, we define SP(c)as follows:
SP : C→ R×P(R)
c 7→ {(r1,ZOR(r1)), ...,(rn,ZOR(rn))}.
where each couple (ri,ZOR(ri)) denotes a region in the city c and its corresponding ZOR�
In the following section, we thoroughly describe the architecture of our protocol as well asits main functions.
3.2.1 Architecture
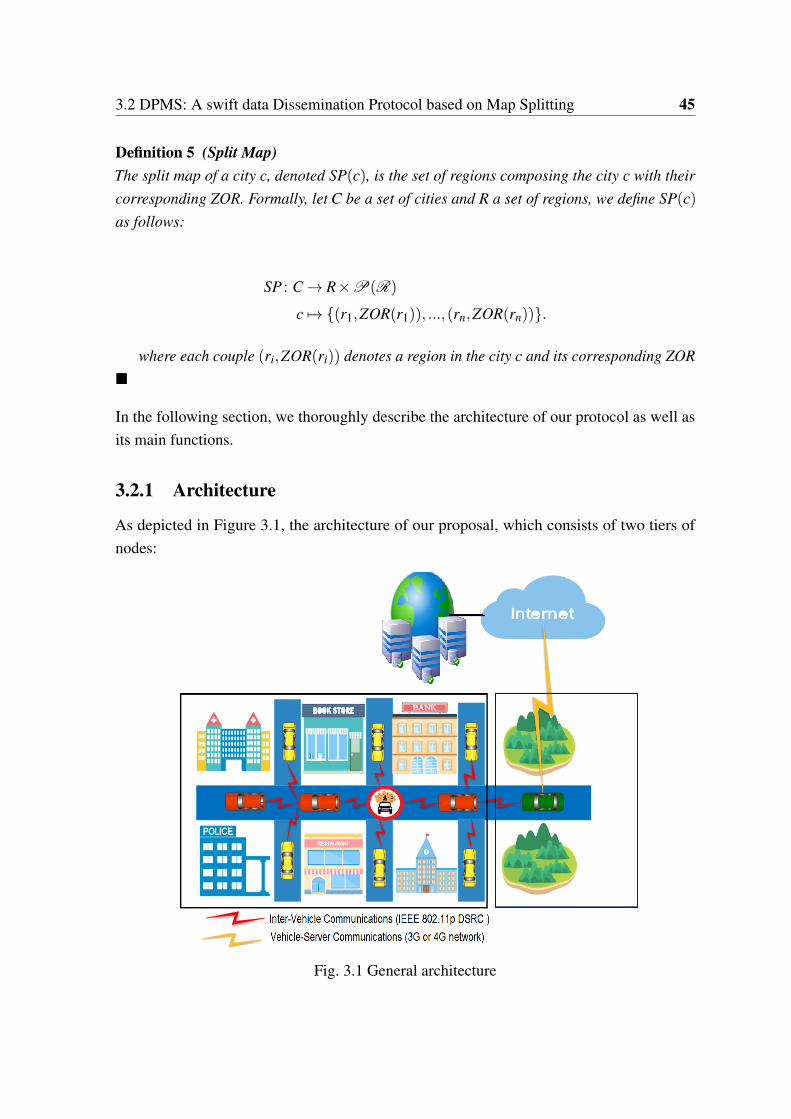
As depicted in Figure 3.1, the architecture of our proposal, which consists of two tiers ofnodes:
Fig. 3.1 General architecture
46 Proposed data dissemination protocol for VANET
• Server: It offers a storage and processing services. Indeed, its main function is to splitthe map of a given city c into a set of regions R, and then to compute the ZOR of eachregion. The result of map splitting and ZOR computation (i.e., the split map of the cityc, SP(c)) is then stored in a shared knowledge base. To do this, the server firstly sendsa query to vehicles driving in the city c to gather their log files (i.e., each file containsthe set of vehicle trajectories, where each trajectory is a set of roads crossed by thevehicle). Thereafter, it runs a dedicated algorithm (as described in subsection 3.2.2)to compute the ZOR of each region in the city based on the collected trajectories. Inthis study, we assume that updating the map is done every T period (defined manually)from scratch. Of course, this can be done in a more sophisticated way to improve thequality of the ZORs. However, we would like to leave this interesting problem to adedicated study.
• Vehicle: It disseminates events using our DPMS protocol (as described in subsection3.2.3). In DPMS, the data dissemination process is done only through V2V commu-nications using IEEE 802.11p DSRC technology [24]. However, DPMS requires thesplit map SP(c), shared by the server, of the city c in which the vehicle is moving.Hence, to avoid vehicle/server communications during the event dissemination time,the vehicle downloads the split map SP(c), via cellular network technology (such as3G or 4G) whenever it enters in an unvisited city (e.g., the green car in Figure 3.1). Inour study, we assume that vehicles are able to determine their respective positions onthe road using a Global Positioning System.
3.2.2 Map Splitting and ZOR computation approach
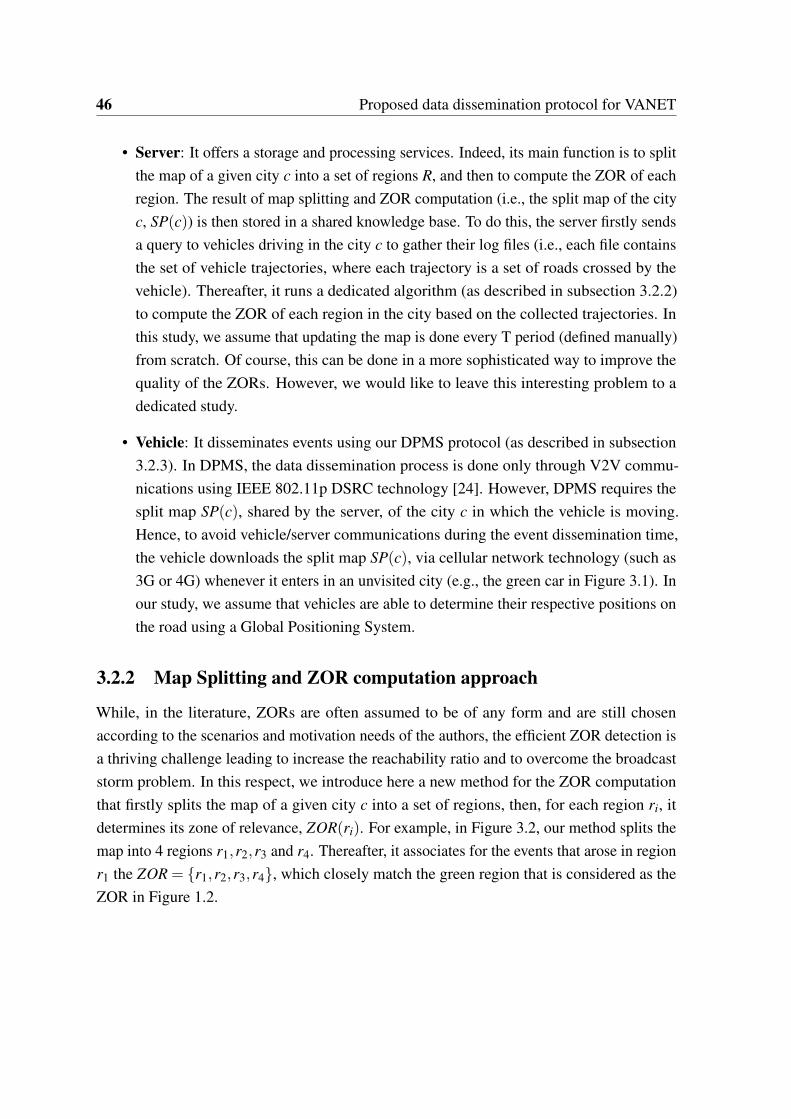
While, in the literature, ZORs are often assumed to be of any form and are still chosenaccording to the scenarios and motivation needs of the authors, the efficient ZOR detection isa thriving challenge leading to increase the reachability ratio and to overcome the broadcaststorm problem. In this respect, we introduce here a new method for the ZOR computationthat firstly splits the map of a given city c into a set of regions, then, for each region ri, itdetermines its zone of relevance, ZOR(ri). For example, in Figure 3.2, our method splits themap into 4 regions r1,r2,r3 and r4. Thereafter, it associates for the events that arose in regionr1 the ZOR = {r1,r2,r3,r4}, which closely match the green region that is considered as theZOR in Figure 1.2.
3.2 DPMS: A swift data Dissemination Protocol based on Map Splitting 47
Fig. 3.2 Map Splitting and ZOR detection
To compute the ZOR, our method exploits the links between vehicles’ trajectories andregions. To do so, we rely on the Formal Concept Analysis (FCA) [10], which is a method ofextracting interesting clusters from relational data. The method is based on a formalizationof a philosophical view of conceptual knowledge. The basic notion in the FCA is a formalconcept which consists of two sets: extent – a set of all objects sharing the same attributes,and intent – a set of all the shared attributes. The basic input data for the FCA is a table, calleda formal context, in which the rows represent objects and the columns represent attributes.The entries of the table contain ’yes/no’ information saying whether the correspondingobjects has the corresponding attributes or not. One of the main outputs of the FCA is aconcept lattice – a hierarchy of formal concepts present in the formal context. The extentsand intents of formal concepts are formed by a particular pair of operators induced by theformal context.
In the following, we recall some basic definitions related to FCA, which is a branch ofapplied applied mathematics. Based on a mathematization of concept and concept hierarchy,it activates mathematical methods for conceptual data analysis and knowledge processing .
Key notions
Definition 6 (FORMAL CONTEXT)A formal context is a triplet K = (V , R, I ), where V represents a finite set of vehicles’
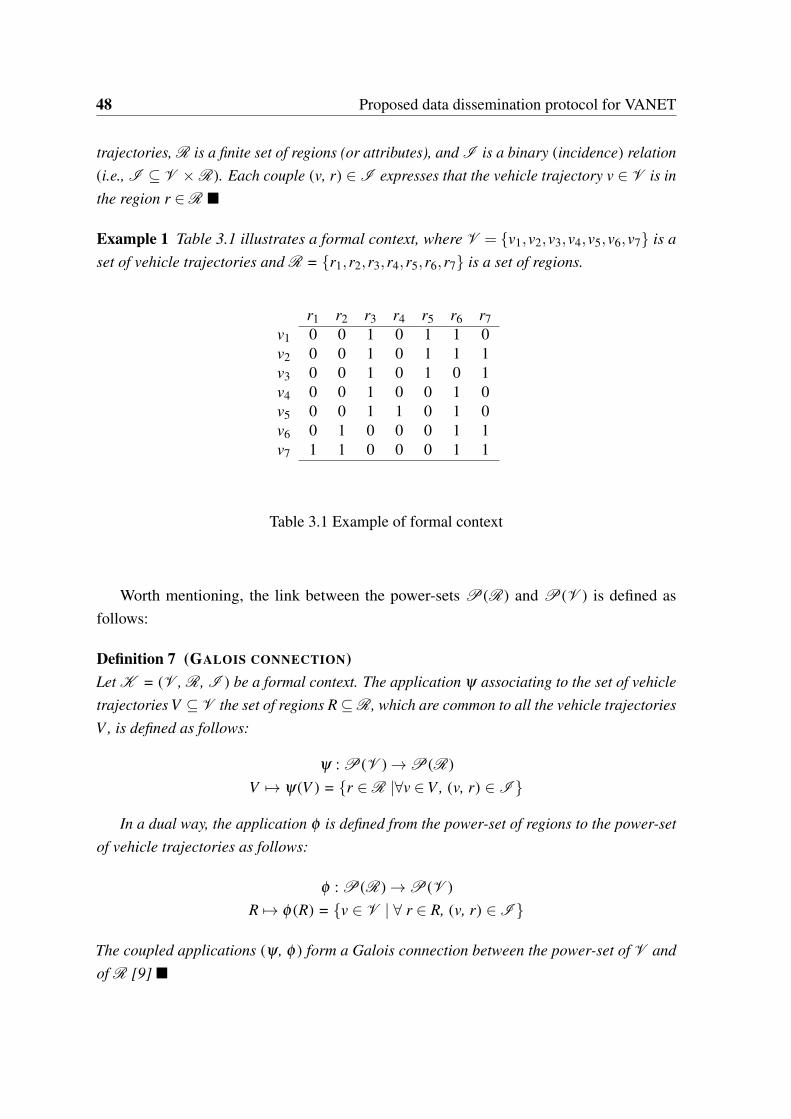
48 Proposed data dissemination protocol for VANET
trajectories, R is a finite set of regions (or attributes), and I is a binary (incidence) relation(i.e., I ⊆ V ×R). Each couple (v, r) ∈I expresses that the vehicle trajectory v ∈ V is inthe region r ∈R �
Example 1 Table 3.1 illustrates a formal context, where V = {v1,v2,v3,v4,v5,v6,v7} is aset of vehicle trajectories and R = {r1,r2,r3,r4,r5,r6,r7} is a set of regions.
r1 r2 r3 r4 r5 r6 r7v1 0 0 1 0 1 1 0v2 0 0 1 0 1 1 1v3 0 0 1 0 1 0 1v4 0 0 1 0 0 1 0v5 0 0 1 1 0 1 0v6 0 1 0 0 0 1 1v7 1 1 0 0 0 1 1
Table 3.1 Example of formal context
Worth mentioning, the link between the power-sets P (R) and P (V ) is defined asfollows:
Definition 7 (GALOIS CONNECTION)Let K = (V , R, I ) be a formal context. The application ψ associating to the set of vehicletrajectories V ⊆ V the set of regions R⊆R, which are common to all the vehicle trajectoriesV , is defined as follows:
ψ : P (V )→P (R)V 7→ ψ (V ) = {r ∈R |∀v ∈V , (v, r) ∈ I }
In a dual way, the application φ is defined from the power-set of regions to the power-setof vehicle trajectories as follows:
φ : P (R)→P (V )R 7→ φ (R) = {v ∈ V | ∀ r ∈ R, (v, r) ∈I }
The coupled applications (ψ , φ ) form a Galois connection between the power-set of V andof R [9] �
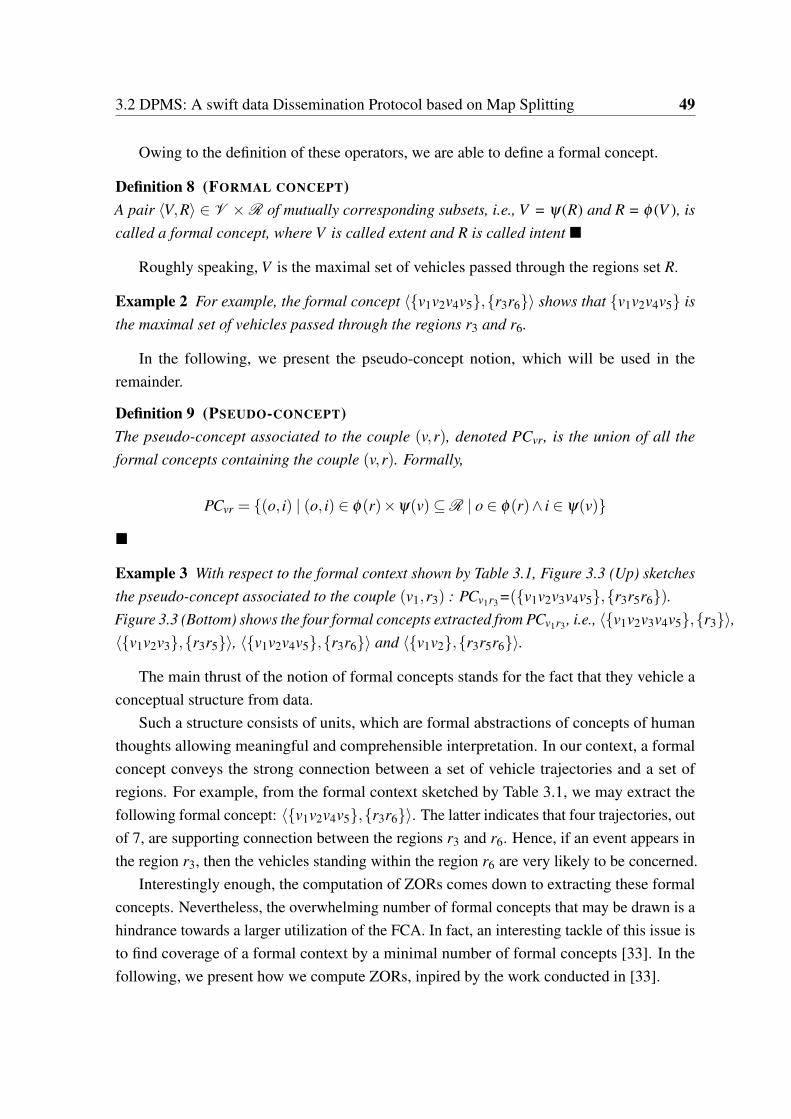
3.2 DPMS: A swift data Dissemination Protocol based on Map Splitting 49
Owing to the definition of these operators, we are able to define a formal concept.
Definition 8 (FORMAL CONCEPT)A pair ⟨V,R⟩ ∈ V ×R of mutually corresponding subsets, i.e., V = ψ (R) and R = φ (V ), iscalled a formal concept, where V is called extent and R is called intent �
Roughly speaking, V is the maximal set of vehicles passed through the regions set R.
Example 2 For example, the formal concept ⟨{v1v2v4v5},{r3r6}⟩ shows that {v1v2v4v5} isthe maximal set of vehicles passed through the regions r3 and r6.
In the following, we present the pseudo-concept notion, which will be used in theremainder.
Definition 9 (PSEUDO-CONCEPT)The pseudo-concept associated to the couple (v,r), denoted PCvr, is the union of all theformal concepts containing the couple (v,r). Formally,
PCvr = {(o, i) | (o, i) ∈ φ(r)×ψ(v)⊆R | o ∈ φ(r)∧ i ∈ ψ(v)}
�
Example 3 With respect to the formal context shown by Table 3.1, Figure 3.3 (Up) sketchesthe pseudo-concept associated to the couple (v1,r3) : PCv1r3=({v1v2v3v4v5},{r3r5r6}).Figure 3.3 (Bottom) shows the four formal concepts extracted from PCv1r3 , i.e., ⟨{v1v2v3v4v5},{r3}⟩,⟨{v1v2v3},{r3r5}⟩, ⟨{v1v2v4v5},{r3r6}⟩ and ⟨{v1v2},{r3r5r6}⟩.
The main thrust of the notion of formal concepts stands for the fact that they vehicle aconceptual structure from data.
Such a structure consists of units, which are formal abstractions of concepts of humanthoughts allowing meaningful and comprehensible interpretation. In our context, a formalconcept conveys the strong connection between a set of vehicle trajectories and a set ofregions. For example, from the formal context sketched by Table 3.1, we may extract thefollowing formal concept: ⟨{v1v2v4v5},{r3r6}⟩. The latter indicates that four trajectories, outof 7, are supporting connection between the regions r3 and r6. Hence, if an event appears inthe region r3, then the vehicles standing within the region r6 are very likely to be concerned.
Interestingly enough, the computation of ZORs comes down to extracting these formalconcepts. Nevertheless, the overwhelming number of formal concepts that may be drawn is ahindrance towards a larger utilization of the FCA. In fact, an interesting tackle of this issue isto find coverage of a formal context by a minimal number of formal concepts [33]. In thefollowing, we present how we compute ZORs, inpired by the work conducted in [33].
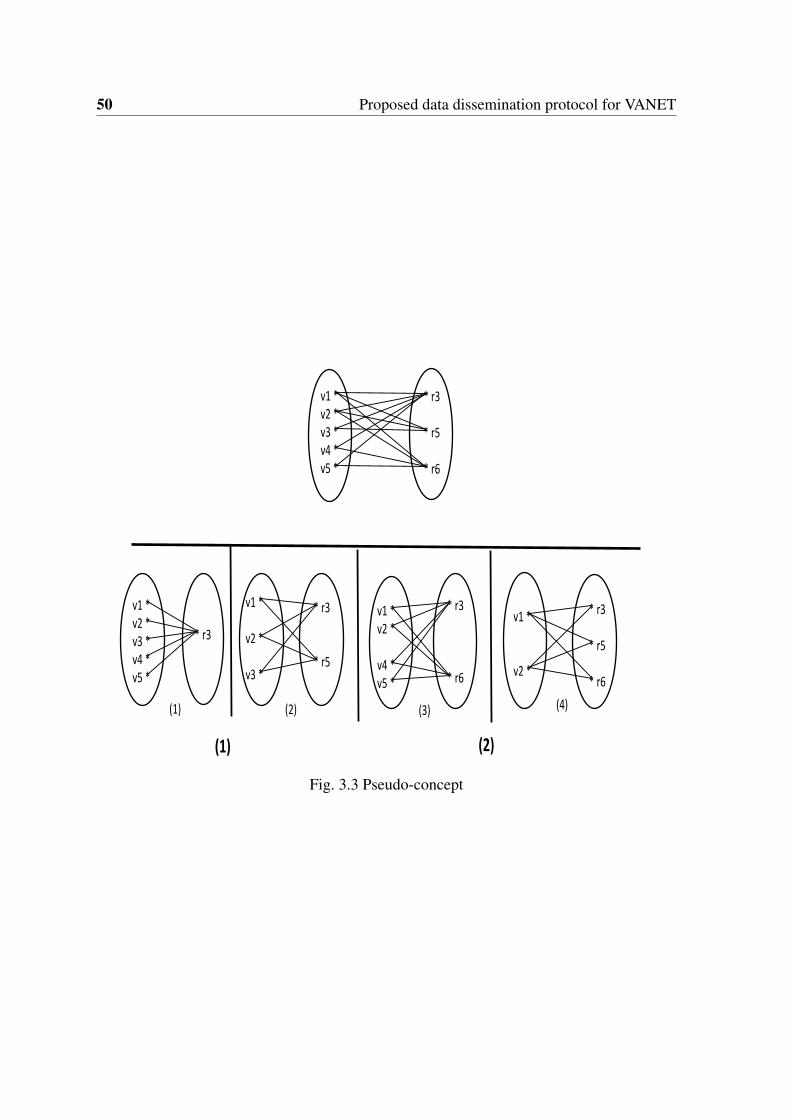
50 Proposed data dissemination protocol for VANET
v1 *v2 *v3 *v4 *v5 *
v1 *
v2 *
* r3
* r6
v1 *v2 *
v4 *v5 *
* r3
* r5
v1 *
v2 *
v3 *
v1 *v2 *v3 *v4 *v5 *
* r3
(2) (3)(1) (4)
* r3
* r5
* r6
* r3
* r5
* r6
(1) (2)
Fig. 3.3 Pseudo-concept
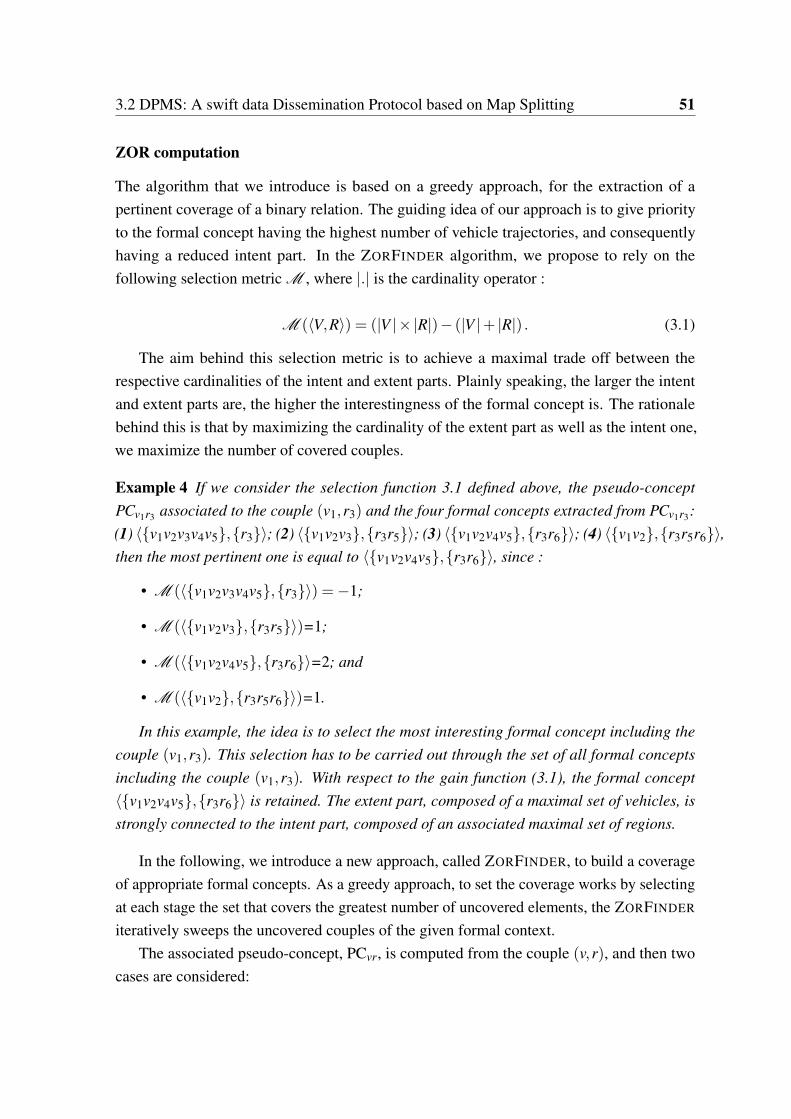
3.2 DPMS: A swift data Dissemination Protocol based on Map Splitting 51
ZOR computation
The algorithm that we introduce is based on a greedy approach, for the extraction of apertinent coverage of a binary relation. The guiding idea of our approach is to give priorityto the formal concept having the highest number of vehicle trajectories, and consequentlyhaving a reduced intent part. In the ZORFINDER algorithm, we propose to rely on thefollowing selection metric M , where |.| is the cardinality operator :
M (⟨V,R⟩) = (|V |× |R|)− (|V |+ |R|) . (3.1)
The aim behind this selection metric is to achieve a maximal trade off between therespective cardinalities of the intent and extent parts. Plainly speaking, the larger the intentand extent parts are, the higher the interestingness of the formal concept is. The rationalebehind this is that by maximizing the cardinality of the extent part as well as the intent one,we maximize the number of covered couples.
Example 4 If we consider the selection function 3.1 defined above, the pseudo-conceptPCv1r3 associated to the couple (v1,r3) and the four formal concepts extracted from PCv1r3:(1) ⟨{v1v2v3v4v5},{r3}⟩; (2) ⟨{v1v2v3},{r3r5}⟩; (3) ⟨{v1v2v4v5},{r3r6}⟩; (4) ⟨{v1v2},{r3r5r6}⟩,then the most pertinent one is equal to ⟨{v1v2v4v5},{r3r6}⟩, since :
• M (⟨{v1v2v3v4v5},{r3}⟩) =−1;
• M (⟨{v1v2v3},{r3r5}⟩)=1;
• M (⟨{v1v2v4v5},{r3r6}⟩=2; and
• M (⟨{v1v2},{r3r5r6}⟩)=1.
In this example, the idea is to select the most interesting formal concept including thecouple (v1,r3). This selection has to be carried out through the set of all formal conceptsincluding the couple (v1,r3). With respect to the gain function (3.1), the formal concept⟨{v1v2v4v5},{r3r6}⟩ is retained. The extent part, composed of a maximal set of vehicles, isstrongly connected to the intent part, composed of an associated maximal set of regions.
In the following, we introduce a new approach, called ZORFINDER, to build a coverageof appropriate formal concepts. As a greedy approach, to set the coverage works by selectingat each stage the set that covers the greatest number of uncovered elements, the ZORFINDER
iteratively sweeps the uncovered couples of the given formal context.The associated pseudo-concept, PCvr, is computed from the couple (v,r), and then two
cases are considered:
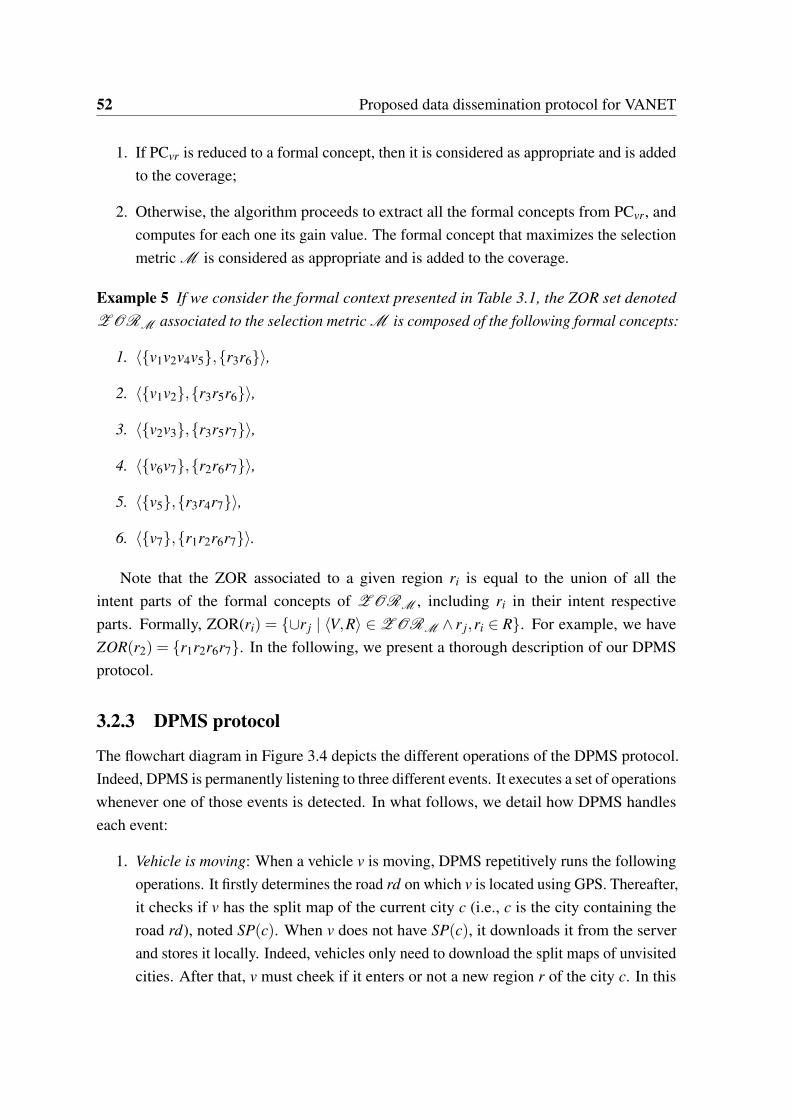
52 Proposed data dissemination protocol for VANET
1. If PCvr is reduced to a formal concept, then it is considered as appropriate and is addedto the coverage;
2. Otherwise, the algorithm proceeds to extract all the formal concepts from PCvr, andcomputes for each one its gain value. The formal concept that maximizes the selectionmetric M is considered as appropriate and is added to the coverage.
Example 5 If we consider the formal context presented in Table 3.1, the ZOR set denotedZ ORM associated to the selection metric M is composed of the following formal concepts:
1. ⟨{v1v2v4v5},{r3r6}⟩,
2. ⟨{v1v2},{r3r5r6}⟩,
3. ⟨{v2v3},{r3r5r7}⟩,
4. ⟨{v6v7},{r2r6r7}⟩,
5. ⟨{v5},{r3r4r7}⟩,
6. ⟨{v7},{r1r2r6r7}⟩.
Note that the ZOR associated to a given region ri is equal to the union of all theintent parts of the formal concepts of Z ORM , including ri in their intent respectiveparts. Formally, ZOR(ri) = {∪r j | ⟨V,R⟩ ∈ Z ORM ∧ r j,ri ∈ R}. For example, we haveZOR(r2) = {r1r2r6r7}. In the following, we present a thorough description of our DPMSprotocol.
3.2.3 DPMS protocol
The flowchart diagram in Figure 3.4 depicts the different operations of the DPMS protocol.Indeed, DPMS is permanently listening to three different events. It executes a set of operationswhenever one of those events is detected. In what follows, we detail how DPMS handleseach event:
1. Vehicle is moving: When a vehicle v is moving, DPMS repetitively runs the followingoperations. It firstly determines the road rd on which v is located using GPS. Thereafter,it checks if v has the split map of the current city c (i.e., c is the city containing theroad rd), noted SP(c). When v does not have SP(c), it downloads it from the serverand stores it locally. Indeed, vehicles only need to download the split maps of unvisitedcities. After that, v must cheek if it enters or not a new region r of the city c. In this
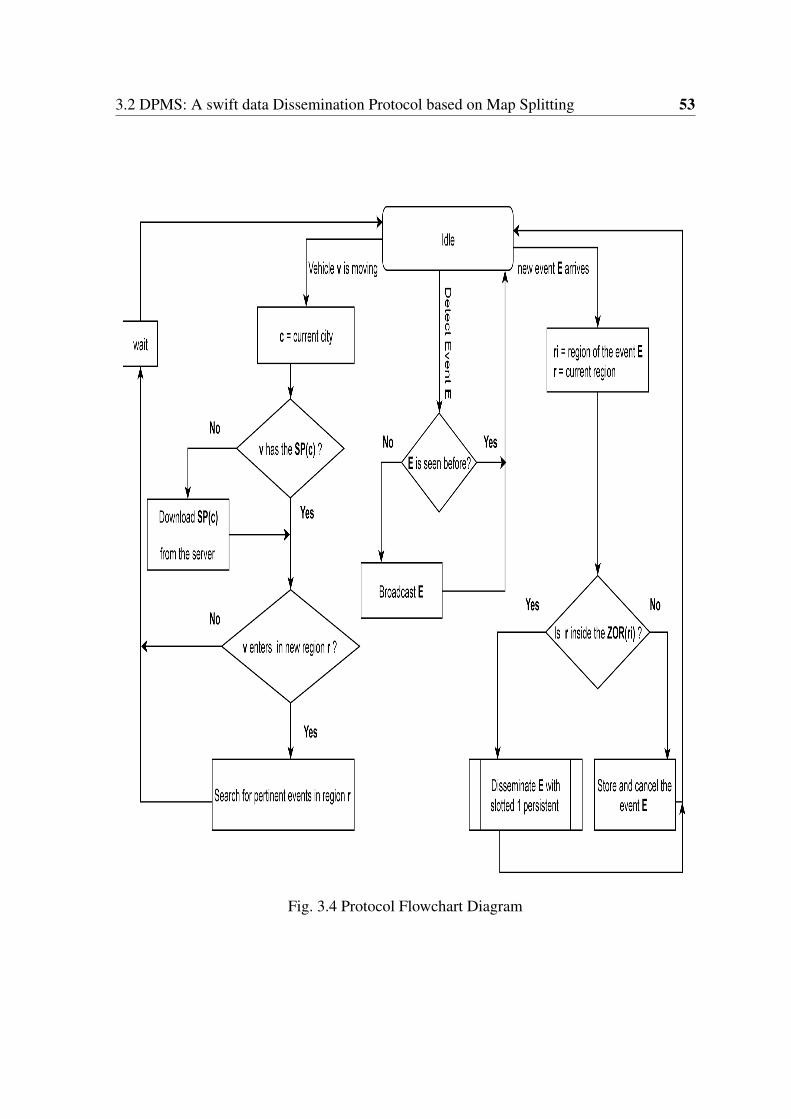
3.2 DPMS: A swift data Dissemination Protocol based on Map Splitting 53
Fig. 3.4 Protocol Flowchart Diagram
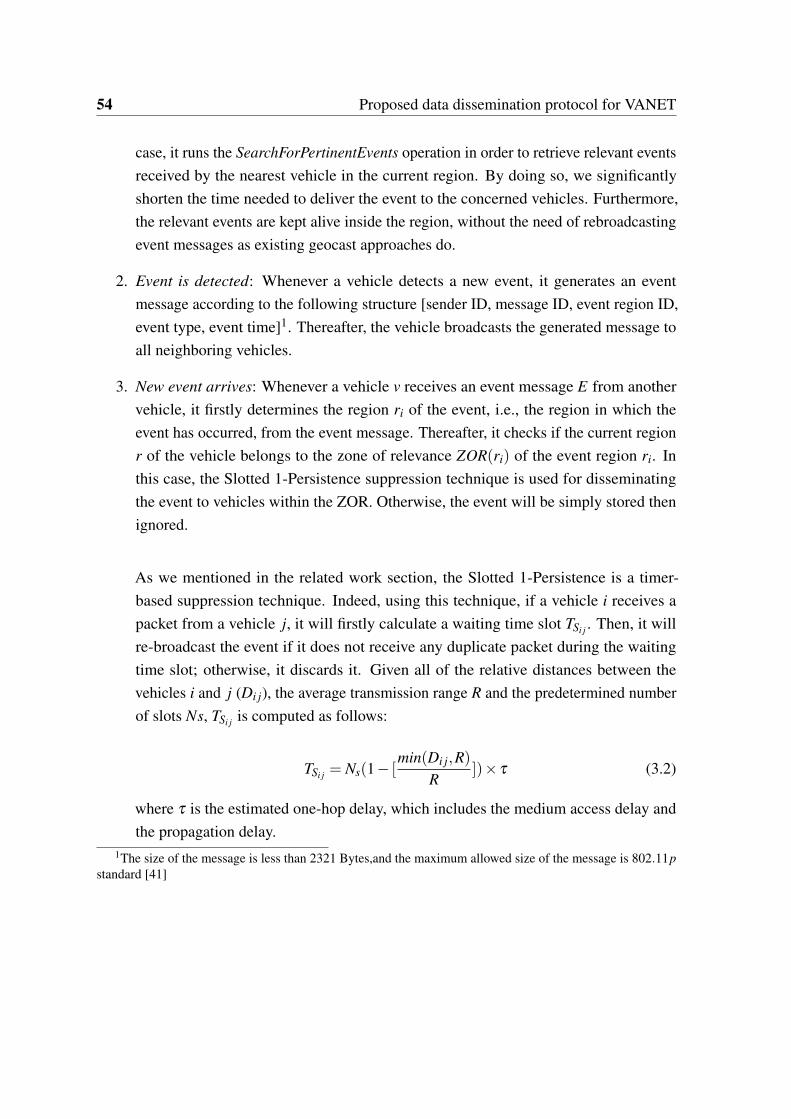
54 Proposed data dissemination protocol for VANET
case, it runs the SearchForPertinentEvents operation in order to retrieve relevant eventsreceived by the nearest vehicle in the current region. By doing so, we significantlyshorten the time needed to deliver the event to the concerned vehicles. Furthermore,the relevant events are kept alive inside the region, without the need of rebroadcastingevent messages as existing geocast approaches do.
2. Event is detected: Whenever a vehicle detects a new event, it generates an eventmessage according to the following structure [sender ID, message ID, event region ID,event type, event time]1. Thereafter, the vehicle broadcasts the generated message toall neighboring vehicles.
3. New event arrives: Whenever a vehicle v receives an event message E from anothervehicle, it firstly determines the region ri of the event, i.e., the region in which theevent has occurred, from the event message. Thereafter, it checks if the current regionr of the vehicle belongs to the zone of relevance ZOR(ri) of the event region ri. Inthis case, the Slotted 1-Persistence suppression technique is used for disseminatingthe event to vehicles within the ZOR. Otherwise, the event will be simply stored thenignored.
As we mentioned in the related work section, the Slotted 1-Persistence is a timer-based suppression technique. Indeed, using this technique, if a vehicle i receives apacket from a vehicle j, it will firstly calculate a waiting time slot TSi j . Then, it willre-broadcast the event if it does not receive any duplicate packet during the waitingtime slot; otherwise, it discards it. Given all of the relative distances between thevehicles i and j (Di j), the average transmission range R and the predetermined numberof slots Ns, TSi j is computed as follows:
TSi j = Ns(1− [min(Di j,R)
R])× τ (3.2)
where τ is the estimated one-hop delay, which includes the medium access delay andthe propagation delay.
1The size of the message is less than 2321 Bytes,and the maximum allowed size of the message is 802.11pstandard [41]
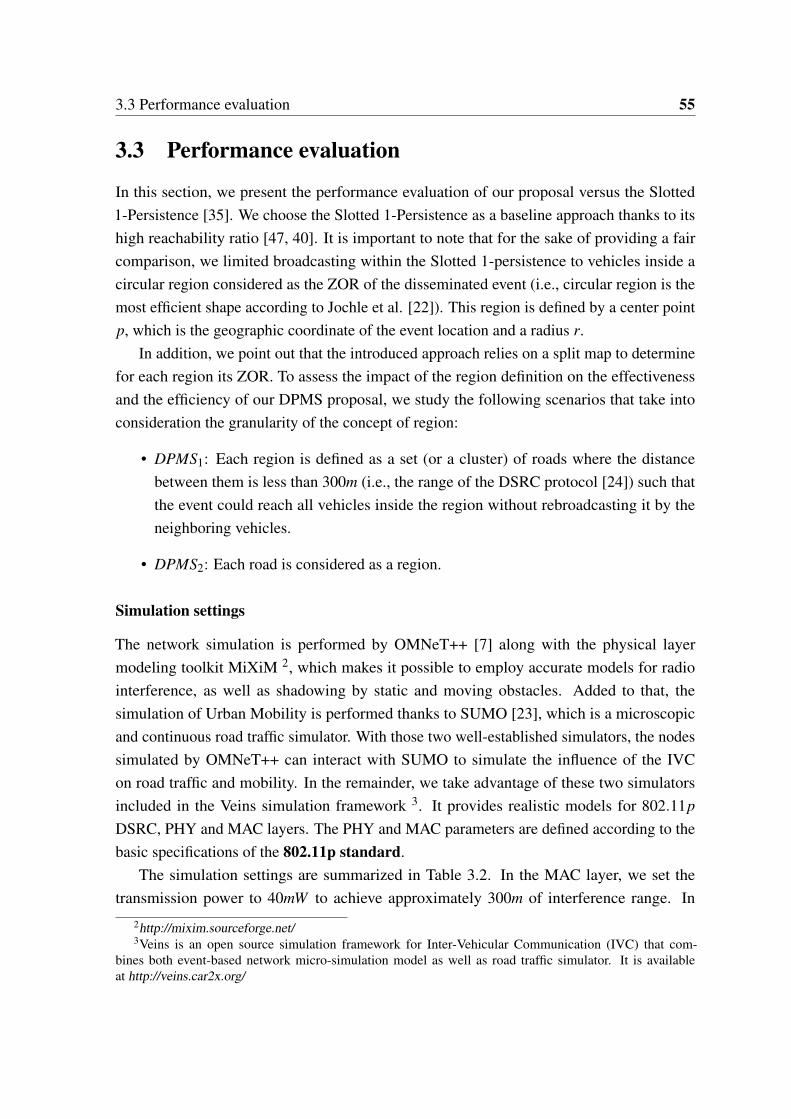
3.3 Performance evaluation 55
3.3 Performance evaluation
In this section, we present the performance evaluation of our proposal versus the Slotted1-Persistence [35]. We choose the Slotted 1-Persistence as a baseline approach thanks to itshigh reachability ratio [47, 40]. It is important to note that for the sake of providing a faircomparison, we limited broadcasting within the Slotted 1-persistence to vehicles inside acircular region considered as the ZOR of the disseminated event (i.e., circular region is themost efficient shape according to Jochle et al. [22]). This region is defined by a center pointp, which is the geographic coordinate of the event location and a radius r.
In addition, we point out that the introduced approach relies on a split map to determinefor each region its ZOR. To assess the impact of the region definition on the effectivenessand the efficiency of our DPMS proposal, we study the following scenarios that take intoconsideration the granularity of the concept of region:
• DPMS1: Each region is defined as a set (or a cluster) of roads where the distancebetween them is less than 300m (i.e., the range of the DSRC protocol [24]) such thatthe event could reach all vehicles inside the region without rebroadcasting it by theneighboring vehicles.
• DPMS2: Each road is considered as a region.
Simulation settings
The network simulation is performed by OMNeT++ [7] along with the physical layermodeling toolkit MiXiM 2, which makes it possible to employ accurate models for radiointerference, as well as shadowing by static and moving obstacles. Added to that, thesimulation of Urban Mobility is performed thanks to SUMO [23], which is a microscopicand continuous road traffic simulator. With those two well-established simulators, the nodessimulated by OMNeT++ can interact with SUMO to simulate the influence of the IVCon road traffic and mobility. In the remainder, we take advantage of these two simulatorsincluded in the Veins simulation framework 3. It provides realistic models for 802.11pDSRC, PHY and MAC layers. The PHY and MAC parameters are defined according to thebasic specifications of the 802.11p standard.
The simulation settings are summarized in Table 3.2. In the MAC layer, we set thetransmission power to 40mW to achieve approximately 300m of interference range. In
2http://mixim.sourceforge.net/3Veins is an open source simulation framework for Inter-Vehicular Communication (IVC) that com-
bines both event-based network micro-simulation model as well as road traffic simulator. It is availableat http://veins.car2x.org/
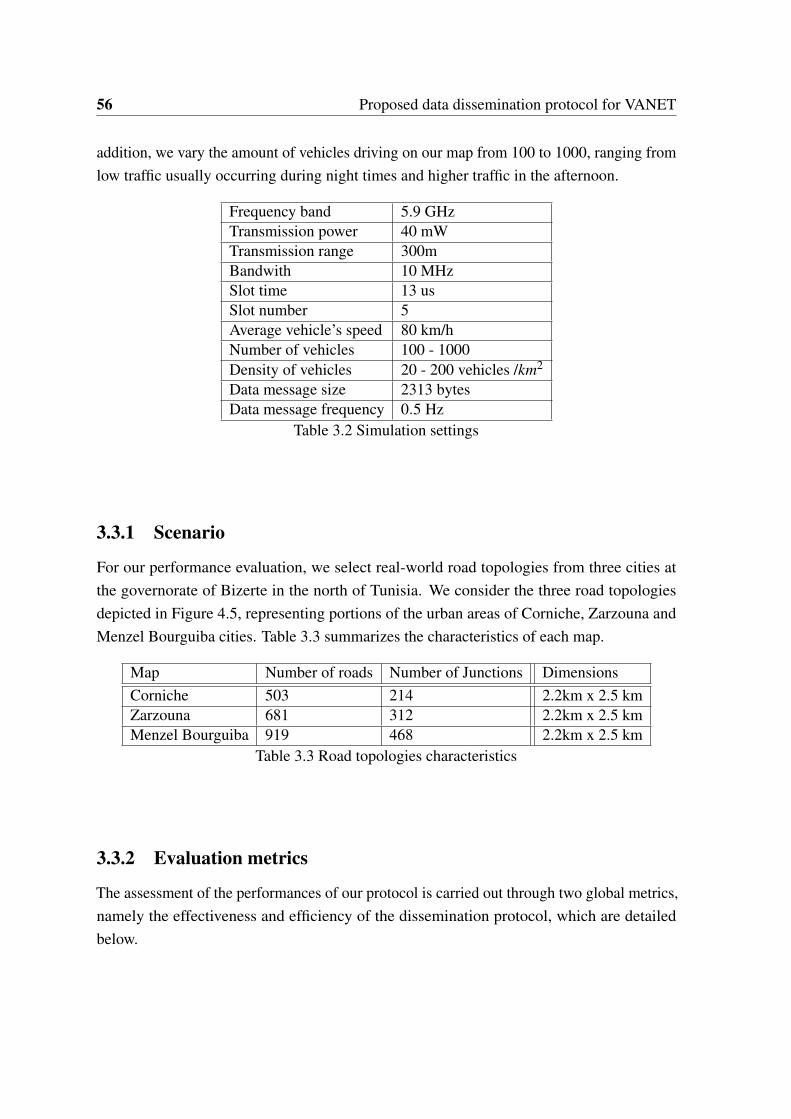
56 Proposed data dissemination protocol for VANET
addition, we vary the amount of vehicles driving on our map from 100 to 1000, ranging fromlow traffic usually occurring during night times and higher traffic in the afternoon.
Frequency band 5.9 GHzTransmission power 40 mWTransmission range 300mBandwith 10 MHzSlot time 13 usSlot number 5Average vehicle’s speed 80 km/hNumber of vehicles 100 - 1000Density of vehicles 20 - 200 vehicles /km2
Data message size 2313 bytesData message frequency 0.5 Hz
Table 3.2 Simulation settings
3.3.1 Scenario
For our performance evaluation, we select real-world road topologies from three cities atthe governorate of Bizerte in the north of Tunisia. We consider the three road topologiesdepicted in Figure 4.5, representing portions of the urban areas of Corniche, Zarzouna andMenzel Bourguiba cities. Table 3.3 summarizes the characteristics of each map.
Map Number of roads Number of Junctions DimensionsCorniche 503 214 2.2km x 2.5 kmZarzouna 681 312 2.2km x 2.5 kmMenzel Bourguiba 919 468 2.2km x 2.5 km
Table 3.3 Road topologies characteristics
3.3.2 Evaluation metrics
The assessment of the performances of our protocol is carried out through two global metrics,namely the effectiveness and efficiency of the dissemination protocol, which are detailedbelow.
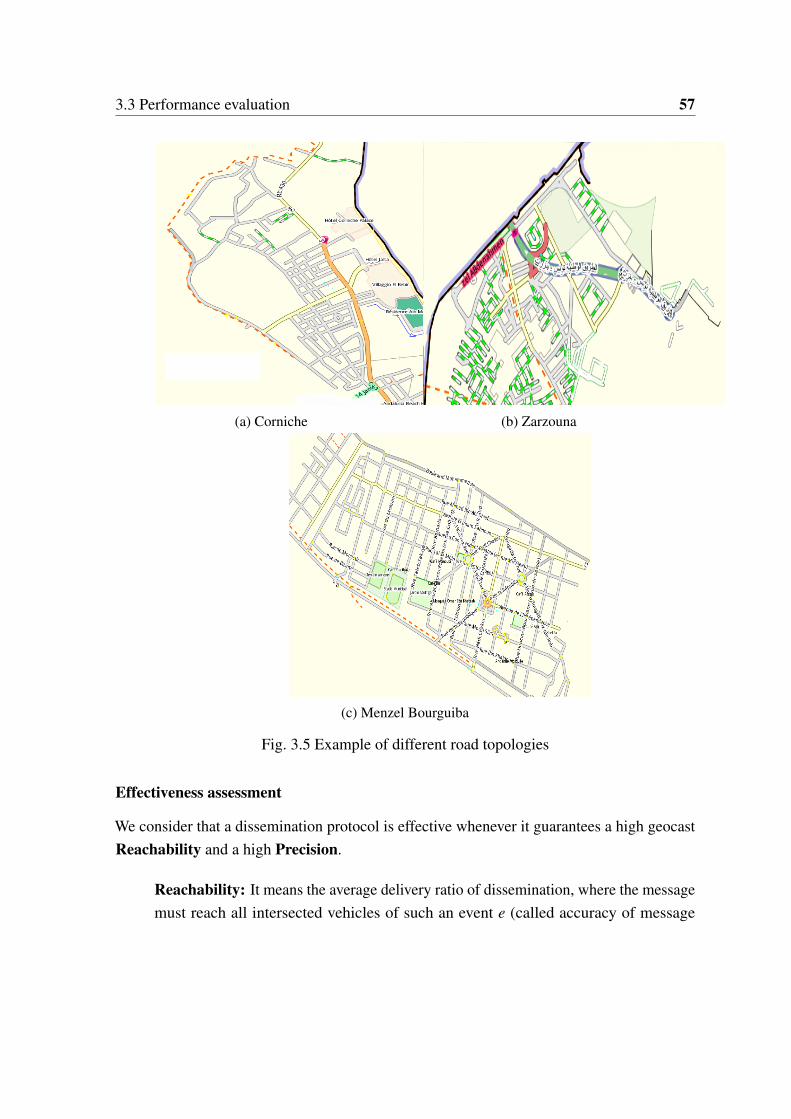
3.3 Performance evaluation 57
(a) Corniche (b) Zarzouna
(c) Menzel Bourguiba
Fig. 3.5 Example of different road topologies
Effectiveness assessment
We consider that a dissemination protocol is effective whenever it guarantees a high geocastReachability and a high Precision.
Reachability: It means the average delivery ratio of dissemination, where the messagemust reach all intersected vehicles of such an event e (called accuracy of message
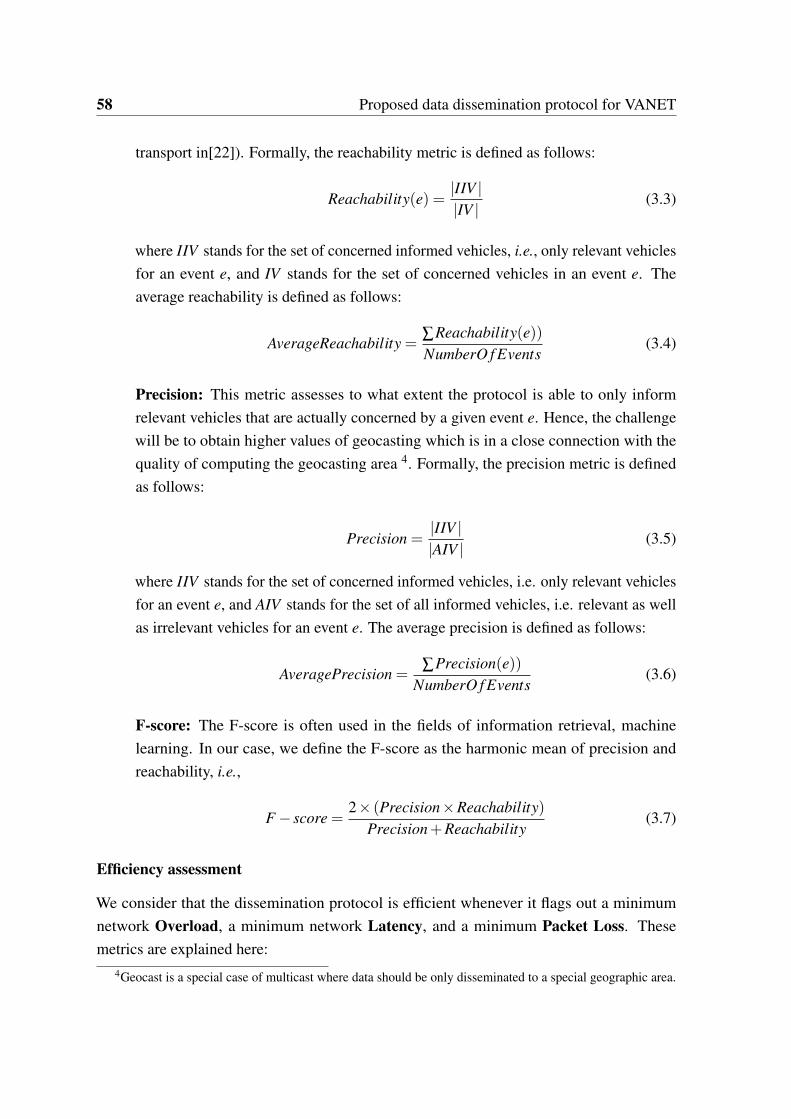
58 Proposed data dissemination protocol for VANET
transport in[22]). Formally, the reachability metric is defined as follows:
Reachability(e) =|IIV ||IV |
(3.3)
where IIV stands for the set of concerned informed vehicles, i.e., only relevant vehiclesfor an event e, and IV stands for the set of concerned vehicles in an event e. Theaverage reachability is defined as follows:
AverageReachability =∑Reachability(e))NumberO f Events
(3.4)
Precision: This metric assesses to what extent the protocol is able to only informrelevant vehicles that are actually concerned by a given event e. Hence, the challengewill be to obtain higher values of geocasting which is in a close connection with thequality of computing the geocasting area 4. Formally, the precision metric is definedas follows:
Precision =|IIV ||AIV |
(3.5)
where IIV stands for the set of concerned informed vehicles, i.e. only relevant vehiclesfor an event e, and AIV stands for the set of all informed vehicles, i.e. relevant as wellas irrelevant vehicles for an event e. The average precision is defined as follows:
AveragePrecision =∑Precision(e))
NumberO f Events(3.6)
F-score: The F-score is often used in the fields of information retrieval, machinelearning. In our case, we define the F-score as the harmonic mean of precision andreachability, i.e.,
F− score =2× (Precision×Reachability)
Precision+Reachability(3.7)
Efficiency assessment
We consider that the dissemination protocol is efficient whenever it flags out a minimumnetwork Overload, a minimum network Latency, and a minimum Packet Loss. Thesemetrics are explained here:
4Geocast is a special case of multicast where data should be only disseminated to a special geographic area.

3.3 Performance evaluation 59
Overload: The overload metric stands for the total number of sent packets. Interest-ingly enough, the ultimate goal of any dissemination protocol is to avoid the overloadproblem [47] by looking for minimizing the number of message transmissions in thenetwork.
Latency: it refers to the amount of time which is needed to deliver a message to aninterested vehicle. The average latency, AL, is defined as follows:
AL =∑(ti−T )
NumberO f InterestedVehicles(3.8)
where ti stands for the arrival time of the event message to a vehicle i and T is the timestamp of the occurrence of the event.
Packet Loss: It refers to the number of lost packets versus that of sent packets.
3.3.3 Results
Effectiveness and Efficiency of Slotted 1-persistence under different values of ZORradius
In order to define the best ZOR radius of the baseline protocol, we compute its reachabilityand overload according to different values of the ZOR radius.
Figure 3.6, with the map of Menzel Burguiba city, depicts that the reachability and theoverload of Slotted 1-persistence grow as far as the radius of the ZOR increases. Indeed,we observe that within a radius of 1400m the reachability becomes stable (around 0.99).However, the overload sharply rises as long as the ZOR radius values go up. Consequently,we can deduce that within this value of the ZOR radius, Slotted 1-persistence achieves amaximal trade-off between effectiveness and efficiency. Hence, in the remainder, we setthe ZOR radius of Slotted 1-persistence to 1400m and we compared its effectiveness andefficiency against our protocol.
Effectiveness of dissemination protocol
Figures 3.7-3.9 show the evolution of the reachability, the precision, and the F-score underdifferent traffic densities (i.e., number of vehicles in the network) within different roadtopologies (i.e., maps of Corniche, Zarzouna and Menzel Bourguiba cities). As expected,
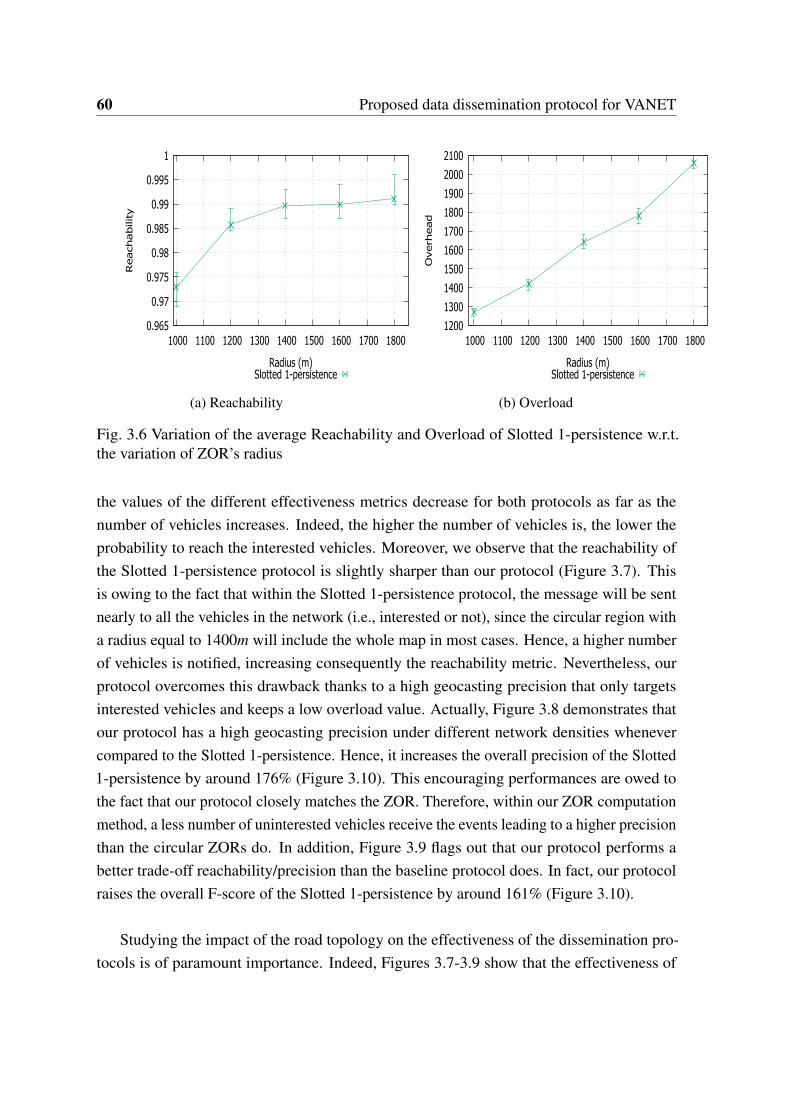
60 Proposed data dissemination protocol for VANET
0.965
0.97
0.975
0.98
0.985
0.99
0.995
1
1000 1100 1200 1300 1400 1500 1600 1700 1800
Reachability
Radius (m) Slotted 1-persistence
(a) Reachability
1200
1300
1400
1500
1600
1700
1800
1900
2000
2100
1000 1100 1200 1300 1400 1500 1600 1700 1800
Overh
ead
Radius (m) Slotted 1-persistence
(b) Overload
Fig. 3.6 Variation of the average Reachability and Overload of Slotted 1-persistence w.r.t.the variation of ZOR’s radius
the values of the different effectiveness metrics decrease for both protocols as far as thenumber of vehicles increases. Indeed, the higher the number of vehicles is, the lower theprobability to reach the interested vehicles. Moreover, we observe that the reachability ofthe Slotted 1-persistence protocol is slightly sharper than our protocol (Figure 3.7). Thisis owing to the fact that within the Slotted 1-persistence protocol, the message will be sentnearly to all the vehicles in the network (i.e., interested or not), since the circular region witha radius equal to 1400m will include the whole map in most cases. Hence, a higher numberof vehicles is notified, increasing consequently the reachability metric. Nevertheless, ourprotocol overcomes this drawback thanks to a high geocasting precision that only targetsinterested vehicles and keeps a low overload value. Actually, Figure 3.8 demonstrates thatour protocol has a high geocasting precision under different network densities whenevercompared to the Slotted 1-persistence. Hence, it increases the overall precision of the Slotted1-persistence by around 176% (Figure 3.10). This encouraging performances are owed tothe fact that our protocol closely matches the ZOR. Therefore, within our ZOR computationmethod, a less number of uninterested vehicles receive the events leading to a higher precisionthan the circular ZORs do. In addition, Figure 3.9 flags out that our protocol performs abetter trade-off reachability/precision than the baseline protocol does. In fact, our protocolraises the overall F-score of the Slotted 1-persistence by around 161% (Figure 3.10).
Studying the impact of the road topology on the effectiveness of the dissemination pro-tocols is of paramount importance. Indeed, Figures 3.7-3.9 show that the effectiveness of
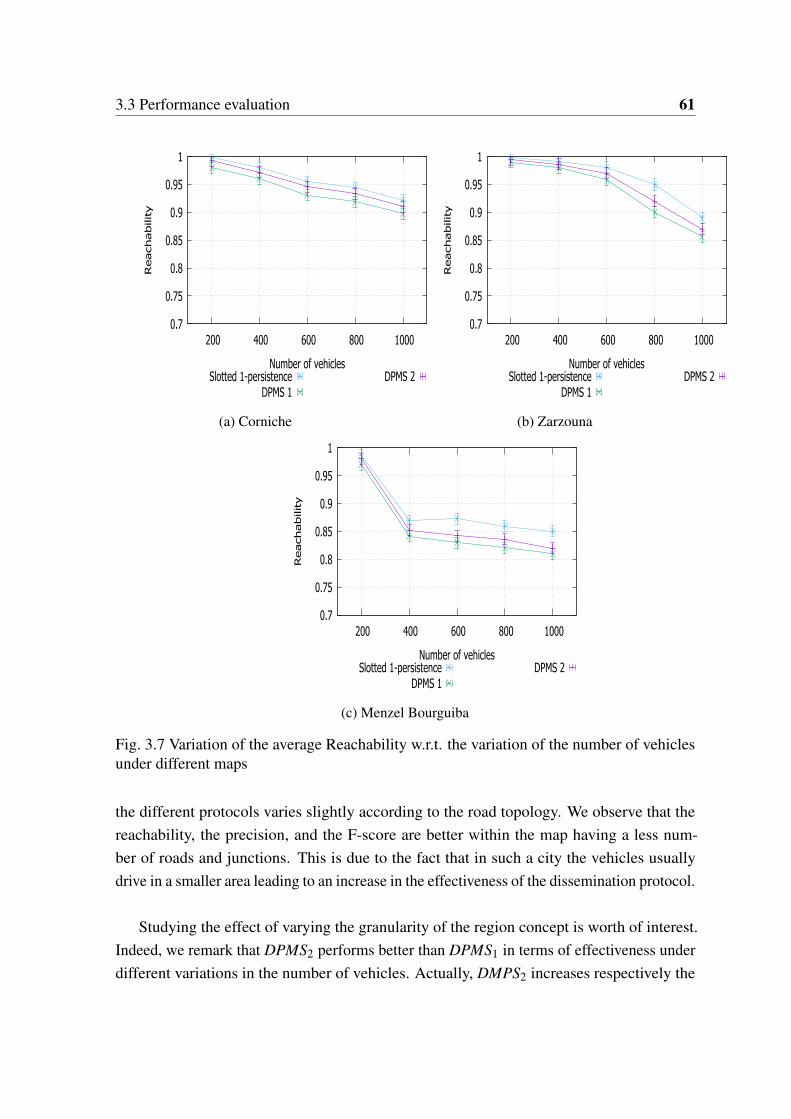
3.3 Performance evaluation 61
0.7
0.75
0.8
0.85
0.9
0.95
1
200 400 600 800 1000
Reachability
Number of vehicles Slotted 1-persistence
DPMS 1 DPMS 2
(a) Corniche
0.7
0.75
0.8
0.85
0.9
0.95
1
200 400 600 800 1000
Reachability
Number of vehicles Slotted 1-persistence
DPMS 1 DPMS 2
(b) Zarzouna
0.7
0.75
0.8
0.85
0.9
0.95
1
200 400 600 800 1000
Reachability
Number of vehicles Slotted 1-persistence
DPMS 1 DPMS 2
(c) Menzel Bourguiba
Fig. 3.7 Variation of the average Reachability w.r.t. the variation of the number of vehiclesunder different maps
the different protocols varies slightly according to the road topology. We observe that thereachability, the precision, and the F-score are better within the map having a less num-ber of roads and junctions. This is due to the fact that in such a city the vehicles usuallydrive in a smaller area leading to an increase in the effectiveness of the dissemination protocol.
Studying the effect of varying the granularity of the region concept is worth of interest.Indeed, we remark that DPMS2 performs better than DPMS1 in terms of effectiveness underdifferent variations in the number of vehicles. Actually, DMPS2 increases respectively the
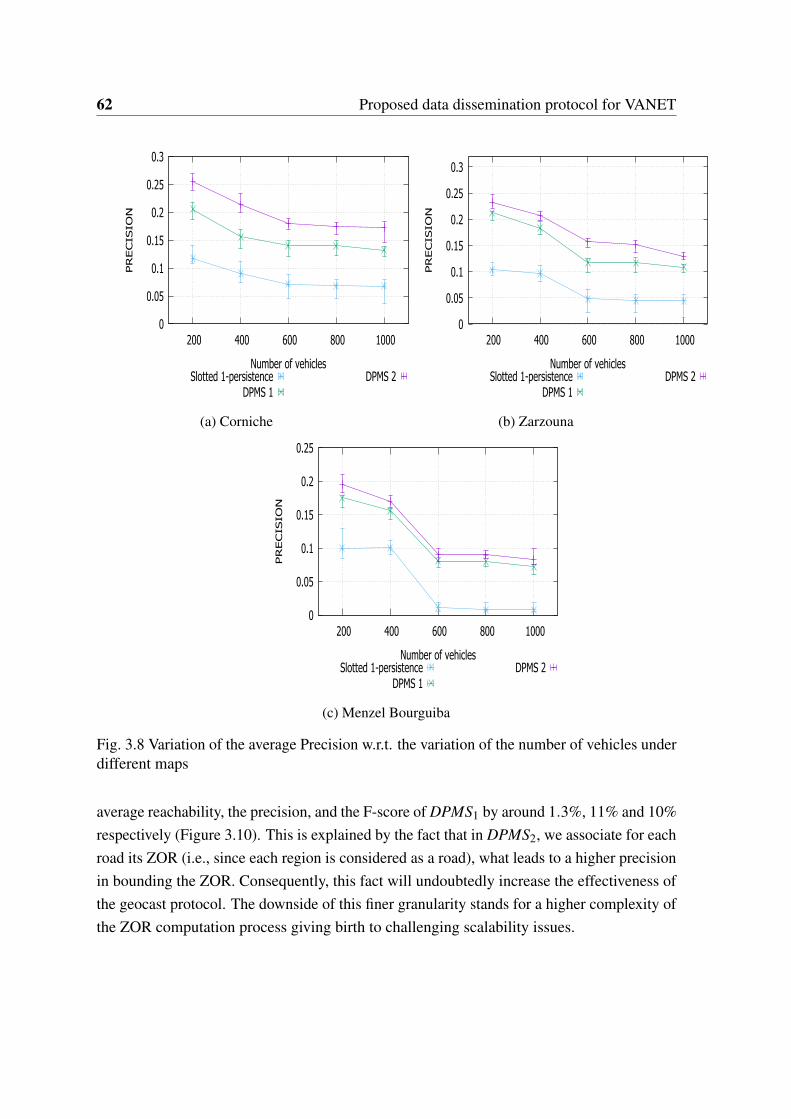
62 Proposed data dissemination protocol for VANET
0
0.05
0.1
0.15
0.2
0.25
0.3
200 400 600 800 1000
PRECIS
ION
Number of vehicles Slotted 1-persistence
DPMS 1 DPMS 2
(a) Corniche
0
0.05
0.1
0.15
0.2
0.25
0.3
200 400 600 800 1000
PRECIS
ION
Number of vehicles Slotted 1-persistence
DPMS 1 DPMS 2
(b) Zarzouna
0
0.05
0.1
0.15
0.2
0.25
200 400 600 800 1000
PRECIS
ION
Number of vehicles Slotted 1-persistence
DPMS 1 DPMS 2
(c) Menzel Bourguiba
Fig. 3.8 Variation of the average Precision w.r.t. the variation of the number of vehicles underdifferent maps
average reachability, the precision, and the F-score of DPMS1 by around 1.3%, 11% and 10%respectively (Figure 3.10). This is explained by the fact that in DPMS2, we associate for eachroad its ZOR (i.e., since each region is considered as a road), what leads to a higher precisionin bounding the ZOR. Consequently, this fact will undoubtedly increase the effectiveness ofthe geocast protocol. The downside of this finer granularity stands for a higher complexity ofthe ZOR computation process giving birth to challenging scalability issues.
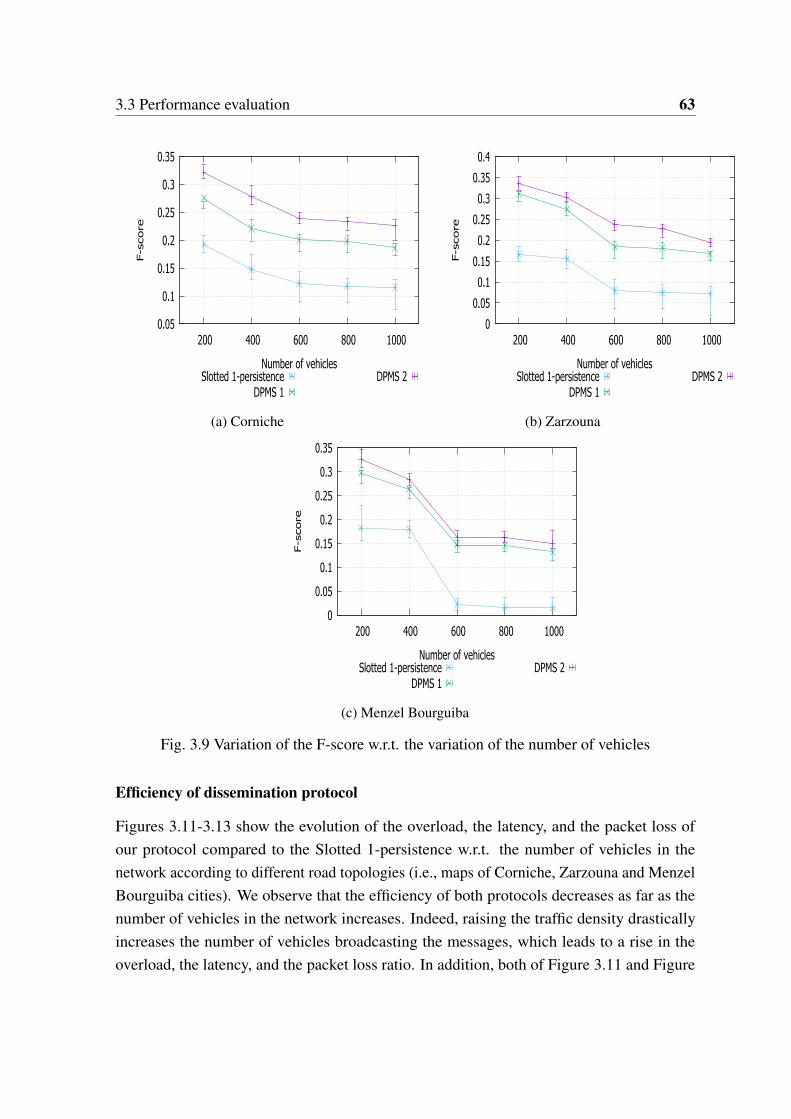
3.3 Performance evaluation 63
0.05
0.1
0.15
0.2
0.25
0.3
0.35
200 400 600 800 1000
F-s
core
Number of vehicles Slotted 1-persistence
DPMS 1 DPMS 2
(a) Corniche
0
0.05
0.1
0.15
0.2
0.25
0.3
0.35
0.4
200 400 600 800 1000
F-s
core
Number of vehicles Slotted 1-persistence
DPMS 1 DPMS 2
(b) Zarzouna
0
0.05
0.1
0.15
0.2
0.25
0.3
0.35
200 400 600 800 1000
F-s
core
Number of vehicles Slotted 1-persistence
DPMS 1 DPMS 2
(c) Menzel Bourguiba
Fig. 3.9 Variation of the F-score w.r.t. the variation of the number of vehicles
Efficiency of dissemination protocol
Figures 3.11-3.13 show the evolution of the overload, the latency, and the packet loss ofour protocol compared to the Slotted 1-persistence w.r.t. the number of vehicles in thenetwork according to different road topologies (i.e., maps of Corniche, Zarzouna and MenzelBourguiba cities). We observe that the efficiency of both protocols decreases as far as thenumber of vehicles in the network increases. Indeed, raising the traffic density drasticallyincreases the number of vehicles broadcasting the messages, which leads to a rise in theoverload, the latency, and the packet loss ratio. In addition, both of Figure 3.11 and Figure
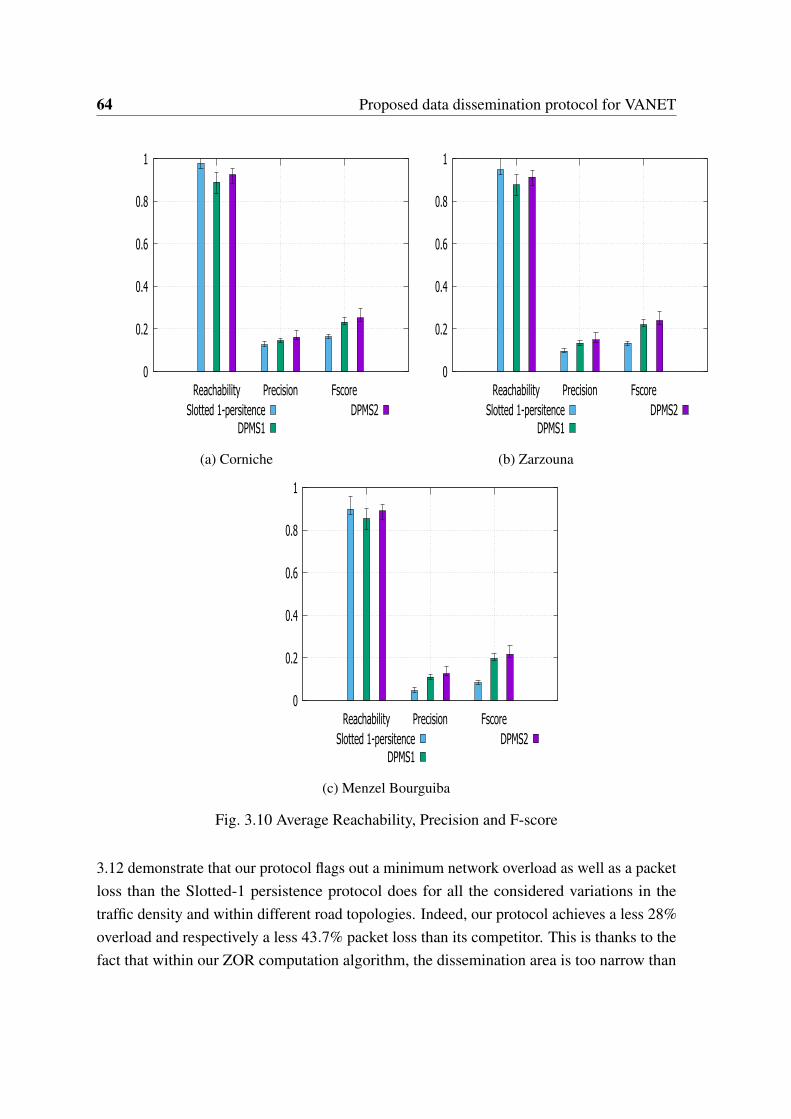
64 Proposed data dissemination protocol for VANET
0
0.2
0.4
0.6
0.8
1
Reachability Precision FscoreSlotted 1-persitence
DPMS1DPMS2
(a) Corniche
0
0.2
0.4
0.6
0.8
1
Reachability Precision FscoreSlotted 1-persitence
DPMS1DPMS2
(b) Zarzouna
0
0.2
0.4
0.6
0.8
1
Reachability Precision FscoreSlotted 1-persitence
DPMS1DPMS2
(c) Menzel Bourguiba
Fig. 3.10 Average Reachability, Precision and F-score
3.12 demonstrate that our protocol flags out a minimum network overload as well as a packetloss than the Slotted-1 persistence protocol does for all the considered variations in thetraffic density and within different road topologies. Indeed, our protocol achieves a less 28%overload and respectively a less 43.7% packet loss than its competitor. This is thanks to thefact that within our ZOR computation algorithm, the dissemination area is too narrow than
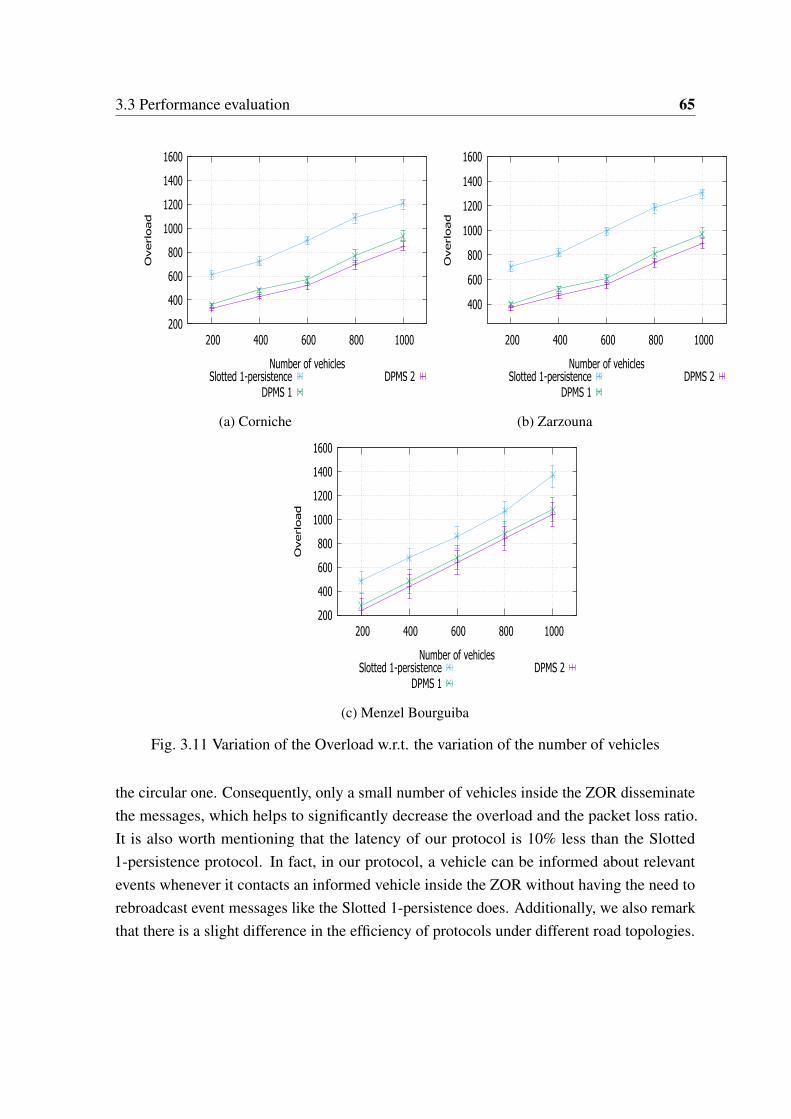
3.3 Performance evaluation 65
200
400
600
800
1000
1200
1400
1600
200 400 600 800 1000
Overload
Number of vehicles Slotted 1-persistence
DPMS 1 DPMS 2
(a) Corniche
400
600
800
1000
1200
1400
1600
200 400 600 800 1000
Overload
Number of vehicles Slotted 1-persistence
DPMS 1 DPMS 2
(b) Zarzouna
200
400
600
800
1000
1200
1400
1600
200 400 600 800 1000
Overload
Number of vehicles Slotted 1-persistence
DPMS 1 DPMS 2
(c) Menzel Bourguiba
Fig. 3.11 Variation of the Overload w.r.t. the variation of the number of vehicles
the circular one. Consequently, only a small number of vehicles inside the ZOR disseminatethe messages, which helps to significantly decrease the overload and the packet loss ratio.It is also worth mentioning that the latency of our protocol is 10% less than the Slotted1-persistence protocol. In fact, in our protocol, a vehicle can be informed about relevantevents whenever it contacts an informed vehicle inside the ZOR without having the need torebroadcast event messages like the Slotted 1-persistence does. Additionally, we also remarkthat there is a slight difference in the efficiency of protocols under different road topologies.

66 Proposed data dissemination protocol for VANET
2.4 2.6 2.8
3 3.2 3.4 3.6 3.8
4 4.2 4.4
200 400 600 800 1000
Packet-
Loss
Number of vehicles Slotted 1-persistence
DPMS 1 DPMS 2
(a) Corniche
2.2 2.4 2.6 2.8
3 3.2 3.4 3.6 3.8
4 4.2 4.4
200 400 600 800 1000
Packet-
Loss
Number of vehicles Slotted 1-persistence
DPMS 1 DPMS 2
(b) Zarzouna
2.4 2.6 2.8
3 3.2 3.4 3.6 3.8
4 4.2
200 400 600 800 1000
Packet-
Loss
Number of vehicles Slotted 1-persistence
DPMS 1 DPMS 2
(c) Menzel Bourguiba
Fig. 3.12 Variation of the Packet loss w.r.t. the variation of the number of vehicles
Finally, Figures 3.11-3.13 depict that by splitting the map into a small region (e.g., a roadconsidered as a region), DPMS2 outperforms DPMS1 in terms of efficiency under differentvehicle densities.

3.4 Conclusion 67
2
2.2
2.4
2.6
2.8
3
3.2
3.4
3.6
200 400 600 800 1000
Late
ncy (S
)
Number of vehicles Slotted 1-persistence
DPMS 1 DPMS 2
(a) Corniche
2.2
2.4
2.6
2.8
3
3.2
3.4
3.6
3.8
200 400 600 800 1000
Late
ncy (S
)
Number of vehicles Slotted 1-persistence
DPMS 1 DPMS 2
(b) Zarzouna
2.2 2.4 2.6 2.8
3 3.2 3.4 3.6 3.8
4 4.2
200 400 600 800 1000
Late
ncy (S
)
Number of vehicles Slotted 1-persistence
DPMS 1 DPMS 2
(c) Menzel Bourguiba
Fig. 3.13 Variation of the average Latency w.r.t. the variation of the number of vehicles
3.4 Conclusion
In this chapter, we have introduced DPMS as a MAP-splitting-based dissemination protocolto disseminate information about VANET safety events. The main thrust of our protocolstands for an adequate targeting of the zone of relevance of the disseminated messages. Doingso has allowed us to meet our goals, namely reaching a high delivery ratio as well as a highgeocast precision. Extensive experimental work has shown that DPMS has obtained veryencouraging results versus those got by pioneering approaches of the literature.

Chapter 4
Proposed data aggregation protocol forVANET
4.1 Introduction
A careful scrutiny of existing data aggregation approaches in the literature highlights that theymainly focus on combining the correlated items but none of them tries to use a suppressiontechnique in order to eliminate the duplicated messages. Moreover, they did not take intoconsideration neither the vehicle directions nor the road speed limitations in the providedtraffic information. To cope with these aforementioned requirements, we introduce herea new aggregation protocol called Smart Directional Data Aggregation (SDDA) that candeal properly with traffic information in both urban and highway conditions. It consistsin properly selecting relevant FCD messages that should be aggregated. To do so, SDDAprovides three filters: (i) The first uses vehicle directions. In fact, each vehicle will aggregateonly data that corresponds to its direction but only store, carry and forward uninterestingdata. (ii) The second is done through road speed limitations, thus, if the average speed of thereceived FCD messages is higher than the maximum allowed speed then it will be ignoredand replaced by the maximum allowed speed value. Doing so, we increase the aggregationaccuracy. (iii) The last is performed is by integrating a suppression technique [48] in order toeliminate the duplicated inputs in the aggregation phase by providing a high accurate timeslot based on the distance and the range that all vehicles should wait before rebroadcastingthe FCD message.
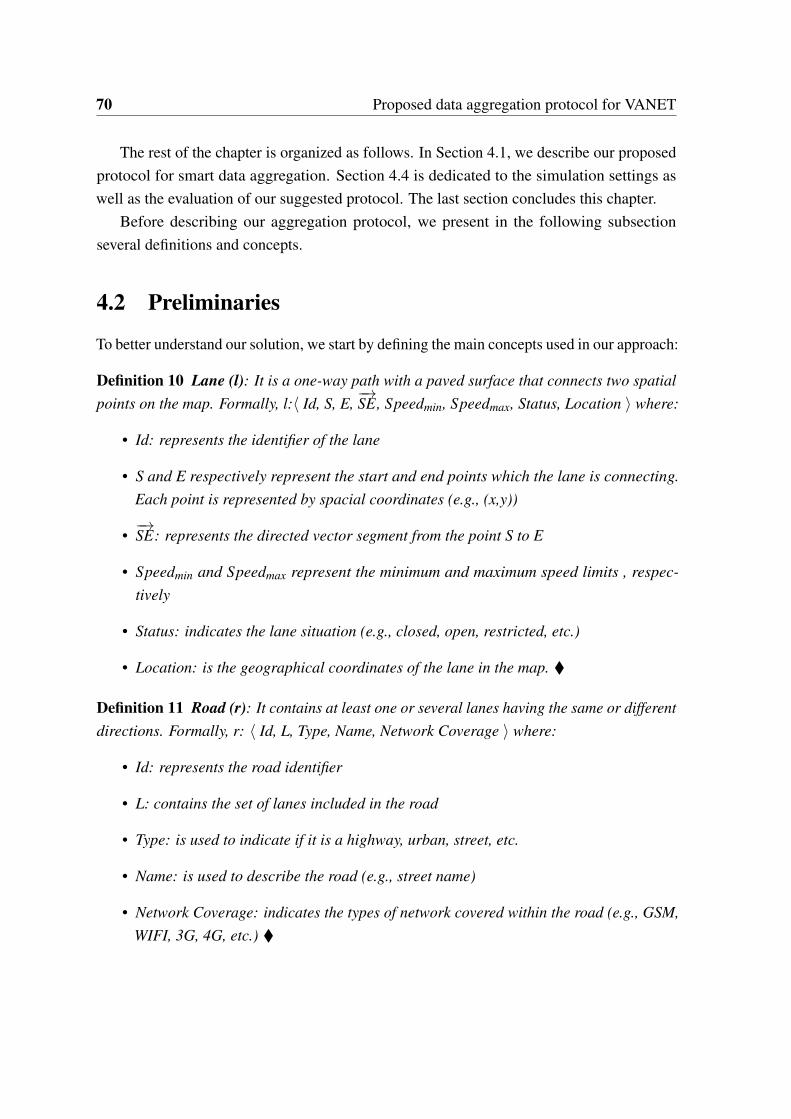
70 Proposed data aggregation protocol for VANET
The rest of the chapter is organized as follows. In Section 4.1, we describe our proposedprotocol for smart data aggregation. Section 4.4 is dedicated to the simulation settings aswell as the evaluation of our suggested protocol. The last section concludes this chapter.
Before describing our aggregation protocol, we present in the following subsectionseveral definitions and concepts.
4.2 Preliminaries
To better understand our solution, we start by defining the main concepts used in our approach:
Definition 10 Lane (l): It is a one-way path with a paved surface that connects two spatialpoints on the map. Formally, l:⟨ Id, S, E,
−→SE, Speedmin, Speedmax, Status, Location ⟩ where:
• Id: represents the identifier of the lane
• S and E respectively represent the start and end points which the lane is connecting.Each point is represented by spacial coordinates (e.g., (x,y))
•−→SE: represents the directed vector segment from the point S to E
• Speedmin and Speedmax represent the minimum and maximum speed limits , respec-tively
• Status: indicates the lane situation (e.g., closed, open, restricted, etc.)
• Location: is the geographical coordinates of the lane in the map. �
Definition 11 Road (r): It contains at least one or several lanes having the same or differentdirections. Formally, r: ⟨ Id, L, Type, Name, Network Coverage ⟩ where:
• Id: represents the road identifier
• L: contains the set of lanes included in the road
• Type: is used to indicate if it is a highway, urban, street, etc.
• Name: is used to describe the road (e.g., street name)
• Network Coverage: indicates the types of network covered within the road (e.g., GSM,WIFI, 3G, 4G, etc.) �
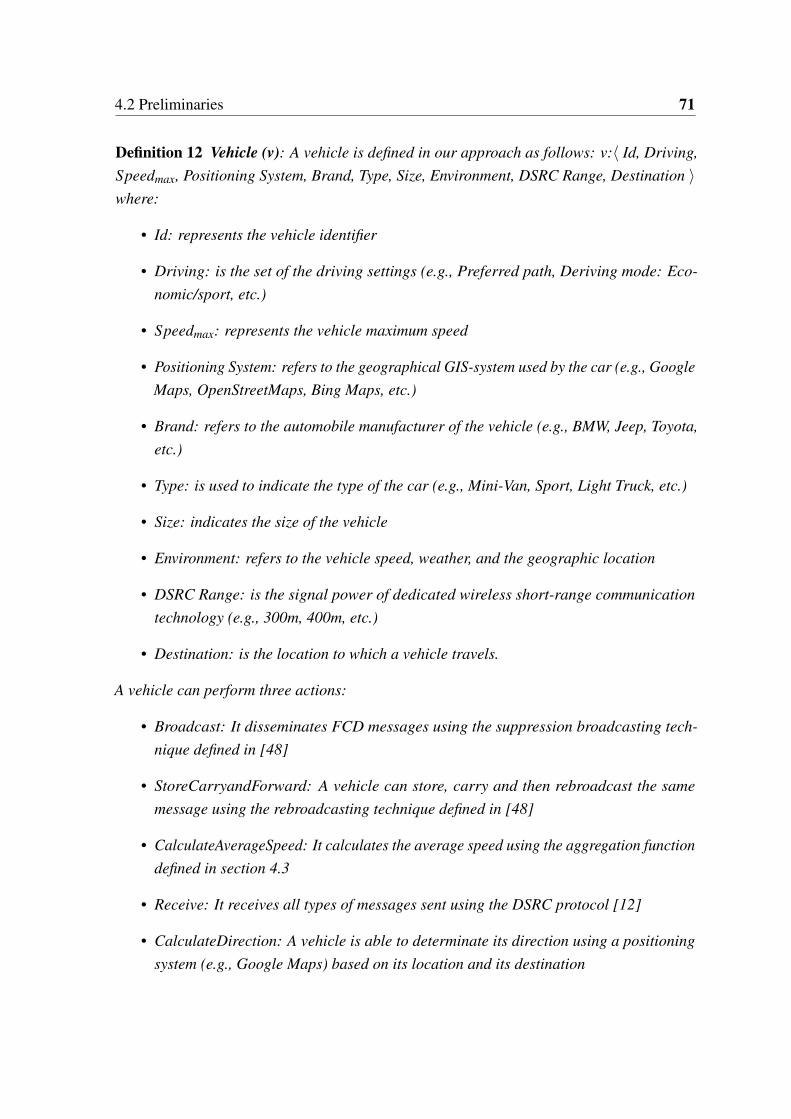
4.2 Preliminaries 71
Definition 12 Vehicle (v): A vehicle is defined in our approach as follows: v:⟨ Id, Driving,Speedmax, Positioning System, Brand, Type, Size, Environment, DSRC Range, Destination ⟩where:
• Id: represents the vehicle identifier
• Driving: is the set of the driving settings (e.g., Preferred path, Deriving mode: Eco-nomic/sport, etc.)
• Speedmax: represents the vehicle maximum speed
• Positioning System: refers to the geographical GIS-system used by the car (e.g., GoogleMaps, OpenStreetMaps, Bing Maps, etc.)
• Brand: refers to the automobile manufacturer of the vehicle (e.g., BMW, Jeep, Toyota,etc.)
• Type: is used to indicate the type of the car (e.g., Mini-Van, Sport, Light Truck, etc.)
• Size: indicates the size of the vehicle
• Environment: refers to the vehicle speed, weather, and the geographic location
• DSRC Range: is the signal power of dedicated wireless short-range communicationtechnology (e.g., 300m, 400m, etc.)
• Destination: is the location to which a vehicle travels.
A vehicle can perform three actions:
• Broadcast: It disseminates FCD messages using the suppression broadcasting tech-nique defined in [48]
• StoreCarryandForward: A vehicle can store, carry and then rebroadcast the samemessage using the rebroadcasting technique defined in [48]
• CalculateAverageSpeed: It calculates the average speed using the aggregation functiondefined in section 4.3
• Receive: It receives all types of messages sent using the DSRC protocol [12]
• CalculateDirection: A vehicle is able to determinate its direction using a positioningsystem (e.g., Google Maps) based on its location and its destination
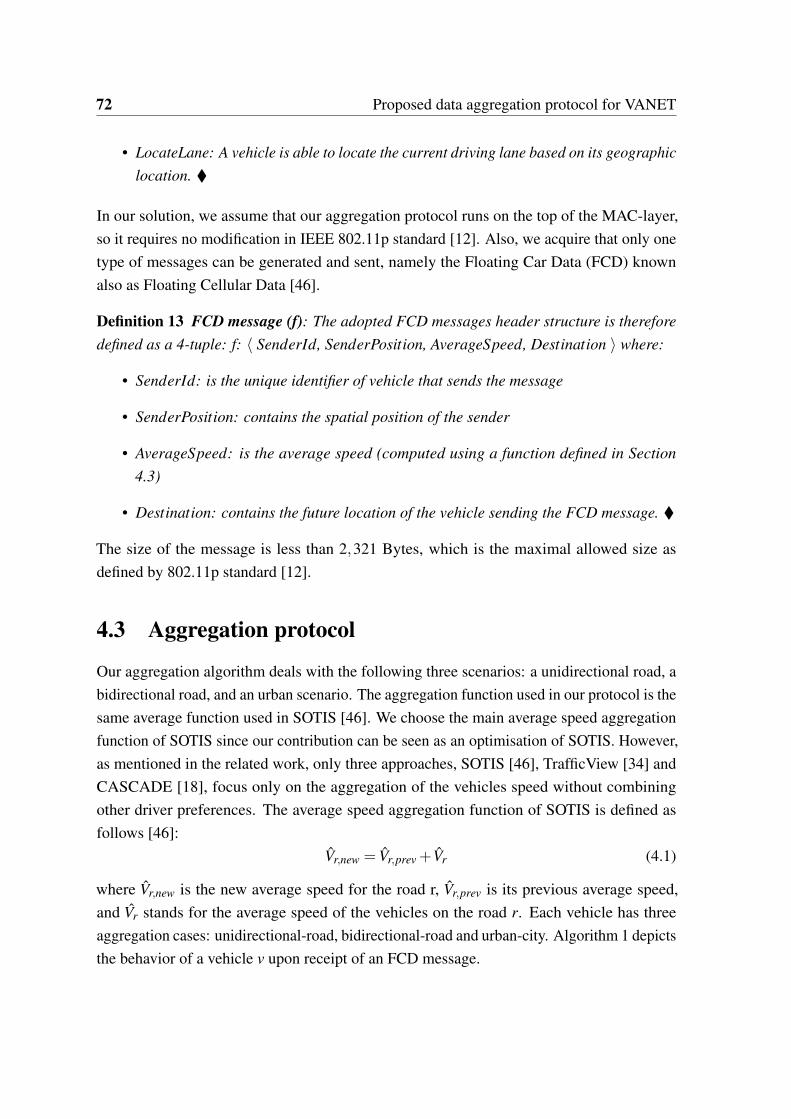
72 Proposed data aggregation protocol for VANET
• LocateLane: A vehicle is able to locate the current driving lane based on its geographiclocation. �
In our solution, we assume that our aggregation protocol runs on the top of the MAC-layer,so it requires no modification in IEEE 802.11p standard [12]. Also, we acquire that only onetype of messages can be generated and sent, namely the Floating Car Data (FCD) knownalso as Floating Cellular Data [46].
Definition 13 FCD message (f): The adopted FCD messages header structure is thereforedefined as a 4-tuple: f: ⟨ SenderId, SenderPosition, AverageSpeed, Destination ⟩ where:
• SenderId: is the unique identifier of vehicle that sends the message
• SenderPosition: contains the spatial position of the sender
• AverageSpeed: is the average speed (computed using a function defined in Section4.3)
• Destination: contains the future location of the vehicle sending the FCD message. �
The size of the message is less than 2,321 Bytes, which is the maximal allowed size asdefined by 802.11p standard [12].
4.3 Aggregation protocol
Our aggregation algorithm deals with the following three scenarios: a unidirectional road, abidirectional road, and an urban scenario. The aggregation function used in our protocol is thesame average function used in SOTIS [46]. We choose the main average speed aggregationfunction of SOTIS since our contribution can be seen as an optimisation of SOTIS. However,as mentioned in the related work, only three approaches, SOTIS [46], TrafficView [34] andCASCADE [18], focus only on the aggregation of the vehicles speed without combiningother driver preferences. The average speed aggregation function of SOTIS is defined asfollows [46]:
V̂r,new = V̂r,prev +V̂r (4.1)
where V̂r,new is the new average speed for the road r, V̂r,prev is its previous average speed,and V̂r stands for the average speed of the vehicles on the road r. Each vehicle has threeaggregation cases: unidirectional-road, bidirectional-road and urban-city. Algorithm 1 depictsthe behavior of a vehicle v upon receipt of an FCD message.

4.3 Aggregation protocol 73
Algorithm 1 Aggregation algorithm of a vehicle vVehilceLocation← v.Environment.Locationswitch VehilceLocation do
case Unidirectional RoadUse Algorithm 2
case Bidirectional RoadUse Algorithm 3
case Urban CityUse Algorithm 4
4.3.1 Unidirectional road case
On an unidirectional road, all vehicles drive in the same direction. Indeed, vehicles aheadmust collect traffic information, aggregate and disseminate it to other vehicles located behind.Figure 4.1 depicts the unidirectional road scenario where lanes contain different speedlimitations. Algorithm 2 contains the pseudo-code of processing this case. Briefly, when a
Fig. 4.1 Unidirectional Road Case
vehicle v receives an FCD message, it checks if the message comes from a farther senderon the same road or not. If yes, it computes the new updated average speed V̂r,new based onEquation 4.1. If the received average speed is greater than the maximum allowed speed ofthe current road r, the vehicle receiving the message will keep its previous average speedV̂r,prev and rebroadcast the value of the road maximum speed. Doing so, the propagated FCDmessage will warn other vehicles’ drivers whose ahead vehicles are driving very fast andexceed the maximum allowed speed. In Figure 4.1, only vehicles v1 and v2 will receive and
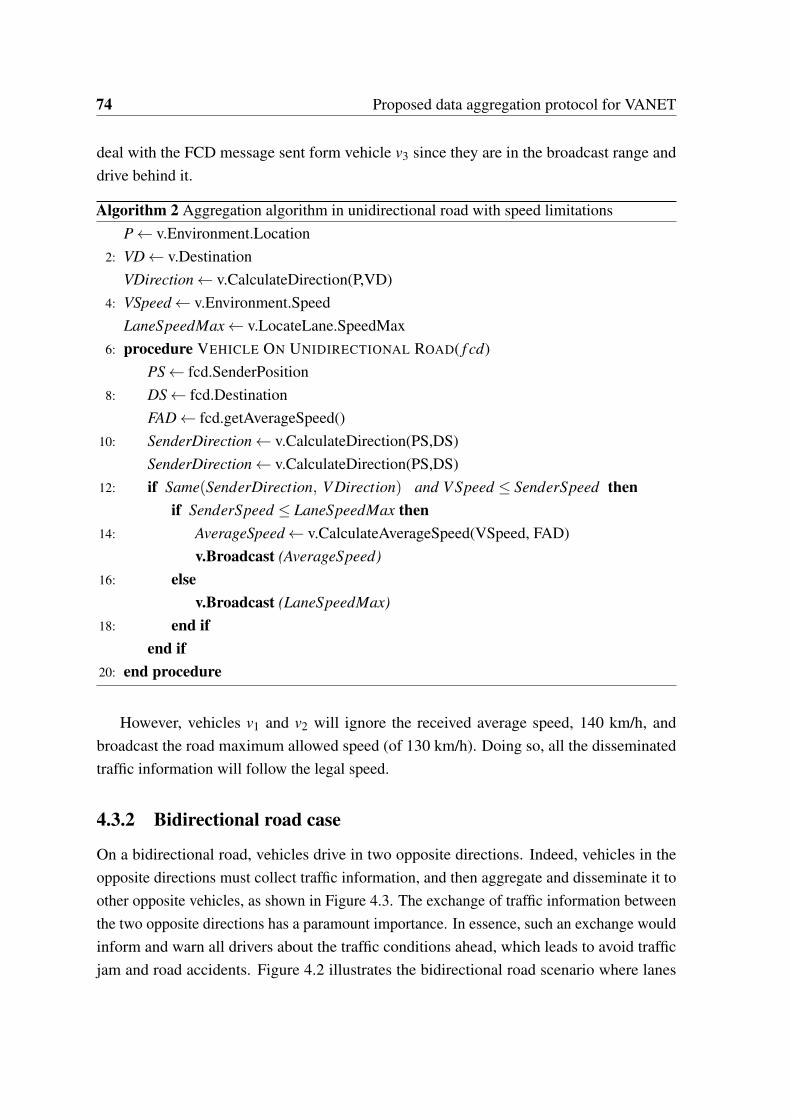
74 Proposed data aggregation protocol for VANET
deal with the FCD message sent form vehicle v3 since they are in the broadcast range anddrive behind it.
Algorithm 2 Aggregation algorithm in unidirectional road with speed limitationsP← v.Environment.Location
2: VD← v.DestinationVDirection← v.CalculateDirection(P,VD)
4: VSpeed← v.Environment.SpeedLaneSpeedMax← v.LocateLane.SpeedMax
6: procedure VEHICLE ON UNIDIRECTIONAL ROAD( f cd)PS← fcd.SenderPosition
8: DS← fcd.DestinationFAD← fcd.getAverageSpeed()
10: SenderDirection← v.CalculateDirection(PS,DS)SenderDirection← v.CalculateDirection(PS,DS)
12: if Same(SenderDirection, V Direction) and V Speed ≤ SenderSpeed thenif SenderSpeed ≤ LaneSpeedMax then
14: AverageSpeed← v.CalculateAverageSpeed(VSpeed, FAD)v.Broadcast (AverageSpeed)
16: elsev.Broadcast (LaneSpeedMax)
18: end ifend if
20: end procedure
However, vehicles v1 and v2 will ignore the received average speed, 140 km/h, andbroadcast the road maximum allowed speed (of 130 km/h). Doing so, all the disseminatedtraffic information will follow the legal speed.
4.3.2 Bidirectional road case
On a bidirectional road, vehicles drive in two opposite directions. Indeed, vehicles in theopposite directions must collect traffic information, and then aggregate and disseminate it toother opposite vehicles, as shown in Figure 4.3. The exchange of traffic information betweenthe two opposite directions has a paramount importance. In essence, such an exchange wouldinform and warn all drivers about the traffic conditions ahead, which leads to avoid trafficjam and road accidents. Figure 4.2 illustrates the bidirectional road scenario where lanes

4.3 Aggregation protocol 75
contain different speed limitations. Indeed, vehicle v4 will share its FCD average speed(90 km/h) with vehicle v1, which will broadcast this information to other behind vehiclessince the average speed is less than the maximum allowed speed. Algorithm 3 contains thepseudo-code of processing this case. In fact, the main difference between this case and theprevious one is that in a bidirectional scenario, vehicles can accept FCD messages that comeform the opposite side or vehicles ahead in the same lane and ignore other messages thatcome from behind. Actually, the vehicles in the opposite side have a larger overview on
Fig. 4.2 Bidirectional road case
the opposite traffic conditions, since they have been passed in front of it. Doing that allowsguaranteeing that the FCD contains an aggregated value of the whole opposite lanes. Figure4.3 depicts the propagation of an FCD message on a bidirectional road.
4.3.3 Urban network case
In urban network, vehicles drive in many different directions. Thus, vehicles can meet overcross roads and junctions. Indeed, they must exchange their traffic information, as shownin Figure 4.4. However, using a blind aggregation method will affect the precision andthe accuracy of the exchanged traffic information. This is owning to the fact that vehiclescan share and aggregate the average speed of other vehicles that are not going to the samedirection. Our aggregation model can solve this issue based on three filters:

76 Proposed data aggregation protocol for VANET
.
Fig. 4.3 FCD message propagation on a bidirectional road
Algorithm 3 Aggregation algorithm on a bidirectional road with speed limitations1: P← v.Environment.Location2: VD← v.Destination3: VDirection← v.CalculateDirection(P,VD)4: VSpeed← v.Environment.Speed5: LaneSpeedMax← v.LocateLane().SpeedMax6: procedure VEHICLE ON BIDIRECTIONAL ROAD( f cd)7: PS← fcd.SenderPosition8: DS← fcd.Destination9: FAD← fcd.getAverageSpeed()
10: SenderDirection← v.CalculateDirection(PS,DS)11: if NOT Same(SenderDirection , VehicleDirection) then12: if SenderSpeed ≤ LaneSpeedMax then13: AverageSpeed← v.CalculateAverageSpeed(VSpeed,FAD)14: v.Broadcast (AverageSpeed)15: else16: v.Broadcast (LaneSpeedMax)17: end if18: end if19: end procedure

4.3 Aggregation protocol 77
Algorithm 4 Aggregation algorithm in urban network1: P← v.Environment.Location2: VD← v.Destination3: VDirection← v.CalculateDirection(P,VD)4: VSpeed← v.Environment.Speed5: LaneSpeedMax← v.LocateLane().SpeedMax6: procedure VEHICLE IN URBAN CITY( f cd)7: PS← fcd.SenderPosition8: DS← fcd.Destination9: FAD← fcd.getAverageSpeed()
10: SenderDirection← v.CalculateDirection(PS,DS)11: if Same(SenderDirection , V Direction) then12: if SenderSpeed ≤ LaneSpeedMax then13: AverageSpeed← v.CalculateAverageSpeed(VSpeed, FAD)14: v.Broadcast (AverageSpeed)15: else16: v.Broadcast (LaneSpeedMax)17: end if18: else19: StoreCarryandForward ( f cd)20: end if21: end procedure
1. A direction filter that ensures the aggregation of coherent FCD messages targeting thesame road and direction
2. A suppression technique filter that ignores all duplicated FCD messages. In the currentversion of our protocol, we adopt the famous slotted 1-persistence broadcast protocol[48]
3. An aggregation filter that ignores all the received FCD messages that exceed the roadmaximum speed. In fact, if the average speed of any FCD message is greater thanthe maximum allowed speed, the received vehicle will ignore it and broadcast themaximum speed instead.
In urban networks, when a vehicle gets an FCD message, it checks firstly the direction of thesender. Then if the received average speed is less than the road maximum speed limit, the
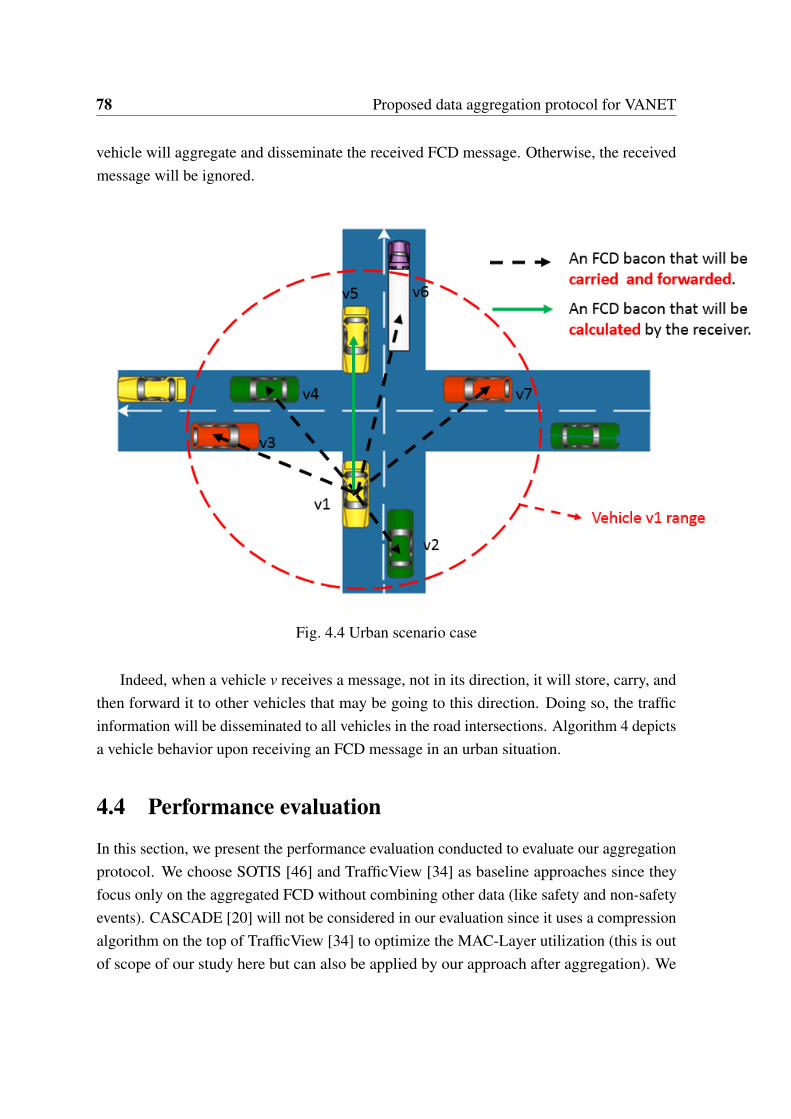
78 Proposed data aggregation protocol for VANET
vehicle will aggregate and disseminate the received FCD message. Otherwise, the receivedmessage will be ignored.
Fig. 4.4 Urban scenario case
Indeed, when a vehicle v receives a message, not in its direction, it will store, carry, andthen forward it to other vehicles that may be going to this direction. Doing so, the trafficinformation will be disseminated to all vehicles in the road intersections. Algorithm 4 depictsa vehicle behavior upon receiving an FCD message in an urban situation.
4.4 Performance evaluation
In this section, we present the performance evaluation conducted to evaluate our aggregationprotocol. We choose SOTIS [46] and TrafficView [34] as baseline approaches since theyfocus only on the aggregated FCD without combining other data (like safety and non-safetyevents). CASCADE [20] will not be considered in our evaluation since it uses a compressionalgorithm on the top of TrafficView [34] to optimize the MAC-Layer utilization (this is outof scope of our study here but can also be applied by our approach after aggregation). We
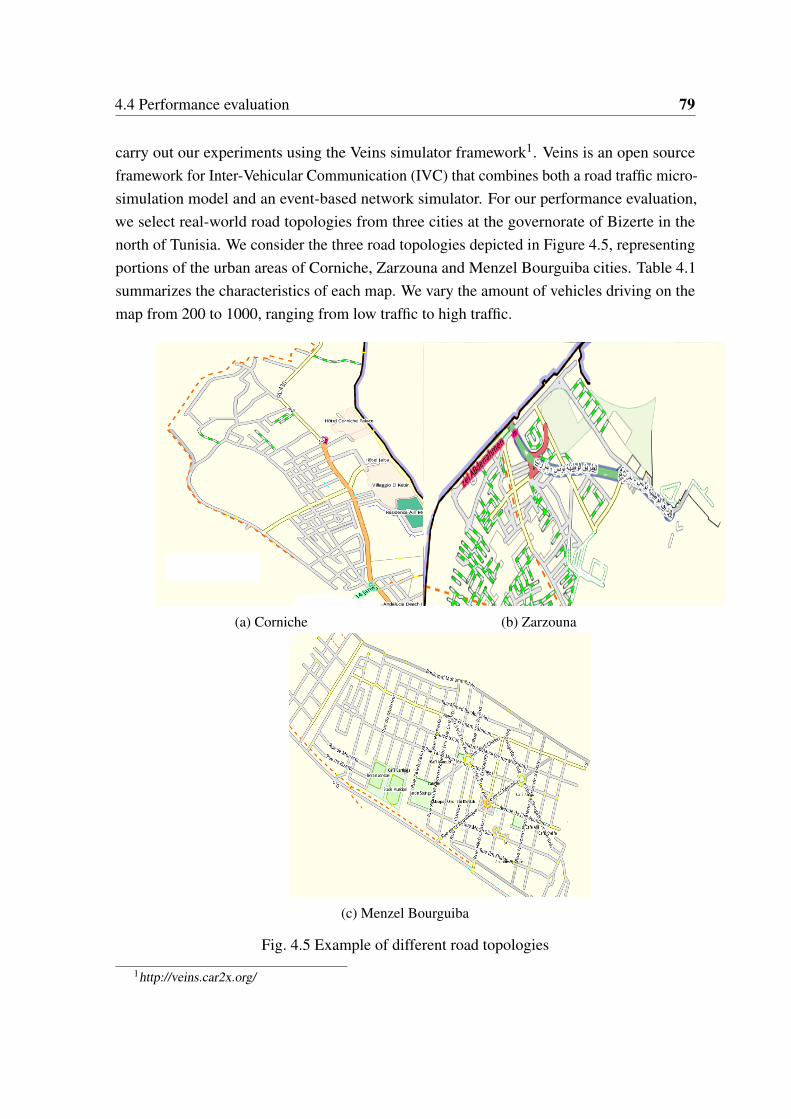
4.4 Performance evaluation 79
carry out our experiments using the Veins simulator framework1. Veins is an open sourceframework for Inter-Vehicular Communication (IVC) that combines both a road traffic micro-simulation model and an event-based network simulator. For our performance evaluation,we select real-world road topologies from three cities at the governorate of Bizerte in thenorth of Tunisia. We consider the three road topologies depicted in Figure 4.5, representingportions of the urban areas of Corniche, Zarzouna and Menzel Bourguiba cities. Table 4.1summarizes the characteristics of each map. We vary the amount of vehicles driving on themap from 200 to 1000, ranging from low traffic to high traffic.
(a) Corniche (b) Zarzouna
(c) Menzel Bourguiba
Fig. 4.5 Example of different road topologies
1http://veins.car2x.org/
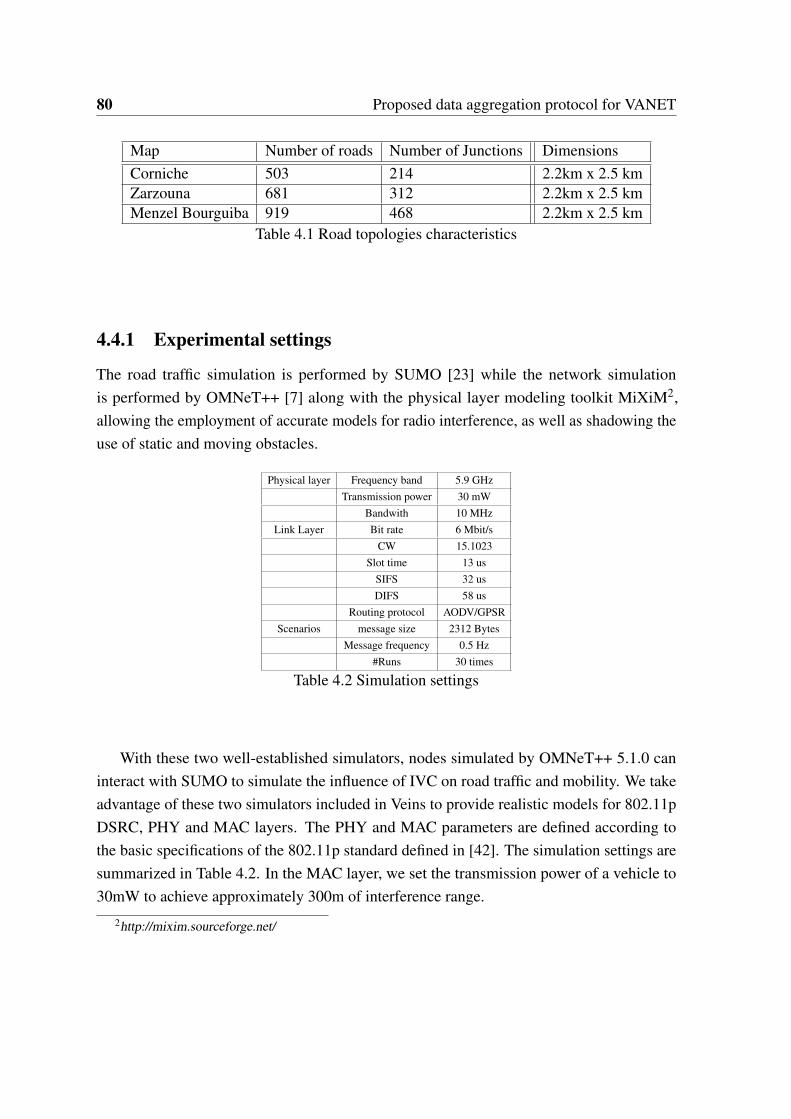
80 Proposed data aggregation protocol for VANET
Map Number of roads Number of Junctions DimensionsCorniche 503 214 2.2km x 2.5 kmZarzouna 681 312 2.2km x 2.5 kmMenzel Bourguiba 919 468 2.2km x 2.5 km
Table 4.1 Road topologies characteristics
4.4.1 Experimental settings
The road traffic simulation is performed by SUMO [23] while the network simulationis performed by OMNeT++ [7] along with the physical layer modeling toolkit MiXiM2,allowing the employment of accurate models for radio interference, as well as shadowing theuse of static and moving obstacles.
Physical layer Frequency band 5.9 GHzTransmission power 30 mW
Bandwith 10 MHzLink Layer Bit rate 6 Mbit/s
CW 15.1023Slot time 13 us
SIFS 32 usDIFS 58 us
Routing protocol AODV/GPSRScenarios message size 2312 Bytes
Message frequency 0.5 Hz#Runs 30 times
Table 4.2 Simulation settings
With these two well-established simulators, nodes simulated by OMNeT++ 5.1.0 caninteract with SUMO to simulate the influence of IVC on road traffic and mobility. We takeadvantage of these two simulators included in Veins to provide realistic models for 802.11pDSRC, PHY and MAC layers. The PHY and MAC parameters are defined according tothe basic specifications of the 802.11p standard defined in [42]. The simulation settings aresummarized in Table 4.2. In the MAC layer, we set the transmission power of a vehicle to30mW to achieve approximately 300m of interference range.
2http://mixim.sourceforge.net/
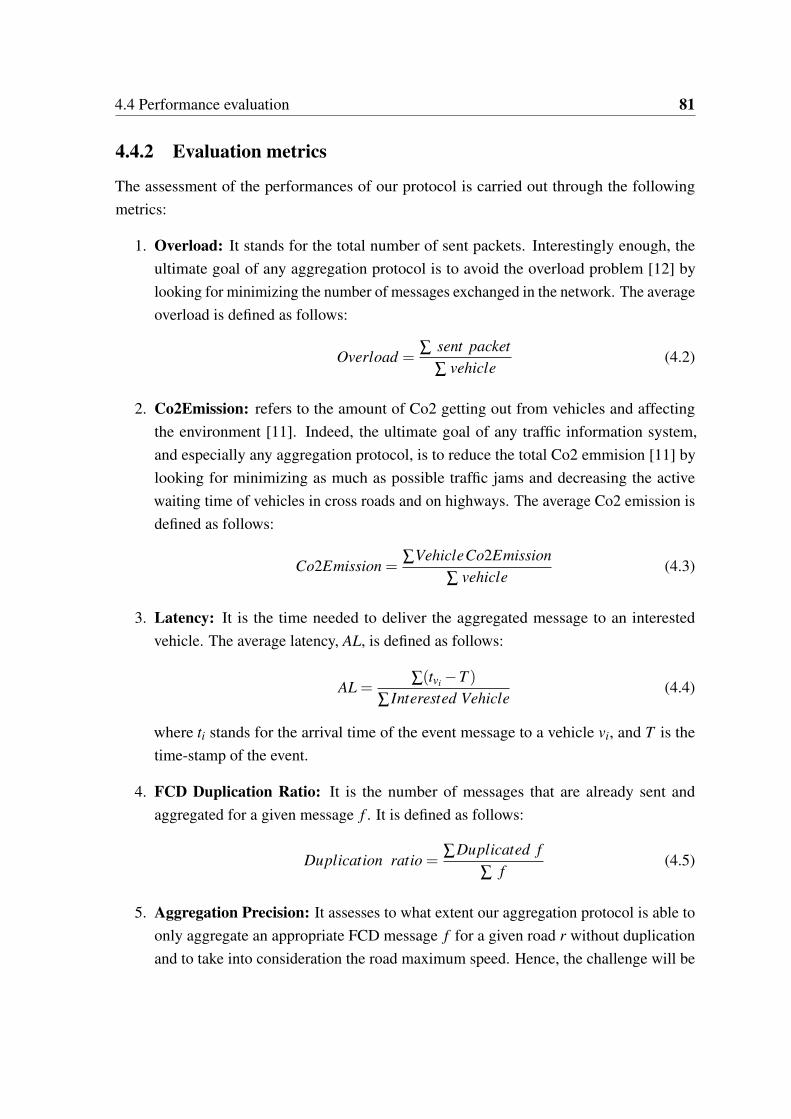
4.4 Performance evaluation 81
4.4.2 Evaluation metrics
The assessment of the performances of our protocol is carried out through the followingmetrics:
1. Overload: It stands for the total number of sent packets. Interestingly enough, theultimate goal of any aggregation protocol is to avoid the overload problem [12] bylooking for minimizing the number of messages exchanged in the network. The averageoverload is defined as follows:
Overload =∑ sent packet
∑ vehicle(4.2)
2. Co2Emission: refers to the amount of Co2 getting out from vehicles and affectingthe environment [11]. Indeed, the ultimate goal of any traffic information system,and especially any aggregation protocol, is to reduce the total Co2 emmision [11] bylooking for minimizing as much as possible traffic jams and decreasing the activewaiting time of vehicles in cross roads and on highways. The average Co2 emission isdefined as follows:
Co2Emission =∑VehicleCo2Emission
∑ vehicle(4.3)
3. Latency: It is the time needed to deliver the aggregated message to an interestedvehicle. The average latency, AL, is defined as follows:
AL =∑(tvi−T )
∑ Interested Vehicle(4.4)
where ti stands for the arrival time of the event message to a vehicle vi, and T is thetime-stamp of the event.
4. FCD Duplication Ratio: It is the number of messages that are already sent andaggregated for a given message f . It is defined as follows:
Duplication ratio =∑Duplicated f
∑ f(4.5)
5. Aggregation Precision: It assesses to what extent our aggregation protocol is able toonly aggregate an appropriate FCD message f for a given road r without duplicationand to take into consideration the road maximum speed. Hence, the challenge will be

82 Proposed data aggregation protocol for VANET
to obtain precision values of the average speed propagated to vehicles compared to thereal road traffic state. It is defined as follows:
Precision( f ) =|IIV ||AIV |
(4.6)
where IIV stands for the set of interested informed vehicles (i.e., only appropriatevehicles for a message f ), and AIV stands for the set of all informed vehicles thatwill aggregate the received FCD message f (i.e., interested as well as not interestedvehicles for an FCD f ). The average precision is defined as follows:
AveragePrecision =∑Precision( f )
∑ f(4.7)
4.4.3 Results
As expected, using our aggregation protocol, the overload level is decreased (cf. Figure4.6). This is owed to the fact that the number of duplicated messages is eliminated and thepropagation of unnecessary aggregated FCD messages to uninterested vehicles is reduced. Asa result, our protocol SDDA enables keeping a low overload. Moreover, Figure 4.7 shows thatSDDA has a low Co2 Emmision value in different network densities. It is worth mentioningthat our protocol decreases the Co2Emmision value in comparison to SOTIS and TrafficViewby almost 70% since vehicles will have a precise traffic information and will avoid trafficjams. Figures 4.6 4.7 also demonstrate that the overload and Co2Emmision values will risefor all protocols when the number of vehicles increases. This interesting performance isrelated to the fact that our strategy permits ignoring all the unnecessary FCD messages whenvehicles move based on direction and speed limitation filers. Moreover, Figure 4.9 indicatesthat the number of duplicated messages in our proposed solution is 99% less than othersolutions thanks to the usage of the Slotted-1 persistence suppression technique [48] beingable to eliminate all the duplicated messages. Finally, Figure 4.10 depicts that the latencyof our SDDA strategy is slightly less than that of other strategies. This is due to the highoverload level of SOTIS and TrafficView which increase the network collisions that affectsthe latency time. [39].
As expected, the packet loss ratio in Figure 4.11 is inversely proportional to the trafficdensity. In fact, it decreases as far as the number of vehicles grows. This can simplybe explained by the fact that when raising the number of vehicles in the network, thecommunication overload as well as the message reception errors go up, which leads toincrease the ratio of lost packets. Consequently, this fact will undoubtedly increase thenumber of vehicles that will not receive the messages or will receive damaged packets
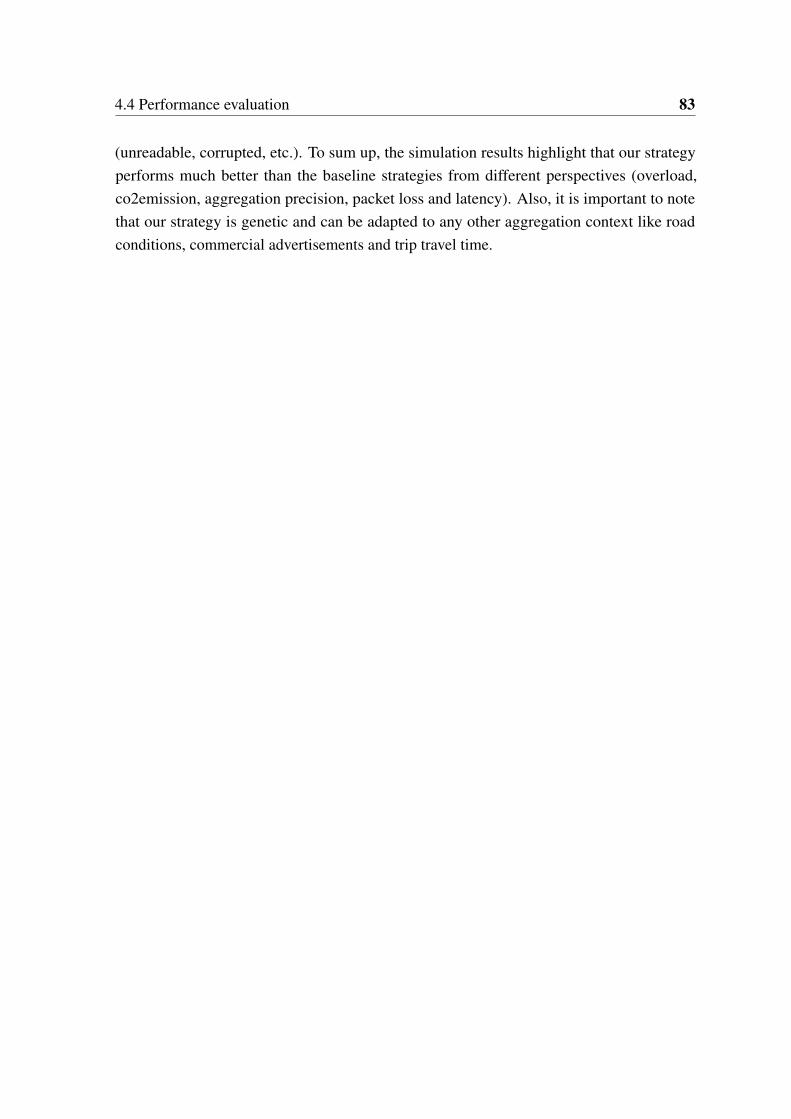
4.4 Performance evaluation 83
(unreadable, corrupted, etc.). To sum up, the simulation results highlight that our strategyperforms much better than the baseline strategies from different perspectives (overload,co2emission, aggregation precision, packet loss and latency). Also, it is important to notethat our strategy is genetic and can be adapted to any other aggregation context like roadconditions, commercial advertisements and trip travel time.
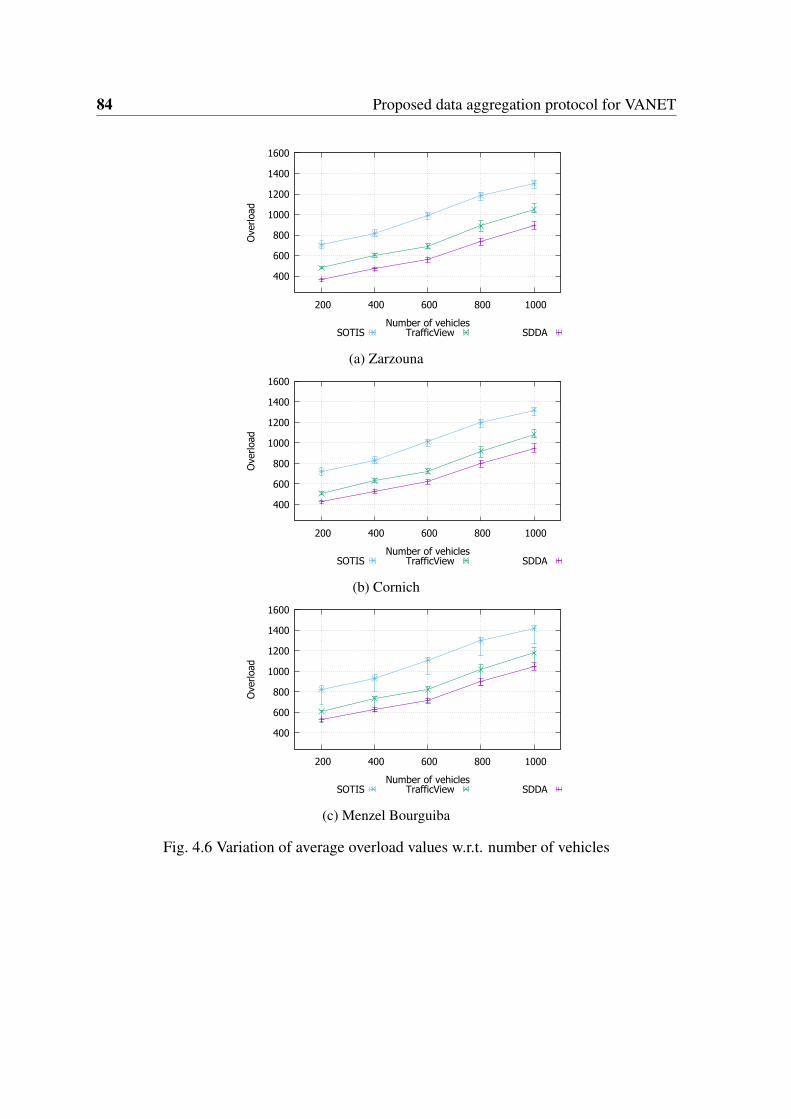
84 Proposed data aggregation protocol for VANET
400
600
800
1000
1200
1400
1600
200 400 600 800 1000
Ove
rload
Number of vehicles SOTIS TrafficView SDDA
(a) Zarzouna
400
600
800
1000
1200
1400
1600
200 400 600 800 1000
Ove
rload
Number of vehicles SOTIS TrafficView SDDA
(b) Cornich
400
600
800
1000
1200
1400
1600
200 400 600 800 1000
Ove
rload
Number of vehicles SOTIS TrafficView SDDA
(c) Menzel Bourguiba
Fig. 4.6 Variation of average overload values w.r.t. number of vehicles
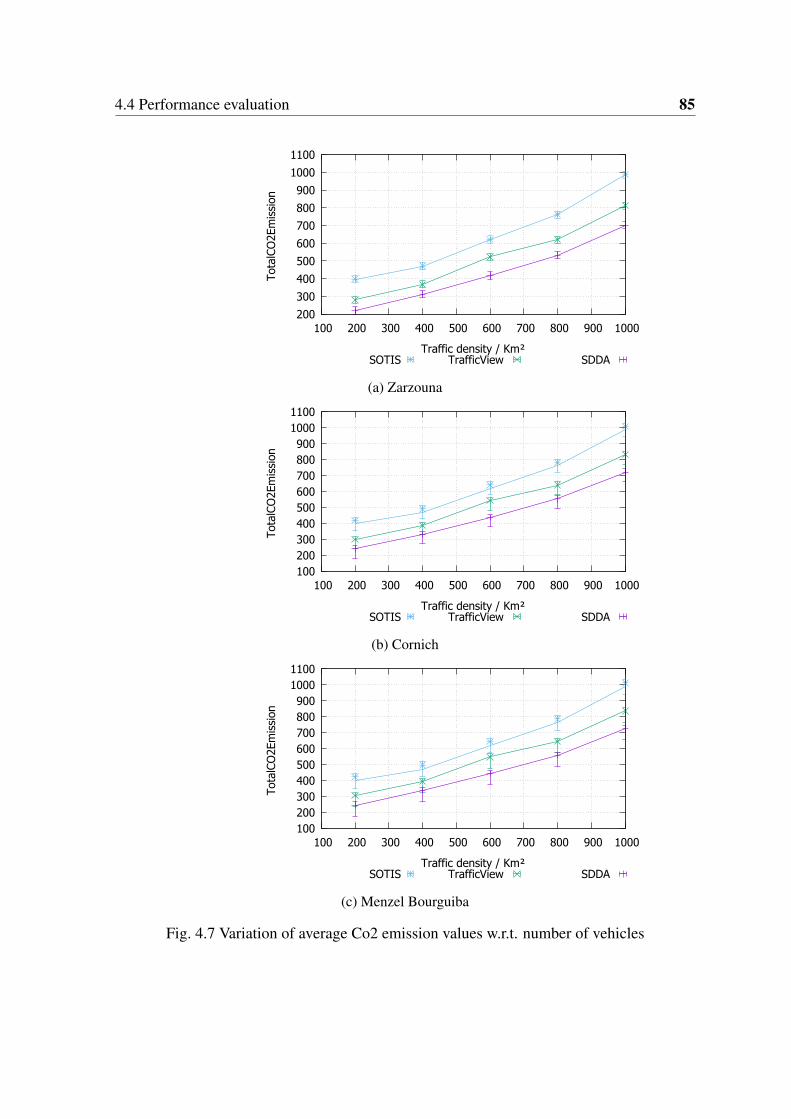
4.4 Performance evaluation 85
200
300
400
500
600
700
800
900
1000
1100
100 200 300 400 500 600 700 800 900 1000
Tota
lCO
2Em
issi
on
Traffic density / Km² SOTIS TrafficView SDDA
(a) Zarzouna
100 200 300 400 500 600 700 800 900
1000 1100
100 200 300 400 500 600 700 800 900 1000
Tota
lCO
2Em
issi
on
Traffic density / Km² SOTIS TrafficView SDDA
(b) Cornich
100 200 300 400 500 600 700 800 900
1000 1100
100 200 300 400 500 600 700 800 900 1000
Tota
lCO
2Em
issi
on
Traffic density / Km² SOTIS TrafficView SDDA
(c) Menzel Bourguiba
Fig. 4.7 Variation of average Co2 emission values w.r.t. number of vehicles
86 Proposed data aggregation protocol for VANET
0.5
0.55
0.6
0.65
0.7
0.75
0.8
0.85
200 400 600 800 1000
PREC
ISIO
N
Number of vehicles SDDA TrafficView SOTIS
(a) Zarzouna
0.7
0.75
0.8
0.85
0.9
0.95
1
1.05
200 400 600 800 1000
PREC
ISIO
N
Number of vehicles SDDA TrafficView SOTIS
(b) Cornich
0.8
0.85
0.9
0.95
1
1.05
1.1
1.15
200 400 600 800 1000
PREC
ISIO
N
Number of vehicles SDDA TrafficView SOTIS
(c) Menzel Bourguiba
Fig. 4.8 Variation in average aggregation precision FCD values w.r.t. number of vehicles
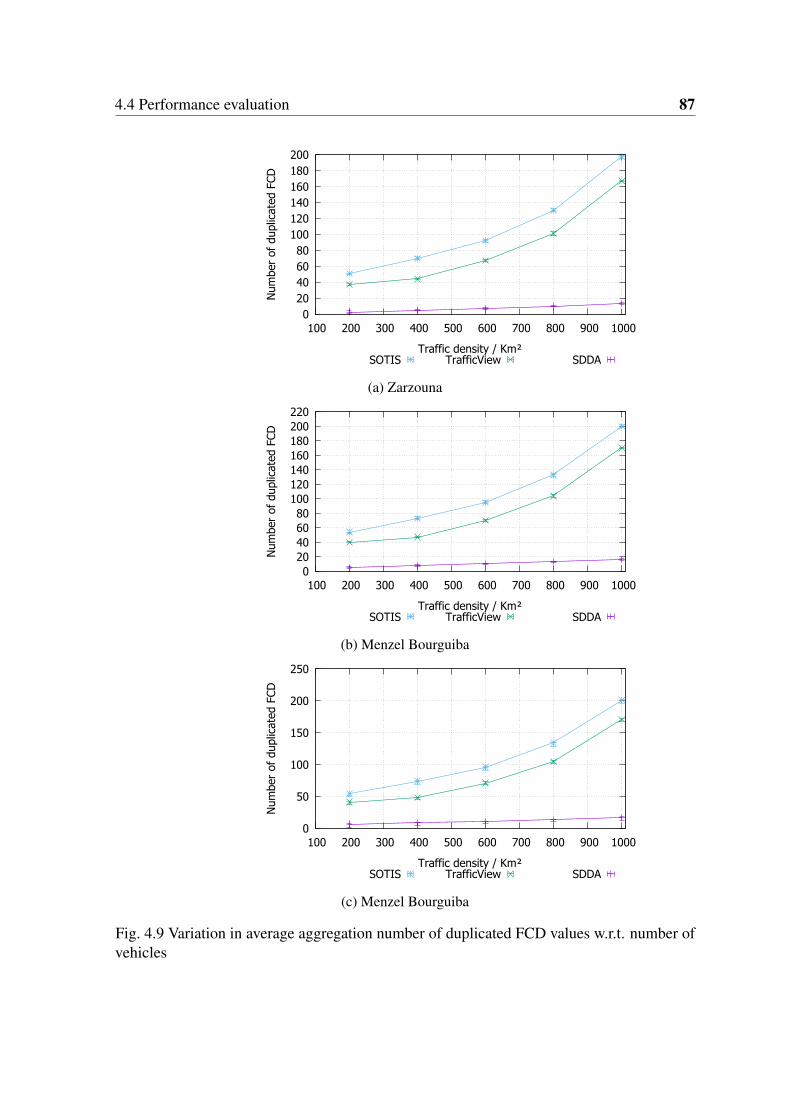
4.4 Performance evaluation 87
0 20 40 60 80
100 120 140 160 180 200
100 200 300 400 500 600 700 800 900 1000
Num
ber
of d
uplic
ated
FCD
Traffic density / Km² SOTIS TrafficView SDDA
(a) Zarzouna
0 20 40 60 80
100 120 140 160 180 200 220
100 200 300 400 500 600 700 800 900 1000
Num
ber
of d
uplic
ated
FCD
Traffic density / Km² SOTIS TrafficView SDDA
(b) Menzel Bourguiba
0
50
100
150
200
250
100 200 300 400 500 600 700 800 900 1000
Num
ber
of d
uplic
ated
FCD
Traffic density / Km² SOTIS TrafficView SDDA
(c) Menzel Bourguiba
Fig. 4.9 Variation in average aggregation number of duplicated FCD values w.r.t. number ofvehicles
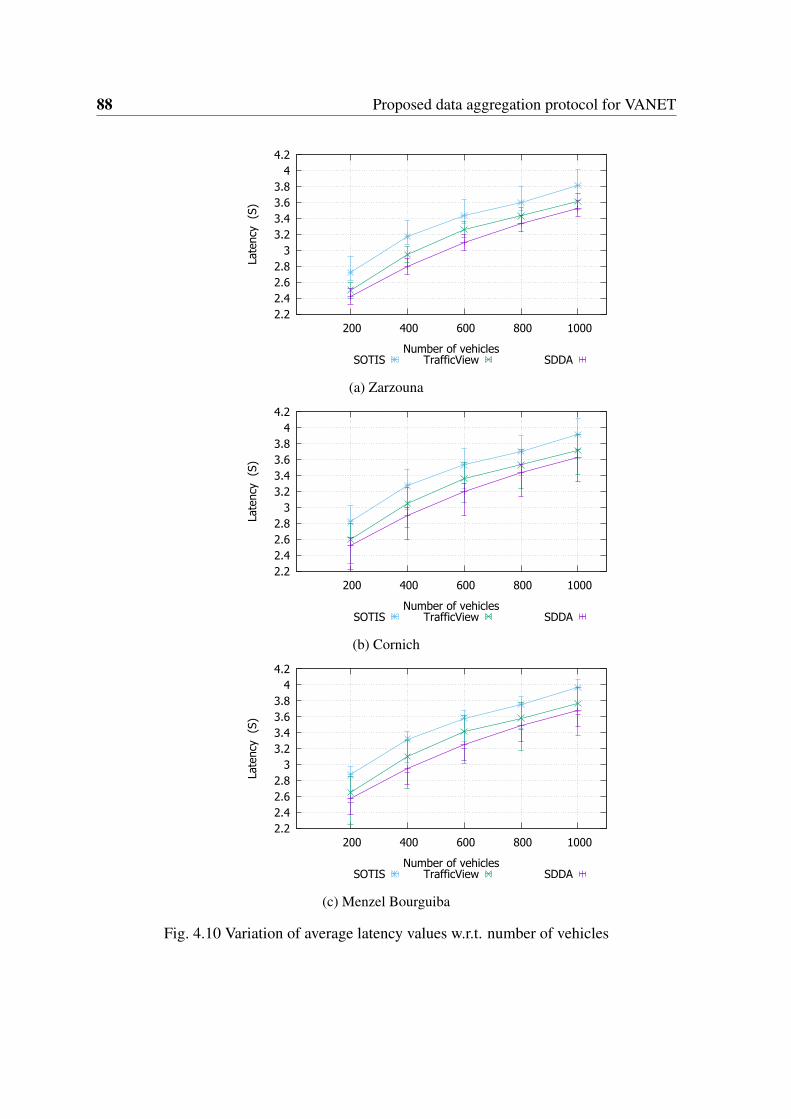
88 Proposed data aggregation protocol for VANET
2.2 2.4 2.6 2.8
3 3.2 3.4 3.6 3.8
4 4.2
200 400 600 800 1000
Late
ncy
(S)
Number of vehicles SOTIS TrafficView SDDA
(a) Zarzouna
2.2 2.4 2.6 2.8
3 3.2 3.4 3.6 3.8
4 4.2
200 400 600 800 1000
Late
ncy
(S)
Number of vehicles SOTIS TrafficView SDDA
(b) Cornich
2.2 2.4 2.6 2.8
3 3.2 3.4 3.6 3.8
4 4.2
200 400 600 800 1000
Late
ncy
(S)
Number of vehicles SOTIS TrafficView SDDA
(c) Menzel Bourguiba
Fig. 4.10 Variation of average latency values w.r.t. number of vehicles
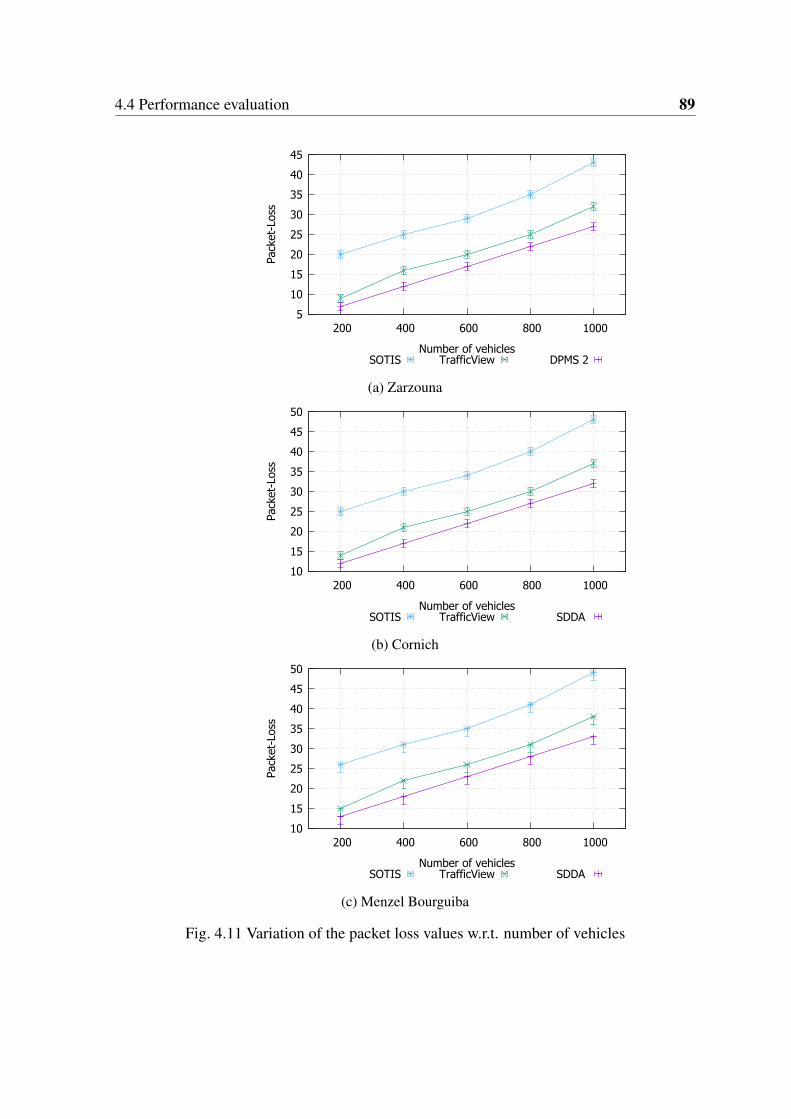
4.4 Performance evaluation 89
5
10
15
20
25
30
35
40
45
200 400 600 800 1000
Pack
et-L
oss
Number of vehicles SOTIS TrafficView DPMS 2
(a) Zarzouna
10
15
20
25
30
35
40
45
50
200 400 600 800 1000
Pack
et-L
oss
Number of vehicles SOTIS TrafficView SDDA
(b) Cornich
10
15
20
25
30
35
40
45
50
200 400 600 800 1000
Pack
et-L
oss
Number of vehicles SOTIS TrafficView SDDA
(c) Menzel Bourguiba
Fig. 4.11 Variation of the packet loss values w.r.t. number of vehicles
90 Proposed data aggregation protocol for VANET
4.5 Conclusion
In this chapter, we have introduced SDDA as a generic smart directional data aggregationprotocol to aggregate data about traffic in a VANET. The main thrust of our protocol standson the use of direction and road speed limitation in data aggregation process. Doing sohas allowed meeting several goals, namely reaching a low overload ratio as well as a highaggregation precision. Extensive experimental work has shown that SDDA obtains veryinteresting results in comparison with those provided by pioneering approaches of theliterature.
Chapter 5
Conclusion and future directions
5.1 Conclusion
The emergence of VANET networks has allowed a great progress of advanced IntelligentTransportation System (ITS) services including various safety and non-safety applications.Due to the VANET environment, information has to be exchanged between mobile vehiclesin an efficient way by avoiding as far as possible the broadcast storm problem, which needsefficient data dissemination and aggregation protocols.
In this respect, we have introduced in the first part of this thesis a map splitting-baseddissemination protocol, called DPMS. The main thrust of our protocol stands for an adequatetargeting of the zone of relevance of the disseminated messages. Doing so has allowed usto meet our goals, namely reaching a high delivery ratio as well as a high geocast precision.Extensive experimental work has shown that DPMS has obtained very encouraging resultsversus those got by pioneering approaches of the literature.
In the second part of this thesis, we have introduced SDDA as a generic smart directionaldata aggregation model protocol to exchange information about traffic in a VANET toovercome several limitations related to existing approaches. The main thrust of our protocolstands for an adequate targeting of using direction and road speed limitation. Doing sohas allowed meeting several goals, namely reaching a low overload ratio as well as a highaggregation precision. Extensive experimental work has shown that SDDA obtains veryinteresting results in comparison with those provided by pioneering approaches of theliterature.
92 Conclusion and future directions
5.2 Future directions
This thesis can constitute a basis for a lot of future work, which can be articulated on severalaxes. The details of this future work are as follows:
Managing the scalability issue for the extraction of the ZORs. Even though the size ofthe considered datasets is by far larger than those considered by the literature approaches,they are far from being firmly grounded within the era of big data. Thus, the scalability issueof the ZOR computation is still a thriving issue to carry extensive experiments by consideringa higher number of vehicles. In addition, we will also consider the incremental maintenanceof building ZORs.
Introducing a data aggregation mechanism to be used before broadcasting traffic informa-tion events. Indeed, without aggregation, a vehicle can use DPMS to send a warning messagereporting the condition to vehicles inside ZOR. Other vehicles in the traffic jam can also startgenerating such warning messages, which will undoubtedly lead to a local broadcast storm.
Integrating the DPMS protocol within a signal phase and time information supporting a"green driving" for all vehicles and a safe and comfortable crossing of intersections even byblind and visually impaired pedestrians.
The scenarios that we consider in our simulations and our experiments in real environmentare still limited, for example in the number of vehicles or in the number and size of objects.To ensure the effectiveness of our proposals in all possible scenarios, it may be particularlyinteresting to carry out large-scale tests. In the same way, we have considered in the variousscenarios that the created objects are of the same size and that the preferences of the usersare often uniformly distributed. Considering objects with different sizes will be interestingsince it is the case in a real environment. The enthusiasm of users for certain types of contentwould also be fairly representative and quite favorable to our proposals. Likewise, studyingand analyzing the load induced by the exchange of the beacon messages we use is importantin order to show that it does not have a real impact and does not cause a too big overhead inthe network.
In addition, dissemination depends essentially on the cooperation between the nodes tocommunicate and share the contents. However, nodes usually have a selfish behavior whichcan influence the performance of dissemination protocols. Therefore, taking into account thisfactor in dissemination is important and proposing solutions encouraging nodes to cooperateis a very interesting extension of our work.
In addition, validating the experiment carried out using mobile nodes (cars) equippedwith the standard 802.11p will certainly be very informative. This will make it possible tohighlight important parameters such as the distance between the nodes, the transmissionrange, the variability in the channel and the flow rate, thus validating the estimation of contact

5.2 Future directions 93
times in a real environment. Finally, estimating future contacts can improve disseminationin vehicular networks. An estimate based on a centralized method can be studied. Indeed,the periodic exchanges between the nodes and the central equipment, performed through thecellular network, allow the latter to predict future contacts. Nevertheless, in these approachesit will be important to study and analyze the overload induced on the cellular network becauseof these exchanges, the freshness of the information, and the load in terms of traffic andcalculations that the central element will undergo.
We can first note that although vehicles are equipped with short-range communications,this is still insufficient because of the variability in the environment (urban, rural, highway)and road traffic (rush hour, day, late evening). This has an impact on the communicationfrequencies between the nodes and on the density of the network. To do this, proposing acommunication paradigm between vehicular networks and telecommunications networkssuch as LTE will be useful for these two types of networks. Indeed, the vehicular networkscan be a means to offload the large volume of traffic that undergoes LTE. The latter offerslong-range communications to reach isolated nodes and instant communications when needed.Another aspect that could prolong the work of this thesis will be the integration of other typesof networks with vehicular networks. The communication of a vehicle should not be limitedto other vehicles that move. Thus, it will be interesting to allow even a pedestrian equippedwith a smartphone in the street to be able to communicate and share contents with road users.Similarly, sensors installed at the edge of the road can communicate and inform vehiclesautomatically with the information collected. This makes it possible to extend the vehicularnetworks and minimize the intermittencies that may occur.
It cannot be denied that VANETs have been designed to bring a number of benefits, suchas: reducing road traffic accidents, driving comfort and travel for drivers and passengers,easy payment for certain services such as parking, gas, etc. These networks also implementsafety, maintenance and comfort applications such as Internet access, online and networkgames, and audio and video downloads. All these applications involve the exchange ofmessages such as emergency messages, warnings about incidents, road conditions at specifictimes, and driving assistance information. All these exchanges involve computer data and thecontent of the messages can influence the behavior of drivers, hence changing the topologyof the network. This implies a risk of attack by malicious users who can interceptes thetraffic messages exchanged on the network. Some attacks that can be observed on VANETsare: traffic blocking attacks, replay attacks, lie attacks on transmitted information, denial ofservice attacks, masquerade attacks, identity robbery attacks, illusion attacks, communicationequipment attacks, etc.

94 Conclusion and future directions
For these reasons, security in these networks presents a very important challenge forresearchers. There is a great deal of research on the safety of wireless vehicular networks tocombat and protect these networks from threats and attacks. For the same purpose, in thenear future we are interested in the security of the VANET network, the different types ofattacks that this network may undergo, and the means of preventing these attacks.
Last but not least, our avenues of future work for data aggregation are as follows:
• We are actually working on real-word validation scenarios and we plan to extend themodel to deal with other aggregation issues in VANETs like parking spaces, roadconditions, and trip travel time.
• We provide a generic compression algorithm for FCD messages in order to reduce thebandwidth usage
• We integrate other dissemination protocols in our aggregation model in order to providea more generic aggregation and dissemination protocol.
References
[1] Allal, S. and Boudjit, S. (2012). Geocast routing protocols for vanets: Survey andguidelines. In Proc. of the Inl. Conf. on Innovative Mobile and Internet Services inUbiquitous Computing (IMIS), pages 323–328.
[2] Allani, S., Chbeir, R., Yeferny, T., and Yahia, S. B. (2018). Smart directional dataaggregation in vanet. In Proceedings - International Conference on Advanced InformationNetworking and Applications.
[3] Allani, S., Yeferny, T., and Chbeir, R. (2017). A scalable data dissemination protocolbased on vehicles trajectories analysis. Ad Hoc Networks, 71:31–44.
[4] Allani, S., Yeferny, T., Chbeir, R., and Ben Yahia, S. (2016a). A novel VANET datadissemination approach based on geospatial data. In The 7th International Conferenceon Emerging Ubiquitous Systems and Pervasive Networks (EUSPN 2016)/The 6th Inter-national Conference on Current and Future Trends of Information and CommunicationTechnologies, pages 572–577.
[5] Allani, S., Yeferny, T., Chbeir, R., and Yahia, S. B. (2016b). Dpms: A swift datadissemination protocol based on map splitting. In Proceedings - International ComputerSoftware and Applications Conference, volume 1, pages 817–822.
[6] Alsubaihi, B. and Boukerche, A. (2015). Semantic and self-decision geocast protocolfor data dissemination over vanet (sas-gp). In Wireless Communications and NetworkingConference (WCNC), pages 1948–1953.
[7] Andras, V. (2010). Omnet++. In Wehrle, Klaus, Günes, Mesut, Gross, and James, editors,Modeling and Tools for Network Simulation, pages 35–59.
[8] Bako, B. and Weber, M. (2011). Efficient Information Dissemination in VANETs. InAdv. Veh. Netw. Technol., page 20.
[9] Barbut, M. and Monjardet, B. (1970). Ordre et classification. Algèbre et Combinatoire.
[10] Bernhard, G. and Rudolfe, W. (1999). Formal Concept Analysis.
[11] Cappiello, A., Chabini, I., Nam, E. K., Lue, A., and Abou Zeid, M. (2002). A statisticalmodel of vehicle emissions and fuel consumption. IEEE 5th Conference on IntelligentTransportation Systems, pages 801–809.
[12] Commission, F. C. (2004). Amendments of the commission’s rules regarding dedicatedshort-range communication services in the 5.9 ghz band. Federal CommunicationsCommission Proceedings, pages 10–809.
96 References
[13] Corson, S. and Macker, J. (1999). Mobile ad hoc networking (manet): Routing protocolperformance issues and evaluation considerations", rfc 2501.
[14] Delot, T., Ilarri, S., Cenerario, N., and Hien, T. (2011). Event sharing in vehicularnetworks using geographic vectors and maps. Mob. Inf. Syst., 7:21–44.
[15] Duan, X., Liu, Y., and Wang, X. (2017). Sdn enabled 5g-vanet: Adaptive vehicleclustering and beamformed transmission for aggregated traffic. IEEE CommunicationsMagazine, 55(7):120–127.
[16] George, B. and Kim, S. (2013). Spatio-temporal networks. Database Management andInformation Retrieval.
[17] George, B. and Shekhar, S. (2008). Time-Aggregated Graphs for Modeling Spatio-temporal Networks. Springer Berlin Heidelberg.
[18] Ibrahim, K. (2011). Data aggregation and dissemination in vehicular ad-hoc networksby data aggregation and dissemination in vehicular ad-hoc networks. (4):1–120.
[19] Ibrahim, K., Weigle, M., and Abuelela, M. (2009). p-ivg: Probabilistic inter-vehiclegeocast for dense vehicular networks. In Vehicular Technology Conference (VTC), pages1–5.
[20] Ibrahim, K. and Weigle, M. C. (2008). Cascade: Cluster-based accurate syntacticcompression of aggregated data in vanets. 2008 IEEE Globecom Workshops, GLOBECOM2008, pages 1–10.
[21] Jayapal, C. and Roy, S. (2016). Road traffic congestion management using vanet. InProc. of the International Conference on Advances in Human Machine Interaction (HMI),pages 1–7.
[22] Jochle, T., Wiedersheim, B., Schaub, F., and Weber, M. (2012). Efficiency analysis ofgeocast target region specifications for vanet applications. In Proc. of the Intl. VehicularNetworking Conference (VNC), pages 250–257.
[23] Kaisser, F., Gransart, C., and Berbineau, M. (2012). Simulations of vanet scenarios withopnet and sumo. In Communication Technologies for Vehicles, volume 7266 of LectureNotes in Computer Science, pages 103–112. Springer Berlin Heidelberg.
[24] Kenney, J. (2011). Dedicated short-range communications (dsrc) standards in the unitedstates. 99(7):1162–1182.
[25] Kenney, J. B. (2010). Standards and Regulations, in VANET: Vehicular Applicationsand Inter-Networking Technologies, pages 365–429.
[26] Kheawchaoom, P., Kittipiyakul, S., and Ayutayay, K. S. N. (2012). idtsg time-stablegeocast for post crash notification in vehicular highway networks. In Electrical Engineer-ing/Electronics, Computer, Telecommunications and Information Technology (ECTI-CON),pages 1–4.
[27] Kumar, R. and Dave, M. (2013). A framework for handling local broadcast stormusing probabilistic data aggregation in vanet. Wireless Personal Communications, page315–341.
References 97
[28] Li, X. and Li, H. (2014). A survey on data dissemination in vanets. Chinese ScienceBulletin, 59(32):4190–4200.
[29] Lim, Y., Ahn, S., and Cho, K.-H. (2011). Abiding geocast for commercial ad dissem-ination in the vehicular ad hoc network. In Proc. of the Intl. conference on ConsumerElectronics (ICCE), pages 115–116.
[30] Luo, J., Gu, X., Zhao, T., and Yan, W. (2010). A mobile infrastructure based vanet rout-ing protocol in the urban environment. In Proc. of the Intl. conference on Communicationsand Mobile Computing (CMC), volume 3, pages 432–437.
[31] Maurer, J., Fugen, T., Schafer, T., and Wiesbeck, W. (2004). A new inter-vehiclecommunications (ivc) channel model. In Proc. of the Intl. conference on VehicularTechnology Conference (VTC), pages 9–13.
[32] Mohanty, S. and Jena, D. (2012). Secure data aggregation in vehicular-adhoc networks:A survey. 2nd International Conference on Communication, Computing and SecurityICCCS-2012, 6:922 – 929.
[33] Mouakher, A. and Yahia, S. B. (2016). Qualitycover: Efficient binary relation coverageguided by induced knowledge quality. Information Sciences, 355-356:58–73.
[34] Nadeem, T., Dashtinezhad, S., Liao, C., and Iftode, L. (2004). Trafficview : Traffic datadissemination using car-to-car communication. ACM SIGMOBILE Mobile Computingand Communications Review, (3):1–8.
[35] Rahbar, H., Naik, K., and Nayak, A. (2010). Dtsg: Dynamic time-stable geocast routingin vehicular ad hoc networks. In Proc. of the Inl. 9th IFIP Annual Mediterranean Ad HocNetworking (Med-Hoc-Net), pages 1–7.
[36] Saleet, H., Basir, O., Langar, R., and Boutaba, R. (2011a). Region-based location-service-management protocol for vanets. IEEE Transactions on Vehicular Technology,pages 917–931.
[37] Saleet, H., Langar, R., Naik, K., Boutaba, R., Nayak, A., and Goel, N. (2011b).Intersection-based geographical routing protocol for vanets: A proposal and analysis.IEEE Transactions on Vehicular Technology, pages 4560–4574.
[38] Schwartz, R. S., Scholten, H., and Havinga, P. (2013). A scalable data disseminationprotocol for both highway and urban vehicular environments. EURASIP Journal onWireless Communications and Networking, 2013:1–19.
[39] Sommer, C. and Dressler, F. (2015a). Information Dissemination in Vehicular Networks.In Vehicular Communications and Networks: Architectures, Protocols, Operation andDeployment, pages 75–93.
[40] Sommer, C. and Dressler, F. (2015b). Information Dissemination in Vehicular Networks.In Vehicular Communications and Networks: Architectures, Protocols, Operation andDeployment, pages 75–93. Woodhead.
98 References
[41] Sommer, C., German, R., and Dressler, F. (2011a). Bidirectionally Coupled Networkand Road Traffic Simulation for Improved IVC Analysis. IEEE Transactions on MobileComputing, 10(1):3–15.
[42] Sommer, C., German, R., and Dressler, F. (2011b). Bidirectionally coupled networkand road traffic simulation for improved ivc analysis. IEEE Transactions on MobileComputing, 10:3–15.
[43] Tian, B., Hou, K. M., and Li, J. (2016). Trad: Traffic adaptive data disseminationprotocol for both urban and highway vanets. In Proc. of the Intl. conference on AdvancedInformation Networking and Applications (AINA), pages 724–731.
[44] Tsai, H. W. (2013). Aggregating data dissemination and discovery in vehicular ad hocnetworks. Telecommunication Systems, page 285–295.
[45] Tyagi, S. S. (2013). International Journal of Advanced Research in Computer Scienceand Software Engineering. 3(5).
[46] Wischoff, L., Ebner, A., Rohling, H., Lott, M., and Halfmann, R. (2003). Sotis -a self-organizing traffic information system. In The 57th IEEE Semiannual VehicularTechnology Conference, 2003. VTC 2003-Spring., pages 1–6.
[47] Wisitpongphan, N., Tonguz, O., Parikh, J., Mudalige, P., Bai, F., and Sadekar, V.(2007a). Broadcast storm mitigation techniques in vehicular ad hoc networks. WirelessCommunications, IEEE, 14(6):84–94.
[48] Wisitpongphan, N., Tonguz, O., Parikh, J., Mudalige, P., Bai, F., and Sadekar, V.(2007b). Broadcast storm mitigation techniques in vehicular ad hoc networks. WirelessCommunications, IEEE, 14(6):84–94.
[49] Yamada, A. and Ishihara, S. (2017). Data exchange strategies for aggregating geo-graphical distribution of demands for location-dependent information using soft-statesketches in VANETs. Proceedings - International Conference on Advanced InformationNetworking and Applications, AINA, pages 728–736.
[50] Yeferny, T. and Allani, S. (2018). Mpc: A rsus deployment strategy for vanet. Interna-tional Journal of Communication Systems, 31(12).
[51] Yeferny, T., Arour, K., and Bouzeghoub, A. (2013a). An efficient peer-to-peer semanticoverlay network for learning query routing. In Advanced Information Networking andApplications (AINA), 2013 IEEE 27th International Conference on, pages 1025–1032.IEEE.
[52] Yeferny, T., Arour, K., and Bouzeghoub, A. (2013b). An efficient peer-to-peer semanticoverlay network for learning query routing. In 27th IEEE International Conferenceon Advanced Information Networking and Applications, AINA 2013, Barcelona, Spain,March 25-28, 2013, pages 1025–1032.
[53] Yu, Q. and Heijenk, G. (2008). Abiding geocast for warning message disseminationin vehicular ad hoc networks. In Proc. of the Intl. Communications Workshops (ICCWorkshops), pages 400–404.
References 99
[54] Zekri, D., Defude, B., and Delot, T. (2014). Building , sharing and exploiting spatio-temporal aggregates in vehicular networks. Hindawi Mobile Information Systems, 14:259–285.
[55] Zhang, L., Gao, D., Gao, S., and Leung, V. (2013). Smartgeocast: Dynamic abnormaltraffic information dissemination to multiple regions in vanet. In Proc. of the Inl. onWireless Communications and Mobile Computing Conference (IWCMC), pages 1750–1755.
[56] Zhao, J. and Cao, G. (2006). Vadd : Vehicle-assisted data delivery in vehicular adhoc networks. Proc. Intl. Conference on Computer Communications (INFOCOM), pages1–12.
[57] Zhu, Y., Zhao, Q., and Zhang, Q. (2015). Delay-constrained data aggregation in vanets.IEEE Transactions on Vehicular Technology, pages 2097–2107.
[58] Zongjian, H. and Daqiang, Z. (2017). Cost-efficient traffic-aware data collectionprotocol in vanet. Ad Hoc Networks, 55:28–39.