Embed Size (px)
Citation preview

PHYSICAL REVIEW B 86, 235303 (2012)
Dissecting biexciton wave functions of self-assembled quantum dotsby double-quantum-coherence optical spectroscopy
Benjamin P. Fingerhut,1 Marten Richter,1,2 Jun-Wei Luo,3 Alex Zunger,4,* and Shaul Mukamel1,†1Department of Chemistry, University of California, Irvine, California 92697-2025, USA
2Institut fur Theoretische Physik, Nichtlineare Optik und Quantenelektronik, Technische Universitat Berlin,Hardenbergstr. 36, 10623 Berlin, Germany
3National Renewable Energy Laboratory, Golden, Colorado 80401, USA4University of Colorado, Boulder, Colorado 80309, USA
(Received 24 July 2012; published 5 December 2012)
Biexcitons feature prominently in various scenarios for utilization of quantum dots (QDs) for enhancing theefficiencies of solar cells, and for the generation of entangled photon pairs in single QD sources. Two-dimensionaldouble quantum coherence (2D-DQC) nonlinear optical spectra provide novel spectroscopic signatures of suchstates beyond global intensity and lifetime characteristics which are available by more conventional techniques.We report the simulation of a prototype 2D-DQC optical experiment of a self-assembled InAs/GaAs dot. Thesimulations consider the QD in different charged states and are based on a state-of-the-art atomistic many-bodypseudopotential method for the calculation of the electronic structure and transition dipole matrix elements.Comparison of the spectra of negatively charged, neutral, and positively charged QD reveals optical signatures oftheir electronic excitations. This technique directly accesses the biexciton (XX) energies as well as the projectionsof their wave functions on the single-exciton manifold. These signals also provide a unique tool for probing thecharged state of the QD and thus the occupation of the quantum state. Signatures of Pauli blockade of the creationof certain single and two excitons due to charges on the particles are observed. For all quantum states of the QD,the spectra reveal a strong multiconfiguration character of the biexciton wave functions. Peak intensities can beexplained by interference of the contributing Liouville space pathways.
DOI: 10.1103/PhysRevB.86.235303 PACS number(s): 78.47.jh, 73.21.La
I. INTRODUCTION
The confined electronic space created by matrix-embeddedquantum dots often leads to the association of single excitonsinto exciton complexes. The existence of such natural com-plexes has led to the proposal of numerous schemes for theirutilization in solar cells1,2 (multiple excitons generated from asingle electron-hole pair via inverse Auger process), quantumcomputing,3–11 entangled photons (created from a cascadedecay of biexciton and monoexciton)8,9,11,12 and “on-demand”single photon emitters,5–7 which realize a light source that,upon a trigger event, emits one and only one photon withina short time interval. Self-assembled dots represent artificialmacromolecules of molecular weight ≈1 000 000, correspond-ing, for example, to simple covalent semiconductors suchas InAs embedded seamlessly in GaAs matrix.13,14 As aresult of the confinement of both InAs electrons and holesby the GaAs barrier, the electron Coulomb interaction andelectron correlations are enhanced in such zero-dimensional(0D) QDs with respect to 2D quantum wells and 1D quantumwires. Such self-assembled QDs represent a special casewhere multiexcitons made of Ne electrons and Nh holes(including neutral Ne = Nh as well as charged multiexcitons)are readily formed and decay radiatively, surviving many of thenonradiative decay channels that rapidly destroy multiexcitonsin colloidal QDs.2,15 They are thus a natural laboratory forstudying optical and electronic features of interacting excitons.These appear in a series of charged and neutral states asfollows: Xq and XXq correspond to QDs with Ne electronsand Nh holes and charge q = Nh − Ne. A neutral monoexciton(Nh = Ne = 1) is denoted X0, positively charged monoexciton(Nh = 2,Ne = 1) is X+ and negatively charged monoexciton
(Nh = 1,Ne = 2) is X−, whereas neutral biexciton (Nh =Ne = 2) is XX0, positively charged biexciton (Nh = 3,Ne =2) is XX+, and negatively charged biexciton (Nh = 2,Ne = 3)is XX−. The transition from the ground state manifold Gq [weconsidered neutral (no unpaired electron e or hole h (0,0)),negatively charged (an additional unpaired e in the QD (0,1))and positively charged QD (an additional unpaired h in theQD (1,0))] into the single-exciton manifold Xq generates anadditional electron-hole pair in the respective charged QDs,characterized by the transitions G0 = (0,0) → X0 = (1,1),G− = (0,1) → X− = (1,2), and G+ = (1,0) → X+ = (2,1).Accordingly, monoexciton to biexciton transitions appear asXX0 = (2,2) → X0 = (1,1); XX+ = (3,2) → X+ = (2,1);XX− = (2,3) → X− = (1,2) (the charged state q is the samein both monoexciton and biexciton manifolds).
Linear spectra of self-assembled semiconductor QDs showin high resolution, a series of multiexciton transition peaks ob-served with ultra high resolution with zero-phonon linewidthless than 10 μeV at low temperature (T = 4 K).16 Theabsorption and emission spectra of single- and multiexci-tons encode information about the Coulomb interactionsbetween carriers, such as exchange and correlation effectsand thus reveal many-particle physics in confined spaces.17
Nevertheless, information about homogeneous widths or two-quantum coherence induced by many-body effects can not beaccessed by linear one-dimensional (1D) techniques. Coherenttwo-dimensional (2D) optical spectroscopic techniques likedouble quantum coherence (DQC) or photon echo becameexperimentally feasible in the last decade.18–21 These canunfold complex and highly congested spectra by spreadingthem in two dimensions as is done in NMR.22–24 Third-order
235303-11098-0121/2012/86(23)/235303(10) ©2012 American Physical Society
FINGERHUT, RICHTER, LUO, ZUNGER, AND MUKAMEL PHYSICAL REVIEW B 86, 235303 (2012)
2D spectra carry information about the mono- (Xq) and thebiexciton (XXq) manifold beyond what can be inferred fromlinear spectroscopy: for example, the 2D-DQC techniquecorrelates biexciton states XXq to the constituent monoexcitonXq , and thus offers a direct probe of the XXq energy andcomposition. The phase relations between interfering quantumpathways of the density matrix define the 2D-DQC signalintensity,25 beyond the interaction of light with a singletransition moment.26
In a typical coherent 2D third-order DQC experiment theQD interacts with a sequence of four (femtosecond and phasestable) laser pulses, the first two with wave vectors k1 and k2excite the QD and induce a polarization that oscillates at thefrequency of the biexciton manifold XXq ; after a waiting timet2, the third pulse with wave vector k3 acts as a probe anddeexcites the biexciton manifold XXq to the single excitonmanifold Xq . The fourth pulse k4 is used for heterodynedetection, which allows to record frequency, amplitude andphase information of the optical high frequency signal. The2D-DQC technique offers the advantage that the biexcitonenergies XXq show up directly as resonances along the �2 axisand are thus directly accessible. Due to the third interaction k3the XXq states are projected on the Xq manifold along the �3
axis giving a direct probe of the XXq-Xq correlations.27,28
This feature of 2D-DQC reveals high-order electron andhole correlations not accessible by linear spectroscopy. Thetemporal control of the pulses and detection of the signalS
(3)kIII
in the direction kIII = +k1 + k2 − k3 reduces the numberof contributing Liouville space pathways to two purelyexcited state absorption (ESA) type contributions comparedto frequency domain techniques.16,22,29,30 Compared to othercoherent 2D third-order techniques, like, e.g., the photon echotechnique, the DQC technique has the advantage that thebiexciton energies XXq are directly accessible, whereas inphoton echo spectroscopy excited state emission and ground-state bleach contribute to the signal together with excitedstate absorption components. In bulk assemblies of QDs, thekIII signal can be observed in the direction +k1 + k2 − k3(phase matching condition). Single-dot signals are isotropic.Nevertheless, the kIII signal can be extracted by using a waveguide geometry16 and by repeating the experiment severaltimes with different phases ϕl of the various pulses. Thisprocedure, commonly used in 2D-NMR, is known as phasecycling.
Alternatively, the detection of emission induced by asequence of four phase controlled pulses yields similar in-formation about quantum pathways31–35 in ensembles33,34,36,37
and even in single molecules.38 This alternative DQC phasemodulated fluorescence (DQC-PM-Fl) experiment containscomparable information as obtained from the third-ordercoherent technique DQC, a detailed deviation can be found inRef. 35. In PM-Fl techniques, one additional ladder diagramcontributes to the fourth-order signal, moreover, the signs ofthe interfering pathways vary.34 In an ideal coherent DQC-PM-Fl experiment, the quantum yield of photon emission fromthe XXq state reaches a value of two (|XXq〉 → |Xq〉 →|Gq〉) and no nonradiative decay (like nonradiative Augerdecay) of the XXq biexciton manifold occurs. In this case,the DQC-PM-Fl signal with phase �III = φ1 + φ2 − φ3 − φ4
equals the third-order DQC signal. Unavoidable nonradiative
decay processes lead to differences in the DQC-PM-Fl andthird-order DQC spectra and reveal information about the XXq
population and quantum yield. Due to the unique photolumi-nescence properties of QDs,39 DQC-PM-Fl may serve as apromising alternative to third-order coherent techniques, thespectrally resolved ESA contributions of the 2D-DQC signalof the QDs would allow to record the different pathwaysindependently.
Here, we report the theoretical simulation of the 2D-DQCsignal of single InAs/GaAs QD carrying different charges.Such dots contain a few million atoms (dot + matrix) sotheir electronic structure requires special techniques. Forthe electronic structure of the QD, we use a high-levelatomistic many-body pseudopotential method.17,39–43 We willdemonstrate that the DQC technique provides a sensitivetool for characterizing the charged state. We observe clearsignatures of Pauli-blocking due to partially occupied electronor hole states in the charged QD. Furthermore, the 2D-DQCsignal reveals correlations between excitons (also called high-order electron correlations), which are impossible to observein linear spectroscopy allowing the analysis of XXq stateswith regard to their constituent Xq manifold. In all differentquantum states, the spectra reveal strong electron correlationdue to geometric confinement within the dot, evidenced bythe fact that the energy of XXq states is reduced with respectto the sum of contributing Xq states. The characteristic Xq
manifold pattern reflects the multiconfiguration character ofthe XXq wave functions. Peak intensities are explained by theinterference of the contributing quantum pathways beyond asimple transition dipole analysis.
II. THEORETICAL METHODS
A. Atomistic many-body calculations
As specific system we consider a lens-shaped InAs/GaAsself-assembled QD with a circular base size of 25-nmdiameter and 2-nm height sitting on one monolayers of“wetting layer” [see Fig. 1(a)]. It contains 41 776 atoms andthe matrix contains 1 948 880 atoms. The lattice mismatchbetween InAs and GaAs induces a built-in strain in theInAs/GaAs dot. An atomistic valence force field model isused to relax the atomic position r in order to minimizethe strain energy.42 Given the relaxed atomic positions, wecalculate the energy levels and wave functions using atomisticmany-body pseudopotential method40,42,43 in two steps. Thefirst step is to obtain single-particle approximated (withoutmany-body interaction) energy levels {εi} and wave func-tions {�i(r)} by solving the Schrodinger equation of crystal(dot+matrix) potential V (r) in a linear combination of bulkbands method.41,42 The screened potential V (r) is describedas a superposition of overlapping atomic (pseudo) potentialscentered at the atomic positions: V (r) = ∑
n
∑α vα(r − Rn −
dα), where vα(r − Rn − dα) pertains to atom type α at sitedα in the nth primary cell Rn. Thus the correct atomicallyresolved symmetry is retained for the eigenstates.44–46 Theatomic potentials vα were empirically fit to experimental bulkquantities:42 transition energies, spin-orbit splittings, effectivemasses, and deformation potentials as well as the band offsetsof two materials in a heterostructure. This approach cures
235303-2

DISSECTING BIEXCITON WAVE FUNCTIONS OF SELF- . . . PHYSICAL REVIEW B 86, 235303 (2012)
-0.5
0.0
0.5
1.0
1.5
2.0
Ene
rgy
(eV
)
HH
EL
LHSO
e0
h0
e = 1.233 eV (85% D)3
e = 1.234 eV (86% D)4
e = 1.170 eV (91% P)1
e = 1.110 eV (93% S)0
e = 1.172 eV (91% P)2
h = 0.000 eV (90% S)0
h = −0.018 eV (85% P)1
h = −0.025 eV (85% P)2
h = −0.033 eV (78% D)3
h = −0.041 eV (72% S)4
h = −0.045 eV (71% D)5e = 1.239 eV (80% D)5
(a) Dot geometry Hole statesElectron states
(c) QD states
(b) Energy levels in QD
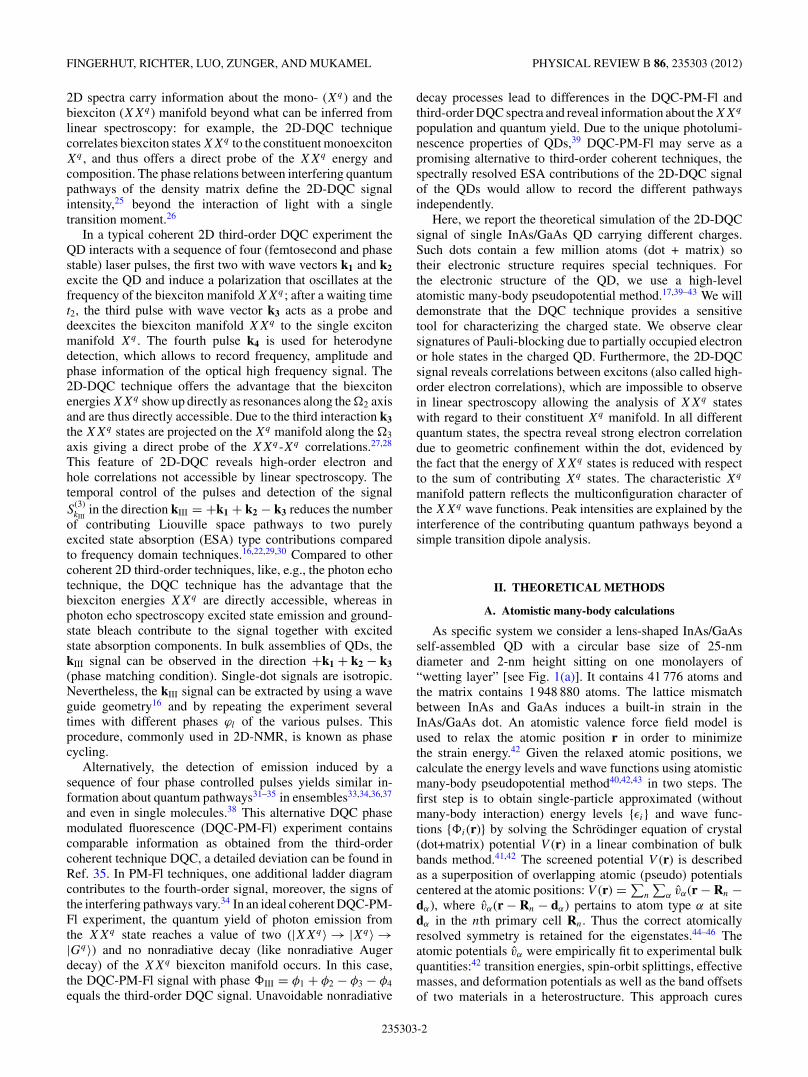
FIG. 1. (Color online) (a) Schematic of a lens-shaped InAs dotwith base of 25 nm and 2 nm heigh, sitting on one monolayer wettinglayer, embedded in a GaAs matrix. The dot contains 41 776 atoms andthe matrix contains 1 948 880 atoms. (b) The corresponding strainmodified band edge alignment of electron band (EL), heavy-hole(HH), light-hole (LH), and spin-orbit split (SO) bands. The atomisticpseudopotential method calculated lowest 10 electron (e0,e1, . . . ,e9)and top 10 hole (h0,h1, . . . ,h9) levels of the QD are shown in blacklines. (c) Wave-function square of six lowest energy single-particleelectron states and six highest hole states. The percentage of itsdominant orbital character (S, P , and D) and its energy with respectto h0 are given underneath the corresponding wave-function plot.
the well-documented DFT band gap and effective mass errorsand captures the multiband and intervalley couplings. Thewave functions are expanded by a set of plane waves witha small energy cutoff Ecut = 5 Ry (68.03 eV). The solvedsingle-particle QD states are shown in Figs. 1(b) and 1(c):the ground electron state e0 is S-like followed by two P -likeand three D-like electron states, whereas the S-like groundhole state h0 is followed by two P -like and then one S-likestate inserts into the three D-like states. The reduced weightof the dominant orbital contribution (S, P , and D) of holestates (compared to the respective electron states) shows thatthe interorbital (e.g., S-P ) coupling is stronger in hole statesthan in electron states.
The second step is to calculate the many-body excitonicstates {εi,�i} using a screened configuration interaction(CI) method40 in a basis set of Slater determinants {�v,c}constructed from 12 electron and 12 hole single-particle states(including spin) for the InAs/GaAs QD. The electron corre-lations, which play a predominant role in multidimensionalquantum coherent spectra, are taken into account by theconfiguration interaction. The interaction consists of electron-hole (e-h) Coulomb interaction (binding the e-h pair and thusforming the exciton) and e-h exchange interaction (splitting
symmetry-different exciton states). The many-body excitonproblem is set up in a basis set of Slater determinants as a CIexpansion,40
〈�v,c|H |�v′,c′ 〉 = (εc − εv)δv,v′δc,c′ − Jvc,v′c′ + Kvc,v′c′ ,
(1)
where J and K are the Coulomb and exchange integrals:
Jvc,v′c′ =∑σ1,σ2
∫∫�∗
v (r1,σ1)�∗c (r2,σ2)�v′(r1,σ1)�c′ (r2,σ2)
ε(r1,r2) |r1 − r2|× d r1d r2, (2)
Kvc,v′c′ =∑σ1,σ2
∫∫�∗
v (r1,σ1)�∗c (r2,σ2)�c′(r1,σ1)�v′(r2,σ2)
ε(r1,r2) |r1 − r2|× d r1d r2. (3)
The size-dependent screening function ε(r) for Coulomband exchange integrals is calculated following the micro-scopic model of Resta40 and exhibits a smooth transitionfrom unscreened at short range to screened at long range.This approach naturally includes both long- and short-rangeexchange.47,48 Once the many-body wave functions of multi-excitons are solved from above equations, the dipole transitionmatrix elements will be readily obtained. The linear absorptionspectra, calculated according to Fermi’s golden rule with abroadening parameter γ = 1 meV, of transitions G0 = (0, 0)→ X0 = (1, 1), G− = (0, 1) → X− = (1, 2), and G+ = (1,0) → X+ = (2, 1) are shown in Figs. 2(a)–2(c), respectively.Earlier calculations of photoluminescence spectra for differentexciton charges of this QD reproduce well the experimentalmeasurement by Warburton’s group.39
B. 2D double quantum coherence (2D-DQC) spectra
The simulation of the 2D-DQC spectra starts with theconstruction of an effective three band exciton Hamiltonian,used for the calculation of the third-order optical response.The relevant exciton states accessed by the 2D-DQC techniqueare the ground-state manifold Gq , the single-exciton manifoldXq as well as the biexciton manifold XXq (with q = 0, +,and − for the neutral, positively charged, and negativelycharged QD, respectively). The three different manifolds ofstates, obtained from the atomistic many-body calculationsupon diagonalization of the CI Hamiltonian are connected bythe respective dipole transition matrix elements μi,j . The totalHamiltonian has the form
H = H0 + HeL, (4)
H0 =∑Gq
εGq |Gq〉〈Gq | +∑Xq
εXq |Xq〉〈Xq |
+∑XXq
εXXq |XXq〉〈XXq |, (5)
HeL =∑
Gq,Xq
E(t) · μGq,Xq |Gq〉〈Xq | (6)
+∑
Xq,XXq
E(t) · μXq,XXq |Xq〉〈XXq | + c.c.,
where H0 describes the isolated dot and HeL is the interactionbetween quantum states of the isolated dot with the optical
235303-3

FINGERHUT, RICHTER, LUO, ZUNGER, AND MUKAMEL PHYSICAL REVIEW B 86, 235303 (2012)
1.05 1.10 1.15 1.20 1.25 1.30
Abs
orpt
ion
(arb
. uni
t)
Energy (eV)e 2
h 1
D D channel
e 0h 4
e 0h 0
S S
e 1h 1
e 2h 2
P P channel
e 3h 3
e 4h 3
e 4h 5
1.05 1.10 1.15 1.20 1.25 1.30
Abs
orpt
ion
(arb
. uni
t)
Energy (eV)
1.05 1.10 1.15 1.20 1.25 1.30
Abs
orpt
ion
(arb
. uni
t)
Energy (eV)
(Nh =
1, Ne =
1)(N
h =1, N
e =2)
(Nh =
2, Ne =
1)
(b)
(c)
(a)
FIG. 2. (Color online) Many-body atomistic pseudopotentialmethod calculated linear absorption spectra of the InAs/GaAs dot:(a) G0 = (Nh = 0,Ne = 0) → X0 = (Nh = 1,Ne = 1), (b) G− =(Nh = 0,Ne = 1) → X− = (Nh = 1,Ne = 2), and (c) G+ = (Nh =1,Ne = 0) → X+ = (Nh = 2,Ne = 1) transitions. The inserts showthe corresponding dominant configuration of main peaks.
field. In the case of negatively or positively charged QDs, theground-state manifold Gq has several states, in all simulationswe assume that the QD is initially in the lowest-energystate G
q
0 . The energy range of the Xq and XXq manifoldis chosen to cover the energy range of the Pe − Ph channel(εXq,max = 1.19 eV, see below Fig. 2) for Gq → Xq transitionsand εXXq,max ≈ 2.31 eV for the Gq − XXq total energy range.In total, we consider 144 X0 and 4356 XX0 states, 500 X+and X− and 1000 XX+ and XX− states. Together with theconsidered Gq manifold (12 states), this gives rise to 6 × 10⁷
different transitions for the calculation of the 2D-DQC signal.We consider a time-domain 2D-DQC experiment where a
sequence of four (femtosecond and phase stable) laser pulses(E1,E2,E3, and E4) interacts with the QD [see Fig. 3(a,i)],the first pulse E1 excites the QD into a |Xq〉〈Gq | coherenceof the density matrix during the waiting time t1; the secondpulse E2 accesses the biexciton manifold XXq and createsa |XXq〉〈Gq | coherence during t2 [see Fig. 3(a,ii)]. Thethird pulse E3 acts as a probe, projecting the biexcitonsXXq on the single exciton manifold Xq , the fourth pulseE4 is used for heterodyne detection, which allows to recordfrequency, amplitude, and phase information of the opticalsignal S
(3)kIII
(t3,t2,t1). The temporal control of the pulses andthe phase matching condition kIII = +k1 + k2 − k3 reducesthe number of contributing pathways to two excited state
absorption (ESA) type contributions:24
S(3)kIII
(t3,t2,t1) = S(ESA1)kIII,i
(t3,t2,t1) − S(ESA2)kIII,ii
(t3,t2,t1). (7)
Both ladder diagrams are depicted in Figs. 3 (a,iii) and3(a,iv). The signal S
(3)kIII
(t3,t2,t1) depends on three controlleddelay periods t1, t2, t3. The frequency domain 2D-DQC signalis obtained by a double Fourier transform with respect to twotime intervals holding the third fixed. Since the most interestingbiexciton dynamics is contained in t2, we chose to correlate iteither with t1 [S(3)
kIII(t3,�2,�1)] or with t3 [S(3)
kIII(�3,�2,t1)]. The
S(3)kIII
(�3,�2,t1) signal with fixed t1 and transformed t2 and t3 to�2 and �3 is easier to measure since it only requires to scan asingle delay (t2), the t3 information is revealed by dispersion ina spectrometer. The 2D-DQC technique offers the advantagethat the biexciton energies XXq show up directly as resonancesalong the �2 axis and are thus directly accessible.28 Due tothe third interaction k3 the XXq states are projected on the Xq
manifold along the �3 axis.The 2D-DQC signals S
(3)kIII
(t3,�2,�1) and S(3)kIII
(�3,�2,t1)are simulated using sum-over-states expressions of the third-order nonlinear response23,27 (expressions are given in theAppendix). The signals involve the summation over allpossible transitions between the different blocks of the threeband exciton Hamiltonian H0, namely, from the ground-statemanifold Gq to the single-exciton manifold Xq , and from Xq
to the biexciton manifold XXq . All transitions are weightedby the respective transition matrix elements μGq,Xq andμXq,XXq . The same phenomenological dephasing linewidth ofγ = 1 meV as used in the calculation of linear spectroscopyis assumed for all exciton transitions, reflecting the widthof sidebands of the QDs due to acoustical phonons16,49–52
and the similar radiative exciton lifetimes of single- andbiexcitons in single QD.53,54 In contrast to colloidal QDs, insingle self-assembled QD, the inhomogenous broadening isabsent49 and thus neglected in the calculations. If required, itcan be added subsequent to the calculation of the third-orderresponse function.55 In all calculated spectra, we assume thatthe bandwidth of the laser pulses is broader than the excitonband (exciton bandwidth from Se − Se to Pe − Pe is on theorder of 100 meV). To acquire this bandwidth, the requiredlaser pulses have to be shorter than 18 fs (FWHM), centeredaround 1.12 eV (1107 nm). The broad bandwidth allows us tocover a large area of contributing exciton states and to revealthe relevant physical correlation between them in a singlemeasurement. However, the same information can be obtainedby a series of measurements with narrower bandwidth andvarious color pulses.
III. RESULTS AND DISCUSSION
A. Optical absorption spectra of neutral and charged QDs
Figure 2(a) depicts the stick spectrum together withabsorption spectrum of the transition G0 = (0,0) → X0 =(1,1) in a neutral QD. The corresponding spectra of thenegatively charged [G− = (0,1) → X− = (1,2)] and positivelycharged QD [G+ = (1,0) → X+ = (2,1)] are shown inFigs. 2(b) and 2(c). In the energy range ω = 1.05–1.32 eV,the neutral QD absorption spectrum shows several resonances,which can be characterized by the angular momentum of the
235303-4

DISSECTING BIEXCITON WAVE FUNCTIONS OF SELF- . . . PHYSICAL REVIEW B 86, 235303 (2012)
FIG. 3. (Color online) (a) Schematic of a 2D double quantum coherence (DQC) experiment: in (i) the phase matching direction of thepulses is indicated. (ii) Successive interactions induce a polarization in the QD, which oscillates at the frequencies of |Xq〉〈Gq | and |XXq〉〈Gq |coherences during the waiting times t1 and t2. (iii) and (iv) Relevant ladder diagrams for the 2D-DQC signal. (b)–(d) Simulated 2D doublequantum coherence signals S
(3)kIII
(t3,�2,�1) of a neutral (b), negatively (c), and positively charged quantum dot (d). The DQC signal is depictedas absolute value on a nonlinear scale defined by Eq. (8) [see dashed line in (b)], t3 = 100 fs.
envelope wave functions. The dominant orbital configurationof the many-body CI states to an electron-hole state ei − hj
are presented in Fig. 1(c), sorted with increasing angularmomentum of the envelope wave functions of electron ei andhole states hj .
The lowest energy exciton transition (ω = 1.08 eV) con-sists of the single-exciton Se − Sh channel, where both electronand hole states have spherical symmetry (ei − hj = e0 − h0).Due to the additional spin degree of freedom and the spinselection rule this transition is double degenerate. This channelcorresponds to transitions between states with S-like wavefunctions [see Fig. 1(c), top]. The exciton Pe − Ph channel(ω = 1.16–1.18 eV) consists of two orthogonal P -like statesin both electron and hole [see Fig. 1(c), middle]. Additionally,two-fold degeneracy due to the spin has to be taken into ac-count. The higher energy, symmetry allowed De − Dh channelsplits into three main peaks in the linear absorption spectrum[ω = 1.24–1.27 eV, Fig. 1(c), bottom], which are composedof e3 − h3, e4 − h3, and e4 − h5 transitions, respectively. Thetransition ei − ej = e0 − h4; (ω = 1.13 eV) lies between theSe − Sh and Pe − Ph states and shows only weak transitionstrength.
In both, the negatively charged QD [G− = (0,1) → X− =(1,2)] [see Fig. 2(b)] and the positively charged QD [G+ =(1,0) → X+ = (2,1)] [see Fig. 2(c)] the oscillator strength ofthe lowest energy Se − Sh transition is reduced compared toPe − Ph. The number of possible transitions is reduced by afactor of two relative to the neutral QD. The additional electronin the negatively charged QD (0h,1e) occupies one of the spindegenerate e0 states, in the positively charged QD (1h,0e)the additional hole occupies one of the two spin degenerateS-like h0. The transitions of the e0 − h4 channel are shiftedtowards higher energies in the negatively charged QD (�ω =0.02 eV), in the positively charged QD the e0 − h4 transitionsare split into two weak resonances [see Fig. 2(c)]. The Pe − Ph
and De − Dh transitions with doublet structure in the neutralQD are split into several different states in the negatively andpositively charged QD. Due to the odd population pattern ofelectron or hole states in the charged QDs the degeneracy ofthe exciton states is lifted and several distinct exciton statescontribute to the absorption. For all three different quantumstates of the QD, we note that only a few discrete states out ofthe joint density of states of a strongly anharmonic oscillatorcontribute to the linear absorption. Of all possible Gq → Xq
235303-5

FINGERHUT, RICHTER, LUO, ZUNGER, AND MUKAMEL PHYSICAL REVIEW B 86, 235303 (2012)
transitions (144 for X0 and 500 for X+/−) only a few possessubstantial transitions strength due to the selection rules of QDtransitions.56
B. 2D double quantum coherence (2D-DQC) spectraof neutral and charged QDs
The 2D-DQC technique correlates biexciton states XXq
to the constituent monoexciton Xq and thus offers a directprobe of the XXq energy and composition. We start withthe S
(3)kIII
(t3,�2,�1) signal that shows |Xq〉〈Gq | resonancesalong �1 and |XXq〉〈Gq | resonances along �2. Accordingly,the Xq doorway states to a specific XXq state and thehigh-order correlations between the Xq monoexcitons arerevealed.
The absolute value of S(3)kIII
(t3,�2,�1) signals of the neutral(q = 0), the negatively charged (q = −) and the positivelycharged (q = +) QD are depicted in Figs. 3(b)–3(d) in theenergy range 1.05 eV < �1 < 1.20 eV and 2.16 eV < �2 <
2.26 eV. Horizontal dashed lines indicate a specific biexcitonresonance XXq , whereas respective vertical dashed linesindicate the projection on the single-exciton axis. The signalsare depicted on a nonlinear scale:
arcsinh(S) = ln(S +√
1 + S2), (8)
with S = 10abs(S)/S(N), where S(N) is a real normalizationconstant and S correspond to the 2D-DQC signal S
(3)kIII
onthe linear scale. This representation highlights both weakand strong signal components since it interpolates between alinear and a logarithmic scales. In Fig. 3(b), top the nonlinearsignal intensity arcsinh(S) is depicted as a dashed line andcompared with the linear scale for the absorption signal of theneutral QD.
For the neutral QD [see Fig. 3(b)], four XX0 = (2,2)resonances along the �2 axis are identified in the investigatedenergy range. The lowest-energy XX0 resonance at �2 =2.165 eV shows contributions only from the Sh − Se channelalong the �1 axis reflecting the two-fold degeneracy of thisstate. Accordingly, the XX0 state composition arises from theproduct of two S-like X0 = (1,1) excitons. A comparison withthe charged QDs [see Figs. 3(c) and 3(d)] shows that this lowestenergy XX0 resonance only appears in the neutral QD. Thesingle electron (hole) in the S configuration of the chargedQDs induces a Pauli blockade and prohibits the creation ofthe XX− = (2,3) and XX+ = (3,2) only from the Sh − Se
channel. For the neutral QD, the weak XX0 resonance at�2 = 2.215 eV shows contributions from the e0 − h4 channeland the S-like X0 excitons. The composition of the prominentXX0 resonance at �2 = 2.241 eV is more complex withcontributions from Se − Sh, e0 − h4, and Pe − Ph channelsrevealing the multiconfiguration character of this XX0 wavefunction and the strong high-order electron correlations. Thehighest-energy XX0 state with low intensity (�2 = 2.25 eV)arises from contributions of the high-energy duplet of thePe − Ph and the Se − Sh transitions.
For the negatively charged QD, the lowest energy XX−resonance (�2 ≈ 2.24 eV) shows contributions from theSe − Sh, the e0 − h4 and the Pe − Ph channels. Comparedto the neutral QD, the XX−1 resonance is shifted towards
lower �2 frequencies (2.237 versus 2.241 eV). In thenegatively charged QD, the single-exciton X−1 configura-tion of the Se − Sh channel is dominant, whereas in theneutral dot single-exciton X0 configurations of the Se − Sh
and Pe − Ph channels contribute with similar magnitude.At higher energies (�2 ≈ 2.25 eV), two additional XX−resonances show up in the negatively QD arising predomi-nantly from the Pe − Ph channels, Se − Sh contributions areminor.
A characteristic signature is found for the positively chargedQD [see Fig. 3(d)] due to the splitting of the e0 − h4 channel,leading to a duplet of XX+1 states (�2 ≈ 2.21 eV) withadditional contributions from Se − Sh. At higher energies(�2 = 2.24–2.26 eV), two prominent XX+1 states with strongmulticonfiguration character of single excitons X−1 from thePe − Ph, e0 − h4, and Se − Sh channels appear. From theabove discussion, we have demonstrated that the 2D-DQCspectra of neutral, negatively and positively charged QDsallow to distinguish uniquely between the quantum statesof the QD by the presence and composition of the XXq
resonances.In the S
(3)kIII
(�3,�2,t1) signal, both |XXq〉〈X′q | and|X′q〉〈Gq | coherences are contained along the �3 axis, whichcomplicates the spectra and analysis. Complementary informa-tion about the biexcitons is contained in the (�3,�2) spectra.18
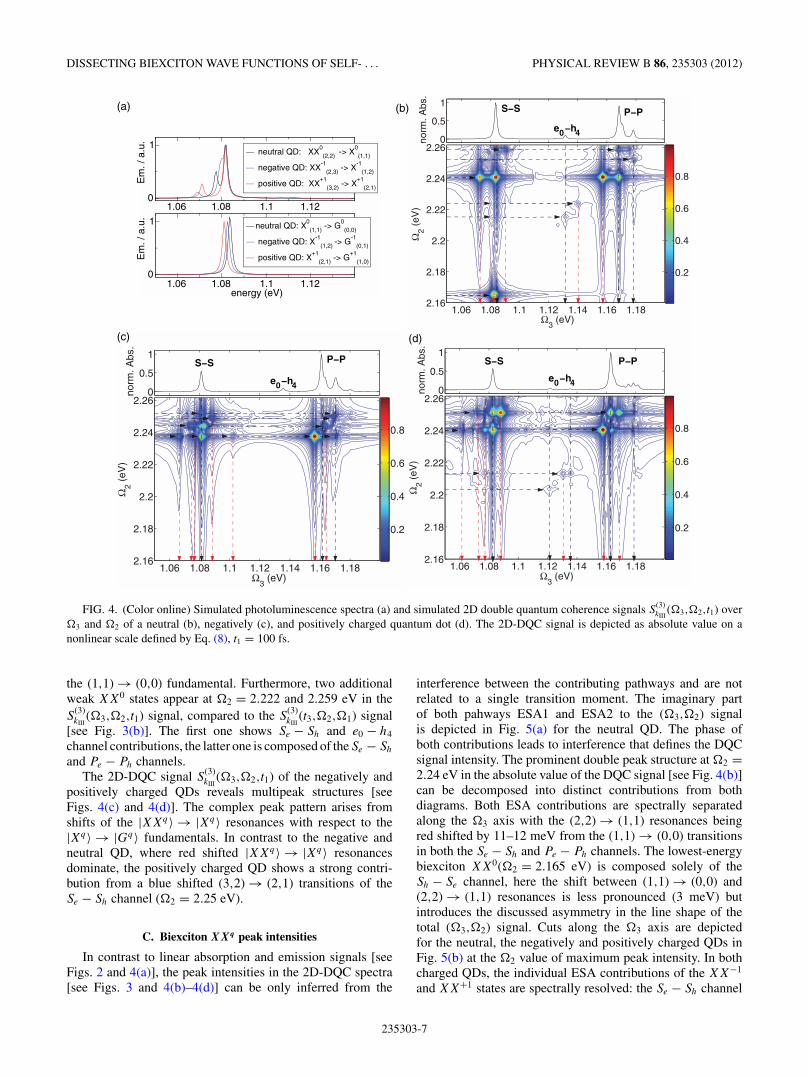
The 2D-DQC signal S(3)kIII
(�3,�2,t1) is depicted for the neutral,the negatively charged and the positively charged QD inFigs. 4(b)–4(d), respectively. Here, along �3 monoexcitontransitions (|Gq〉 → |Xq〉) together with mono to biexcitontransitions (|Xq〉 → |XXq〉) are revealed. The additionalinformation contained in this signal representation becomesevident from the photoluminescence of the monoexciton Xq
and biexciton XXq channels of the QDs [see Fig. 4(a)]. Theemission occurs from the ground state of either Xq or XXq
states, respectively. The detuning of the transition |XXq〉 →|Xq〉 with respect to |Xq〉 → |Gq〉 reveals partial informationabout the XXq manifold of the QDs [see black, red, and bluelines in Fig. 4(a)]. In the 2D-DQC signal, the QD densitymatrix is in a |XXq〉〈Xq | or |Xq〉〈Gq | coherence during t3[see diagrams (i) and (ii) in Fig. 3(a)]. Accordingly, bothωXXq,Xq and ωXq,Gq resonances appear along the �3 axis of theS
(3)kIII
(�3,�2,t1) signal, the contribution of states is not restrictedto the ground state of the XXq , Xq , and Gq manifold, just bythe laser pulse bandwidth. The detuning from the |Xq〉 → |Gq〉fundamentals is reflected in the |XXq〉 → |Xq〉 resonances.The horizontal dashed lines in Figs. 4(b)–4(d) indicate a spe-cific biexciton resonance XXq . The respective black verticaldashed lines indicate the projection on the monoexciton axisrevealing the |Xq〉 → |Gq〉 contributions, whereas red verticaldashed lines highlight the |XXq〉 → |Xq〉 contributions toS
(3)kIII
(�3,�2,t1).In the neutral QD [see Fig. 4(b)], we identify a minor shift
and peak shape asymmetry for the lowest energy XX0 (�2 =2.165 eV) along the �3 axis due to a detuning of the Se −Sh (2,2) → (1,1) channel from the Se − Sh (1,1) → (0,0)fundamental transitions. The prominent XX0 resonance (�2 =2.24 eV) shows a characteristic double peak structure in the(�3,�2) signal representation. The (2,2) → (1,1) transitionsof both the Se − Sh and Pe − Ph channels are red shifted from
235303-6
DISSECTING BIEXCITON WAVE FUNCTIONS OF SELF- . . . PHYSICAL REVIEW B 86, 235303 (2012)
1.06 1.08 1.1 1.12 1.14 1.16 1.180
0.5
1
norm
. Abs
.
Ω3 (eV)
Ω2 (
eV)
1.06 1.08 1.1 1.12 1.14 1.16 1.182.16
2.18
2.2
2.22
2.24
2.26
0.2
0.4
0.6
0.8
1.06 1.08 1.1 1.12
1.06 1.08 1.1 1.12
0
1neutral QD: XX
0(2,2) -> X
0(1,1)
negative QD: XX-1
(2,3) -> X-1
(1,2)
positive QD: XX+1
(3,2) -> X+1
(2,1)
0
1 neutral QD: X0(1,1) -> G
0(0,0)
negative QD: X-1
(1,2) -> G-1
(0,1)
positive QD: X+1
(2,1) -> G+1
(1,0)
1.06 1.08 1.1 1.12 1.14 1.16 1.180
0.5
1
norm
. Abs
.
Ω3 (eV)
Ω2 (
eV)
1.06 1.08 1.1 1.12 1.14 1.16 1.182.16
2.18
2.2
2.22
2.24
2.26
0.2
0.4
0.6
0.8
1.06 1.08 1.1 1.12 1.14 1.16 1.180
0.5
1
norm
. Abs
.
Ω3 (eV)
Ω2 (
eV)
1.06 1.08 1.1 1.12 1.14 1.16 1.182.16
2.18
2.2
2.22
2.24
2.26
0.2
0.4
0.6
0.8
e −h0 4
(a) (b)
(c) (d)
S−S P−P P−PS−S
S−S
e −h
P−P
0 4e −h0 4
Em
. / a
.u.
Em
. / a
.u.
energy (eV)
FIG. 4. (Color online) Simulated photoluminescence spectra (a) and simulated 2D double quantum coherence signals S(3)kIII
(�3,�2,t1) over�3 and �2 of a neutral (b), negatively (c), and positively charged quantum dot (d). The 2D-DQC signal is depicted as absolute value on anonlinear scale defined by Eq. (8), t1 = 100 fs.
the (1,1) → (0,0) fundamental. Furthermore, two additionalweak XX0 states appear at �2 = 2.222 and 2.259 eV in theS
(3)kIII
(�3,�2,t1) signal, compared to the S(3)kIII
(t3,�2,�1) signal[see Fig. 3(b)]. The first one shows Se − Sh and e0 − h4
channel contributions, the latter one is composed of the Se − Sh
and Pe − Ph channels.The 2D-DQC signal S
(3)kIII
(�3,�2,t1) of the negatively andpositively charged QDs reveals multipeak structures [seeFigs. 4(c) and 4(d)]. The complex peak pattern arises fromshifts of the |XXq〉 → |Xq〉 resonances with respect to the|Xq〉 → |Gq〉 fundamentals. In contrast to the negative andneutral QD, where red shifted |XXq〉 → |Xq〉 resonancesdominate, the positively charged QD shows a strong contri-bution from a blue shifted (3,2) → (2,1) transitions of theSe − Sh channel (�2 = 2.25 eV).
C. Biexciton X Xq peak intensities
In contrast to linear absorption and emission signals [seeFigs. 2 and 4(a)], the peak intensities in the 2D-DQC spectra[see Figs. 3 and 4(b)–4(d)] can be only inferred from the
interference between the contributing pathways and are notrelated to a single transition moment. The imaginary partof both pahways ESA1 and ESA2 to the (�3,�2) signalis depicted in Fig. 5(a) for the neutral QD. The phase ofboth contributions leads to interference that defines the DQCsignal intensity. The prominent double peak structure at �2 =2.24 eV in the absolute value of the DQC signal [see Fig. 4(b)]can be decomposed into distinct contributions from bothdiagrams. Both ESA contributions are spectrally separatedalong the �3 axis with the (2,2) → (1,1) resonances beingred shifted by 11–12 meV from the (1,1) → (0,0) transitionsin both the Se − Sh and Pe − Ph channels. The lowest-energybiexciton XX0(�2 = 2.165 eV) is composed solely of theSh − Se channel, here the shift between (1,1) → (0,0) and(2,2) → (1,1) resonances is less pronounced (3 meV) butintroduces the discussed asymmetry in the line shape of thetotal (�3,�2) signal. Cuts along the �3 axis are depictedfor the neutral, the negatively and positively charged QDs inFig. 5(b) at the �2 value of maximum peak intensity. In bothcharged QDs, the individual ESA contributions of the XX−1
and XX+1 states are spectrally resolved: the Se − Sh channel
235303-7

FINGERHUT, RICHTER, LUO, ZUNGER, AND MUKAMEL PHYSICAL REVIEW B 86, 235303 (2012)
−1
0
1
Int.
/ nor
m.
0
−1
0
1
Int.
/ nor
m.
−1
1.06 1.1 1.14 1.18−1
0
1
Ω1 (eV)
Int.
/ nor
m.
SkIII(3)
ESA1
ESA2
−1
0
1
Int.
/ nor
m.
0
−1
0
1
Int.
/ nor
m.
−1
1.06 1.1 1.14 1.18−1
0
1
Ω3 (eV)
Int.
/ nor
m.
SkIII(3)
ESA1
ESA2
Ω3 (eV)
Ω2 (
eV)
Im(ESA1)
1.06 1.1 1.14 1.182.16
2.18
2.2
2.22
2.24
2.26
Ω3 (eV)
Ω2 (
eV)
Im(ESA2)
1.06 1.1 1.14 1.182.16
2.18
2.2
2.22
2.24
2.26
-1
-0.5
0
0.5
1
(c)(b)
(a)
q =
q =
q = +1
q =
q =
q = +1
FIG. 5. (Color online) (a) Imaginary part of the ESA1 and ESA2 contributions to the 2D-DQC signal S(3)kIII
(�3,�2,t1) of the neutral quantumdot, Eq. (7), t3 = 100 fs. The signal is plotted on a nonlinear scale defined by Eq. (8). (b) Interfering pathways ESA1 and ESA2 for theS
(3)kIII
(�3,�2,t1) and the S(3)kIII
(t3,�2,�1) (c) signals.
((1,2) → (0,1) and (2,1) → (1,0)) is dominant in the ESA2contribution. The |XXq〉 → |Xq〉 transitions of the Pe − Ph
channel (�3 ≈ 1.16 eV) dominate the ESA1.Slices along �1 are given in Fig. 5(c) for the (�2,�1) signal.
In this signal representation, XXq states are projected only on|Xq〉 → |Gq〉 transitions and the signal contributions ESA1and ESA2 show up at the same �1 frequency. In the neutraland positively charged QD [see Fig. 5(c), top and bottom], theladder diagrams ESA1 and ESA2 add up constructively and theXX0 state shows predominant contributions from the Se − Sh
configuration (�1 = 1.083 eV) but weaker from the Pe − Ph
channel (�1 = 1.169 eV). For the XX+1 state, the importanceof configurations is inverted and the Pe − Ph configurationbecomes dominant (�1 = 1.163 eV). In contrast, in thenegatively charged QD [see Fig. 5(c), middle], both ladderdiagrams add up with opposite phases defining the the XX−1
intensity. The presented slices along the monoexciton axis(�1 or �3) reveal the pronounced differences between QD’sCI wave function compositions of the quantum states. Thisallows to decipher the underlying mechanism of the signal
intensity, modulation of peak shapes and the occurrence ofdouble peak structures in 2D-DQC signals on a fundamentallevel.
IV. CONCLUSIONS
We have simulated two projections of the 2D-DQC spectra[(�2,�1) and (�3,�2) representations] of QDs in differentcharged states. Both reveal only the biexciton XXq energiesalong the �2 axis that corresponds to the Fourier transform ofthe waiting time t2 between the second and third laser pulse.Their constituent single-excitons Xq show up as resonancesalong the �1 or �3 axis revealing the multiconfigurationcharacter of biexcitons XXq . The simulations demonstrate,that different charged states of the QD lead to modulationsin 2D-DQC peak pattern directly reflecting the dominant con-figurations to the CI wave function of biexcitons XXq . Onlyin the neutral QD the lowest biexciton state XX0 is projectedexclusively on the Se − Sh channel as single contributing CIconfiguration. In the charged QDs, the Pauli blocking due
235303-8

DISSECTING BIEXCITON WAVE FUNCTIONS OF SELF- . . . PHYSICAL REVIEW B 86, 235303 (2012)
to partially occupied electron or hole states eliminates thislow-energy XXq resonance with exclusive Se − Sh character.All biexcitons of charged QD show strong configuration inter-actions in the XXq wave functions with more than one leadingconfiguration from Se − Sh and Pe − Ph channels revealing thestrong high-order electron correlation within the QDs. In theS
(3)kIII
(�3,�2,t1) representation, the neutral QD XX0 states showa double peak structure, which is assigned to |X0〉 → |G0〉 andred shifted |XX0〉 → |X0〉 resonances as doorway transitionsto biexcitons XX0. In the negatively charged QD multiple|X−〉 states act as doorway transitions to XX− with red shifted|XX−〉 → |X−〉 resonances, whereas a XX+1 biexciton con-stituent from blue shifted |XX+〉 → |X+〉 frequencies isidentified.
In contrast to the linear optical signals, the intensity of2D-DQC peaks results from the interference of density matrixdiagrams, and may not be attributed to single transition mo-ments. We find pronounced differences for the three chargedstates of the QDs with a destructive interference mechanism inthe negatively charged QD and constructive interference in theneutral and positive QDs. In the (�3,�2) signal, the resonancesof the individual pathways are spectrally resolved, whichleads to the occurrence of the double peaks in the 2D-DQCsignals.
We have demonstrated theoretically that the coherentthird-order DQC technique can distinguish the quantum stateof individual QDs and directly extract information about thewave function composition of the biexciton manifold XXq , notaccessible from linear spectroscopy. Optical signatures of dif-ferent charged QD (neutral, negatively charged, and positivelycharges) in 2D-DQC spectra where identified. Multidimen-sional DQC spectroscopy (or 2D phase modulated fluores-cence analogues) may serve as a particularly suitable tool forrecording the charging state of single QD devices in operationand open the route for nonlinear spectroscopy with entangledphotons.
ACKNOWLEDGMENTS
We gratefully acknowledge the support of the NationalScience Foundation through Grant No. CHE-1058791 andCHE-0840513, the Chemical Sciences, Geosciences and Bio-sciences Division, Office of Basic Energy Sciences, Officeof Science, US Department of Energy and the DefenseAdvanced Research Projects Agency (DARPA), Grant UOFT-49606. B. P. F. and M. R. gratefully acknowledge sup-port from the Alexander-von-Humboldt Foundation throughthe Feodor-Lynen program. M. R. also acknowledges fi-nancial support by the Deutsche Forschungsgemeinschaftthrough SFB 787. The work did by J. W. L. and A. Z.was funded by the US Department of Energy, Office ofScience, Basic Energy Science, Materials Sciences andEngineering, under Contract No. DE-AC36-08GO28308 toNREL.
APPENDIX: SUM-OVER-STATES (SOS) EXPRESSION FORTHE 2D DOUBLE-QUANTUM-COHERENCE
(2D-DQC) SIGNAL
Heterodyne detection is the most advanced detectionmethod allowing to measure amplitude and phase of theDQC signal. The third-order heterodyne detected DQC signalS
(3)kIII
(t3,t2,t1) depends parametrically on the delays between thelaser pulses. The last pulse E4 serves as a local oscillator fieldused for the heterodyne detection mode. Assuming that allpulses are temporally separated and phase matching conditions(kIII = k1 + k2 − k3), the contributions to S
(3)kIII
are given bytwo excited state (ESA) type ladder diagrams [see Figs. 3(a,iii)and 3(a,iv)]:
S(3)kIII
(t3,�2,�1) = S(ESA1)kIII,i
(t3,�2,�1) − S(ESA2)kIII,ii
(t3,�2,�1).(A1)
Here, we use a mixed time-frequency representation byperforming a double-Fourier transform for t1 and t2. Bothcontributions to the 2D-DQC signal are given by the closedsum-over-state expressions derived in detail in Ref. 27:
S(3)kIII,i
(t3,�2,�1)
=∑
f ee′g′[μ∗
f e′ E∗4 (ωf e′ − ω4)][μ∗
eg′ E∗3 (ωeg′ − ω3)]
× [μf e E2(ωf e − ω2)][μeg0 E1(ωeg0 − ω1)]
h3(�2 − ξfg0 )(�1 − ξeg0 )e−ıξf e′ t3 ,
(A2)
S(3)kIII,ii
(t3 = 0+,�2,�1)
=∑f ee′
[μ∗e′g0
E∗4 (ωe′g0 − ω4)][μ∗
f e′ E∗3 (ωf e′ − ω3)]
× [μf e E2(ωf e − ω2)][μeg0 E1(ωeg0 − ω1)]
h3(�2 − ξfg0 )(�1 − ξeg0 )e−ıξe′g0
t3 .
(A3)
Here, g denotes the ground state manifold of the QD|Gq〉, g0 is the initially occupied lowest energy state |Gq
0〉of the QD, e denotes single-excitons |Xq〉, f are biexcitons|XXq〉, and ξij = ωi − ωj − ıγ . The phenomenologicaldephasing linewidth γ is assumed to be equal for all excitontransitions and reflects the width of sidebands of the QDsdue to acoustical phonons16,49–52 and the similar radiativeexciton lifetimes of single- and biexcitons in single QD.53,54
The spectral pulse envelopes
E(ω) =∫
dtexp(ıωt)E(t) (A4)
select possible transitions allowed by their bandwidth and thusserve as frequency filers that remove all transitions outsidethe bandwidth. In the simulations, we assume that the pulsebandwidth is larger than the exciton bandwidth, the impulsivesignal then coincides with the third-order response functionof the QD.
*[email protected]†[email protected]
1O. E. Semonin, J. M. Luther, S. Choi, H.-Y. Chen, J. Gao, A. J.Nozik, and M. C. Beard, Science 334, 1530 (2011).
235303-9

FINGERHUT, RICHTER, LUO, ZUNGER, AND MUKAMEL PHYSICAL REVIEW B 86, 235303 (2012)
2J. T. Stewart, L. A. Padilha, M. M. Qazilbash, J. M. Pietryga, A. G.Midgett, J. M. Luther, M. C. Beard, A. J. Nozik, and V. I. Klimov,Nano Lett. 12, 622 (2012).
3D. Loss and D. P. DiVincenzo, Phys. Rev. A 57, 120 (1998).4P. Bhattacharya, S. Ghosh, and A. Stiff-Roberts, Annu. Rev. Mater.Res. 34, 1 (2004).
5P. Michler, A. Kiraz, C. Becher, W. V. Schoenfeld, P. M. Petroff,L. Zhang, E. Hu, and A. Imamoglu, Science 290, 2282 (2000).
6A. J. Shields, Nat. Photon. 1, 215 (2007).7C. Kindel, S. Kako, T. Kawano, H. Oishi, Y. Arakawa, G. Honig,M. Winkelnkemper, A. Schliwa, A. Hoffmann, and D. Bimberg,Phys. Rev. B 81, 241309 (2010).
8N. Akopian, N. H. Lindner, E. Poem, Y. Berlatzky, J. Avron,D. Gershoni, B. D. Gerardot, and P. M. Petroff, Phys. Rev. Lett.96, 130501 (2006).
9A. Schliwa, M. Winkelnkemper, A. Lochmann, E. Stock, andD. Bimberg, Phys. Rev. B 80, 161307 (2009).
10F. Sotier, T. Thomay, T. Hanke, J. Korger, S. Mahapatra, A. Frey,K. Brunner, R. Bratschitsch, and A. Leitenstorfer, Nat. Phys. 5, 352(2009).
11C. L. Salter, R. M. Stevenson, I. Farrer, C. A. Nicoll, D. A. Ritchie,and A. J. Shields, Nature (London) 465, 594 (2010).
12A. Mohan, M. Felici, P. Gallo, B. Dwir, A. Rudra, J. Faist, andE. Kapon, Nat. Photon. 4, 302 (2010).
13R. J. Warburton, C. Schaflein, D. Haft, F. Bickel, A. Lorke,K. Karrai, J. M. Garcia, W. Schoenfeld, and P. M. Petroff, Nature(London) 405, 926 (2000).
14M. Bayer, O. Stern, P. Hawrylak, S. Fafard, and A. Forchel, Nature(London) 405, 923 (2000).
15Optical Properties of Semiconductor Quantum Dots, edited byU. Woggon (Springer, Berlin, 1997).
16P. Borri, W. Langbein, S. Schneider, U. Woggon, R. L. Sellin,D. Ouyang, and D. Bimberg, Phys. Rev. Lett. 87, 157401 (2001).
17V. Mlinar and A. Zunger, Phys. Rev. B 80, 035328 (2009).18J. Kim, S. Mukamel, and G. D. Scholes, Acc. Chem. Res. 42, 1375
(2009).19K. W. Stone, K. Gundogdu, D. B. Turner, X. Li, S. T. Cundiff, and
K. A. Nelson, Science 324, 1169 (2009).20S. T. Cundiff, J. Opt. Soc. Am. B 29, A69 (2012).21G. Moody, M. E. Siemens, A. D. Bristow, X. Dai, A. S. Bracker,
D. Gammon, and S. T. Cundiff, Phys. Rev. B 83, 245316(2011).
22C. Scheurer and S. Mukamel, J. Chem. Phys. 115, 4989 (2001).23S. Mukamel, R. Oszwaldowski, and D. Abramavicius, Phys. Rev.
B 75, 245305 (2007).24S. Mukamel, R. Oszwaldowski, and L. Yang, J. Chem. Phys. 127,
221105 (2007).25D. B. Turner, P. Wen, D. H. Arias, and K. A. Nelson, Phys. Rev. B
84, 165321 (2011).26Y. Benny, Y. Kodriano, E. Poem, D. Gershoni, T. A. Truong, and
P. M. Petroff, Phys. Rev. B 86, 085306 (2012).27D. Abramavicius, B. Palmieri, D. V. Voronine, F. Sanda, and
S. Mukamel, Chem. Rev. 109, 2350 (2009).28M. Richter, F. Schlosser, M. Schoth, S. Burger, F. Schmidt,
A. Knorr, and S. Mukamel, Phys. Rev. B 86, 085308 (2012).
29P. Tian, D. Keusters, Y. Suzaki, and W. S. Warren, Science 300,1553 (2003).
30M. F. Gelin, D. Egorova, and W. Domcke, Acc. Chem. Res. 42,1290 (2009).
31M. Cho, N. F. Scherer, G. R. Fleming, and S. Mukamel, J. Chem.Phys. 96, 5618 (1992).
32T. J. Dunn, I. A. Walmsley, and S. Mukamel, Phys. Rev. Lett. 74,884 (1995).
33J. A. Cina, Annu. Rev. Phys. Chem. 59, 319 (2008).34G. A. Lott, A. Perdomo-Ortiz, J. K. Utterback, A. Aspuru-Guzik,
and A. H. Marcus, Proc. Natl. Acad. Sci. USA 108, 16521 (2011).35S. Mukamel and M. Richter, Phys. Rev. A 83, 013815 (2011).36P. F. Tekavec, T. R. Dyke, and A. H. Marcus, J. Chem. Phys. 125,
194303 (2006).37P. F. Tekavec, G. A. Lott, and A. H. Marcus, J. Chem. Phys. 127,
214307 (2007).38D. Brinks, F. D. Stefani, F. Kulzer, R. Hildner, T. H. Taminiau,
Y. Avlasevich, K. Mullen, and N. F. van Hulst, Nature (London)465, 905 (2010).
39M. Ediger, G. Bester, A. Badolato, P. M. Petroff, K. Karrai,A. Zunger, and R. J. Warburton, Nat. Phys. 3, 774 (2007).
40A. Franceschetti, H. Fu, L. W. Wang, and A. Zunger, Phys. Rev. B60, 1819 (1999).
41L.-W. Wang and A. Zunger, Phys. Rev. B 59, 15806 (1999).42A. J. Williamson, L. W. Wang, and A. Zunger, Phys. Rev. B 62,
12963 (2000).43G. Bester, S. Nair, and A. Zunger, Phys. Rev. B 67, 161306 (2003).44J.-W. Luo, L. Zhang, and A. Zunger, Phys. Rev. B 84, 121303
(2011).45J.-W. Luo, A. N. Chantis, M. van Schilfgaarde, G. Bester, and
A. Zunger, Phys. Rev. Lett. 104, 066405 (2010).46J.-W. Luo, G. Bester, and A. Zunger, Phys. Rev. Lett. 102, 056405
(2009).47J. W. Luo, A. Franceschetti, and A. Zunger, Phys. Rev. B 79, 201301
(2009).48J.-W. Luo, A. Franceschetti, and A. Zunger, Nano Lett. 9, 2648
(2009).49B. Krummheuer, V. M. Axt, and T. Kuhn, Phys. Rev. B 65, 195313
(2002).50J. Forstner, C. Weber, J. Danckwerts, and A. Knorr, Phys. Status
Solidi B 238, 419 (2003).51B. Krummheuer, V. M. Axt, T. Kuhn, I. D’Amico, and F. Rossi,
Phys. Rev. B 71, 235329 (2005).52E. Stock, M.-R. Dachner, T. Warming, A. Schliwa, A. Lochmann,
A. Hoffmann, A. I. Toropov, A. K. Bakarov, I. A. Derebezov,M. Richter, V. A. Haisler, A. Knorr, and D. Bimberg, Phys. Rev. B83, 041304 (2011).
53G. Bacher, R. Weigand, J. Seufert, V. D. Kulakovskii, N. A. Gippius,A. Forchel, K. Leonardi, and D. Hommel, Phys. Rev. Lett. 83, 4417(1999).
54C. Santori, G. S. Solomon, M. Pelton, and Y. Yamamoto, Phys. Rev.B 65, 073310 (2002).
55D. Abramavicius and S. Mukamel, J. Chem. Phys. 133, 184501(2010).
56V. Mlinar and A. Zunger, Phys. Rev. B 80, 205311 (2009).
235303-10