Embed Size (px)
Citation preview
13th International Conference on Wirtschaftsinformatik,
February 12-15, 2017, St. Gallen, Switzerland
Disruption of Individual Mobility Ahead?
A Longitudinal Study of Risk and Benefit Perceptions of
Self-Driving Cars on Twitter
Christopher Kohl1, Dalia Mostafa1, Markus Böhm1, Helmut Krcmar1
1 Technical University of Munich, Department of Informatics, Munich, Germany
{christopher.kohl,dalia.mostafa,markus.boehm,krcmar}@in.tum.de
Abstract. In this paper, we address the question if there is a disruption of
individual mobility by self-driving cars ahead. In order to answer this question,
we take the user perspective and conduct a longitudinal study of social media
data about self-driving cars from Twitter. The study analyzes 601,778 tweets
from March 2015 to July 2016. We use supervised machine learning
classification to extract relevant information from this huge amount of
unstructured text. Based on the classification, we analyze how risk and benefit
perceptions of self-driving cars develop over time, and how they are influenced
by certain events. Based on the perceived risks and benefits, we draw conclusions
for the acceptance of self-driving cars. Our study shows that a disruptive
innovation of self-driving cars is not likely as risk and benefit perception issues
indicate a lack of acceptance. We provide suggestions for improving the
acceptance of self-driving cars.
Keywords: Machine learning, Risk Perception, Self-Driving Cars, Technology
Acceptance, Text Classification
1 Introduction
In this paper, we address the question if there is a disruption of individual mobility by
self-driving cars ahead of us. The impressive recent technical developments, for
example of the Google Car and the Tesla Autopilot, draw a performance trajectory
characteristic for disruptive innovations [1]. They already demonstrate the technical
feasibility of self-driving cars. However, other previously new technologies in the
individual mobility sector such as electric cars [2] or ridesharing [3] have been available
since decades but still have a low market share. So will there be a disruption of
individual mobility from human-driven cars to driverless cars as it occurred from horse-
drawn carriages to horseless carriages as some articles predict [4]?
The evolution of transportation has faced numerous trials as it grew over time. We
have gone through many diverse phases, including walking, biking, horses, coaches,
trains, and cars. It is safe to assume that this steady chain of development of faster
vehicles with improved features continues. Over the past decade, a countless amount
of research has been invested into self-driving cars [5]. Companies such as Google,
1220
Kohl, C.; Mostafa, D.; Böhm, M.; Krcmar, H. (2017): Disruption of Individual Mobility Ahead? A Longitudinal Study of Risk and Benefit Perceptions of Self-Driving Cars on Twitter, in Leimeister, J.M.; Brenner, W. (Hrsg.): Proceedings der 13. Internationalen Tagung Wirtschaftsinformatik (WI 2017), St. Gallen, S. 1220-1234
Tesla, and BMW are investing in the development of self-driving cars. Especially
because of these high investments, we must remember a significant key factor for the
success of emerging technologies: technology acceptance [6].
In recent times, self-driving cars have become a controversial topic (e.g., because of
ethical concerns [7]). Despite the efforts of researchers in pushing the technical
boundaries of science and technology, there are key factors that need to be considered.
One of the most meaningful factor is people’s concerns regarding this emerging
technology [8]. People’s perceived risks and benefits towards self-driving cars will be
central determinants of their public acceptance [9]. Public acceptance is what will
eventually determine, when and how self-driving cars will actually be put to use,
making it a crucial factor to take into consideration. As Michael Toscano, CEO of the
Association for Unmanned Vehicle Systems International once said “The technology
maturation is there, but the public acceptance is not there” [10].
Opinions regarding self-driving cars such as risk and benefit perceptions are
affected, and perhaps even shaped, by the news [11]. If we succeed in explaining the
logic behind people’s various opinions concerning self-driving cars, we will be one step
closer towards tackling the issue of technology acceptance. Therefore, we use
supervised machine learning classification to extract this information from a set of
601,778 tweets obtained from the microblogging service Twitter.
Twitter has often proven to be a valuable source of data for prediction and
monitoring of diverse phenomena ranging from disease outbreaks [12] to political
elections [13]. Users of Twitter face a limit of 140 characters per message, referred to
as “tweet”, to include all relevant information. Despite their brevity, tweets contain
valuable information encoded in natural language [14]. It is an ongoing challenge to
extract this information from the vast amount of noise present on Twitter. We build on
previous findings from sentiment analysis [14] and machine learning classification to
extract information from a rich dataset of tweets.
The remainder of this paper is structured as follows. First we give an overview about
technology acceptance literature and self-driving cars in general in section 2. Second,
we describe the data extraction from Twitter, preprocessing the data, and model
generation including its evaluation in section 3. Third, we describe the results in section
4. Fourth, we discuss our results in section 5. In section 6, we conclude with a summary
of the results, limitations, possibilities for further research, and contributions to research
and practice.
2 Theoretical Background
In this section, we give an overview about current literature disclosing the significance
of acceptance towards self-driving cars from an Information Systems (IS) and public
acceptance perspective. We give an introduction to self-driving cars and present the
current scientific knowledge and surveys relevant to the acceptance of self-driving cars.
We conclude this section by summarizing the theoretical background, thereby
motivating the research from a theoretical perspective.
1221
2.1 Technology Acceptance
Technology acceptance is one of the main research streams of IS research and the
technology acceptance model (TAM) being a crucial source of many research
endeavors [15]. The aim of TAM is to explain and predict if and why information
systems will be used by individuals [6]. TAM predicts user acceptance by using three
basic constructs: Perceived usefulness, perceived ease of use, and behavioral intention
to use the system under consideration.
Several models were derived from the TAM with the Unified Theory of Acceptance
and Use of Technology (UTAUT) being one of the most established ones that integrates
eight models of technology adoption including TAM [16]. It includes the constructs of
TAM and adds social influence (i.e., the degree to which influential people think the
user should use the particular system) and facilitating conditions (i.e., the perceived
level of organizational and technical support for the system, which is also considered a
direct predictor of technology use). Individual factors such as age and gender moderate
the relationships between these constructs and technology acceptance and use. Several
researchers have extended the UTAUT model [17].
Many extensions of TAM and UTAUT have recognized the importance of risk
perception for user acceptance. For example, Martins et al. [18] study Internet banking
adoption and conclude that risk perception is an important factor. Lancelot Miltigen et
al. [19] study end-user acceptance of biometrics and find that the greater the perceived
risks, the lesser people will accept this technology. Despite several promising
approaches, risk perception has not been included in one of the central IS acceptance
models [17].
Public acceptance research recognizes that many technologies have been rejected by
people because of societal controversies, causing negative consequences for the
commercialization of technologies [8]. Considering the vast investments in research
and development of self-driving cars and the potential benefits of this technology for
society, rejection of this technology could have severe consequences. In particular,
unpredicted events and accidents that recently occurred with self-driving cars such as
the first human casualty [20] could lead to fear and reluctance to adopt.
A very influential model of technology acceptance in the public acceptance field
specifically focuses on the relationship between perceptions of risks and benefits, trust,
and technology acceptance [9]. The study found that perceptions of risks and benefits
directly influence technology acceptance.
2.2 Self-Driving Cars
The National Highway Traffic Safety Administration (NHTSA) [21] defines five
degrees of car autonomy which have different extents of connection between cars and
the Advanced Driver Assistance Systems (ADAS) and the level of control the car
carries. These systems can have full control of the car or can just be an assistance system
for the driver. The levels vary from non-autonomous at all to fully-autonomous and are
defined as follows [21]:
Level 0: (Non-autonomous): The driver is in complete control of the vehicle.
1222
Level 1: (Function Specific Automation): Automation involves only specific control
functions. (i.e. pre-charged breaks, electronic stability control)
Level 2: (Combined Function Automation): Automation of two primary control
functions in unison to relieve driver of control of these functions.
Level 3: (Limited Self-Driving Automation): The driver has the choice to give up
control of all safety-critical functions under certain conditions, yet the driver is
expected to be available for occasional control.
Level 4: (Full Self-Driving Automation): The vehicle has full control of all safety-
critical driving functions under all conditions. The driver’s availability is completely
unnecessary.
The current automation level of self-driving cars is level 2. The drivers are still
required to monitor the car and need to be ready to take over control at any time. There
could be severe consequences if a driver fails to comply (e.g., [20]). However, many
drivers are misusing the system, for example by even leaving the driver’s seat entirely
while driving on a public road using the Autopilot feature of a Tesla Model S [22].
Considering how difficult it is for the driver to get back in the loop and react properly
to certain traffic situations [23], such reports are even more troubling and show that
also exaggerated benefit perceptions could have negative implications for technology
acceptance.
Recent surveys have indicated that 56% of people have positive opinions towards
self-driving cars, while 13.8% carry negative concerns, and 29.4% are neutral towards
the topic [24]. Supporters argue that since 93% of car accidents are due to driver error
[25], the use of self-driving cars would reduce car accidents by that exact amount [5].
However, opponents of this view state that these vehicles would introduce new risks
that do not exist now, such as system failures or offsetting behaviors. Schoettle and
Sivak’s analysis [24] concluded that self-driving cars may be no safer than an average
driver and that they may result in the increase of total crashes if self- and human-driven
vehicles are used simultaneously.
Many recent surveys have shown that people are generally accepting self-driving
cars (e.g., [26]) even if only little is known about the technology. If self-driving cars
become available people may just begin to recognize potential issues as it was the case
with active cruise control where people began to recognize the loss of control at the
first time deployment [27].
2.3 Summary
Risk and benefit perceptions are likely to play a central role for the acceptance of
self-driving cars. Even before public availability, risk and benefit perceptions should
be closely monitored to identify the issues of people with the technology. Issues can be
accurate risk perceptions that need to be addressed or benefits that can be exploited in
an early stage of development. Extensions of the TAM, UTAUT, and models from other
fields of research have shown that risk perceptions are direct antecedents of technology
acceptance.
1223
Another kind of issues are distorted perceptions of both benefits and risks [28],
which we already see with the first available self-driving car technologies. An
overestimation of benefits might lead to misuse of self-driving cars, disappointment of
initial users, and can have fatal consequences. Underestimation or not even recognizing
benefits on the developer side could lead to self-driving cars that do not exploit their
full potential. An overestimation of risks by the public could lead to resistance against
self-driving cars before they even become publicly available [29].
Taking this into account, we identify the need to study risk and benefit perception of
self-driving cars. Instead of distributing questionnaires, we use a novel approach to
identify risks and benefits by analyzing the vast amount of existing data about
self-driving cars on social media. We use supervised machine learning classification to
classify tweets, which allows us to analyze them qualitatively and quantitatively.
Classification of documents written in natural language is a common approach from
opinion mining [30]. Thereby, we avoid certain issues with questionnaires and studying
technology acceptance, for example common method variance [31].
3 Method
In this section we describe our approach from data extraction to model application. We
follow the process suggested by [32]. First, we obtain tweets using the Twitter Search
API. Second, we preprocess the tweets to improve data quality, reduce dimensionality,
and avoid misclassification. Third, we evaluate the machine learning classification
algorithm.
3.1 Data Extraction
The dataset consists of tweets concerning self-driving cars that were obtained using the
Twitter Search API [33]. Furthermore, we developed a Java application as the Twitter
Search API only allows to retrieve tweets not older than one week [34]. In order to
conduct a meaningful longitudinal analysis, it was essential to allow for longer date
intervals by fetching the tweets daily and storing them in a database. A MongoDB
NoSQL database was used to store the complete tweets as they were returned by the
Twitter API including their date of creation, the username of the tweet creator, the
message that was tweeted, and a unique identifier of the tweet. We started the data
collection for this analysis on March 03, 2015 with the last tweets being posted on July
15, 2016. We used the following set of search queries (SQ) in our Twitter API requests:
SQ1: self driving OR driverless OR autonomous OR automated
SQ2: tesla OR google OR apple OR icar OR ford OR opel OR gm OR general motors
SQ3: volkswagen OR vw OR daimler OR mercedes OR benz OR bmw OR audi OR
porsche
The search queries have been fixed before the data collection and consist of a
combination of topic-related keywords (SQ1), names of U.S.-based companies working
on self-driving cars (SQ2), and German car manufacturers (SQ2 and SQ3). Especially
1224

SQ2 and SQ3 resulted in many tweets that were not concerned with self-driving cars.
However, at the beginning of our research in March 2015, we wanted to make sure that
the search queries still find the relevant tweets without having to change the search
queries. In total, we collected 1,859,619 tweets. For the data analysis, the tweets were
filtered using a regular expression1, which ensures that only tweets containing one of
the following terms are included in the data analysis: driverless, self-driving,
autonomous driving, automated driving, autonomous car, and automated car. In
addition to traditional filtering using strings, the regular expression also allows slight
variations of the terms, such as “driver less” or “driver-less”. This selection method
reduced the number of tweets to 601,778.
For training the machine learning classifier we used a dataset of 7,482 tweets, which
were manually classified by one person using the three labels “Risk”, “Benefit”, and
“Neutral”. “Risk tweets” describe perceived risks of self-driving cars while “Benefit
tweets” describe benefit perceptions of self-driving cars. “Neutral tweets” do not
contain risk nor benefit perceptions, for example: “Google starts testing driverless car
in Austin […]” or “New self-driving Google car heads to streets […].” The distribution
of the tweets is shown in Table 1.
Table 1. Descriptive statistics of the training dataset
Class
Risk Benefit Neutral
N 751 701 6,030
% 10.0 9.37 80.6
The tweets were created in the time range from beginning of January 2010 to June
2014 and collected by crawling the “top tweets” about self-driving cars from the Twitter
website prior to this study. These are “popular Tweets that many other Twitter users
have engaged with and thought were useful” [35]. Both, the training dataset and the
collected tweets were created by potential consumers and from users with commercial
interests, for example, self-driving car manufacturers or news providers. For this
analysis, we will not differentiate between the authors of the tweets. With the “top
tweets”, we could get an overview of the discussion about this topic on Twitter, which
helped to design this study. However, we refrain from analyzing these tweets since they
only represent a small fraction of the actual tweets published from January 2010 to June
2014 and are probably highly biased through the proprietary selection algorithms of
Twitter. We only use them as “training data” for machine learning classification.
3.2 Data Preprocessing
We performed changes to the content of the tweets to reduce dimensionality and avoid
misclassification, which is a common step in text classification [32]. We use the text
1 We used the following regular expression: (driver.?less | self.?driving | autonomous.?driving |
automated.?driving | autonomous.?car | automated.?car)
1225
mining package “tm” for preprocessing, which provides a text mining framework for
the statics software R [36]. The preprocessing steps are described in more detail in [36].
First, we transformed all characters in the text of the tweets to lower case. Like most
of the preprocessing steps, this decreases readability for humans. However, machine
learning classifiers for text classification mainly rely on statistical features of the
provided textual data and, thus, profit from such transformations. Second, we removed
punctuation, numbers, and hyperlinks. Since we will not perform a grammatical
analysis, punctuation is not required to determine the classification of the tweets. Third,
we remove English stopwords as provided by the tm package. Additionally, we
removed the Twitter-specific stopwords “via” and “rt”. Fourth, we use stemming to
further reduce dimensionality of the tweets. Stemming reduces words with the same
stem to the same word by stripping derivational and inflectional suffixes, for example:
“driving” is stemmed to “drive”.
Having performed the described transformations, the text of the tweets now should
mainly contain words that are useful for the machine learning classification. In the last
step, we transform the textual representation of the tweets into a document term matrix.
Only words containing at least two characters and occur at least ten times in the tweets
are included as terms. The terms are weighted by the term frequency (i.e., the number
of occurrences of a certain term). Terms are, in our analysis, single words (i.e.,
unigrams) We apply all of the described preprocessing steps to both the training data
and the tweets we want to classify.
3.3 Model Generation and Evaluation
The basic idea of supervised machine learning text classification is to automatically
assign classes to documents using a much smaller set of training data. The training data
usually contains manually classified documents from which the machine learning
algorithms create a model that determines how to classify new documents. There are
many different machine learning algorithms available for this task such as Naïve Bayes,
maximum entropy classification, or Support Vector Machines (SVM) [37].
We decided to use the SVM algorithm for text classification, which has been shown
to be highly effective for this task [37, 38]. It does not require extensive parameter
tuning and is able to cope well with large feature vectors as it is usually the case with
text classification [38]. The basic idea of SVM is to find a hyperplane that separates the
documents (i.e., tweets) according to their classification with a margin that is as large
as possible, which is basically an optimization problem [37]. We use the LIBSVM
implementation of SVM that allows classification, regression, and other learning tasks
[39]. For our analysis, we use C-support vector classification for classification.
For this analysis, we set the regularization parameter C to of the SVM to one and
select a linear kernel function since text classification problems are often linearly
separable [38]. We compute several metrics to evaluate the SVM. First, we conduct a
10-fold cross validation to determine the accuracy of the classifier. Accuracy is defined
as the overall number of correct classifications divided by the number of instances in
the dataset and a k-fold cross-validation randomly splits the training data into k
mutually exclusive, approximately equal sized subsets (i.e., folds) [40]. The algorithm
1226
uses one of the k folds to evaluate the classifier by computing the accuracy and the other
k – 1 folds to train it. The cross-validation showed an average accuracy of 87.7%, which
is a very good value considering similar studies (e.g., [41]) and is much better than
classification based on hand-picked keywords [30].
For the second evaluation, we split the training data using a random selection of 80%
(N = 5,957) of the tweets for training the SVM and 20% (N = 1,525) for evaluating the
classification performance. We then compute several metrics based on the confusion
matrix shown in Table 2.
Table 2. Confusion matrix of the SVM algorithm
True class
Risk Benefit Neutral
Predicted
class
Risk 80 9 20
Benefit 4 76 22
Neutral 61 62 1191
The accuracy with the fixed training set is 88.33%. We computed the “no-
information rate”, the largest proportion of the observed classes, since there is a large
imbalance between the classes [42]. The no-information rate has a value of 80.85%.
Additional metrics were computed according to [42] and are listed in Table 3.
Table 3. Metrics by class
Metric Risk Benefit Neutral Average
Sensitivity 0.5517 0.5170 0.9659 0.6782
Specificity 0.9790 0.9811 0.5788 0.8463
Pos. Pred. Value 0.7339 0.7451 0.9064 0.7951
Neg. Pred. Value 0.9541 0.9501 0.8009 0.9017
Prevalence 0.0951 0.0964 0.8085 0.3333
Detection Rate 0.0525 0.0498 0.7810 0.2944
Detection Prevalence 0.0715 0.0669 0.8616 0.3333
Balanced Accuracy 0.7654 0.7491 0.7724 0.7623
While accuracy showed very good values, we could identify issues of the SVM
classifier resulting from the imbalanced training set. For example, the difference in
sensitivity between Risk and Benefit tweets suggests, that the SVM recognizes benefit-
related tweets better than risk-related tweets.
4 Results
With an overall total of 601,778 tweets, we obtained 459.751 (76.4%) neutral tweets,
63,599 (10.6%) stated benefits (BT), and 78,428 (13.0%) stated risks about self-driving
cars (RT). The risk ratio (RR) and benefit ratio (BR) were calculated as follows:
1227
𝑅𝑅 = 𝑅𝑇
𝑅𝑇+𝐵𝑇=
78,428
78,428+63,599= 1 − 𝐵𝑅 = 0.5522 (1)
𝐵𝑅 = 𝐵𝑇
𝑅𝑇+𝐵𝑇=
63,599
78,428+63,599= 1 − 𝑅𝑅 = 0.4478 (2)
In 2015, we collected 490,284 tweets of which 376,923 (76.9%) of the tweets were
neutral, 50,098 (10.2%) stated benefits, and 63,263 (12.9%) stated risks about
self-driving cars. The RR in 2015 is 0.5581 and BR is 0.4419. The ratio of neutral tweets
did not change much over the years: Of 111,494 tweets in 2016, 82,828 (74.3%) of the
tweets were neutral, 13,501 (12.1%) stated benefits, and 15,165 (13.6%) stated risks
about self-driving cars. RR in 2016 is 0.5290 and BR is 0.4710. The results are
summarized in Table 4.
Table 4. Number of tweets per year by class
Year Total Neutral Benefit Risk RR BR
2015 490,284 376,923
76.9%
50,098
10.2%
63,263
12.9% 0.5581 0.4419
2016 111,494 82,828
74.3%
13,501
12.1%
15,165
13.6% 0.5290 0.4710
Overall 601,778 459,751
76.4%
63,599
10.6%
78,428
13.0% 0.5522 0.4478
The ratio of neutral tweets, RR and BR did not change much over the years. This
could indicate that the SVM classifier and the underlying training data is well-suited
for classifying tweets about the risk and benefit perceptions of self-driving cars. It might
also show that RR and BR is a good measure to analyze risk and benefit perception in
further research. Closer inspection of RR and BR showed that it did change between the
months (Figure 1) and might be an important indicator for issues in risk and benefit
perception. However, as the SVM classifier detects benefit-related tweets better than
risk-related tweets, the RR (BR) metric is suspected to be lower (higher) than the
reported one.
We identified a spike in BR in August 2015 in Figure 1. By inspecting the tweets
from August 2015, we found that many tweets mentioned the announcement of
autonomous crash trucks that help to improve safety at road construction sites [43].
Drivers of crash trucks are usually in a very dangerous situation. Removing the driver
could save many lives and was obviously very well received by the public.
Plotting the tweets over time, we could observe several changes in the number of
risk and benefit tweets. For example, the graph of risk tweets (Figure 2) shows a peak
in the number of Risk tweets in November in 2015.
The chart in Figure 2 also displays an increase of benefit-related tweets during the
month of November in 2015. A close inspection of the tweets leads us to believe that
the general increase of tweets was perhaps due to the International Driverless Cars
Conference that occurs annually in November.
1228
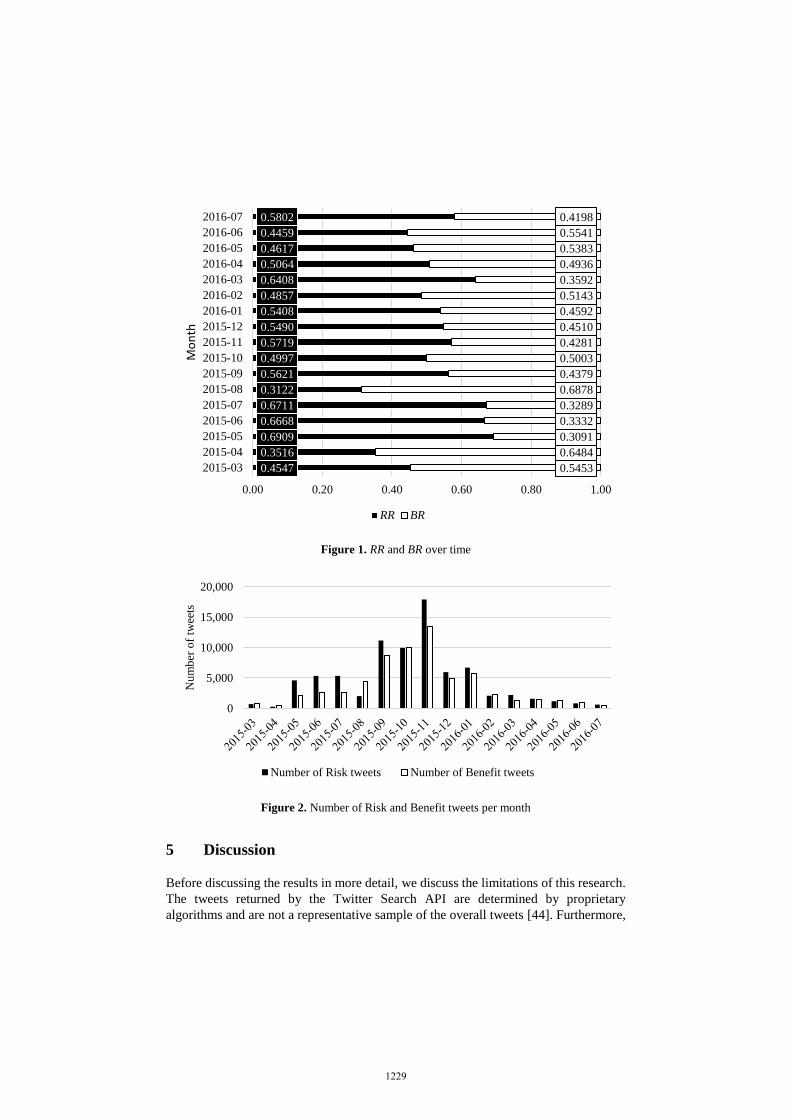
Figure 1. RR and BR over time
Figure 2. Number of Risk and Benefit tweets per month
5 Discussion
Before discussing the results in more detail, we discuss the limitations of this research.
The tweets returned by the Twitter Search API are determined by proprietary
algorithms and are not a representative sample of the overall tweets [44]. Furthermore,
0.4547
0.3516
0.6909
0.6668
0.6711
0.3122
0.5621
0.4997
0.5719
0.5490
0.5408
0.4857
0.6408
0.5064
0.4617
0.4459
0.5802
0.5453
0.6484
0.3091
0.3332
0.3289
0.6878
0.4379
0.5003
0.4281
0.4510
0.4592
0.5143
0.3592
0.4936
0.5383
0.5541
0.4198
0.00 0.20 0.40 0.60 0.80 1.00
2015-03
2015-04
2015-05
2015-06
2015-07
2015-08
2015-09
2015-10
2015-11
2015-12
2016-01
2016-02
2016-03
2016-04
2016-05
2016-06
2016-07
Month
RR BR
0
5,000
10,000
15,000
20,000
Nu
mb
er o
f tw
eets
Number of Risk tweets Number of Benefit tweets
1229
Twitter users are not a representative sample of the population [44]. As our analysis is
based on English tweets, the main population analyzed might be located in the U.S. and
should not be considered a representative global or U.S. sample [45]. In addition, only
a small fraction of tweets in our dataset contain a geolocation so that we could not
differentiate between different regions, which remains an ongoing issue in Twitter
research [46]. As the training dataset plays an important role for training and evaluating
the SVM, results depend on its quality. As described in the previous section, we found
indications that the training data is of high quality but further robustness checks could
provide additional evidence for the quality of the training data. Considering these
limitations, however, we found interesting results that we carefully discuss in this
section. This allows us the get valuable insights about people’s perceptions as previous
Twitter research has [14].
The RR and BR values calculated in this study indicate that people have reservations
regarding self-driving cars. People tweet about risks of self-driving cars almost three
times as much than about the benefits. Even if the difference might not be as big as this
number suggests due to the limitations of our analysis, technology acceptance would
not be guaranteed in the current state, making a disruption of individual mobility seem
unlikely in the near future. This presents a problem that needs to be tackled before self-
driving are sold to the public. We calculated the BR and RR values of separate years,
to analyze the tweets over time and could find a small increase in RR from 0.5581 to
0.5290 (+5.2%). This might indicate that the impressive recent technical developments
do not affect risk and benefit perceptions much and communication strategies should
be reconsidered.
Suggestions for improvement can be derived by going over the tweet contents of the
classified tweets, and trying to understand the reasons behind both risk and benefit
perceptions towards self-driving cars. Among the different risk-related tweets, most of
the tweets displayed concern towards the vehicles’ accident, for example: “[…]
Google’s driverless cars have been involved in four car accidents” or “CAR CRASH
Google Self Driving Cars to Decide if You Live or Die […]”. This might be a case of
a distorted perception of a risk as it contradicts current research. Experts argue that 93%
of car accidents are due to driver error [23] and the use of self-driving cars could reduce
car accidents by that exact amount [6].
People also display distrust towards the manufacturing companies and conveyed
their love for driving, for example: “Sorry @google not going to buy a self driving car
I like driving and don’t trust your technology”. In this case, benefit perception might
be distorted. While driving can be enjoyable in certain situations, we find ourselves
often confronted with less enjoyable aspects of driving such as traffic congestions, long
monotonous highways with speed limitations, or on the search for a parking space in
increasingly crowded cities. The author of this tweet might not be aware of this
perspective, which could be used in communication strategies to improve benefit
perceptions.
Furthermore, people also displayed fear for their own safety and privacy (e.g., “[…]
Can #driverless #cars be made safe from hackers?”), where hacking someone’s car
could allow others to take control of your vehicle. Hackers might even go as far as
writing viruses that could be transmitted from car to car. This is a risk that could proof
1230
to be real. We already see hacker attacks on current cars. These hacking attacks could
cause physical harm to the passengers, which might be perceived more severe than
having a personal computer hacked even if the consequences can be severe, too (e.g.,
huge financial losses, loss of private documents, publication of sensitive data).
Manufacturers of self-driving cars need to be aware of that and provide strategies of
how to avoid hacking of their vehicles.
Regarding the tweets that were classified as benefits of self-driving cars, many users
were especially attracted to the fact that they could save time through self-driving
vehicles, for example: “Sleepy time in the car for a in back seat. Wish I had a self
driving car & I coulda joined em……”. This is also might be a case of distorted benefit
perception since only full self-driving automation or level 4 automation [21] allows
sleeping while driving. The current level of automation is 2 and it is likely to take some
years until we arrive at level 3 or even level 4 automation. Meanwhile, many drivers
are misusing current self-driving, for example by even leaving the driver’s seat entirely
while driving on a public road using the Autopilot feature of a Tesla Model S [20].
People expecting to soon be able to sleep while driving might become disappointed if
such systems will not be released soon as suggested by some developers of self-driving
cars.
In general, people are impressed by the innovation put into the self-driving concept,
for example: “[…] That hyper-futuristic driverless Mercedes has been spotted in San
Fran – again […]”. Most benefit tweets reflected that people were simply excited to try
something new, for example: “[…] A perk of living near Google… We saw the
self-driving car today on the highway!” Developers of self-driving have recognized that
people are excited about this new technology and the benefits it could provide.
Consequently, they are investing in the development of self-driving cars and already
promise features that will first be implemented in several years. If communication
strategies are not adjusted, this excitement could cause exaggerated risk perceptions
and a misunderstanding of the benefits self-driving cars are going to provide. Focusing
only on the benefits and even generating exaggerated benefit perceptions could have
adverse effects on public acceptance of self-driving cars.
6 Conclusion
The results indicate the need for developers and manufacturers to listen to the voice of
customers of self-driving cars and probably rethink their communication strategy. By
analyzing 601,778 tweets using supervised machine learning classification, we
identified the need to clearly reassure the public of their risk perceptions. People tweet
more about risks of self-driving cars than about the benefits. Many of the supportive
tweets indicated that the benefit perceptions neglect the actual state of the technology
and, thus, could be dangerous or lead to disappointment when trying the new
technology for the first time. Getting potential customers to perceive the objective
benefits of self-driving cars such as increased safety and increased comfort might
increase benefit perception sustainably. This would lead to less disappointment with
self-driving cars when they become available to the broad public and, thus, lead to
1231
higher acceptance. It is not likely that self-driving cars will disrupt individual mobility
in the near future due to the lack of acceptance.
This analysis focused only on Twitter. Further research could replicate this approach
using different machine learning algorithms, datasets, and other new technologies. It
was not in the scope of this paper to optimize the machine learning text classification
to reach the best possible classification accuracy of the SVM. By tuning the parameters
of the SVM or generating additional training data, analyses could be improved. Further
research of self-driving cars could be based on other keywords and use other
approaches such as topic modeling [47] instead of supervised machine learning to
remove the effortful manual classification of Tweets.
With the applied optimizations for text classification we could achieve sufficient
accuracy of the text classification. Combined with manual inspection of the classified
tweets to identify the cause for certain developments of risk and benefit perceptions,
we could make well-founded suggestions for improving the public acceptance of
self-driving cars. We identified a promising metric, risk rate RR, which can be used to
study risk and benefit perceptions in social media. Furthermore, we identified issues in
the communication strategies of self-driving car developers.
7 Acknowledgements
This work was performed within the Munich Center for Technology in Society (MCTS)
Post/Doc Lab “Automation & Society: The Case of Highly Automated Driving”.
References
1. Bower, J.L., Christensen, C.M.: Disruptive Technologies: Catching the Wave. Harv. Bus.
Rev. 73, 43–53 (1995).
2. Cherubini, S., Iasevoli, G., Michelini, L.: Product-Service Systems in the Electric Car
Industry: Critical Success Factors in Marketing. J. Clean. Prod. 97, 40–49 (2015).
3. Teubner, T., Flath, C.M.: The Economics of Multi-Hop Ride Sharing: Creating
New Mobility Networks Through IS. Bus. Inf. Syst. Eng. 57, 311–324 (2015).
4. The Economist: If Autonomous Vehicles Rule The World: From Horseless to
Driverless, http://worldif.economist.com/article/12123/horseless-driverless (Accessed:
31.10.2016).
5. Fagnant, D.J., Kockelman, K.: Preparing a Nation for Autonomous Vehicles:
Opportunities, Barriers and Policy Recommendations. Transp. Res. Part A Policy Pract. 77,
167–181 (2015).
6. Davis, F.D., Bagozzi, R.P., Warshaw, P.R.: User Acceptance of Computer Technology: A
Comparison of Two Theoretical Models. Manage. Sci. 35, 982–1003 (1989).
7. Gogoll, J., Müller, J.F.: Autonomous Cars: In Favor of a Mandatory Ethics Setting. Sci.
Eng. Ethics. 1–20 (2016).
8. Gupta, N., Fischer, A.R.H., Frewer, L.J.: Socio-Psychological Determinants of Public
Acceptance of Technologies: A Review. Public Underst. Sci. 21, 782–95 (2012).
9. Siegrist, M.: The Influence of Trust and Perceptions of Risks and Benefits on the
Acceptance of Gene Technology. Risk Anal. 20, 195–204 (2000).
1232
10. O’Donnell, J.: Self-Driving Cars Could Have Long Road to Acceptance,
http://www.usatoday.com/story/money/cars/2013/06/13/autonomous-vehicles-audi-
google-drivers-crashes/2415909/ (Accessed: 31.10.2016).
11. Pizano, G.: How Much Has Social Media Changed Society?,
http://www.shoutmeloud.com/how-much-has-social-media-changed-society.html
(Accessed: 31.10.2016).
12. St Louis, C., Zorlu, G.: Can Twitter Predict Disease Outbreaks? BMJ. 344, e2353 (2012).
13. Tumasjan, A., Sprenger, T.O., Sandner, P.G., Welpe, I.M.: Predicting Elections with
Twitter: What 140 Characters Reveal about Political Sentiment. In: Proceedings of the
Fourth International AAAI Conference on Weblogs and Social Media. pp. 178–185 (2010).
14. Pak, A., Paroubek, P.: Twitter as a Corpus for Sentiment Analysis and Opinion Mining.
In: Proceedings of the Seventh Conference on International Language Resources and
Evaluation. pp. 1320–1326 (2010).
15. Venkatesh, V., Davis, F.D., Morris, M.G.: Dead Or Alive? The Development, Trajectory
And Future Of Technology Adoption Research. J. Assoc. Inf. Syst. 8, 267–286 (2007).
16. Venkatesh, V., Morris, M.G., Davis, G.B., Davis, F.D.: User Acceptance of
Information Technology: Toward a Unified View. Source MIS Q. 27, 425–478 (2003).
17. Venkatesh, V., Thong, J.Y.L., Xu, X.: Unified Theory of Acceptance and Use of
Technology: A Synthesis and the Road Ahead. J. Assoc. Inf. Syst. 17, 328–376 (2016).
18. Martins, C., Oliveira, T., Popovič, A.: Understanding the Internet Banking Adoption:
A Unified Theory of Acceptance and Use of Technology and Perceived Risk Application.
Int. J. Inf. Manage. 34, 1–13 (2014).
19. Lancelot Miltgen, C., Popovič, A., Oliveira, T.: Determinants of End-User
Acceptance of Biometrics: Integrating the “Big 3” of Technology Acceptance with Privacy
Context. Decis. Support Syst. 56, 103–114 (2013).
20. Yadron, D., Tynan, D.: Tesla Driver Dies in First Fatal Crash While Using Autopilot
Mode, https://www.theguardian.com/technology/2016/jun/30/tesla-autopilot-death-self-
driving-car-elon-musk (Accessed: 31.10.2016).
21. NHTSA: National Highway Traffic Safety Administration Preliminary Statement of
Policy Concerning Automated Vehicles,
http://www.nhtsa.gov/About+NHTSA/Press+Releases/U.S.+Department+of+Transportatio
n+Releases+Policy+on+Automated+Vehicle+Development (Accessed: 31.10.2016).
22. Krok, A.: This Is the Stupidest Misuse of Tesla’s Autopilot yet,
http://www.cnet.com/news/this-is-the-stupidest-misuse-of-teslas-autopilot-yet/ (Accessed:
31.10.2016).
23. Gold, C., Dambock, D., Lorenz, L., Bengler, K.: “Take over!” How Long Does It
Take to Get the Driver Back into the Loop? In: Proceedings of the Human Factors and
Ergonomics Society Annual Meeting. pp. 1938–1942 (2013).
24. Schoettle, B., Sivak, M.: A Survey of Public Opinion About Autonomous and
Self-Driving Vehicles in the U.S., the U.K., and Australia,
https://deepblue.lib.umich.edu/handle/2027.42/108384 (Accessed: 31.10.2016).
25. Treat, J.R., Tumbas, N.S., McDonald, S.T., Shinar, D., Hume, R.D., Mayer, R.E., Stansifer,
R.L., Castellan, N.J.: Tri-Level Study of the Causes of Traffic Accidents: Final Report,
https://trid.trb.org/view.aspx?id=144150 (Accessed: 31.10.2016).
26. Fraedrich, E., Cyganski, R., Wolf, I., Lenz, B.: User Perspectives on Autonomous
Driving. In: Arbeitsberichte 187. Geographisches Institut, Humboldt-Universität, Berlin
(2016).
27. Eckoldt, K., Knobel, M., Hassenzahl, M., Schumann, J.: An Experiential
Perspective on Advanced Driver Assistance Systems. it - Inf. Technol. 54, 165–171 (2012).
1233
28. Kasperson, R.E., Kasperson, J.X.: The Social Amplification and Attenuation of
Risk. Ann. Am. Acad. Pol. Soc. Sci. 545, 95–105 (1996).
29. Kleijnen, M., Lee, N., Wetzels, M.: An Exploration of Consumer Resistance to
Innovation and Its Antecedents. J. Econ. Psychol. 30, 344–357 (2009).
30. Pang, B., Lee, L.: Opinion Mining and Sentiment Analysis. Found. Trends Inf. Retr.
2, 1–135 (2008).
31. Sharma, R., Yetton, P., Crawford, J.: Estimating the Effect of Common Method
Variance: The Method-Method Pair Technique with an Illustration from TAM Research.
MIS Q. 33, 473–490 (2009).
32. Okazaki, S., Diaz-Martin, A.M., Rozano, M., Menendez-Benito, H.: How to Mine
Brand Tweets Procedural Guidelines and Pretest. Int. J. Mark. Res. 56, 467–489 (2014).
33. Twitter: The Search API, https://dev.twitter.com/rest/public/search (Accessed:
31.10.2016).
34. Twitter: Public API: GET Search/tweets,
https://dev.twitter.com/rest/reference/get/search/tweets (Accessed: 31.10.2016).
35. Twitter: Help Center: The Basics, https://support.twitter.com/articles/131209
(Accessed: 31.10.2016).
36. Feinerer, I., Hornik, K., Meyer, D.: Text Mining Infrastructure in R. J. Stat. Softw.
25, 1–54 (2008).
37. Pang, B., Lee, L., Vaithyanathan, S.: Thumbs up? Sentiment Classification Using
Machine Learning Techniques. In: Proceedings of the ACL-02 Conference on Empirical
Methods in Natural Language Processing - EMNLP ’02. pp. 79–86 (2002).
38. Joachims, T.: Text Categorization with Support Vector Machines: Learning with Many
Relevant Features. In: Nédellec, C. and Rouveirol, C. (eds.) Machine Learning: ECML-98.
pp. 137–142. Springer Berlin Heidelberg (1998).
39. Chang, C., Lin, C.: LIBSVM : A Library for Support Vector Machines. ACM Trans.
Intell. Syst. Technol. 2, 1–39 (2011).
40. Kohavi, R.: A Study of Cross-Validation and Bootstrap for Accuracy Estimation and
Model Selection. Int. Jt. Conf. Artif. Intell. 14, 1137–1143 (1995).
41. Sriram, B., Fuhry, D., Demir, E., Ferhatosmanoglu, H., Demirbas, M.: Short Text
Classification in Twitter to Improve Information Filtering. In: Proceedings of the 33rd
International ACM SIGIR Conference on Research and Development in Information
Retrieval - SIGIR ’10. pp. 841–842 (2010).
42. Kuhn, M.: Building Predictive Models in R Using the Caret Package. J. Stat. Softw. 28,
1–26 (2008).
43. Rubinkam, M.: Driverless Truck Meant to Improve Safety in Work Zones,
https://www.yahoo.com/news/driverless-truck-meant-improve-safety-zones-
202055180.html (Accessed: 31.10.2016).
44. Ruths, D., Pfeffer, J.: Social Media for Large Studies of Behavior. Science. 346, 1063–
1064 (2014).
45. Mislove, A., Lehmann, S., Ahn, Y.-Y., Onnela, J.-P., Rosenquist, J.N.: Understanding
the Demographics of Twitter Users. In: ICWSM ’11 Proceedings of international AAAI
Conference on Weblogs and Social Media. pp. 554–557 (2011).
46. Cha, M., Haddadi, H., Benevenuto, F., Gummadi, K.P.: Measuring User Influence
in Twitter: The Million Follower Fallacy. In: ICWSM ’10: Proceedings of international
AAAI Conference on Weblogs and Social Media. pp. 10–17 (2010).
47. Debortoli, S., Müller, O., Junglas, I., Vom Brocke, J.: Communications of the
Association for Information Systems Text Mining For Information Systems Researchers:
An Annotated Topic Modeling Tutorial. Commun. Assoc. Inf. Syst. 39, 110–135 (2016).
1234