Embed Size (px)
Citation preview

DISEASE MANAGEMENT AND MICROALGAL BIOFERTILIZATION FOR
RICE PRODUCTION
A Thesis
by
LUIS PATRICIO MONCAYO LEMA
Submitted to the Office of Graduate and Professional Studies of
Texas A&M University
in partial fulfillment of the requirements for the degree of
MASTER OF SCIENCE
Chair of Committee, Young-Ki Jo
Committee Members, Xin-Gen Zhou
Michael Orrin Way
Kevin Ong
Head of Department, Leland S. Pierson III
August 2015
Major Subject: Plant Pathology
Copyright 2015 Luis Patricio Moncayo Lema

ii
ABSTRACT
Sheath blight (ShB) caused by Rhizoctonia solani AG1-IA, narrow brown leaf
spot (NBLS) caused by Cercospora janseana and fertility are among the most important
factors limiting rice production in the U.S. Greenhouse experiments were conducted to
better understand the effects of temperature and cultivar resistance on the biocontrol
efficacy of Bacillus subtilis strain MBI 600 for management of ShB. Also, lab and field
trials were conducted to evaluate the efficacy of fungicides for control of C. janseana
and NBLS. In addition, greenhouse and field trials were conducted to explore the use of
microalgae-based biofertilizers for rice production. In the first study in the greenhouse,
plants of two rice cultivars (moderately resistant and susceptible to ShB) were spray
treated with strain MBI 600 and subjected to different temperatures for 24 hours in dew
growth chambers. Disease severity was assessed after 8 days of incubation. In the second
study under in vitro conditions, fungicide sensitivity of C. janseana based on the
percentage relative germination and the effective concentration that inhibited 50% of
conidia germination were assessed. A field trial was also conducted in 2012 and 2014 to
evaluate the efficacy of fungicides for control of NBLS and yield improvement. In the
third study, greenhouse and field trials were conducted to evaluate the effects of N2-
fixing cyanobacterial biofertilizer, microalgal biomass concentrate, and urea fertilizer on
rice plant height and yield.
In the first study, temperature significantly affected the relative biocontrol
efficacy of strain MBI 600 in reducing ShB development in either cultivar. Its efficacy
linearly increased with the increase of temperature, reaching the maximum at 35 or
40°C.
In the second study, the succinate dehydrogenase inhibitor fungicides
fluxapyroxad and flutolanil were most and least effective, respectively, in inhibiting C.
janseana conidia, indicating that there was no cross-resistance between fluxapyroxad
and flutolanil. Fluxapyroxad, propiconazole alone and in combination with azoxystrobin

iii
or trifloxystrobin were highly effective controlling NBLS. However, azoxystrobin was
not effective to control NBLS.
In the third study in the greenhouse, microalgal biomass concentrate treatment
significantly improved rice plant height. However, no biofertilizer treatments improved
rice yield in the field.

iv
DEDICATION
To my God and my whole family.

v
ACKNOWLEDGEMENTS
I would like to thank my sponsor SENESCYT, my committee chair, Dr. Young-
Ki Jo, and my committee members, Dr. Xin-Gen Zhou, Dr. Michael Way, and Dr. Kevin
Ong, for their kindly guidance and support throughout the course of this research.
Thanks to the Texas Rice Research Foundation, and Texas A&M AgriLife
Research Center that sponsored part of my research as well my assistantship. Thanks to
Dr. J. W. Kloepper for providing the B. subtilis strain MBI 600 for the biocontrol study.
I also would like to thank to Dr. Jerry Brand, Dr. David Nobles, Mr. Michael Jochum,
Dr. Schonna Manning, and the UTEX Culture Collection of Algae for providing the
algal cultures and sharing their knowledge of Phycology for this study.
Similarly, thanks to Drs. Ted Wilson and Maxwell Handiseni for their assistance
in data analysis. Thanks to Dr. Guangjie Liu for his assistance in the establishment of the
biocontrol study.
Thanks also to Dr. Lorna Nissen and Mr. Matthew Zidek for their friendship and
help that make my time at Texas A&M University a great experience. Finally, thanks to
my whole family for their support.

vi
TABLE OF CONTENTS
Page
ABSTRACT .............................................................................................................. ii
DEDICATION .......................................................................................................... iv
ACKNOWLEDGEMENTS ...................................................................................... v
TABLE OF CONTENTS .......................................................................................... vi
LIST OF FIGURES ................................................................................................... viii
LIST OF TABLES .................................................................................................... ix
CHAPTER I INTRODUCTION .......................................................................... 1
CHAPTER II EFFECT OF TEMPERATURE ON THE
EFFICACY OF Bacillus subtilis STRAIN MBI 600
FOR BIOCONTROL OF SHEATH BLIGHT IN RICE .......................................... 4
Introduction ........................................................................................................ 4
Materials and Methods ........................................................................................ 6
Results......... ........................................................................................................ 8
Discussion.......................................................................................................... . 11
CHAPTER III EFFECT OF FUNGICIDES ON CONIDIA GERMINATION OF
Cercospora janseana AND DISEASE SEVERITY ON RICE ................................ 14
Introduction ........................................................................................................ 14
Materials and Methods ........................................................................................ 15
Results................ ................................................................................................. 19
Discussion..................................................................................... ...................... 24

vii
Page
CHAPTER IV LIMITED EFFECTS OF MICROALGAL
BIOFERTILIZERS FOR RICE PRODUCTION IN TEXAS ................................... 32
Introduction ........................................................................................................ 32
Materials and Methods ........................................................................................ 33
Results................ ................................................................................................. 38
Discussion..................................................................................... ...................... 42
CHAPTER V CONCLUSIONS ............................................................................ 47
REFERENCES .......................................................................................................... 49
APPENDIX A ........................................................................................................... 61
APPENDIX B ........................................................................................................... 64

viii
LIST OF FIGURES
FIGURE Page
1 Effect of temperature on in vitro mycelial growth of R. solani. ................ 9
2 Effect of rice cultivar and biocontrol treatment on severity
of sheath blight (ShB) in rice. .................................................................... 9
3 Effect of temperature on sheath blight (ShB) severity of rice plants
treated with the biocontrol or untreated (control)... ................................... 10
4 Effect of temperature on the relative efficacy of B. subtilis
strain MBI 600 for biocontrol of sheath blight in rice. .............................. 11
5 Relative germination percentage according
to each C. janseana isolate. ........................................................................ 20
6 Relative germination percentage for C. janseana isolates
according to each active ingredient.. .......................................................... 21
7 Narrow brown leaf spot (NBLS) severity in rice fields. ............................ 25
8 Rice yield (kg ha-1
) according to each fungicide for the field study
on 2012 (A), and 2014 (B).. ....................................................................... 26
9 Over time effect of different fertilization treatments on
rice plant height (cm) for Exp 1 (A), Exp 2 (B), and
Exp 3 (C) under greenhouse conditions. .................................................... 40
10 Effect of different fertilizers on rice yield for the field study
during 2013 (A) and 2014 (B). ................................................................... 42

ix
LIST OF TABLES
TABLE Page
1 Description of fungicides used
for the control of NBLS under field conditions ......................................... 18
2 Analysis of variance for the effect of experiment, isolate,
active ingredient, and the interaction of isolate by active
ingredient in the relative germination percentage
of C. janseana isolates ............................................................................... 20
3 EC50 values (µg mL-1
) of five C. janseana isolates
for different fungicide active ingredients. .................................................. 23

1
CHAPTER I
INTRODUCTION
Rice (Oryza sativa) is one of the world’s most important food crops (Khush
1997). It feeds more than the half of the world’s population. However, rice production is
affected by various diseases and low nitrogen use efficiency.
Sheath blight (ShB), caused by Rhizoctonia solani Kühn AG1-IA [teleomorph
Thanatephorus cucumeris (A. B. Frank) Donk], is the most important disease in the
southern rice-growing region in the United States (Lee and Rush 1983; Marchetti 1983).
Up to 50% in yield losses due to sheath blight have been reported (Lee and Rush 1983).
Sheath blight can cause symptoms on leaf sheaths, leaf blades and even panicles,
resulting in poorly filled grains (Lee and Rush 1983). High rate of nitrogen fertilizer
application, susceptible cultivars, cultivation of semi dwarf as well as high plant density
aggravates the spread of the pathogen (Wang et al. 2011; Lee and Rush 1983; Kalpana et
al. 2006). Currently, rice producers have limited tools for management of this disease
other than synthetic fungicides. No accepted levels of resistance are available in the
commercial rice cultivars (Mew et al. 2004; Pinson et al. 2005; Xu et al. 2011).
Biocontrol agents constitute an environmentally-friendly alternative for the control of
sheath blight. Bacillus subtilis MBI 600 has been shown to be effective in controlling R.
solani under lab, greenhouse and field conditions (Kumar et al. 2011a; Kumar et al.
2011b; Kumar et al. 2012). Understanding the impact of temperature on the efficacy of
B. subtilis will enhance applicability of B. subtilis and help to develop an effective
biocontrol method for rice sheath blight management. The objective of this study was to
determine the effect of temperature on the efficacy of B. subtilis MBI 600 for control of
sheath blight in rice.
Narrow brown leaf spot (NBLS) is caused by the fungus Cercospora janseana
(Biswas 2006). Although NBLS was considered a minor disease three decades ago (Ou
1985), it has become one of the major diseases limiting rice production in the United

2
States, especially on the late plantings and the ratoon crop in Texas and Louisiana (Zhou
2014). The fungus grows slowly, with periods of 20-30 days of incubation reported
(Estrada and Ou 1978). Symptoms of this disease are characterized by short, linear red-
brown lesions on leaves, restricted between the veins (Biswas 2006). In some cases, C.
janseana causes grain discoloration and chalkiness, resulting in a decreased market
value of rice (Kurniawati et al. 2009). Control of NBLS has been attempted through
breeding for race-resistant cultivars; however, rice cultivars may become susceptible
within a few years because of the development of new races of the fungus (Sah and Rush
1988). Chemical control can be an effective option to control NBLS. However, failures
to control NBLS using some fungicides have been observed in Texas (Zhou personal
communication). Understanding the sensitivity of C. janseana populations to new and
existing fungicides would be helpful to develop more effective fungicide management
program for NBLS. The objectives of this study were to determine the inhibitory effect
of different active ingredients of fungicides labeled for the control of C. janseana under
in vitro conditions, and evaluate the effect of different fungicides on NBLS severity and
rice yield in the field.
Rice is affected by low nitrogen fertilizer efficiency due to nitrogen losses (De
Datta and Buresh 1989). It has been mentioned that nitrogen fertilization mainly
increases methane emissions (Banger et al. 2012). On the other hand, numerous studies
have supported the importance of using cyanobacteria as a biofertilizer in tropical
(Shukla and Gupta 1967; Tirol et al. 1982; Mandal et al. 1999; Jha et al. 2013) and
temperate rice-growing regions (Henriksson 1971; Reynaud and Metting 1988).
Cyanobacteria possess vegetative cells that are responsible for photosynthesis, and
heterocystous cells that fix atmospheric N2 (Sinha and Häder 1996). After cyanobacterial
decomposition, most of the fixed products are made available to rice. Cyanobacteria
have additional advantages such as, release of phosphate, improvement of soil structure
(Mandal et al. 1999), decrease in Fe toxicity (Das et al. 1991), as well as growth-
promoting effects in different crops (Shukla and Gupta 1967; Karthikeyan et al. 2007;
Prasanna et al. 2013). The use of economically and environmentally-friendly algae-

3
based biofertilizers in paddy rice fields present a promising alternative of synthetic
fertilizers. The objective of this study was to evaluate the contribution of different
microalgal biofertilizers including microalgal biomass concentrate, live N2-fixing
cyanobacteria, as well as conventional fertilizer (urea) to rice plant growth and yield.

4
CHAPTER II
EFFECT OF TEMPERATURE ON THE EFFICACY OF Bacillus subtilis STRAIN
MBI 600 FOR BIOCONTROL OF SHEATH BLIGHT IN RICE
INTRODUCTION
Rice is one of the world’s most important food crops (Khush 1997) and it is a
major staple food among two-thirds of the world’s population (Batres-Marquez et al.
2009). However, rice production is threatened by various plant diseases. Sheath blight,
caused by the soilborne fungus R. solani, is the second major disease in terms of
economic importance in major rice-growing countries (Banniza and Holderness 2001).
In the United States, sheath blight is the most economically-important rice disease (Lee
and Rush 1983; Marchetti 1983). Up to 50% in yield losses due to sheath blight can
occur on susceptible cultivars (Lee and Rush 1983).
Sheath blight can cause symptoms on leaf sheaths, leaf blades and even panicles
(Lee and Rush 1983). Sclerotia and mycelium in infected plant debris are the main
source of inoculum for the development of this disease (Ou 1985; Kobayashi et al.
1997). Initial infection starts when sclerotia float and attach rice plant sheaths at the
water line in flooded fields. Kumar et al. (2011d) state that symptoms start with green-
grey water soaked lesions that first appear on lower rice sheaths at the late tillering or
early internode elongation stage, then lesions expand with bleached appearance
surrounding by a brown border. They furthermore describe that under favorable
conditions with more than 95% relative humidity and temperature of 28 - 32°C, the
disease spreads to leaf blades and other upper parts of plants by runner hyphae. The
pathogen is also able to infect panicles, resulting in poorly filled grains, especially in the
lower portion of the panicle (Lee and Rush 1983). In addition, the disease also causes
lodging, resulting in a significant loss in yield.
Use of susceptible semi-dwarf cultivars and modern cultural practices such as
high rates of nitrogen fertilizer and high plant density tend to increase the incidence and

5
severity of sheath blight worldwide (Lee and Rush 1983; Kalpana et al. 2006; Wang et
al. 2011). Currently, rice producers have limited tools to manage this disease. No
accepted levels of resistance are available in the commercial rice cultivars (Mew et al.
2004; Pinson et al. 2005; Xu et al. 2011). Farmers heavily depend on the use of synthetic
fungicides.
Over the past two decades, as chemical alternatives, there has been an increased
interest in the biological control of rice diseases (Kumar et al. 2011a). One example of
the biological control agent is plant growth-promoting rhizobacteria (PGPR) (Kumar et
al. 2011a). Bacillus spp. and fluorescent Pseudomonas spp. are among the most widely
studied PGPRs for control of sheath blight (Kumar et al. 2011d). B. subtilis PGPR
strains, including strain MBI 600 have demonstrated antifungal activities against R.
solani (Kumar et al. 2011a; Kumar et al. 2011b; Kumar et al. 2012). Biocontrol
properties of strain MBI 600 were compatible with commonly used synthetic fungicides
in rice (Kumar et al. 2012). This strain even improved rice seed germination and
seedling growth under both laboratory and greenhouse conditions (Kumar et al. 2011a).
Mechanisms of action associated with the biocontrol activities of B. subtilis
include antibiosis, competition for infection sites, and induced systemic resistance.
Antibiosis in B. subtilis includes production of iturin and fengycin antibiotics that
suppress fungal pathogens (Moyne et al. 2001; Romero et al. 2007). Inhibition of
bacterial quorum sensing (QS) as a new biocontrol mechanism has been reported before
(Kumar, A. et al. 2011). Bacterial enzymes produced by Bacillus isolates can inhibit the
QS of phytopathogenic bacteria. Induced systemic resistance by B. subtilis has been
reported to contribute to antifungal activities (Choudhary and Johri 2008; García-
Gutiérrez et al. 2012; Chowdappa et al. 2013). The enhancement of plant growth and
health by Bacillus PGPRs is due to the synthesis of plant growth regulators such as
auxins and gibberellic acid induced by Bacillus species. (Broadbent et al. 1977).
Temperature and leaf wetness duration are among the most important
environmental factors affecting the growth and activity of plant pathogens (Huber and
Gillespie 1992). The optimum temperatures for the mycelial growth of R. solani are in
6
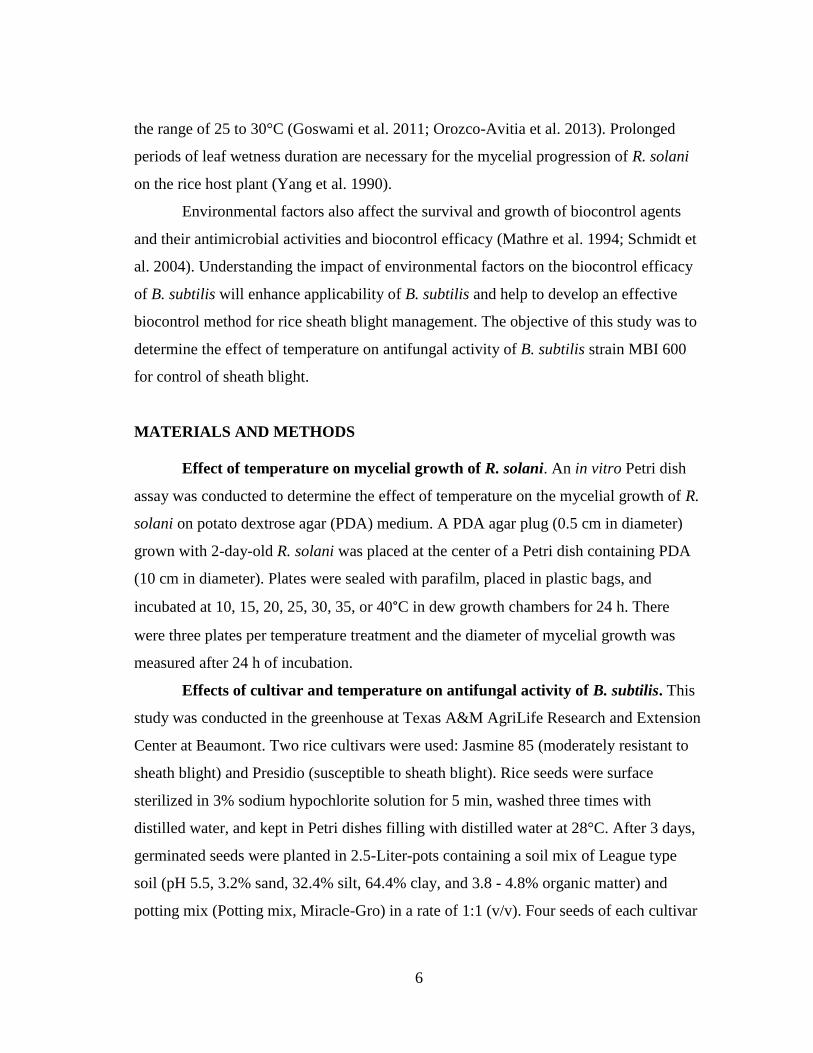
the range of 25 to 30°C (Goswami et al. 2011; Orozco-Avitia et al. 2013). Prolonged
periods of leaf wetness duration are necessary for the mycelial progression of R. solani
on the rice host plant (Yang et al. 1990).
Environmental factors also affect the survival and growth of biocontrol agents
and their antimicrobial activities and biocontrol efficacy (Mathre et al. 1994; Schmidt et
al. 2004). Understanding the impact of environmental factors on the biocontrol efficacy
of B. subtilis will enhance applicability of B. subtilis and help to develop an effective
biocontrol method for rice sheath blight management. The objective of this study was to
determine the effect of temperature on antifungal activity of B. subtilis strain MBI 600
for control of sheath blight.
MATERIALS AND METHODS
Effect of temperature on mycelial growth of R. solani. An in vitro Petri dish
assay was conducted to determine the effect of temperature on the mycelial growth of R.
solani on potato dextrose agar (PDA) medium. A PDA agar plug (0.5 cm in diameter)
grown with 2-day-old R. solani was placed at the center of a Petri dish containing PDA
(10 cm in diameter). Plates were sealed with parafilm, placed in plastic bags, and
incubated at 10, 15, 20, 25, 30, 35, or 40°C in dew growth chambers for 24 h. There
were three plates per temperature treatment and the diameter of mycelial growth was
measured after 24 h of incubation.
Effects of cultivar and temperature on antifungal activity of B. subtilis. This
study was conducted in the greenhouse at Texas A&M AgriLife Research and Extension
Center at Beaumont. Two rice cultivars were used: Jasmine 85 (moderately resistant to
sheath blight) and Presidio (susceptible to sheath blight). Rice seeds were surface
sterilized in 3% sodium hypochlorite solution for 5 min, washed three times with
distilled water, and kept in Petri dishes filling with distilled water at 28°C. After 3 days,
germinated seeds were planted in 2.5-Liter-pots containing a soil mix of League type
soil (pH 5.5, 3.2% sand, 32.4% silt, 64.4% clay, and 3.8 - 4.8% organic matter) and
potting mix (Potting mix, Miracle-Gro) in a rate of 1:1 (v/v). Four seeds of each cultivar

7
were planted per pot. After 13 days of planting, plants were thinned to three plants per
pot.
B. subtilis MBI 600 was harvested by washing off the bacteria in sterile distilled
water from 5-days-old cultures grown in King’s B agar medium using sterile cotton
swabs. The concentration of bacterial suspension was determined by hemocytometer and
adjusted to 1 × 10⁸ cells/mL. Tween 20 (Sigma-Aldrich) was added at 0.1% (v/v) to the
adjusted suspension. At 16 days after seeding, plants were sprayed with a suspension (1
× 108 cells/mL) of B. subtilis MBI 600 until run-off (approximately 10 mL/plant). The
treated plants were air dried, and each plant was inoculated with R. solani by placing one
PDA plug (0.5 cm in diameter) grown with 2-day-old mycelium on the surface of sheath
above the soil line. Plants inoculated with R. solani without treatment of B. subtilis
served as the positive controls. Treated plants were placed and kept at 10, 15, 20, 25, 30,
35, or 40°C in dew growth chambers (~100% humidity) for 24 h. Treated plants were
then moved out the dew chambers and air dried. Plants were covered with 2-liter
transparent soft drink bottles to maintain a high level of humidity inside the bottles and
maintained in a greenhouse with temperatures ranging from 22 to 33°C under natural
light conditions. After 8 days in the greenhouse, disease severity was measured
according to the 0-9 scale, where 0 represented no disease symptoms and 9 represented
more than 80% of rice tissue affected (Groth et al. 1990).
Data analyses. The experimental design was a split-split plot design, with the
cultivar as whole plots, biocontrol treatment as subplots, and temperature as sub-
subplots. All the factors were randomized. Each temperature treatment was conducted in
the same dew chamber. The experiment was conducted three times. Relative efficacy of
biocontrol at specific temperature was calculated based on the following formula:
((Disease severity of the untreated control - Disease severity of biocontrol treatment) ÷
Disease severity of the untreated control) × 100.
Mycelial growth and disease severity data were subjected to analyses of variance
using SAS 9.3 (SAS Institute Inc., Cary, NC). Differences among treatment means were
estimated using Fisher’s protected least significance difference (LSD) at P = 0.05.
8
RESULTS
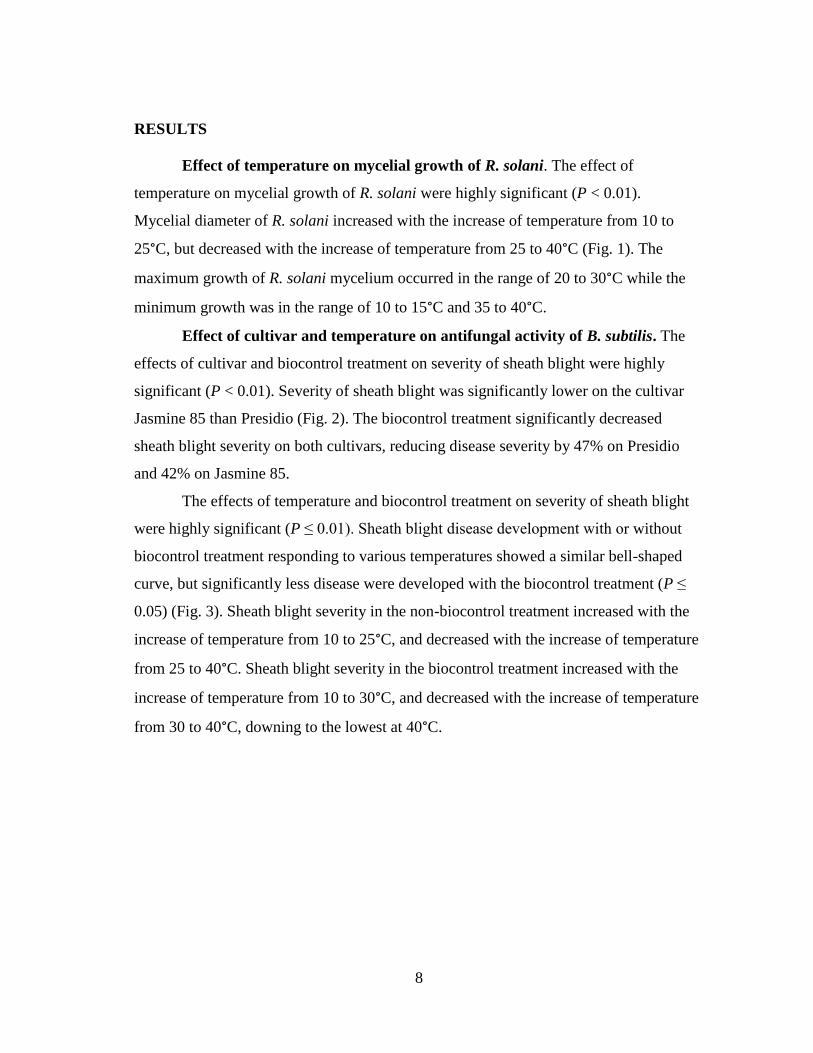
Effect of temperature on mycelial growth of R. solani. The effect of
temperature on mycelial growth of R. solani were highly significant (P < 0.01).
Mycelial diameter of R. solani increased with the increase of temperature from 10 to
25°C, but decreased with the increase of temperature from 25 to 40°C (Fig. 1). The
maximum growth of R. solani mycelium occurred in the range of 20 to 30°C while the
minimum growth was in the range of 10 to 15°C and 35 to 40°C.
Effect of cultivar and temperature on antifungal activity of B. subtilis. The
effects of cultivar and biocontrol treatment on severity of sheath blight were highly
significant (P < 0.01). Severity of sheath blight was significantly lower on the cultivar
Jasmine 85 than Presidio (Fig. 2). The biocontrol treatment significantly decreased
sheath blight severity on both cultivars, reducing disease severity by 47% on Presidio
and 42% on Jasmine 85.
The effects of temperature and biocontrol treatment on severity of sheath blight
were highly significant (P ≤ 0.01). Sheath blight disease development with or without
biocontrol treatment responding to various temperatures showed a similar bell-shaped
curve, but significantly less disease were developed with the biocontrol treatment (P ≤
0.05) (Fig. 3). Sheath blight severity in the non-biocontrol treatment increased with the
increase of temperature from 10 to 25°C, and decreased with the increase of temperature
from 25 to 40°C. Sheath blight severity in the biocontrol treatment increased with the
increase of temperature from 10 to 30°C, and decreased with the increase of temperature
from 30 to 40°C, downing to the lowest at 40°C.

9
Fig. 1. Effect of temperature on in vitro mycelial growth of R. solani. The diameter of
mycelium growth on PDA was measured at 24 h of incubation. Dots with the same letter
are not significantly different according to LSD test (P = 0.05). Error bars represent the
standard deviation of the mean.
Fig. 2. Effect of rice cultivar and biocontrol treatment on severity of sheath blight (ShB)
in rice. Columns with the same letter are not significantly different according to LSD test
(P = 0.05). Error bars represent the standard deviation of the mean.
e
d
b
a
ab
c
d
1
2
3
4
5
6
7
8
5 10 15 20 25 30 35 40
Myce
lial
dia
met
er (
cm)
Temperature (°C)
a
b
c
d
0
1
2
3
4
5
6
7
8
9
Presidio Jasmine 85 Presidio +
Biocontrol
Jasmine 85 +
Biocontrol
ShB
sev
erit
y (
0-9
)
Cultivar + Treatment

10
Fig. 3. Effect of temperature on sheath blight (ShB) severity of rice plants treated with
the biocontrol or untreated (control). Data are averaged over the two rice cultivars
Presidio and Jasmine 85 evaluated. Symbols with the same letter are not significantly
different according to LSD test (P = 0.05). Error bars represent the standard deviation of
the mean. Multiple regression equations for the untreated control and biocontrol
treatments, respectively, were y= -0.0164 x2
+ 0.8136 x - 3.3571 (R2 = 0.9185) and y = -
0.0082 x2 + 0.3812 x - 0.7 (R
2 = 0.8221) where y = disease severity (0-9) and x =
temperature (°C).
The relative efficacy of the biocontrol treatment linearly (R2
= 0.5737, P < 0.05)
increased with the increase of temperature from 10 to 40°C (Fig. 4). The relative efficacy
at 10, 15, 20, 25, 30, 35, and 40°C was 34, 28, 45, 51, 39, 56, and 50%, respectively.
fgh
d
c
a
b
de
h
i
gh gh fg
ef
ij j
0
1
2
3
4
5
6
7
8
9
5 10 15 20 25 30 35 40
ShB
sev
erit
y (
0-9
)
Temperature (°C)
Control
Biocontrol

11
Fig. 4. Effect of temperature on the relative efficacy of B. subtilis strain MBI 600 for
biocontrol of sheath blight in rice.
DISCUSSION
This study elucidates the impact of micro-environmental conditions on the
development of sheath blight and the biological control effectiveness of B. subtilis strain
MBI 600. The optimum temperature for the sheath blight development in rice was in the
range of 25 to 30°C, which is consistent with the range of temperature most favorable
for rice sheath blight development under field conditions reported in a previous study
(Rush and Lee, 1992). Our greenhouse inoculation study also indicates that the
development of sheath blight was slow at lower temperature (10 or 15°C) and
suppressed at higher temperature (35 and 40°C). These trend patterns on the effects of
temperature on sheath blight development in rice are in a good agreement with the
patterns on the effects of temperature on the growth of mycelium of R. solani on PDA
medium in the current study.
The biocontrol treatment was effective in reducing sheath blight on both Jasmine
85 and Presidio cultivars (moderately resistant and susceptible to sheath blight,
respectively). The moderate level of resistance of Jasmine 85 is conferred by a non-
allelic dominant major resistance gene (Pan et al. 1999). The biocontrol treatment
R² = 0.5737
20
25
30
35
40
45
50
55
60
5 10 15 20 25 30 35 40
Rel
ativ
e E
ffic
acy (
%)
Temperature (°C)

12
reduced sheath blight by 47% in Presidio and 42% in Jasmine 85, demonstrating that the
effect of biocontrol is similar along the level of susceptibility or resistance of the
cultivar. The best reduction in disease severity occurred when Jasmine 85 was treated
with the biocontrol. These results suggest that the combination of the biocontrol
treatment and cultivar resistance can be a more effective approach for management of
sheath blight of rice than using the biocontrol agent alone.
In the current study, the biocontrol treatment was effective in reducing sheath
blight severity at each of the seven temperatures evaluated. However, the relative
efficacy of the biocontrol treatment varies with temperature. Its relative efficacy at 10,
15, 20, 25, 30, 35 and 40°C was 34, 28, 45, 51, 39, 56, and 50%, respectively, indicating
that B. subtilis was more effective at higher temperatures (35 and 40°C) than at lower
temperatures. Results from the regression analysis demonstrate a positive linear
relationship of the relative biocontrol efficacy with the increase of temperature. This
finding explains why some of the biocontrol agents, including strain MBI 600,
frequently lack the consistent performance of biocontrol under field conditions.
Temperature in the field varies with location and season, and constantly fluctuates with
time during a day. The condition of warm temperatures and heavy dew formation at
night is likely to promote infection of R. solani but may be not the most favorable for B.
subtilis. The results of our study not only validate the efficacy of B. subtilis for
suppression of rice sheath blight under the greenhouse conditions reported in previous
studies (Kumar et al. 2011a; 2011b; 2012) but also extend the results of the previous
studies by improving our understanding of the impact of temperature on the efficacy of
biocontrol agents.
An increase in the relative efficacy of B. subtilis with the increase of temperature
might be associated with the unique biological properties of B. subtilis. B. subtilis is
tolerant against heat, desiccation and other extreme stresses by forming endospores
(Waldburger et al. 1993). Production of endospores from vegetative cells of B. subtilis is
a mechanism to overcome environmental limitations like increased temperature (Driks
2002, Setlow 2006). Setlow (2006) reported that the major factor determining spore wet

13
heat resistance is the core water content. Spores formed at higher temperatures generally
have lower water contents than do spores formed at lower temperatures, with the later
spores having lower wet heat resistance than the former (Setlow 2006). Heat shock
treatment of B. subtilis cells during sporulation increases the heat resistance of spores
formed subsequently, as a consequence of the generation of heat shock proteins
(Movahedi and Waites 2000). As a result, it is possible that in the present study higher
temperatures were likely to induce B. subtilis to produce heat-resistant endospores,
resulting in an increase in the relative biocontrol efficacy.
To our knowledge, this is the first study to demonstrate the impact of temperature
on the efficacy of B. subtilis MBI 600, a promising microbial biocontrol agent. Results
of this study can help to improve the biocontrol approach of using B. subtilis strain MBI
600. Combined use of Bacillus subtilis strain BMI 600 with partially-resistant cultivar
can maximize the biocontrol effectiveness and provide a more reliable tool for
management of sheath blight in rice.

14
CHAPTER III
EFFECT OF FUNGICIDES ON CONIDIA GERMINATION OF Cercospora
janseana AND DISEASE SEVERITY ON RICE
INTRODUCTION
Narrow brown leaf spot (NBLS) is caused by Cercospora janseana (Biswas
2006). NBLS occurs in almost all rice-growing countries in Asia, Latin America, Africa,
USA, Australia, and Papua New Guinea (Misra et al. 1994). NBLS severity varies from
year to year and usually becomes more severe as the rice approaches to maturity
(Kurniawati et al. 2009). Although NBLS is considered a minor disease in most
countries (Dissanayake and Wickramasinghe 1999), certain rice cultivars have shown a
high susceptibility in the United States during 1930 and 1940 (Ou 1985). Recent
increases in the incidence of NBLS have been reported in the U. S. rice production belt
(Mani et al. 2012). Particularly, NBLS is one of the major diseases limiting the yield
potential of rice ratoon crop in Texas and Louisiana (Zhou 2014).
Upon infestation, C. janseana enters the host tissues through the stomata,
becoming established in the parenchyma immediately beneath the stomata and spreads
longitudinally in the epidermal cells (Ou 1985). The mycelium is mostly intracellular,
and the conidiophores are produced from sub-stomatal hyphal branches (Tullis 1937).
An incubation period of 20 days is necessary before the first few lesions appear,
regardless of the growth stage at which the plant was inoculated, and 30 days before the
maximum number of lesions is reached (Estrada and Ou 1978). Symptoms development
at the late growth stages in rice is due to the slow disease progress by C. janseana
(Estrada and Ou 1978).
Symptoms are characterized by many short, linear red-brown lesions on the leaf
blades, restricted between the veins (Biswas 2006). Lesions are 2-10 mm long and 0.5-1
mm wide, and later they coalesce to form long, threadlike brown lesions parallel to the
veins on the entire leaves (Biswas 2006). In resistant cultivars, lesions tend to be

15
narrower, shorter and dark brown, while in susceptible cultivars, lesions are wider and
lighter brown with gray necrotic centers (Biswas 2006). Lesions also occur on leaf
sheaths, pedicels and glumes (Ou 1985). In some cases, symptoms may include
premature death of leaves and leaf sheaths, premature ripening of kernels and lodging of
plants (Kurniawati et al. 2009). Market values of grains decrease because C. janseana
causes grain discoloration and chalkiness, and reduces the milling recovery (Kurniawati
et al. 2009).
Breeding for race-resistant cultivars has been attempted (Ryker and Jodon 1940).
However, rice cultivars with vertical resistance may become broken down quickly after
their release. The development of new physiologic races of C. janseana is plausible
since the fungus is known to be a highly variable pathogen (Sah and Rush 1988).
Another common approach to manage NBLS is to use synthetic fungicides. Singh (1988)
reported that NBLS could be managed with mancozeb in India. In the U. S.,
propiconazole is commonly used for NBLS. However, ineffective chemical control of
NBLS in the southern U. S. Rice Belt region has been experienced. The objectives of
this study were to determine the inhibitory effect of different active ingredients of
fungicides for control of C. janseana and NBLS under in vitro and field conditions.
MATERIALS AND METHODS
Isolate collections. Five isolates of C. janseana were from leaves collected from
rice fields in Texas. Isolate BMT-41 was collected from an organic rice field at the
Texas A&M AgriLife Research Center at Beaumont; CN-1-16, CN-2-4, and CN-1-4
were collected in a commercial rice field in China, Texas; and EL-110 was collected
from a rice research plot at the Texas A&M AgriLife Research Center at Eagle Lake. All
these isolates were collected in 2011. All isolates were maintained in sterile desiccated
filter paper at 4°C.
Fungicide sensitivity. Conidia from each of C. janseana isolates were streaked
on potato dextrose agar (PDA) medium amended with 1 µg mL-1
streptomycin, and
incubated under a growth chamber condition (25°C; 16 h of light and 8 h of darkness;
16
86.63 μmol m-2
s-1
light intensity). After 5 days of incubation, conidia of each isolate
were harvested with sterilized cotton swaps and distilled water. The conidial suspension
was collected into 15 mL plastic tubes and adjusted to 106 conidia mL
-1. Aliquots of 200
μl conidia suspension were spread on PDA plates amended with fungicides. Each of the
fungicide active ingredients, azoxystrobin, pyraclostrobin, trifloxystrobin,
propiconazole, triadimefon and myclobutanil (Bayer CropScience), thiophanate methyl
(Makhteshim Agan of North America, Inc.), mancozeb (Bonide Products Inc.),
fluxapyroxad and flutolanil (Nichino America, Inc.) were dissolved in 100% sterile
distilled water. Salicylhydroxamic acid (SHAM; Alfa Aesar) was dissolved in 100%
methanol. Active ingredients from each fungicide were added to autoclaved PDA cooled
to 55°C to make a final concentration of 0.1, 1, or 10 µg mL-1
. Additionally, 100 µg mL-
1 of SHAM were added to PDA plates amended with the quinone outside inhibitors
(QoI) active ingredients such as azoxystrobin, pyraclostrobin, and trifloxystrobin in
order to inhibit the alternative oxidase respiratory pathway (Olaya et al. 1998). Plates
amended with SHAM alone served as control plates for treatments with the active
ingredients belonging to the QoI, while PDA plates without amendment served as
control for the remaining active ingredients. Three plates per active ingredient
concentration were used for each isolate. Petri plates were arranged in a completely
randomized design.
After incubation at 20°C in darkness for 15 h, conidia germination rate (based on
30 randomly selected conidia) from each plate was determined under the optical
microscope with the 40 × magnification by scanning the plate surface. Percentages of
relative germination for each plate were calculated as (number of germinated conidia
from the fungicide-amended plate ÷ number of germinated conidia from the control
plate) × 100. All relative germination percentage data were divided by the constant 1000
and then arcsine transformed. The experiment was replicated three times. Arcsine
transformed data were subjected to analysis of variance by the statistical software SAS
9.3 (SAS Institute Inc., Cary, NC). Differences among treatment means were estimated
using Fisher’s protected least significance difference (LSD) at P = 0.05. Means were

17
back-transformed to percentage relative germination and multiplied by the constant
1000. EC50 values for each experiment were calculated by applying the value of 50% in
the dependent variable obtained from the regression equation of relative germination
percentage on log10 transformed fungicide concentration using Microsoft Excel 2013.
Field study. Two field experiments, one in 2012 and the other in 2014, were
established in rice fields naturally infested with NBLS at the Texas A&M AgriLife
Research Wintermann Rice Research Station, Eagle Lake. The rice cultivar used in both
studies was Presidio that was drill seeded at a rate of 89.6 kg ha-1
into a Crowley fine
sandy loam soil (59% sand, 2% silt, 12% clay, 0.7% organic matter, and pH 5.3). Each
plot consisted of six 4.88 m rows, spaced 19 cm between rows. Prior planting, plots
received 280 kg ha-1
of fertilizer (19-19-19, N-P-K), and then at panicle differentiation
320.56 kg ha-1
of fertilizer (21-0-0, N-P-K) was applied in both experiments.
In 2012, 1.26 kg a.i. ha-1
of Command 3ME (Clomazone; Helena Chemical
Company) and 1.61 kg a.i. ha-1
of Propanil 4SC (Propanil; Willowood USA) were
applied 11 days after planting. At 32 days after planting, 0.07 kg a.i. ha-1
of Permit
(Halosulfuron-methyl; Gowan Company) and 0.29 kg a.i. ha-1
of Facet 75DF
(Quinclorac; BASF Corporation) were applied. At 46 days after planting, 1.61 kg a.i. ha-
1 of Propanil 4SC and 0.07 kg a.i. ha
-1 of Permit were applied for weed control. At 47
days after planting, plots were fertilized with 195.03 kg ha-1
of urea (46-0-0) and then
0.028 kg a.i. ha-1
of the insecticide Mustang Max (S-Cyano (3-phenoxyphenyl)methyl
(+) cis/trans 3-(2,2-dichloroethenyl)- 2,2 dimethylcyclopropane carboxylate; FMC
Corporation) was applied for control of harmful insects.
In 2014, 0.028 kg a.i. ha-1
of RiceBeaux (Propanil and Thiobencarb; RiceCo
USA), 0.336 kg a.i. ha-1
of Command 3ME, and 0.056 kg a.i. ha
-1 of Permit were applied
15 days after planting for weed control. At 18 days after planting, 427.04 kg ha-1
of
fertilizer (21-0-0, N-P-K) was applied to plots. For insect control, 0.028 kg a.i. ha-1
of
Mustang Max was applied 53 days after planting.
In both experiments, treatments were arranged in a randomized complete block
design with eight replicates in 2012 and three replicates in 2014. Fungicides (Table 1)

18
were applied at 68 and 84 days after planting in 2012 and 2014, respectively. Plots were
sprayed with fungicides using a CO2 pressurized sprayer equipped with a boom of three
TeeJet 8002 nozzles spaced 40.64 cm apart that delivered 299.33 L ha-1
of final spray
volume. NBLS severity was visually rated at 51 and 33 days after treatment application
for the first and second experiment, respectively. Disease severity was based on the scale
of 0 to 9, where 0 represents no symptoms, 1 represents less than 1% of leaf area
affected, 3 represents 1-5% of leaf area affected, 5 represents 6-25% of leaf area
affected, 7 represents 26-50% of leaf area affected, 9 represents 51 -100% leaf area
affected (Chaudhary 1996).
Table 1. Description of fungicides used for the control of NBLS under field conditions.
Fungicide
name Rate in mL ha
-1
% Active
ingredient(s) Manufacturer
Quadris 658 22.9% Azoxystrobin Syngenta Crop Protection,
Inc., Greensboro, NC
Quilt 1,561 7% Azoxystrobin +
11.7% Propiconazole
Syngenta Crop Protection,
Inc., Greensboro, NC
QuiltXcel 1,162
13.5% Azoxystrobin
+ 11.7%
Propiconazole
Syngenta Crop Protection,
Inc., Greensboro, NC
Sercadis 483 26.55%
Fluxapyroxad
BASF Corporation,
Research Triangle Park,
NC
Stratego 1,330
11.4% Propiconazole
+ 11.4%
Trifloxystrobin
Bayer CropScience,
Research Triangle Park,
NC
Tilt 700 41.8% Propiconazole Syngenta Crop Protection,
Inc., Greensboro, NC
Rice was harvested with a plot combine at 124 and 132 days after planting in
2012 and 2014, respectively. Grain yield and moisture were determined and rice yields

19
were adjusted to 12% moisture content. Data was subjected to ANOVA using SAS 9.4
(SAS Institute Inc., Cary, NC). Differences among treatment means were estimated
using Fisher’s protected least significance difference (LSD) at P = 0.05.
RESULTS
Fungicide sensitivity. Highly significant differences were detected in the
relative germination percentage among experiments, isolates, active ingredients, and the
interaction of isolate by active ingredient (Table 2). Isolate CN-2-4 had the highest
germination (89%), while germination significantly decreased to 73, 72, and 71% with
isolates CN-1-16, EL-110, and BMT-41, respectively. However, isolate CN-1-4 had the
lowest germination (57%) (Fig. 5).
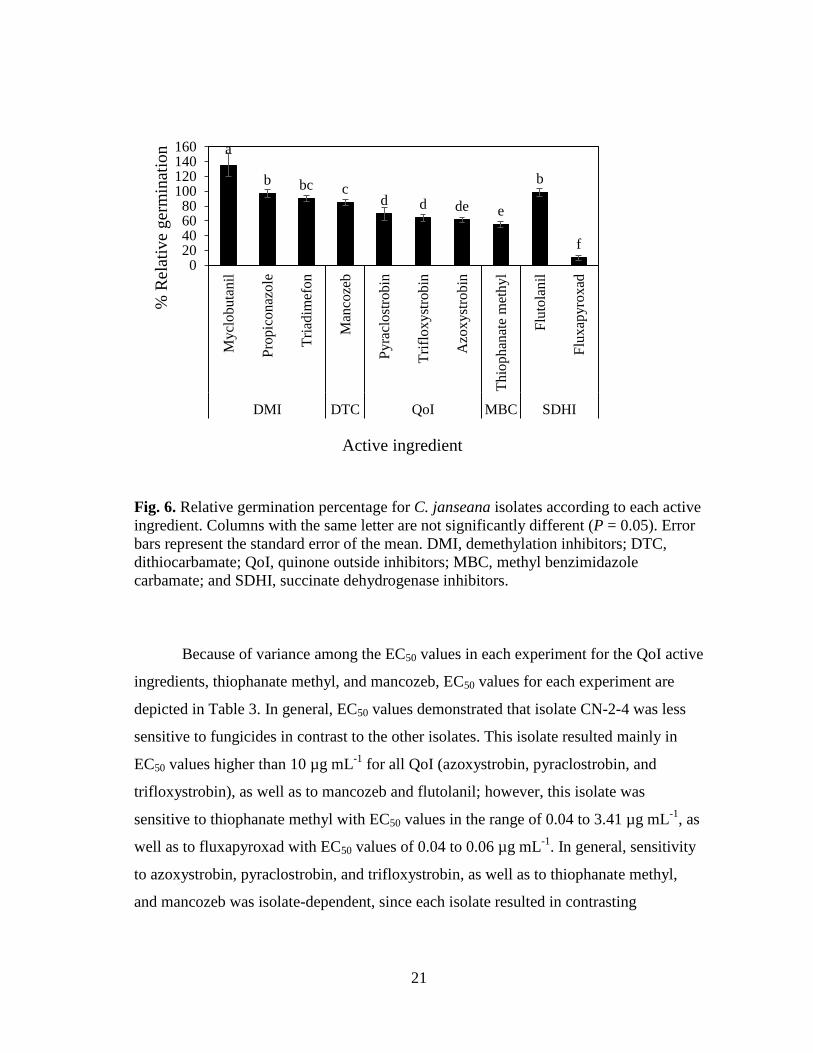
C. janseana isolates presented similar trends in the relative germination
percentages along the different active ingredients; therefore, the effect of isolate is
combined and depicted in Fig. 6. Any Demethylation inhibitor (DMI) active ingredient
(myclobutanil, propiconazole, or triadimefon) resulted in the highest germination
percentages in the range of 97 to 135%. Germination decreased to 85% with the
dithiocarbamate (DTC) mancozeb; however, this percentage did not significantly differ
from the germination obtained with triadimefon. Sensitivity to fungicides was more
notorious with the Quinone outside inhibitors (QoI) pyraclostrobin, trifloxystrobin and
azoxystrobin, since germinations significantly decreased to 69, 64, and 61%,
respectively. A further decrease in germination was obtained with the methyl
benzimidazole carbamate (MBC) thiophanate methyl that resulted in 55%. However, the
lowest germination resulted with the succinate dehydrogenase inhibitor (SDHI)
fluxapyroxad that was 10%. This low percentage germination contrasted significantly
with the SDHI flutolanil that resulted in 98% in germination.

20
Table 2. Analysis of variance for the effect of experiment, isolate, active ingredient, and
the interaction of isolate by active ingredient in the relative germination percentage of C.
janseana isolates.
Source Degrees of
Freedom
Mean
Square a
F Value a
Experiment 2 0.070 11.44**
Isolate (I) 4 0.172 28.12**
Active Ingredient (AI) 9 0.963 157.32**
I × AI 36 0.085 14.00**
** = Highly significant (p˂0.01). a = Values resulted from the analysis of variance of arcsine transformed
percentage relative germination.
Fig. 5. Relative germination percentage according to each C. janseana isolate. Columns
with the same letter are not significantly different (P = 0.05). Error bars represent the
standard error of the mean.
a
b b b c
0
20
40
60
80
100
CN-2-4 CN-1-16 EL-110 BMT-41 CN-1-4
% R
elat
ive
ger
min
atio
n
Isolate
21
Fig. 6. Relative germination percentage for C. janseana isolates according to each active
ingredient. Columns with the same letter are not significantly different (P = 0.05). Error
bars represent the standard error of the mean. DMI, demethylation inhibitors; DTC,
dithiocarbamate; QoI, quinone outside inhibitors; MBC, methyl benzimidazole
carbamate; and SDHI, succinate dehydrogenase inhibitors.
Because of variance among the EC50 values in each experiment for the QoI active
ingredients, thiophanate methyl, and mancozeb, EC50 values for each experiment are
depicted in Table 3. In general, EC50 values demonstrated that isolate CN-2-4 was less
sensitive to fungicides in contrast to the other isolates. This isolate resulted mainly in
EC50 values higher than 10 µg mL-1
for all QoI (azoxystrobin, pyraclostrobin, and
trifloxystrobin), as well as to mancozeb and flutolanil; however, this isolate was
sensitive to thiophanate methyl with EC50 values in the range of 0.04 to 3.41 µg mL-1
, as
well as to fluxapyroxad with EC50 values of 0.04 to 0.06 µg mL-1
. In general, sensitivity
to azoxystrobin, pyraclostrobin, and trifloxystrobin, as well as to thiophanate methyl,
and mancozeb was isolate-dependent, since each isolate resulted in contrasting
a
b bc c d d de e
b
f
020406080
100120140160
Mycl
ob
uta
nil
Pro
pic
on
azo
le
Tri
adim
efo
n
Man
coze
b
Py
racl
ost
robin
Tri
flo
xy
stro
bin
Azo
xyst
rob
in
Thio
ph
anat
e m
eth
yl
Flu
tola
nil
Flu
xap
yro
xad
DMI DTC QoI MBC SDHI
% R
elat
ive
ger
min
atio
n
Active ingredient
22
sensitivities along these active ingredients. However, mancozeb resulted in low efficacy
to inhibit fungal conidia, since all isolates but CN-1-16 mainly resulted in EC50 values
higher than 10 µg mL-1
. On the other hand, sensitivity to the SDHI fluxapyroxad and
flutolanil was active ingredient-dependent, since all isolates were sensitive to
fluxapyroxad with EC50 values lower than 0.22 µg mL-1
. While all isolates were less
sensitive to flutolanil, considering that EC50 values were higher than 10 µg mL-1
along
the different experiments (Table 3).
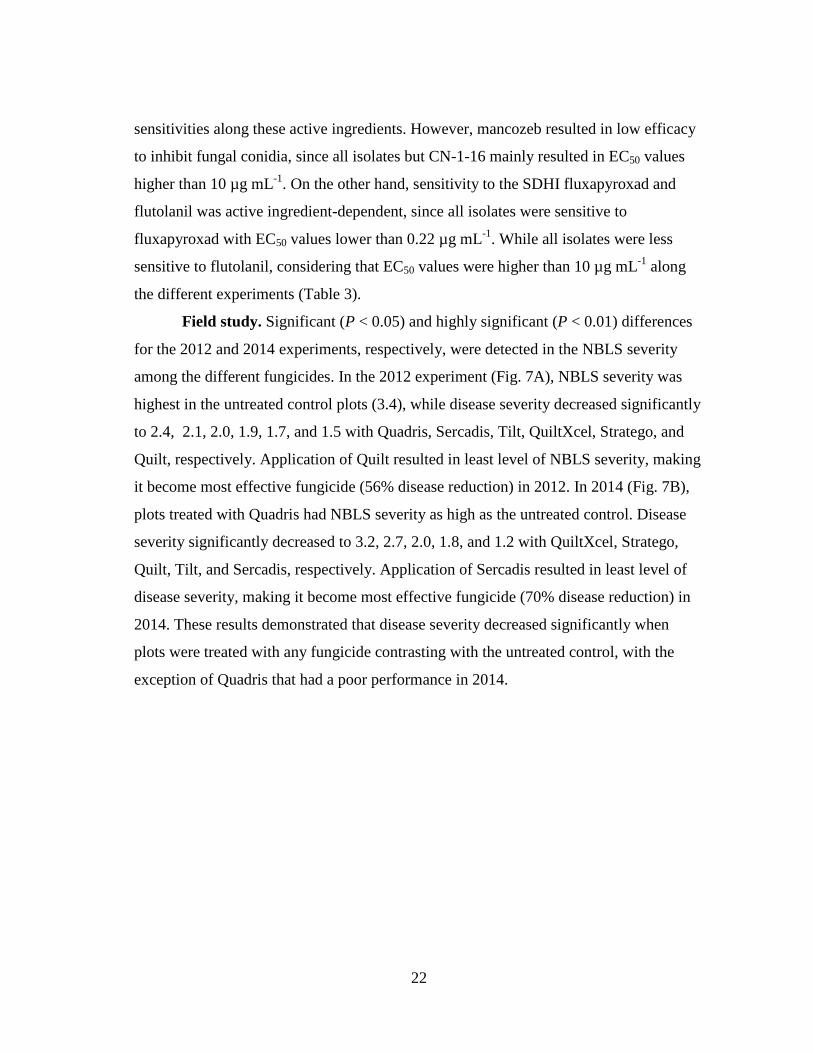
Field study. Significant (P < 0.05) and highly significant (P < 0.01) differences
for the 2012 and 2014 experiments, respectively, were detected in the NBLS severity
among the different fungicides. In the 2012 experiment (Fig. 7A), NBLS severity was
highest in the untreated control plots (3.4), while disease severity decreased significantly
to 2.4, 2.1, 2.0, 1.9, 1.7, and 1.5 with Quadris, Sercadis, Tilt, QuiltXcel, Stratego, and
Quilt, respectively. Application of Quilt resulted in least level of NBLS severity, making
it become most effective fungicide (56% disease reduction) in 2012. In 2014 (Fig. 7B),
plots treated with Quadris had NBLS severity as high as the untreated control. Disease
severity significantly decreased to 3.2, 2.7, 2.0, 1.8, and 1.2 with QuiltXcel, Stratego,
Quilt, Tilt, and Sercadis, respectively. Application of Sercadis resulted in least level of
disease severity, making it become most effective fungicide (70% disease reduction) in
2014. These results demonstrated that disease severity decreased significantly when
plots were treated with any fungicide contrasting with the untreated control, with the
exception of Quadris that had a poor performance in 2014.

23
Table 3. EC50 values (µg mL-1
) of five C. janseana isolates for different fungicide active ingredients.
Group
name
Active
ingredienta
BMT-41 CN-1-16 CN-1-4 CN-2-4 EL-110
Experiment Experiment Experiment Experiment Experiment
1 2 3 1 2 3 1 2 3 1 2 3 1 2 3
QoIb
Azoxystrobin 9.48 5.33 6.05 0.08 5.33 0.03 ˃10 9.97 0.07 ˃10 4.47 ˃10 0.53 >10 4.35
Pyraclostrobin 0.36 0.36 0.83 3.99 3.89 >10 0.10 0.54 0.01 ˃10 >10 ˃10 0.16 0.33 0.34
Trifloxystrobin 5.56 0.36 >10 >10 >10 >10 0.13 5.16 0.06 ˃10 0.09 ˃10 5.79 >10 8.87
MBC Thiophanate
methyl
1.34 5.37 5.98 ˃10 >10 >10 0.06 3.18 0.03 0.44 3.41 0.04 ˃10 >10 >10
DTC Mancozeb >10 >10 ˃10 0.40 >10 0.48 >10 >10 0.05 0.36 >10 >10 2.23 >10 >10
SDHI
Fluxapyroxad 0.03 0.04 0.04 0.03 0.21 0.04 0.03 0.04 0.03 0.06 0.04 0.04 0.03 0.04 0.04
Flutolanil ˃10 >10 >10 ˃10 >10 >10 ˃10 >10 >10 ˃10 >10 >10 >10 >10 >10
a Active ingredients belonging to the Demethylation inhibitor (DMI) group are not depicted since they had little or no
suppression in conidia germination.
b Abbreviations: QoI = quinone outside inhibitors; MBC = methyl benzimidazole carbamate; DTC = dithiocarbamate; SDHI =
succinate dehydrogenase inhibitors

24
Significant (P < 0.05) differences were detected in rice yield among the different
fungicides in both 2012 and 2014. In 2012 (Fig. 8A), application of Sercadis resulted in
11,082 kg ha-1
of yield that did not significantly differ from the yield of QuiltXcel, Quilt,
Tilt, and Stratego that resulted in 10,960; 10,778; 10,766, and 10,765 kg ha-1
,
respectively. However, Quadris resulted in 10,614 kg ha-1
that was significantly lower
than the yield of Sercadis. Nevertheless, untreated control resulted in 10,175 kg ha-1
that
was lowest in yield. In 2014 (Fig. 8B), applications of Stratego, Quilt, Quadris,
QuiltXcel, Sercadis, and Tilt resulted in 8,049; 7,965; 7,807; 7,787; 7,753, and 7,694 kg
ha-1
of rice yield, respectively, which did not differ significantly among each other.
These results demonstrated that plants treated with any fungicide resulted in significantly
increased yields compared to the untreated control.
DISCUSSION
The results of conidia germination assays demonstrate a wide range of sensitivity
of C. janseana from very sensitive to highly resistant levels against major fungicides
used for rice disease management. The wide variability of fungicide sensitivity prospects
the existence of diverse field populations of C. janseana in the Texas rice production
areas. This explains why inconsistent or ineffective control of NBLS was observed in the
field over years.

25
Fig. 7. Narrow brown leaf spot (NBLS) severity in rice fields. A, 2012, B, 2014. Columns with the same letter are not
significantly different (P = 0.05). Quadris, 22.9% azoxystrobin; Sercadis, 26.6% fluxapyroxad; Tilt, 41.8% propiconazole;
QuiltXcel, 13.5% azoxystrobin + 11.7% propiconazole; Stratego, 11.4% propiconazole + 11.4% trifloxystrobin; and Quilt,
11.7% propiconazole + 7% azoxystrobin.
a
b bc
bc
bcd
cd d
0
1
2
3
4
NB
LS
sev
erit
y (
0-9
)
Fungicide
A a a
bc
cd
de ef
f
0
1
2
3
4
5
NB
LS
sev
erit
y (
0-9
)
Fungicide
B

26
Fig. 8. Rice yield (kg ha-1
) according to each fungicide for the field study on 2012 (A), and 2014 (B). Columns with the same
letter are not significantly different (P = 0.05). Quadris, 22.9% azoxystrobin; Sercadis, 26.6% fluxapyroxad; Tilt, 41.8%
propiconazole; QuiltXcel, 13.5% azoxystrobin + 11.7% propiconazole; Stratego, 11.4% propiconazole + 11.4% trifloxystrobin;
and Quilt, 11.7% propiconazole + 7% azoxystrobin.
a
ab
ab ab ab
b
c
10000
10250
10500
10750
11000
11250
Yie
ld (
kg
/ha)
Fungicide
A a a
a a a a
b
6500
6800
7100
7400
7700
8000
8300
Yie
ld (
kg
/ha)
Fungicide
B

27
The pattern of fungicide sensitivities was very different among fungicide groups.
DMI active ingredients did not inhibit or even stimulated the germination of C.
janseana. Similar results have also been reported before. Myclobutanil did not suppress
spore germination of the fungal pathogen Cylindrocladium buxicola (Henricot et al.
2008). Similarly, myclobutanil and propiconazole did not affect in vitro urediniospore
germination of Puccinia hemerocallidis (Buck and Williams-Woodward 2003). The lack
of effect on germination is attributed to the mode of action of DMIs, which inhibits
synthesis of ergosterol (Gachomo 2005). Fungal spores are less sensitive to DMI active
ingredients because spores already contain enough ergosterol to germinate and produce
germ tubes and infection structures. This study focused on the assessment of C. janseana
conidia mortality and germination inhibition due to the incapability of mycelial growth
on artificial fungal growth media. However, it is likely once the fungus has depleted its
existing ergosterol after germination, continuing mycelial growth is inhibited because of
the inhibition of ergosterol synthesis by DMIs (Gachomo 2005). The results of our field
evaluation confirmed the effectiveness of propiconazole in reducing NBLS severity on
rice, although propiconazole is unable to affect the germination of C. janseana.
Use of the SDHI fluxapyroxad resulted in the highest inhibition of C. janseana
conidia germination among all the fungicides tested in this study. However, the other
SDHI active ingredient, flutolanil, showed no effect on conidia germination. It is a
noteworthy observation that there is no cross-resistance of C. janseana in SDHI and the
conflict sensitivities between these two SDHI active ingredients are consistent on all five
isolates evaluated in this study. Resistance to SDHI has been known in the field
populations of several fungi, and can lead to a significant loss of fungicide efficacy to
control moderately and highly resistant fungal populations (Gudmestad et al. 2013; Ito et
al. 2004). Ito et al. (2004) described that resistance to flutolanil is attributed to the result
of a single point mutation in the sdhC gene, they also stated that this sdhC mutation
conferred cross-resistance against carboxin that belongs to the SDHI. It has been known
that cross-resistance patterns among SDHI fungicides is complex because many
mutations in certain fungal pathogens confer full cross resistance while others do not

28
(Sierotzki and Scalliet 2013). According to our results, C. janseana isolates did not
present cross-resistance to flutolanil and fluxapyroxad. The loss of efficacy of flutolanil
to control C. janseana may be explained by high selection pressure to develop resistant
populations with the continuous use of flutolanil. Flutolanil has been marketed for rice in
the United States since 2000, much earlier than fluxapyroxad that is commercially
available after 2012. Fluxapyroxad is likely to be highly effective for management of
NBSL as demonstrated in our field evaluations. Considering fast development of
resistance to SDHIs, continuous monitoring of fungicide sensitivity in C. janseana field
populations is needed.
QoI fungicides have been recommended to control fungal spores more
effectively than mycelium because spores are more sensitive to these fungicides (Balba
2007). Karadimos et al. (2005) reported complete inhibition of Cercospora beticola
spore germination with QoI active ingredients: pyraclostrobin and trifloxystrobin at 0.01
and 0.1 µg mL-1
, respectively. However, pyraclostrobin, trifloxystrobin, and
azoxystrobin tested in this study did not effectively inhibit conidia germination,
providing less than 50% of conidia inhibition. Sensitivities of C. janseana to QoI active
ingredients show a wide range from sensitive (EC50 < 1) to intermediate and to resistant
(EC50 > 10) among isolates. Also there is a wide range of sensitivity values of any given
C. janseana isolate among different QoI active ingredients, which indicates no cross
resistance. The main mechanism conferring high resistance to QoI fungicides is reduced
sensitivity to the active ingredients that target an outer, quinone oxidizing site of the
cytochrome bc1 enzyme complex (complex III) (Fernández‐Ortuño et al. 2008). Fungi
demonstrated variability in sensitivity to different QoI active ingredients. Sensitivities of
Uncinula necator to azoxystrobin, pyraclostrobin, and trifloxystrobin did not correlate as
strongly or uniformly as expected (Wong and Wilcox 2002). Fairchild et al. (2013)
reported that 39 isolates of Alternaria solani that were resistant to azoxystrobin, were
not resistant to pyraclostrobin or famoxadone, demonstrating no cross resistance among
these QoI active ingredients. These results demonstrate that although QoI fungicides are
generally known to be effective to control fungal spores, conidia of certain C. janseana

29
isolates may not be suppressed by these fungicides, and resistance to one QoI active
ingredient in C. janseana does not necessarily result in cross resistance to other QoI
active ingredients. In the field evaluation, a sole application of QoI did not provide
reduction of NBLS as effective as DMI or tank mixture of DMI and QoI. Our in vitro
fungicide sensitivity assay and field evaluation indicate moderate effectiveness of QoIs
for managing NBLS.
Mancozeb is a broad-spectrum fungicide with multi-site modes of action.
Mancozeb has provided excellent suppression of spore germination of various fungal
genera since it was introduced in 1962 (Gullino et al. 2010). However, fungicide
resistance to mancozeb was also reported. The EC50 value of the fungal pathogen
Pestalotiopsis theae reached to 3,940 µg mL-1
(Yang and Zhang 2012). Except isolate
CN-1-16, mancozeb did not inhibit conidia germination of the C. janseana isolates
tested in our in vitro assay, indicating that mancozeb may present low efficacy to control
NBLS.
Previous reports of fungicide evaluations in different fungal pathogens have
demonstrated that wild-type or sensitive fungal isolates can be effectively managed by
MBC. Conidial germination and growth of Phoma exigua was totally inhibited on media
containing 50 µg mL-1
of the MBC thiophanate methyl (Schmitz et al. 2007). Spore
germination of the arbuscular mycorrhizal fungus Glomus mosseae was inhibited in the
presence of 10 µg mL-1
of the MBC benomyl (Chiocchio et al. 2010). However,
resistance to MBC is associated with a single gene mutation at beta tubulin, which
confers a persistent and complete resistance to this fungicide (Koenraadt et al. 1992).
Isolates CN-1-16, and EL-110 showing EC50 values higher than 10 µg mL-1
of MBC
thiophanate methyl indicate development of resistance to this active ingredient, while
isolate BMT-41, CN-1-4, and CN-2-4 are sensitive. According to our results, it is likely
that some C. janseana isolates (CN1-16, and EL-110) must have been exposed and
selected by previous uses of MBC. Therefore, MBC may no longer work for these
isolates.

30
Under field conditions, fluxapyroxad (Sercadis) and fungicide containing
propiconazole alone (Tilt) or combination of propiconazole with azoxystrobin (Quilt and
QuiltXcel,) or trifloxystrobin (Stratego) resulted in best performance on reducing NBLS
severity. In contrast, azoxystrobin (Quadris) showed the least effectiveness in NBLS
management. This field evaluation is consistent with fungicide sensitivity data,
particularly those of EL-110 isolate collected from the site where the field trials were
conducted. EL-110 shows consistent inhibition of conidia germination by fluxapyroxad
but not azoxystrobin. Regarding rice yield, all fungicide treatments significantly
increased yield over the untreated control. Although azoxystrobin by itself did not
control NBLS as effective as other fungicide treatments, this active ingredient still
increased yield over the untreated control. Similar results were obtained by McCartney
et al. (2007), where despite the active ingredient azoxystrobin failed to control septoria
tritici blotch caused by Mycosphaerella graminicola, this active ingredient increased
wheat yield compared with the untreated control. QoI fungicides may have controlled
others than primary-target diseases and promote plant heath that contribute to yield
increase.
Because of difficulty in growing C. janseana on artificial media, the present
assessment of conidia germination inhibition shed light on fungicide sensitivities of C.
janseana to major fungicide active ingredients. With field evaluations, the in vitro
fungicide sensitivity data will provide comprehensive information to develop fungicide
program for NBLS. C. janseana isolates show variable sensitivities to different fungicide
groups and often present reduced sensitivities that are likely to cause ineffectiveness of
fungicides in NBLS management. In the case of SDHI, all isolates tested had high
sensitivities to fluxapyroxad that is recently released in the market but low sensitivities
to flutolanil. Because the lack of historical information about the fungicide use in the
fields where the isolates assessed in this study were collected, we cannot know how
development of resistance by C. janseana to the fungicide active ingredients occurs.
Understanding of the sensitivity C. janseana field populations to fungicide can enhance

31
the development of more effective fungicide management program for NBLS and avoid
or delay the development of potential resistance to current effective fungicides.

32
CHAPTER IV
LIMITED EFFECTS OF MICROALGAL BIOFERTLIZERS FOR RICE
PRODUCTION IN TEXAS
INTRODUCTION
Nitrogen (N) is one of the most important limiting factors in rice production
(Vaishampayan et al. 2001) since this crop is mainly grown under irrigated conditions
where nitrogen fertilizer efficiency is low due to large N losses from flooded soils (De
Datta and Buresh 1989). Ammonia (NH3) volatilization and nitrification-denitrification
are the main processes for N losses in flooded rice fields (Irisarri et al. 2007).
Additionally, it has been shown that nitrogen fertilizers are the major cause for an
increase in methane (CH4) emissions from rice fields (Banger et al. 2012).
Numerous studies have supported the importance of using nitrogen fixing
cyanobacteria as biofertilizers in tropical (Shukla and Gupta 1967; Tirol et al. 1982;
Mandal et al. 1999; Jha et al. 2013) and temperate rice-growing regions (Henriksson
1971; Reynaud and Metting 1988). The most abundant algal flora in rice fields is
composed of Aulosira fertilissima, Anabaena sp., Nostoc sp., and Scytonema sp.;
moreover, the cyanobacterial strains frequently used for biofertilizer applications include
A. fertilissima, Anabaena sp., Nostoc sp., among others (Sinha and Häder 1996).
Many techniques have been developed over time to measure the amount of
nitrogen fixed by cyanobacteria including the N dilution method, differentiation in
natural 15N abundance (δ15N) method and the most frequently used Acetylene-reducing
activity (ARA) measurement method (Roger and Ladha 1992). The percentage of
cyanobacteria-derived available nitrogen for rice plants has been documented in the
range of 28-40% (Tirol et al. 1982; Mian and Stewart 1985). Heterocystous
cyanobacteria contribute on average 20-30 kg N ha-1
(Vaishampayan et al. 2001).
Besides N2-fixation, cyanobacteria can also possess additional advantages, such
as phosphate assimilation, and release upon cyanobacterial decomposition (Mandal et al.

33
1999). An increased level of organic carbon in the soil was reported as an effect of
cyanobacterial inoculation (Akhter et al. 2002). Additionally, excretion of extracellular
compounds like polysaccharides (Bertocchi et al. 1990) and peptides (Welker and
Döhren 2006) results in a rapid regeneration and improvement of soil structure (Mandal
et al. 1999), and increased formation of soil organic matter (Das et al. 1991; Mandal et
al. 1999).
Growth-promoting effects attributed to cyanobacteria inoculation have been
recorded on different crops such as rice (Shukla and Gupta 1967), wheat (Karthikeyan et
al. 2007) and tomato (Prasanna et al. 2013). The growth of cyanobacteria in the
floodwater causes a decrease in readily available iron, therefore minimizing Fe toxicity
in young rice plants in acid soils rich in organic matter, while decomposing algal
biomass causes increases in readily available forms of iron and manganese in soils,
providing these elements to rice at advanced growth stages where there is an increased
demand for these nutrients (Das et al. 1991). Additionally, microalgae have been used
for remediation of domestic wastewater and biomass production for biofuels (Rawat et
al. 2011).
The use of economically and environmentally-friendly microalgae-based
biofertilizers in paddy rice fields presents a promising alternative to synthetic fertilizers.
Additional advantages such as incorporation of organic matter, improvement of soil
structure, minimization of Fe toxicity, and growth promoting effects make
cyanobacterial biofertilization an ideal input for sustainable agriculture. The objective of
this study was to evaluate the benefits of microalgae biofertilizers to rice plant growth
and yield.
MATERIALS AND METHODS
Microalgae biofertilizers. N2-fixing cyanobacterial cultures of Anabaena sp.
UTEX 2576 and Nostoc muscorum UTEX 2209s were provided by UTEX The Culture
Collection of Algae at the University of Texas at Austin. Previous to treatment
application, axenic cultures of Anabaena sp. UTEX 2576, N. muscorum UTEX 2209s,

34
and an indigenous strain of N. punctiforme bioprospected from the Texas A&M AgriLife
Research and Extension Center at Beaumont were scaled up from 0.25 to 1-L glass
bottles containing liquid BG-11 minus NaNO3 (BG-11-0) medium (Stanier et al. 1971)
maintained at 25°C, with a maximum light intensity of 300 μE m−2
s−1
from fluorescent
lamps with an automated light/dark cycle of 12 h/12h, and constant aeration of normal
air infused with + 1.5% CO2 through 6.35mm diameter glass bubbler tube. Each
cyanobacterial culture was then transferred up to 15-L reactor containing liquid BG-11-0
medium and cultivated under greenhouse conditions (25°C +/- 5 degrees, ambient light,
and constant aeration + 1.5% CO2 through a 6.35mm diameter air line with a 100
micron air stone). The microalgal biomass concentrate for all the treatment applications
consisted of a polyculture of Chlorella sp. and Scenedesmus sp. (approx. dry weight =
38 g/L, total N = 442 ppm, P = 670 ppm, K = 500 ppm) that was previously cultivated in
a vertical tubular photobioreactor on an artificial wastewater medium (MB3N, based on
a protocol from UTEX The Culture Collection of Algae at the University of Texas,
which was modified from the protocol of Provasoli and Pintner 1959), centrifuged, and
subsequently stored in a -80°C freezer.
During the summer of 2013, indigenous cyanobacterial isolates were collected
from paddy rice fields from experimental plots at the Texas A&M AgriLife Research
and Extension Center at Beaumont. Rice paddy water was collected into 50 mL conical
vials. Vials were centrifuged at approximately 3000 RPM for 5 minutes, decanting the
supernatant after centrifugation. Under sterile conditions, pellets were collected and
streak inoculated on Petri plates with agar BG-11-0 medium. Plates were incubated at
29°C with a maximum light intensity of 300 μE m−2
s−1
from fluorescent lamps with an
automated light/dark cycle of 12h/12h. Every 24 hours for 2 weeks, green or blue green
colonies were observed via light microscopy with the 40 × magnification by inspecting
cyanobacterial cells on glass slides. Colonies identified as N2-fixing cyanobacteria
(Bellinger and Sigee 2010) were transferred to new plates containing agar BG-11-0
medium. This process was repeated until axenic cultures were obtained. The axenic
indigenous N2-fixing cyanobacterial isolate (TX-101) was selected for further work.

35
Isolation and purification of TX-101 was based on a protocol from the UTEX The
Culture Collection of Algae at the University of Texas at Austin, which was modified
from a previously developed protocol (Hagen and Meeks 1999). Internal transcribed
spacer region of this isolate was sequenced following a previously described protocol
(Boyer et al. 2001). According to BLAST search isolate TX-101 was identified as
Nostoc punctiforme (91% identity with GenBank Accession # NC_010628.1). This
isolate was transferred to BG-11-0 agar slants for long term storage at ambient room
temperature with a maximum light intensity of 300 μE m−2
s−1
from fluorescent lamps
with an automated light/dark cycle of 12h/12h.
Greenhouse studies. Two experiments (Exp 1 and 2) were conducted in the
greenhouse of the Department of Plant Pathology and Microbiology at Texas A&M
University, College Station, and one experiment (Exp 3) was conducted in a greenhouse
at the University of Texas at Austin. Seeds of the rice cultivar Cocodrie were surface
sterilized for 5 minutes in 3% sodium hypochlorite solution, and then washed three times
with distilled water, kept in Petri plates filled with distilled water inside an incubator at
28°C. After 3 days, 10, 6, and 3 germinated seeds in the Exp 1, Exp 2, and Exp 3
respectively, were seeded in a 2.5-L-pot containing a soil mix of League soil (pH 5.5,
3.2% sand, 32.4% silt, 64.4% clay, and 3.8 - 4.8% organic matter) and potting mix
(Sunshine Professional Growing Mix, Sun Gro Horticulture) in a ratio of 1:1 (v/v). Six
seeded pots were placed into a polycarbonate tote measuring 58.7 cm length × 42.9 cm
width × 31.8 cm height for the Exp 1 and 2. In Exp 3, the polycarbonate tote measured
60 cm length × 30 cm width × 15 cm height. Each polycarbonate tote served as the
experimental unit. Three days before treatment application, plants were thinned to 6 and
3 plants per pot for Exp 1 and Exp 2, respectively. In Exp 1 and 2, plants were
maintained in the greenhouse under natural light conditions with temperatures ranging
from 25 to 35°C. In Exp 3, the temperature in the greenhouse was set to a relatively
constant 25°C+/- 5°C with natural light conditions. Treatments were arranged in a
randomized block design, with 5 treatments and two replications.

36
In Exp 1, 21-day-old rice plants in each experimental unit were treated with 2 L
of cyanobacterial liquid culture of Anabaena sp. UTEX 2576 (Dry weight (DW) = 0.62
g/L) or N. muscorum UTEX 2209s (DW = 0.52 g/L); 200 mL of microalgal biomass
concentrate; 3g of urea (from 190 kg ha-1
); or 7.6 L filtered water that served as the
untreated control. Water volume of each experimental unit was maintained at 7.6 L with
water weekly refilled. Rice plant heights (the tallest leaf per plant) were measured at 28,
35, 42, 49, 56, 63, 70, and 77 days after planting.
In Exp 2, microalgal biofertilizer treatments were applied at 7 and 28 days after
planting. At each application, each experimental unit was treated with 2 L of
cyanobacterial liquid culture of Anabaena sp. UTEX 2576 or N. muscorum UTEX
2209s; 400 mL of microalgal biomass concentrate; or 7.6 L filtered water that served as
the untreated control. In the case of urea treatment, 3 g (from 190 kg ha-1
) urea was
applied only at the first application. Dry weight of UTEX 2576 was 0.14 g/L and 0.1 g/L
for the first and second treatment application, respectively, while dry weight for UTEX
2209s was 0.08 and 0.015 g/L for the first and second treatment application,
respectively. Water volume of each experimental unit was maintained at 7.6 L with
water weekly refilled. Rice plant height was measured at 14, 21, 28, 35, 42, 49, 56, and
63 days after planting.
In Exp 3, 7-day-old rice seedlings in each experimental unit were treated with 15
L of Anabaena sp. UTEX 2576 (DW = 0.11 g/L); 15 L of N. muscorum UTEX 2209s
(DW = 0.12 g/L); 400 mL of microalgal biomass concentrate dissolved in 15 L tap
water; 9 g urea (from 190 kg ha-1
) dissolved in 15 L tap water; or 15 L of tap water that
served as the untreated control. Water volume of each experimental unit was maintained
at 7.6 L with water weekly refilled. Rice plant height was measured at 14, 21, 28, 35, 42,
49, 56, 70, and 77 days after planting.
Field evaluation. Field trials were conducted in a rice field at Texas A&M
AgriLife Research and Extension Center at Beaumont in 2013 and 2014. Rice seeds
were pretreated with Dermacor X-100 (Chlorantraniliprole; DuPont) at a rate of 72.85 g
a.i. ha-1
and drill-planted at a rate of 89.67 kg ha-1
into League soil (pH 5.5, 3.2% sand,
37
32.4% silt, 64.4% clay, and 3.8 - 4.8% organic matter). Each plot was bordered with
metal barriers, forming a rectangle of 5.49 m long per 1.24 m width with 7 internal rows,
each one spaced 17.78 cm. In each study, one day after planting, 82.33 kg ha-1
of urea
was applied to all plots, then plots were temporary flooded for 48 h, then drained. Rice
emergence was 14 days after planting. Plots were flushed as needed from emergence to
permanent flood
In 2013, rice cultivar Presidio was planted on March 28. Twenty days after
planting, 5.23 kg a.i. ha-1
of RiceBeaux (Propanil and Thiobencarb; RiceCo USA); 52.54
g a.i. ha-1
of Permit (Halosulfuron-methyl; Gowan Company); and 0.42 kg a.i. ha-1
of
Command 3ME (Clomazone; Helena Chemical Company) were applied for early season
weed control. In 2014, rice cultivar Antonio was planted on April 2. At 27 days after
planting, 3.48 kg a.i. ha-1
of RiceBeaux; 52.54 g a.i. ha-1
of Permit; and 0.34 kg a.i. ha-1
of Command 3ME were applied for early season weed control. In both years, herbicide
applications were done with a 2-person hand-held spray boom (13- 80015 nozzles, 50
mesh screens, 149.66 L ha-1
final spray volume). Treatments were arranged in a
randomized complete block, with 4 treatments and 4 replications for each study.
Treatments included live N2-fixing cyanobacteria stock, microalgal biomass
concentrate, urea, and untreated control. In 2013, treatments were applied at 36 days
after planting. The cyanobacterial stock was a mixture of Anabaena sp. UTEX 2576
(DW = 0.14 g/L) and N. muscorum UTEX 2209s (DW = 0.27 g/L) in a rate of 1:1 (v/v)
applied at 22,026 L ha-1
. The microalgal biomass concentrate was applied at 5,580 L ha-
1. The urea treatment representing a conventional fertilizer was applied at 331.38 kg ha
-1.
Rice was harvested on August 5 (130 days after planting). Yield from each plot was
converted to kg ha-1
at 12% moisture. The average daily minimum and maximum
temperature during the rice growing season was 19.0 and 29.5°C, respectively, with an
average daily precipitation of 3.24 mm.
In 2014, treatments consisted of live N2-fixing cyanobacteria, microalgal biomass
concentrate, urea and untreated control that were applied twice. The first application at
52 and the second at 81 days after planting. The live N2-fixing cyanobacterial inoculum

38
used was an indigenous isolate (TX-101) of N. punctiforme applied at a rate of 22,026 L
ha -1
for each application. Dry weight of TX-101 for the first and second application was
0.13 and 0.11 g/L, respectively. The microalgal biomass concentrate was applied at a
rate of 5,580 L ha-1
for each application. In the case of urea treatment, 207.11 kg ha-1
and
124.26 kg ha-1
of urea were applied for the first and second application, respectively.
Rice was harvested on August 7 (127 days after planting). Yields were measured as
aforementioned. The average daily minimum and maximum temperature during the rice
growing season was 19.7 and 29.7°C, respectively, with an average daily precipitation of
3.3 mm.
Statistical analysis. Rice plant height data from the greenhouse experiments and
yield data from the field experiments were analyzed by SAS 9.3 (SAS Institute Inc.,
Cary, NC) to test treatment effects. Differences among treatment means were estimated
using Fisher’s protected least significance difference (LSD) at P = 0.05.
RESULTS
Greenhouse studies. Highly significant differences for the Exp 1, 2, and 3 (P <
0.01) were detected in plant height among the different fertilizers and different days after
planting. In Exp 1 (Fig. 9A), all fertilizers resulted in a progressive increase in plant
height until 56 days after planting. During this period, plants treated with the microalgal
biomass concentrate or Anabaena sp. UTEX 2576 resulted in the two highest plant
growth, followed by the treatment with N. muscorum UTEX 2209s or urea. While the
untreated control resulted in the lowest growth. After 56 days from planting, plants
treated with urea continued growing, while plants treated with the microalgal treatments
(Anabaena sp. UTEX 2576; microalgal biomass concentrate; and N. muscorum UTEX
2209s) and untreated control almost ceased vertical growth. At the end of the
experiment, height of plants treated with urea surpassed the plant height of the
microalgal fertilizer treatments.
In Exp 2 (Fig. 9B), all fertilizers resulted in a progressive increase in plant
height until 35 days after planting. During this period, plants treated with microalgal

39
biomass concentrate resulted in the tallest height, while Anabaena sp. UTEX 2576
resulted in the shortest plant height, the rest of treatments (untreated control; N.
muscorum UTEX 2209s; and urea) resulted in intermediate plant height. After 35 days
after planting, plants treated with microalgal biomass concentrate or urea continued
growing, while plants treated with N. muscorum UTEX 2209s; or Anabaena sp. UTEX
2576 almost ceased vertical growth. The microalgal biomass concentrate treatment
resulted in the tallest plant height followed by the urea treatment. Height of plants
treated with N. muscorum UTEX 2209s was not different from the untreated control,
while Anabaena sp. UTEX 2576 resulted in a lower height than the untreated control.
In Exp 3 (Fig. 9C), all fertilizers resulted in a progressive increase in plant height
until 70 days after planting. During this period plants treated with the microalgal
biomass concentrate resulted in the tallest height. However, height decreased
significantly when plants were treated with urea, Anabaena sp. UTEX 2576, or untreated
control that resulted in similar heights. Plants treated with N. muscorum UTEX 2209s
mainly resulted in the shortest height.
Field evaluation. Highly significant differences (P < 0.01) for both field trials
were detected in rice yield among the different fertilizers. In the two-year field trials,
microalgal biofertilizer treatments did not increase yields compared to the untreated
control (Fig. 10A and B). The urea treatment produced 4.0 and 2.6 times higher yields
than the untreated control in 2013 and 2014, respectively.

40
Fig. 9. Over time effect of different fertilization treatments on rice plant height (cm) for
Exp 1 (A), Exp 2 (B), and Exp 3 (C) under greenhouse conditions. N2-fixing
cyanobacterial strains applied were Anabaena sp. UTEX 2576; N. muscorum UTEX
2209s; while microalgal biomass was a concentrate of Chlorella sp. and Scenedesmus
sp. Symbols with the same letter are not significantly different (P = 0.05).
AB
a
B b B c
A
a
A
a
A a A b
B
bc D c
D d C e
AB
ab BC
c B d
c
CD
b
C
bc
A
a
30
35
40
45
50
55
60
65
21 28 35 42 49 56 63 70 77
Hei
ght
(cm
)
Days after planting
A
Anabaena sp.
Microalgal
biomass
Control
N. muscorum
Urea
Treatment
application
NS
C
c C c D d
A
a A
a
A a
a
AB
ab B bc C c
b
BC
b BC CD bc
b
B b
10
20
30
40
50
60
70
7 14 21 28 35 42 49 56 63
Hei
gh
t (c
m)
Days after planting
B
Anabaena sp.
Microalgal
biomass
Control
N. muscorum
Urea
Treatment
application

41
Figure 9 Continued.
NS
ns B
c
CD
ab
BC
b B
A bc D c
C c C
AB
ab
BC b
B
a
AB
a AB A
A a A
0
10
20
30
40
50
60
70
80
90
7 14 21 28 35 42 49 56 63 70 77
Hei
ght
(cm
)
Days after planting
C Anabaena sp.
N. muscorum
Control
Urea
Microalgal
biomass
Treatment
application

42
Fig. 10. Effect of different fertilizers on rice yield for the field study during 2013 (A)
and 2014 (B). Cyanobacterial inoculum was a polyculture of Anabaena sp. UTEX 2576
and Nostoc muscorum UTEX 2209s; microalgal biomass was a concentrate of Chlorella
sp. and Scenedesmus sp. Columns with the same letter are not significantly different (P =
0.05).
DISCUSSION
Although in the greenhouse, microalgae-based biofertilizers demonstrated
improved results, the potential of these biofertilizers is limited under field conditions due
the variable dynamics that have to encounter biological agents in the field that modify
a
b
b
b
0
1000
2000
3000
4000
5000
6000
Urea Cyanobacterial
inoculum
Microalgal
biomass
Control
Yie
ld
(kg h
a-1)
Fertilizer
A
a
b
b
b
0
1500
3000
4500
6000
7500
9000
Urea Microalgal
biomass
N.
punctiforme
Control
Yie
ld (
kg
ha-1
)
Fertilizer
B

43
the outcome. This explains why microalgae-based biofertilizer studies are not widely
conducted in the United States. However, additional considerations are discussed in
order to improve the potential of microalgal biofertilizers.
In the Exp 1 in the greenhouse, the microalgal biomass concentrate resulted in
the best plant height among the different biofertilizers. While, in Exp 2 and 3 this
treatment yielded the best results at improving plant height in comparison with all other
treatments including urea. At the end of either experiment, plants inoculated with
microalgal biomass concentrate reached a range of 15 to 22 cm in height over the
untreated control. It is likely that the better performance of microalgal biomass
concentrate in Exp 2 and 3 was the result of the increased amount used of this
biofertilizer in contrast to Exp 1. N. muscorum UTEX 2209s or Anabaena sp. UTEX
2576 significantly increased plant height over the untreated control in Exp 1. However,
in Exp 2 and 3 they did not significantly increase plant height over the untreated control.
In Exp 2 and 3, Anabaena sp. UTEX 2576 and N. muscorum UTEX 2209s, respectively,
decreased plant growth in contrast to the untreated control. The inhibition of plant
growth (Pedurand and Reynaud 1987) is due the production of cyanotoxins by
cyanobacteria (Kós et al. 1995). However, cyanobacterial strains (referred also as
Anabaena/Nostoc sp. strain 7120) used in this study are nontoxic (Rouhiainen et al.
1995). Therefore, decreased plant growth with these cyanobacterial strains in Exp 2 and
3 may be related to environmental factors that limited plant growth.
Previous studies reported increased plant growth when cyanobacterial
biofertilizers were used. Singh et al. (2011) reported increased rice plant height when
rice seeds were inoculated with different cyanobacterial strains in contrast to the
untreated control. They also concluded that rice growth and development was enhanced
by systemic accumulation of phenylpropanoids in rice after cyanobacterial inoculation.
In another study, Shariatmadari et al (2011) reported that addition of cyanobacterial
extracts can enhance seed germination and plant growth of cucumber, tomato, and
squash in contrast to untreated control.

44
In the field study in 2014, the indigenous N2-fixing cyanobacterial isolate TX-
101 did not result in improved rice yields over the untreated control. Although,
indigenous cyanobacterial isolates have more tolerance to the environment where they
were collected as previously stated (Manchanda and Kaushik 2000), and their use results
in increased yields of different crops (Nisha et al. 2007; Maqubela et al. 2010), our
results demonstrated that indigenous cyanobacterial inoculants do not necessarily result
in improved yields. Also, the double inoculation of biofertilizers during 2014 in contrast
to 2013 did not increase rice yield over the untreated control. These results demonstrate
that increased amounts of biofertilizers do not necessarily result in improved rice yields.
Previous reports stated that the relative increase in rice yield with cyanobacterial
biofertilizers has been on average 28% in pot experiments, and 15% in field experiments
(Roger and Kulasooriya 1980) Similarly, Jha et al. (2013) reported a 21 and 26% rice
yield increase during a two-year field study, when plants were treated with cyanobacteria
in contrast to untreated control. Our field results during 2013, showed biofertilizer
treatments caused a slight increase in rice yield, since there was a 22 and 1% yield
increase, compared to the untreated control, when rice plants were inoculated with the
N2-fixing cyanobacterial inoculum and microalgal biomass concentrate, respectively.
Similarly, in 2014, a 5 and 4% yield increase, compared to the untreated control,
occurred when rice plants were inoculated with the microalgal biomass concentrate and
N. punctiforme, respectively. However, these yield increases were not statically
significant from the untreated control.
These results demonstrate that biofertilizers did not significantly increase rice
production in the field. Several factors can affect the potential of cyanobacterial
biofertilizers under field conditions. These factors include P deficiency, presence of high
concentrations of N in floodwater, low pH and arthropod grazer populations that can
limit growth and biological nitrogen fixation activities of cyanobacteria in rice fields
(Ladha and Reddy 1995). It has being mentioned that rice canopy plays an important
role in the growth of cyanobacteria (Yanni 1992; Choudhary 2009). At later rice
vegetative stages, the rice canopy is thicker; therefore, restricting the penetration of light

45
to the water surface, resulting in the limitation of cyanobacterial growth and N2-fixation.
Additionally, some considerations have been stated in order to ensure the best
performance of microalgae biofertilizers under field conditions. It has been
recommended applications of 10 - 15 kg ha-1
of air-dried cyanobacterial inoculant
(Venkataraman 1981) or 100 kg ha-1
(90% moisture) of fresh inoculum applied to rice
paddy fields 5 days after rice seedling transplantation, being more efficient if applied as
a fresh inoculum instead of dry (Yanni and Sehly 1991). Also, it is recommended to
apply the cyanobacterial biofertilizer for at least three consecutive cropping seasons in
order to ensure the establishment of the inoculated cyanobacteria in rice fields
(Venkataraman 1981). These reports demonstrate that success in inoculated N2-fixing
cyanobacterial biofertilizers is contingent on many factors; therefore their potential is
limited in the field.
N2-fixing cyanobacterial treatments have also been used in combination with
synthetic fertilizers (Yanni 1992; Yanni and Sehly 1991; Nayak et al. 2004; Singh et al.
1990; Irisarri et al. 2007). Venkataraman (1981) recommended 25 kg ha-1
of mineral
nitrogen fertilizer when supplemented with algal application. Nevertheless, urea at a rate
of 72 kg N ha-1
was found to support the best colonization when applied with
cyanobacteria (Yanni 1992). Aziz and Hashem (2004) reported that a 20% less of the
recommended synthetic fertilizer dose in combination with cyanobacteria resulted in
80.5% increase in rice yield. In another study, plots treated with 30 and 60 kg N ha–1
along with the inoculation of N2-fixing cyanobacteria exhibited the highest percentage
increase in terms of algal biomass and ARA (Nayak et al. 2004). Because biofertilizers
alone exhibit several limitations in the field, the combination of biological and synthetic
fertilizers can ensure higher production in a more environmentally-friendly manner.
Our results demonstrate that under greenhouse conditions microalgal biomass
concentrate resulted in a significant improvement in plant height among the different
fertilizers. Whereas, in the field, any biofertilizer did not significantly increase rice yield
over the untreated control. Also, our results prove that increased amounts of
biofertilizers or the use of an indigenous N2-fixing cyanobacterial isolate does not

46
necessarily result in better yields. Field conditions represent a challenging environment
for the establishment and effectiveness of biological fertilizers. Therefore, according to
our results, new approaches should be tested in order to obtain the maximum benefit
from biofertilizers. N2-fixing cyanobacterial genera more adapted to limiting light
conditions at later rice vegetative stages should be tested as previously mentioned (De et
al. 1998). It is also suggested that the combined use of biological fertilizers and synthetic
fertilizers has the potential to achieve a higher productivity in a more sustainable and
responsible manner.

47
CHAPTER V
CONCLUSIONS
The optimum temperature for the sheath blight development in rice was in the
range of 25 to 30°C. Development of sheath blight was slow at lower temperatures (10
and 15°C) and suppressed at higher temperatures (35 and 40°C). These trend patterns on
the effects of temperature on sheath blight development in rice are in a good agreement
with the patterns on the effects of temperature on the growth of mycelium of Rhizoctonia
solani on PDA medium. The biocontrol treatment reduced sheath blight in 47% in
Presidio and 42% in Jasmine 85, demonstrating that the effect of biocontrol is similar on
both susceptible and partially-resistant cultivars. The maximum reduction in disease
severity occurred when Jasmine 85 was treated with the biocontrol. These results suggest
that the combination of the biocontrol treatment and cultivar resistance can be a more
effective approach for management of sheath blight of rice than using the biocontrol
agent alone. The relative efficacy of the biocontrol treatment varied with temperature. Its
relative efficacy at 10, 15, 20, 25, 30, 35 and 40°C was 34, 28, 45, 51, 39, 56, and 50%,
respectively, indicating that Bacillus subtilis was more effective at higher temperatures
(35 and 40°C) than at lower temperatures.
Cercospora janseana isolates showed variable sensitivities to the quinone
outside inhibitors (QoI) azoxystrobin, pyraclostrobin, and trifloxystrobin, as well as to
thiophanate methyl and mancozeb, with some isolates such as CN-2-4 presenting low
sensitivity to most of these active ingredients. On the other hand, all isolates had high
sensitivity to the succinate dehydrogenase inhibitors (SDHI) fluxapyroxad that
contrasted with the low sensitivity to the SDHI flutolanil, demonstrating no cross-
resistance to these active ingredients. Demethylation inhibitor (DMI) active ingredients
did not inhibit conidia germination. However, the DMI propiconazole alone or in
combination with azoxystrobin or trifloxystrobin reduced narrow brown leaf spot

48
(NBLS) severity in the field evaluations. Similarly, fluxapyroxad effectively controlled
NBLS.
Although in the greenhouse, the microalgal biomass concentrate improved rice
plant height, the use of increased amounts of biofertilizers or the use of a N2-fixing
cyanobacterial isolate more adapted to the field conditions did not improve rice yields
over the untreated control under field conditions.

49
REFERENCES
1. Akhter, F., Ahmed, Z., Tahmida, Z., and Mondal, R. 2002. Increase of
macronutrients in soil by the application of blue green algae in rice
production. Pakistan J. Biol. Sci. 5:19-24.
2. Aziz, M., and Hashem, M. 2004. Role of Cyanobacteria on yield of rice in
saline soil. Pakistan J. Biol. Sci. 7:309-311.
3. Balba, H. 2007. Review of strobilurin fungicide chemicals. J. Environ. Sci.
Health Part B. 42:441-451.
4. Banger, K., Tian, H., and Lu, C. 2012. Do nitrogen fertilizers stimulate or
inhibit methane emissions from rice fields?. Global Change Biol. 18:3259-
3267.
5. Banniza, S., and Holderness, M. 2001. Rice sheath blight pathogen biology
and diversity. Pages 201-212 in: Major Fungal Diseases of Rice. S.
Sreenivasaprasad and R. Johnson, eds. Kluwer Academic Publishers,
Dordrecht, Netherlands.
6. Batres-Marquez, S.P., Jensen, H. H., and Upton, J. 2009. Rice Consumption in
the United States: Recent Evidence from Food Consumption Surveys. J. Am.
Diet. Assoc. 109:1719-1727.
7. Bellinger, E. G., and Sigee, D. C. 2010. Introduction to freshwater algae.
Pages 1-40 in: Freshwater Algae: Identification and Use as Bioindicators. E.
G. Bellinger and D. C. Sigee, eds. John Wiley & Sons, Ltd, Chichester, UK.
8. Bertocchi, C., Navarini, L., Cesàro, A., and Anastasio, M. 1990.
Polysaccharides from cyanobacteria. Carbohydr. Polym. 12:127-153.
9. Biswas, A. 2006. Narrow brown leaf spot disease of rice: a review. J.
Mycopathol. Res. 44:113-115.
10. Boyer, S. L., Flechtner, V. R., and Johansen, J. R. 2001. Is the 16S–23S rRNA
internal transcribed spacer region a good tool for use in molecular systematics

50
and population genetics? A case study in cyanobacteria. Mol. Biol. Evol.
18:1057-1069.
11. Broadbent, P., Baker, K. F., Franks, N., and Holland, J. 1977. Effect of
Bacillus spp. on increased growth of seedlings in steamed and in nontreated
soil. Phytopathology 67:1027-1034.
12. Buck, J. W., and Williams-Woodward, J. L. 2003. The effect of fungicides on
urediniospore germination and disease development of daylily rust. Crop Prot.
22:135-140.
13. Chaudhary, R. C. 1996. Standard evaluation system for rice. Int. Rice Res.
Inst., Manila, Philippine.
14. Chiocchio, V., Venedikian, N., Martinez, A. E., Ana Menendez, A. M.,
Ocampo, J. A., and Godeas, A. 2010. Effect of the fungicide benomyl on
spore germination and hyphal length of the arbuscular mycorrhizal fungus
Glomus mosseae. Int. Microbiol. 3:173-175.
15. Choudhary, D. K., and Johri, B. N. 2008. Interactions of Bacillus spp. and
plants–with special reference to induced systemic resistance (ISR). Microbiol.
Res. 164:493-513.
16. Choudhary, K. K. 2009. Occurrence of Chroococcaceae during rice cultivation
in north Bihar, India. Bangladesh J. Plant Taxon. 16:57-63.
17. Chowdappa, P., Kumar, S. M., Lakshmi, M. J., and Upreti, K. K. 2013.
Growth stimulation and induction of systemic resistance in tomato against
early and late blight by Bacillus subtilis OTPB1 or Trichoderma harzianum
OTPB3. Biol. Control 65:109-117.
18. Das, S., Mandal, B., and Mandal, L. 1991. Effect of growth and subsequent
decomposition of blue-green algae on the transformation of iron and
manganese in submerged soils. Plant Soil 138:75-84.
19. De, D. S., and Buresh, R. 1989. Integrated nitrogen management in irrigated
rice. Adv. Soil Sci. 10:143-169.

51
20. De Nobel, W. P., Matthijs, H. C., Von Elert, E. R. I. C., and Mur, L. R. 1998.
Comparison of the light‐limited growth of the nitrogen‐fixing cyanobacteria
Anabaena and Aphanizomenon. New Phytol. 138:579-587.
21. Dissanayake, N., and Wickramasinghe, D. 1999. Effect of N, P and K
application on the occurrence and severity of narrow brown leaf spot in
different rice varieties. Pages 267-276 in: Proc. Annual Symposium of DOA,
Batalagoda, Sri Lanka.
22. Driks, A. 2002. Overview: development in bacteria: spore formation in
Bacillus subtilis. Cell Mol. Life Sci. 59:389-391.
23. Estrada, B. A., and Ou, S. H. 1978. Methods of screening rices for varietal
resistance to Cercospora leaf spot. Int. Rice Res. Inst. Research Paper Series
No 19, Los Banos, Philippines.
24. Fairchild, K. L., Miles, T. D., and Wharton, P. S. 2013. Assessing fungicide
resistance in populations of Alternaria in Idaho potato fields. Crop Prot.
49:31-39.
25. Fernández‐Ortuño, D., Torés, J. A., de Vicente, A., and Pérez‐García, A.
2008. Field resistance to QoI fungicides in Podosphaera fusca is not
supported by typical mutations in the mitochondrial cytochrome b gene. Pest
Manag. Sci. 7:694-702.
26. Gachomo, E. W. 2005. Studies of the Life Cycle of Diplocarpon rosae Wolf
on Roses and the Effectiveness of Fungicides on Pathogenesis. Cuvillier
Verlag, Göttingen, Germany.
27. García-Gutiérrez, L., Romero, D., Zeriouh, H., Cazorla, F. M., Torés, J. A., de
Vicente, A., and Pérez-García, A. 2012. Isolation and selection of plant
growth-promoting rhizobacteria as inducers of systemic resistance in melon.
Plant Soil 358:201-212.
28. Goswami, B., Rahaman, M., Hoque, A., Bhuyan, K. and Mian, H. 2011.
Variations in different isolates of Rhizoctonia solani based on temperature and
pH. Bangladesh J. Agril. Res. 36:389-396.

52
29. Groth, D., Rush, M., Lindberg, G. 1990. Foliar fungicides for control of rice
diseases in the United States. Pages 31-52 in: Pest Management in Rice. B.T.
Grayson, M. B. Green, and L. G. Copping, eds. Elsevier Applied Science,
London, UK.
30. Gudmestad, N. C., Arabiat, S., Miller, J. S., and Pasche, J. S. 2013. Prevalence
and impact of SDHI fungicide resistance in Alternaria solani. Plant Dis.
97:952-960.
31. Gullino, M. L., Tinivella, F., Garibaldi, A., Kemmitt, G. M., Bacci, L., and
Sheppard, B. 2010. Mancozeb: past, present, and future. Plant Dis. 94:1076-
1087.
32. Hagen, K. D., Meeks, J. C. 1999. Biochemical and genetic evidence for
participation of DevR in a phosphorelay signal transduction pathway essential
for heterocyst maturation in Nostoc punctiforme ATCC 29133. J. Bacteriol.
181:4430-4434.
33. Henricot, B., Gorton, C., Denton, G., and Denton, J. 2008. Studies on the
control of Cylindrocladium buxicola using fungicides and host resistance.
Plant Dis. 9:1273-1279.
34. Henriksson, E. 1971. Algal nitrogen fixation in temperate regions. Plant Soil
35:415-419.
35. Huber, L., and Gillespie, T. J. 1992. Modeling leaf wetness in relation to plant
disease epidemiology. Annu. Rev. Phytopathol. 30:553-577.
36. Irisarri, P., Gonnet, S., Deambrosi, E., and Monza, J. 2007. Cyanobacterial
inoculation and nitrogen fertilization in rice. World J. Microbiol. Biotechnol.
23:237-242.
37. Ito, Y., Muraguchi, H., Seshime, Y., Oita, S., and Yanagi, S. O. 2004.
Flutolanil and carboxin resistance in Coprinus cinereus conferred by a
mutation in the cytochrome b 560 subunit of succinate dehydrogenase
complex (Complex II). Mol. Genet. Genomics 272:328-335.

53
38. Jha, M. N., Chaurasia, S. K., and Bharti, R. C. 2013. Effect of integrated
nutrient management on rice yield, soil nutrient profile, and cyanobacterial
nitrogenase activity under rice-wheat cropping system. Commun. Soil Sci.
Plant 44:1961-1975.
39. Kalpana, K., Maruthasalam, S., Rajesh, T., Poovannan, K., Kumar, K. K.,
Kokiladevi, E. Raja, J. A. J., Sudhakar, D., Velazhahan, R., Samiyappan, R.,
and Balasubramanian, P. 2006. Engineering sheath blight resistance in elite
indica rice cultivars using genes encoding defense proteins. Plant Science
170:203-215.
40. Karadimos, D. A., Karaoglanidis, G. S., and Tzavella–Klonari, K. 2005.
Biological activity and physical modes of action of the Q o inhibitor
fungicides trifloxystrobin and pyraclostrobin against Cercospora beticola.
Crop Prot. 24:23-29.
41. Karthikeyan, N., Prasanna, R., Nain, L., and Kaushik, B. D. 2007. Evaluating
the potential of plant growth promoting cyanobacteria as inoculants for wheat.
Eur. J. Soil Biol. 43:23-30.
42. Khush, G. S. 1997. Origin, dispersal, cultivation and variation of rice. Plant
Mol. Biol. 35:25–34.
43. Kobayashi, T., Mew, T. W., and Hashiba, T. 1997. Relationship between
incidence of rice sheath blight and primary inoculums in the Philippines:
mycelia in plant debris and sclerotia. Ann. Phytopathol. Soc. Jpn. 63:324-327.
44. Koenraadt, H., Somerville, S. C., and Jones, A. 1992. Characterization of
mutations in the beta-tubulin gene of benomyl-resistant field strains of
Venturia inaequalis and other plant pathogenic fungi. Phytopathology
82:1348-1354.
45. Kós, P., Gorzó, G., Surányi, G., and Borbély, G. 1995. Simple and efficient
method for isolation and measurement of cyanobacterial hepatotoxins by plant
tests (Sinapis alba L.). Anal. Biochem. 225:49-53.

54
46. Kumar, A., Prakash, A., and Johri, B. N. 2011. Bacillus as PGPR in crop
ecosystem. Pages 37-59 in: Bacteria in Agrobiology: Crop Ecosystems. D. K.
Maheshwari, ed. Springer, Berlin, Germany.
47. Kumar, K. V., Reddy M. S., Yellareddygari S. K., Kloepper J. W., Lawrence
K. S., Zhou X. G., Sudini, H., and Miller M. E. 2011b. Evaluation and
selection of elite plant growth-promoting rhizobacteria for suppression of
sheath blight of rice caused by Rhizoctonia solani in a detached leaf bio-assay.
Int. J. Appl. Biol. Pharmaceutical Technol. 2:488-495.
48. Kumar, K. V., Reddy, M. S., Kloepper, J. W., Lawrence, K. S.,
Yellareddygari, S. K. R., Zhou, X. G., Sudini, H., Reddy, E. C. S., Groth, D.
E., and Miller, M. E. 2011a. Screening and selection of elite plant growth
promoting rhizobacteria (PGPR) for suppression of Rhizoctonia solani and
enhancement of rice seedling vigor. J. Pure Appl. Microbio. 5:641-651.
49. Kumar, K. V., Reddy, M. S., Kloepper, J. W., Lawrence, K. S., Zhou, X. G.,
Groth, D. E., Zhang, S., Rao, R. S., Wang, Q., Raju, M. R., Raju, S. K.,
Fernando, W. G., Sudini, H., Du, B., and Miller, M. E. 2011d. Commercial
potential of microbial inoculants for sheath blight management and yield
enhancement of rice. Pages 237-264 in: Bacteria in Agrobiology: Crop
Ecosystems. D. K. Maheshwari, ed. Springer, Berlin, Germany.
50. Kumar, K. V., Yellareddygary, S. K. R., Reddy, M. S., Kloepper, K. S.,
Lawrence, K. S., Zhou, X. G., Sudini, H., Groth, D. E., Raju, S. K., and
Miller, M., E. 2012. Efficacy of Bacillus subtilis MBI 600 against sheath
blight caused by Rhizoctonia solani and on growth and yield of rice. Rice Sci.
19:55−63.
51. Kurniawati, N. N., Abdullah, S. N. H. S., and Abdullah, S. 2009. Investigation
on image processing techniques for diagnosing paddy diseases. Pages 272-277
in: International Conference of Soft Computing and Pattern Recognition.
IEEE, Malacca.

55
52. Ladha, J., and Reddy, P. 1995. Extension of nitrogen fixation to rice -
necessity and possibilities. GeoJournal 35:363-372.
53. Lee, F. N., and Rush, M. C. 1983. Rice sheath blight: a major rice disease.
Plant Dis. 67:829-832.
54. Manchanda, H., and Kaushik, A. 2000. Algal flora of the aridisols of Rohtak
and salt-tolerance of the indigenous cyanobacteria. Trop. Ecol. 41:217-224.
55. Mandal, B., Vlek, P., and Mandal, L. 1999. Beneficial effects of blue-green
algae and Azolla, excluding supplying nitrogen, on wetland rice fields: a
review. Biol. Fertil. Soils 28:329-342.
56. Mani, K., Hollier, C., and Groth, D. 2012. Effect of planting date, fungicide
timing, and varietal susceptibility levels on development of narrow brown leaf
spot of rice. Phytopathology 102: S75.
57. Maqubela, M. P., Mnkeni, P. N., Muchaonyerwa, P., D’Acqui, L. P., and
Pardo, M. T. 2010. Effects of cyanobacteria strains selected for their
bioconditioning and biofertilization potential on maize dry matter and soil
nitrogen status in a South African soil. Soil Sci. Plant Nutr. 56:552-559.
58. Marchetti, M. A. 1983. Potential impact of sheath blight on yield and milling
quality of short-statured rice lines in the southern United States. Plant Dis.
67:162-165.
59. Mathre, D. E., Callan, N. W., Johnston, R. H., Miller, J. B., and Schwend, A.
1994. Factors influencing the control of Pythium ultimum-induced seed decay
by seed treatment with Pseudomonas aureofaciens AB254. Crop Prot. 13:301-
307.
60. McCartney, C., Mercer, P. C., Cooke, L. R., and Fraaije, B. A. 2007. Effects
of a strobilurin-based spray programme on disease control, green leaf area,
yield and development of fungicide-resistance in Mycosphaerella graminicola
in Northern Ireland. Crop Prot. 8:1272-1280.

56
61. Mew, T. W., Leung, H., Savary, S., Vera Cruz, C. M., and Leach, J. E. 2004.
Looking ahead in rice disease research and management. CRC Crit. Rev. Plant
Sci. 23:103-127.
62. Mian, M., and Stewart, W. 1985. Fate of nitrogen applied as Azolla and blue-
green algae (Cyanobacteria) in waterlogged rice soils - a15
N tracer study. Plant
Soil 83:363-370.
63. Misra, J. K., Merca, S. D. and Mew, T.W. 1994. Fungal pathogens. Pages 4-
113 in: A Manual of Rice Seed Health Testing. T. W. Mew, and J. K. Misra,
eds. Int. Rice Res. Inst., Los Baños, Philippines.
64. Movahedi, S., and Waites, W. 2000. A two-dimensional protein gel
electrophoresis study of the heat stress response of Bacillus subtilis cells
during sporulation. J. Bacteriol. 182:4758-4763.
65. Moyne, A. L., Shelby, R., Cleveland, T. E., and Tuzun, S. 2001. Bacillomycin
D: an iturin with antifungal activity against Aspergillus flavus. J. Appl.
Microbiol. 90:622–629.
66. Nayak, S., Prasanna, R., Pabby, A., Dominic, T., and Singh, P. 2004. Effect of
urea, blue green algae and Azolla on nitrogen fixation and chlorophyll
accumulation in soil under rice. Biol. Fertil. Soils 40:67-72.
67. Nisha, R., Kaushik, A., and Kaushik, C. 2007. Effect of indigenous
cyanobacterial application on structural stability and productivity of an
organically poor semi-arid soil. Geoderma 138:49-56.
68. Olaya, G., Zheng, D., and Köller, W. 1998. Differential responses of
germinating Venturia inaequalis conidia to kresoxim-methyl. Pestic. Sci.
54:230–236.
69. Orozco-Avitia, A., Esqueda, M., Meza, A., Tiznado, M., Gutierrez, A., and
Gardea, A. 2013. Temperature effect on Rhizoctonia solani analyzed by
microcalorimetry. Am. J. Agric. Biol. Sci. 8:162-166.
70. Ou, S. H. 1985. Rice Diseases. 2nd
ed. Commonw. Agric. Bur., Kew, England.

57
71. Pan, X. B., Rush, M. C., Sha, X. Y., Xie, Q. J., Linscombe, S. D., Stetina, S.
R., and Oard, J. H. 1999. Major gene, nonallelic sheath blight resistance from
the rice cultivars Jasmine 85 and Teqing. Crop Sci. 39:338-346.
72. Pedurand, P., and Reynaud, P. A. 1987. Do cyanobacteria enhance
germination and growth of rice?. Plant Soil 101:235-240.
73. Pinson, S. R. M., Capdevielle, F. M., and Oard, J. H. 2005. Confirming QTL
and finding additional loci conditioning sheath blight resistance in rice using
recombinant inbred lines. Crop Sci. 45:503-510.
74. Prasanna, R., Chaudhary, V., Gupta, V., Babu, S., Kumar, A., Singh, R.,
Shivay, Y., and Nain, L. 2013. Cyanobacteria mediated plant growth
promotion and bioprotection against Fusarium wilt in tomato. Eur. J. Plant
Pathol. 136:337-353.
75. Provasoli, L., and Pintner, I. 1959. Artificial media for fresh-water algae:
problems and suggestions. Pages 84-96 in: The Ecology of Algae. C. Tryon
and R. Hartmann, eds. University of Pittsburgh, Pittsburgh, USA.
76. Rawat, I., Kumar, R. R., Mutanda, T., and Bux, F. 2011. Dual role of
microalgae: phycoremediation of domestic wastewater and biomass
production for sustainable biofuels production. Appl. Energy 88:3411-3424.
77. Reynaud, P. A., and Metting, B. 1988. Colonization potential of cyanobacteria
on temperate irrigated soils in Washington State, USA. Biol. Agric. Hortic.
5:197-208.
78. Roger, P. A., and Kulasooriya, S. 1980. Algalization. Pages 55-108 in: Blue-
Green Algae and Rice. G. S. Argosino, ed. Int. Rice Res. Inst., Los Baños,
Philippines.
79. Roger, P. A., and Ladha, J. 1992. Biological N2 fixation in wetland rice fields:
estimation and contribution to nitrogen balance. Plant Soil 141:41-55.
80. Romero, D., de Vicente, A., Rakotoaly, R. H., Dufour, S. E., Veening, J. W.,
Arrebola, E., Cazorla, F. M., Kuipers, O. P., Paquot, M., and Perez-Garcia, A.
2007. The iturin and fengycin families of lipopeptides are key factors in

58
antagonism of Bacillus subtilis towards Podosphaera fusca. Mol. Plant-
Microbe Interact. 20:430-440.
81. Rouhiainen, L., Sivonen, K., Buikema, W. J., and Haselkorn, R. 1995.
Characterization of toxin-producing cyanobacteria by using an oligonucleotide
probe containing a tandemly repeated heptamer. J. Bacteriol. 177:6021-6026.
82. Rush, M. C. and Lee, F. N. 1992. Sheaht blight. Pages 22-23 in Compendium
of Rice Disease. R. K. Webster and P. S. Gunnell, eds. APS Press, Minnesota,
USA.
83. Ryker, T., and Jodon, N. 1940. Inheritance of resistance to Cercospora oryzae
in Rice. Phytopathology 30:1041-1047.
84. Sah, D. H., and Rush, M. C. 1988. Physiological races of Cercospora oryzae
in the Southern United States. Plant Dis. 72:262-264.
85. Schmidt, C. S., Agostini, F., Leifert, C., Killham, K., and Mullins, C. E. 2004.
Influence of soil temperature and matric potential on sugar beet seedling
colonization and suppression of Pythium damping-off by the antagonistic
bacteria Pseudomonas fluorescens and Bacillus subtilis. Phytopathology
94:351-363.
86. Schmitz, S., Zini, J., Etienne, M., Moreau, J. M., Chandelier, A., and Cavelier,
M. 2007. Effectiveness of thiophanate-methyl, trifloxystrobin and vinclozolin
on canker caused by Phoma exigua Desm. On ash tree seedlings. Biotechnol.
Agron. Soc. Environ. 1:25-31.
87. Setlow, P. 2006. Spores of Bacillus subtilis: their resistance to and killing by
radiation, heat and chemicals. J. Appl. Microbiol. 101:514-525.
88. Shariatmadari, Z., Riahi, H., and Shokravi, S. 2011. Study of soil blue-green
algae and their effect on seed germination and plant growth of vegetable
crops. Rostaniha 12:101-110.
89. Shukla, A., and Gupta, A. 1967. Influence of algal growth-promoting
substances on growth, yield and protein contents of rice plants. Nature
213:744.

59
90. Sierotzki, H., and Scalliet, G. 2013. A review of current knowledge of
resistance aspects for the next-generation succinate dehydrogenase inhibitor
fungicides. Phytopathology 103:880-887.
91. Singh, D. P., Prabha, R., Yandigeri, M. S., and Arora, D.K. 2011.
Cyanobacteria-mediated phenylpropanoids and phytohormones in rice (Oryza
sativa) enhance plant growth and stress tolerance. Antonie Van Leeuwenhoek
100:557-568.
92. Singh, R. N. 1988. Status of brown spot (BS) and narrow brown leaf spot
(NBLS) in eastern Uttar Pradesh (UP), India. Int. Rice Res. Newsl. 13:35-36.
93. Singh, S., Prasad, R., Singh, B., Goyal, S., and Sharma, S. 1990. Effect of
green manuring, blue-green algae and neem-cake-coated urea on wetland rice
(Oryza sativa L.). Biol. Fertil. Soils 9:235-238.
94. Sinha, R. P., and Häder, D. P. 1996. Photobiology and ecophysiology of rice
field cyanobacteria. Photochem. Photobiol. 64:887-896.
95. Stanier, R., Kunisawa, R., Mandel, M., and Cohen-Bazire, G. 1971.
Purification and properties of unicellular blue-green algae (order
Chroococcales). Bacteriol. Rev. 35:171.
96. Tirol, A. C., Roger, P. A., and Watanabe, I. 1982. Fate of nitrogen from a
blue-green alga in a flooded rice soil. Soil Sci. Plant Nutr. 28:559-569.
97. Tullis, E. 1937. Cercospora oryzae on rice in the United States.
Phytopathology 27:1005-1008.
98. Vaishampayan, A., Sinha, R., Häder, D. -P., Dey, T., Gupta, A., Bhan, U., and
Rao, A. 2001. Cyanobacterial biofertilizers in rice agriculture. Bot. Rev.
67:453-516.
99. Venkataraman, G. S. 1981. Blue-Green Algae for Rice Production: A Manual
for its Promotion. Food & Agricultural Org, Rome.
100. Waldburger, C., Gonzalez, D., and Chambliss, G. H. 1993. Characterization of
a new sporulation factor in Bacillus subtilis. J. Bacteriol. 175:6321.

60
101. Wang, L., Huang, W.-W. , Liu, L.-M., Fu, Q., and Huang, S.-W. 2011.
Evaluation of resistance to sheath blight (Rhizoctonia solani) in partial Indica
hybrid rice combinations from Southern China. Acta Agron. Sin. 37:263-270.
102. Welker, M., and Von, Döhren. H. 2006. Cyanobacterial peptides - nature’s
own combinatorial biosynthesis. FEMS Microbiol. Rev. 30:530-563.
103. Wong, F. P., and Wilcox, W. F. 2002. Sensitivity to azoxystrobin among
isolates of Uncinula necator: Baseline distribution and relationship to
myclobutanil sensitivity. Plant Dis. 4:394-404.
104. Xu, Q., Yuan, X., Yu, H., Wang, Y., Tang, S., and Wei, X. 2011. Mapping
quantitative trait loci for sheath blight resistance in rice using double haploid
population. Plant Breed. 130:404-406.
105. Yang, X. B., G. T. Berggren, and J. P. Snow. 1990. Effects of free moisture
and soybean growth stage on focus expansion of Rhizoctonia aerial blight.
Phytopathology 80:497-503.
106. Yang, X., and Zhang, H. 2012. Synergistic interaction of tea saponin with
mancozeb against Pestalotiopsis theae. Crop Prot. 40:126-131.
107. Yanni, Y. 1992. The effect of cyanobacteria and azolla on the performance of
rice under different levels of fertilizer nitrogen. World J. Microbiol.
Biotechnol. 8:132-136.
108. Yanni, Y., and Sehly, M. 1991. Rice performance and natural infection with
blast (Pyricularia oryzae Cav.) under different algalization techniques and
rates of fertilizer nitrogen. World J. Microbiol. Biotechnol. 7:43-47.
109. Zhou, X. G. 2014. Rice main-crop cutting height affects severity of narrow
brown leaf spot in the ratoon crop. Phytopathology 104: S138.

61
APPENDIX A
SEQUENCING ENDOGENOUS RICE PADDY SAMPLES
COLONY PCR:
Materials:
Sterile 200µL PCR tubes
TE Buffer (10mM Tris + 1mM EDTA, pH 8.0) with 1% Triton
Sterile pipette for transfers
Chloroform:Isoamyl Alcohol (24:1)
Procedure:
1. Fill a 200µL PCR tube with concentrated sample.
2. Centrifuge at 14,000rpm for 5 minutes.
3. Decant supernatant.
4. Re-suspend pellet in 100 µL TE Buffer with 1% Triton.
5. Vortex the cell suspension for 5-10 seconds.
6. Incubate in a thermocycler at 99°C for 10 min (set the thermocycler with a 10
minute hold at 99°C followed by a hold at 4°C).
7. Remove from thermocycler and add 100µL of Chloroform:Isoamyl Alcohol
(24:1).
8. Mix by inversion for 2-3 minutes.
9. Centrifuge at 14,000rpm for 5 minutes.
10. Supernatant (aqueous layer) contains desired PCR product. Remove this layer
into a fresh PCR tube without disturbing the phase line.
11. The product can be reserved at 4°C for future use in the short term or -20°C/-
80°C if longer storage is required.
ITS AMPLIFICATION:
Add the following components to a PCR tube:

62
40.8µL H2O
5 µL 10X Buffer
1 µL dNTP (0.2mM each final)
1.5 µL MgCl2 (1.5mM)
0.25 µL Cyano ITS1-R (Working stock 12µM)
0.25 µL Cyano ITS2-F (Working stock 12µM)
0.2 µL Invitrogen Platinum TAQ DNA Polymerase
1 µL Sample’s PCR Product
Incubate in thermocycler under the following program:
1 Cycle of: 94°C for 2:00min
35 cycles of: 94°C for 1:00/57°C for 1:00/72°C for 4:00
1 cycle of: 72°C for 10:00
1 hold of: 4°C for ∞
GEL VERIFICATION:
Materials:
~30mL 0.6% agarose in 1X TAE
Gel cast with well template
1X TAE
Tub of ethidium bromide
Procedure:
1. Melt 0.6% agarose in 1X TAE in microwave (~2 min).
2. Allow solution to cool but not solidify.
3. Pour agarose solution into gel cast with well template in place until the bottom of
the cast is completely covered. Allow gel to set (15-20 min).
4. Place gel in electrophoresis apparatus. Fill with 1X TAE until the top of gel is
completely covered.
5. Load one well with 2µL of DNA ladder.

63
6. Load other wells with a mix of 5µL amplification product and 1µL 6X loading
buffer.
7. Run gel from black to red at 70V, 400amp for ~1.5 hrs.
8. Stain gel in ethidium bromide for ~20min.
9. Visualize gel with UV transilluminator.
If only one band ~1,600bp – proceed to purification for sequencing.
If two bands ~1,600bp and ~600bp (or more) – repeat amplification on product
with ITS1 and ITS5. Desired product is ~600bp.
PRODUCT PURIFICATION:
1. Follow instructions for GeneJET PCR Purification Kit (#K0702).
2. Verify product integrity and concentration using nanodrop. (Make sure to clean,
blank, re-blank, and one measurement with H2O).
3. For samples sent to LIMS for sequencing, rxn must have 2-5ng product for every
100bp.
4. Create two 12µL rxns to sequence, each in 1.5mL tubes:
ex: Forward:
3µL of 13ng/µL product with desired 600bp
1µL ITS5
8µL H2O
ex: Reverse:
3µL of 13ng/µL product with desired 600bp
1µL ITS1
8µL H2O
5. Enter sequencing request on LIMS (core prep primer-template), 12pmol primer.

64
APPENDIX B
SAS CODES ACCORDING TO EACH CHAPTER
CHAPTER II
In vitro study.
ANOVA and LSD test
proc glm;
class rep temp;
model diameter = temp;
means temp/lsd lines;
run;
Greenhouse study.
ANOVA and LSD test
proc glm data= severity;
class rep cult treat temp;
model seve = rep cult rep*cult
treat cult*treat rep*cult*treat
temp cult*temp treat*temp cult*treat*temp;
test h=cult e=rep*cult;
test h=treat e=rep*cult*treat;
test h=cult*treat e=rep*cult*treat;
means cult/lsd lines e=rep*cult;
means treat/lsd lines e=rep*cult*treat;
means temp/lsd lines e=rep*cult*treat*temp;
lsmeans cult*treat/pdiff lines;
lsmeans cult*temp/pdiff lines;
lsmeans treat*temp/pdiff lines;
lsmeans cult*treat*temp/pdiff lines;

65
run;
CHAPTER III
In vitro study.
Normality of data
PROC UNIVARIATE DATA=germination NORMAL PLOT;
VAR germ;
QQPLOT germ /NORMAL(MU=EST SIGMA=EST COLOR=RED L=1);
RUN;
ANOVA and LSD test
proc glm data=germination;
class rep iso fungic rate;
model germ =rep iso rep*iso fungic iso*fungic rep*iso*fungic rate
iso*rate fungic*rate iso*fungic*rate;
means iso/lsd lines;
means fungic/lsd lines;
means rate/lsd lines;
lsmeans iso*fungic/pdiff lines;
lsmeans iso*rate/pdiff lines;
lsmeans fungic*rate/pdiff lines;
lsmeans iso*fungic*rate/pdiff lines;
run;
CHAPTER IV
Greenhouse study.
ANOVA and LSD test including the effect of all days after planting (DAP)
proc glm data=height;
class rep fert DAP;
model height =rep fert DAP fert*DAP;

66
means fert/lsd lines;
means DAP/lsd lines;
lsmeans fert*DAP/pdiff lines;
run;
ANOVA and LSD test for each day after planting
proc glm;
class rep fert;
model height = fert;
means fert/lsd lines;
run;
Field study.
ANOVA and LSD test
proc glm;
class rep fert;
model yield =fert;
means fert/lsd lines;
run;