Embed Size (px)
Citation preview

11ENVIRONMENTAL HEALTH
NEARLY 6,000 PEOPLE die prematurely each
year from water pollution and poor sanitation
and hygiene. Seventeen percent of reported
disease cases and one and a half percent of
reported deaths in the country each year can
be attributed to water pollution, sanitation
conditions and hygiene practices. Among them,
diarrhea is the third leading cause of disease
in the country. Typhoid and schistosomiasis
and other diseases also are signifi cant, but
together account for less than one percent of
all reported disease cases (Tables 2.1 and 2.2).
Filipinos are paying for treatment and losing
income. Each year these illnesses cost Filipinos
an estimated PHP2.8 billion (US$56 million)
in treatment costs, including drugs, hospital
fees, and the lost income from missing work
to undergo treatment. Premature death from
these diseases is also costing the economy an
estimated PHP3.9 billion (US$78 million) per
year in lost income (Table 2.3).10
The disease burden has steadily decreased
since the mid-1990s. The incidence of
diseases caused by water pollution, sanitation
conditions and hygiene practices peaked in
the mid-1990s and since that time steadily
decreased to less than half of that level
(Figure 2.1). This reduction is largely a result
of a decrease in reported diarrhea cases and
has paralleled a reduction in deaths from
infectious disease in the country. Schistosomiasis,
hepatitis A, and fi lariasis also are declining.
10 This can be considered a lower bound estimate of economic costs, as it only accounts for the costs associated with casesthat are reported to undergo treatment at a clinic or hospital and does not include indirect costs such as pain and sufferingassociated with having an illness and does not include unreported treatment cases and those for which people do not seek treatment.
Chapter 2.WATER POLLUTION,
SANITATION AND HEALTH
Table 2.1 Proportion of reported diseases attributable to water pollution, sanitation,
and hygiene
Disease
Reported cases attributable to water pollution, sanitation,
and hygiene
% of reported cases for all
disease
Diarrhea 507,864 16.50
Schistosomiasis 6,628 0.22
Typhoid and paratyphoid
6,300 0.20
Cholera 3,857 0.1
Hepatitis A 2,048 0.07
Filariasis 21 0.0007
Total 526,718 17
Source: Reported data from DOH-NEC 2004a. Outbreak cases also included for typhoid and cholera (see Table 2.7). Number of cases attributable to water pollution, sanitation, and hygiene were determined as outlined in methodology section.
Table 2.2 Reported deaths attributable to water pollution, sanitation and hygiene in 2002
Disease Number of deaths % of deathsby all causes
Intestinal and infectious disease
3,811 1.0
Nutritionaldeficiencies
912 0.2
Hepatitis A 693 0.1
Schistosomiasis 304 0.15
STH 174 0.05
Cholera 70 0.02
Filariasis 2 0.0007
Total 5,619 1.5
Source: NSO 2000b, 2002. See Methodology section for determination of attributable deaths. Outbreak cases are also included in the above numbers for cholera (Table 2.7).
Disease Burden

12
Chapter 1. INTRODUCTIONChapter 1. INTRODUCTION
PHILIPPINES ENVIRONMENT MONITOR
WATER POLLUTION, SANITATION AND HEALTH
Regional disparities are high. The Autonomous
Region of Muslim Mindanao (ARMM), the
Central Visayas (Region VII), and Cordillera
Administrative Region (CAR) have the highest
reported incidence of disease cases attributable
to water pollution, sanitation and hygiene.
Incidence rates are three to fi ve times higher
than regions with the lowest incidence rates
(Figure 2.2).
Cases of diarrhea have declined substantially.
Since 1995, there has been a steady decline of
reported cases of this disease, which is almost
entirely caused by water pollution, poor
sanitation and hygiene. However, it remains
prevalent throughout the country (Figure 2.3).
Schistosomiasis is found only in certain regions.
Nationally, reported schistosomiasis incidence
has decreased over the last ten years and is
considered insignifi cant in half of the regions.
Currently, nearly 90 percent of the reported
cases are in CARAGA and the Eastern Visayas
(see Map).
Disease Burden
Figure 2.2 Reported diseases attributableto water pollution, sanitation and
hygiene by region
Figure 2.1 Reported diseases attributableto water pollution, sanitation and
hygiene by year
Source: DOH-NEC 2004a. See Methodology for calculation of attributable diseases. Includes diarrhea, cholera, dengue, filariasis, schistosomiasis, hepatitis A, and typhoid and paratyphoid.
Source: DOH-NEC 2004a data, including diarrhea, schistosomiasis, viral hepatitis, typhoid and paratyphoid. Comparable data not availabla for dengue, cholera, and filariasis.
Figure 2.3 Diarrhea
Reported Incidence (Per 100,000 per year)Cases Deaths
Overall: 722 3.8Children (<5 years): 3,872 18
High incidence areas:Guimaras Province: 2,660Antique Province: 2,332
National trend over last 10 years: Reduced 43 percent
Estimated cases attributable to water pollution,sanitation and hygiene 88 percent
Includes reported cases only. DOH-NEC 2004a (national incidence); and NSO 2002 (deaths). Trend in incidence based on 1995–2004 data from DOH-NEC, 2004a and DOH, 2000.

13ENVIRONMENTAL HEALTH
WATER POLLUTION, SANITATION AND HEALTH
APR
IL 2007 IBRD
35224
Disease Burden

14
Chapter 1. INTRODUCTIONChapter 1. INTRODUCTION
PHILIPPINES ENVIRONMENT MONITOR
Medical expenses is one of the costs families are paying due to water pollution, poor sanitation and hygiene.Source: Association of Medical Doctors of Asia (AMDA International)
WATER POLLUTION, SANITATION AND HEALTH
ago, but lower than in 2001 and 2002, when
incidence rose to 2.5 cases per 100,000. Ninety
percent of the reported cases are limited to three
regions—CARAGA, Western Mindanao, and the
Eastern Visayas. The highest rates are found in
Surigao del Sur (74 cases per 100,000 per year)
and Agusan del Norte (38 cases per 100,000 per
year).11 It is estimated that a relatively small
portion of the cases of this disease are due to
water pollution, poor sanitation and hygiene.
Table 2.3 Treatment costs and lost income from diseases attributable to water pollution, sanitation and hygiene
Water-relatedDisease
Morbidity Mortality
Total(PHP million/yr)
Direct income losses due to hospitalization
(PHP million/yr)
Medical Expenses and Hospitalization(PHP million/yr)
Income losses to GDP due to lost productive
life years (PHP million/yr)
Diarrhea 139 2,522 2,827 5,488
Nutritional deficiencies NA NA 676 676
Cholera 1.3 28 14 43
Typhoid 2.5 51 NA 54
Hepatitis A 2,048 17 0.07 222
Schistosomiasis 3.1 50 162 215
Filariasis 0.02 0.3 1 1.3
Total PHP147 million/yr (US$2.9 million/yr)
PHP2,668 million/yr (US$53 million/yr)
PHP3,884 million/yr (US$78 million/yr)
PHP6,700 million/yr (US$134 million/yr)
Source: See methodology section for details.
Hepatitis A has declined 70 percent over the
last ten years. Water pollution, sanitation and
hygiene are estimated to account for 50 percent
of the reported cases of this disease. It is found
throughout the country, with relatively little
variation among regions (Figure 2.4).
Filariasis is limited to a few regions. The reported
incidence of fi lariasis in 2005 was 0.5 cases per
100,000 Filipinos. This is similar to a decade
Figure 2.4 Hepatitis A
Reported Incidence (Per 100,000 per year)Cases
Overall: 5.1Children (<5 years): 3.8High incidence areas:Guimaras Province: 82Antique Province: 49
National trend over last 10 years: Reduced 70 percent
Estimated cases attributable to water pollution,sanitation and hygiene 50 percent
Includes reported cases only. DOH-NEC 2004a (national incidence); and NSO 2002 (deaths). Trend in incidence based on 1994–2004 data from DOH-NEC, 2004a.
11 DOH-NEC 2004a.
Disease Burden

15ENVIRONMENTAL HEALTH
WATER POLLUTION, SANITATION AND HEALTH
Cholera is an outbreak threat. While overall
reported cholera incidence is low relative to
other diseases (0.4 cases per 100,000 each year),
it occurs in outbreaks and thus, can have high
incidence in localized areas, typically in urban
slums, where water supply and sanitation
systems are inadequate. NCR (Pasay and Quezon
City) and Western Mindanao (Zamboanga
City) are the only areas that consistently report
cholera cases. The largest recent outbreak was
in Pangasinan in 2004, which resulted in 3,424
cases. The number of outbreaks per year has
decreased by half over the last 10 years.
Reported cases of typhoid remain high. An
estimated 50 percent of typhoid cases are due to
water pollution, sanitation conditions and
hygiene practices. Outbreaks are commonly
associated with contaminated water supply
systems. Reported cases of typhoid and
paratyphoid have not declined over the last ten
years and are found in all regions; seven
consistently report it as one of the top ten
leading causes of disease (Figure 2.5). The
Disease Burden
Figure 2.5 Typhoid and Paratyphoid Trends
Incidence (Per 100,000 per year)Cases Deaths
Overall: 16 1.1Children (<5 years): 18 0.3
High incidence areas:Ifugao Province: 271Quirino Province: 457
National trend over last 10 years: No Trend
Estimated cases attributable to water pollution,sanitation and hygiene 50 percent
Includes reported cases only. DOH-NEC 2004a (national incidence); and NSO 2002 (deaths). Trend in incidence based on 2001–2005 data from DOH-NEC, 2004a.
number of outbreaks per year, however, has
reduced since the 1990s.
At least 40 percent of schoolchildren have
soil-transmitted helminthes. Studies have
consistently indicated a very high prevalence
of these diseases among Filipino children. An
average of between 40 and 95 percent of the
children studied were found to be infected with
at least one of these parasites, and between 4
and 22 percent were heavily infected.12 Studies
undertaken ten years ago show similarly high
prevalence rates.
Paralytic shellfi sh poisonings have declined.
During the 1980s and early 1990s there were
many outbreaks of paralytic shellfi sh poisoning
resulting in as many as 200 to 300 reported cases
per year. In 2005, there were no reported cases
in the Philippines, while in 2004 there were only
four cases. In 2004, disease cases were due to
red tides in Negros Occidental and Masbate.13
Soil transmitted helminthes are found in over 40 percent of Filipino children and are spread through soil contaminated by fecal matter.Source: LLDA.
12 Kim, B. et al. 2003 survey of 301 children in Roxas City; and Balazario et al. 2000 survey of 1, 871 children in Luzon, Visayas,and Mindanao; Surveys done in 1995 (UNHP) and 1998 (CDCS) indicated a 57 and 64 percent prevalence, respectively.13 BFAR website and DOH-NEC 2004a.

16
Chapter 1. INTRODUCTIONChapter 1. INTRODUCTION
PHILIPPINES ENVIRONMENT MONITOR
WATER POLLUTION, SANITATION AND HEALTH Environmental Risks
The Risks of Poor Sanitation and Water Pollution
Basic household sanitation, including sanitary
toilets and septic tanks, combined with hygiene
practices such as washing hands, provides a
means of removing human waste safely away
from the household and has been shown
worldwide to substantially reduce incidence
of disease.
There have been large improvements in basic
household sanitation. Construction of sanitary
toilets has increased the proportion of the
population with access to basic sanitation in
the country from 57 percent in 1990 to 72
percent in 2004 (Table 2.4). The 15 percent
improvement is comparable to other Asian
countries. The gap in access to basic sanitation
facilities in rural and urban households,
however, remains high. Only 59 percent of
rural households have access to basic sanitation,
well behind urban households with 80 percent
(Table 2.4). In many rural areas, open
defecation is common as a means of waste
disposal among groups such as farmers,
fi shermen, and children. Several regions are
signifi cantly behind the 72 percent national
average, notably the Autonomous Region of
Muslim Mindanao (ARMM) (Figure 2.6).
Hand washing is among the most effective ways
of reducing disease. Studies worldwide have
shown that programs to encourage the habit
of washing of hands with soap can reduce
diarrhea by between 30 and 50 percent. Recent
evidence has indicated that pneumonia can be
reduced by similar levels.14 In the Philippines,
surveys have shown that nearly all Filipinos
regularly wash their hands before eating.
However, only 26 percent of households
regularly wash their hands before handling
and preparing food, and less than 50 percent
regularly wash their hands after going to the
toilet (Table 2.5).15
14 Esrey et al. 1991; Hutley et al. 1997; Luby et al. 2005.15 Data from DOH 2000 also See ISF 2004.
Table 2.5 Hand washing habits
Timing of hand washing % of households
Before handling and preparing food 25.7
Before eating 96.9
After going to toilet 45.1
Source: DOH 2000.
Figure 2.6 Percent of households with sanitary toilets by region
Source: Department of Health National Epidemiology Center 2004a.
Table 2.4 Percent of households with access to improved sanitation
1990 2004
Urban 66 80
Rural 48 59
Total 57 72
Source: UNICEF 2006.

17ENVIRONMENTAL HEALTH
WATER POLLUTION, SANITATION AND HEALTHEnvironmental Risks
Campaign advertisement encouraging regular maintenance of septic tanks. Source: USAID Philippines and Municipality of Iloilo
Septic tanks are commonly used. Motivated by
requirements under the National Building
Code, half of Filipino households overall and
most urban dwellers have septic tanks that
collect wastewater from their households.16
Septic tanks are designed to treat waste
through the removal of solids and assist in
disinfection. The tanks generally receive only
toilet wastes while wastewater from other
household activities is discharged directly to
the surface drainage system.
16 NSO 2000b.
Box 2.1 Examples of sanitation conditions in poor communities in the Philippines
Barangay Tangnan, Panglao, Bohol. This is a coastal community on the northern side of Panglao with a total population of 2,957. Eighty-two percent of the community uses pour flush pit latrinesystems, largely without septic tanks. Waste is leaking into the porous ground (limestone) and into the groundwater. Defecation behind bushes or in fields is common. The water supply is contaminated with bacteria (E. coli).
Barangay Looc, Dumaguete City: This community is located near the pier in Dumaguete City and is composed primarily of informal settlers. Mostresidents have simple houses made of boards, cement floors, and iron sheets that do not contain sanitary toilets. Sixty-three percent of the households surveyed send their sewage to the barangay canal, which emits foul odors, while the remainder goesinto the groundwater (30 percent) or the nearbycreek (6 percent). Flooding is common at times of heavy rainfall, in part due to clogged drainage systems. Groundwater used by some residents for drinking water was recently declared unfit to drink.
Communities near waterways in Metro Manila.Low income areas are found throughout Metro Manila. Many of these communities are locatednear waterways such as the Pinagsama Creek (Taguig) and Manggahan floodway. Most houseshave flush toilets and individual septic tanks thatare not maintained, in part due to theirinaccessibility. Some children defecate outdoors. The waste from septic tanks and other liquid waste (kitchen, laundry) is deposited in an open area or drained from the house to open concrete, earthen drains, and some covered concrete drains. These drains are often in disrepair or get clogged, necessitating periodic maintenance. It is estimated that with improved drainage and septic tank management systems, these areas could have health benefits of PHP30 million per year (PHP300 per person per year).
Source: World Bank 2003b; WSP.2006.

18
Chapter 1. INTRODUCTIONChapter 1. INTRODUCTION
PHILIPPINES ENVIRONMENT MONITOR
WATER POLLUTION, SANITATION AND HEALTH Environmental Risks
Poor construction and maintenance of septic
tanks reduces their effectiveness. Many septic
tanks are poorly or improperly constructed
without lining and underground fi lters.
Moreover, to function as designed, septic tanks
need to be maintained regularly in order to
remove built-up solids. Nationally, less than
one percent of tanks are known to undergo
regular desludging with acceptable treatment.17
In most cases, they are only maintained in
response to emergency situations when the
septage backs up into the household or the
tank is otherwise clogged. When they are
desludged, the waste sludge is not disposed
according to DENR standards, except in portions
of Manila, Baguio, and a few cities in Palawan
that have public treatment facilities.
Drainage systems and groundwater receive much
of the waste in urban areas. Only seven cities
have piped sewer systems. These systems cover
a small percentage (between one and 15 percent)
of their respective populations. As a result, 95
percent of the wastewater fl owing from
households directly or via septic tanks is
transported into groundwater or into public
canals and drainage systems and eventually
into rivers and other water bodies.18 For
example, in Metro Manila, only 15 percent of
the population is connected to the sewerage
system. As a result, 192,000 tons of domestic
waste enters the drainage system and
groundwater each year after only minor
17 The exact quantity is not known as the disposal practices of private septic tank maintenance companies are not regulated or monitored. Of the regulated systems, there are only three known cities with public facilities for maintenance and treatment of septage waste, which together serve 0.3 percent of the country’s population. There are plans to expand treatment of septage in Manila (see ManagementResponse section).18 A total of 2 million people in urban areas (4.7% of the urban population) are connected to sewerage systems (Manila, 15%; Baguio City, 2%; Zamboanga City, 1%; Vigan City, 3%; Bacolod City, <1%; Cauayan, Isabela, 2%; Davao City, <1%).
treatment in largely unmaintained septic
tanks. This has left urban drainage systems
and groundwater contaminated with human
waste. It poses a risk for the portion of the
urban population proximate to open drainage
systems. It is also a risk to those that rely on
groundwater wells and leaky water distribution
systems for their water supply (Table 2.6).
Table 2.6 Bacteria concentration in drainage systems in Manila
Community Type of drainageE-Coli
(million/100mL)
Taguig Open drains and covered concrete draining to creek
0.2–0.9
ManggahanFloodway
Shallow lined channels draining to creek or larger roadside channels
0.2–0.9
Sitio Olandes Shallow concrete channels in streets with drainage to deeper channels
0.2–5
Camp Atienzaand IndustrialValley
Covered concrete channels along street draining to open channel/creek
0.2–23
Source: World Bank 2003b.
An open drain in Metro Manila.Source: LLDA

19ENVIRONMENTAL HEALTH
WATER POLLUTION, SANITATION AND HEALTHEnvironmental Risks
Much of the surface water in urban areas is a
public health risk. Monitoring of surface water
indicates that most of the larger urban centers
in the country have rivers that pose a contact
risk to public health (below a Class C standard)
(Table 2.7). Levels of coliform bacteria in all
rivers in Manila, including tributaries of Laguna
de Bay, exceed DENR standards in some cases
by several orders of magnitude. Many beaches
in Manila Bay, especially those along the eastern
side, also have levels of bacteria that present
a signifi cant health risk to those using it for
transport, fi shing, and bathing.19
19 It is estimated that between 1995 and 1998 water-related disease and red tides cost the population near Manila Bay a total of PHP327 million (US$7.3 million) per year in lost income and health expenditures. See GEF/UNDP/IMO 2004.
Rural surface water can also spread disease.Contaminated surface water from open defecation and sewage in rural areas are also an important risk. It has been shown that contact with contaminated water in rural areas can lead to the spread of schistosomiasis and other diseases (Box 2.2).
Table 2.7 Urban or peri-urban areas with rivers(Class C or below) that pose contact risk
to public health
City River(s)
Metro Manila Parañaque River; San Juan River;NMTT River; Marikina River;Pasig River
North Manila Bay AreaSan Jose del Monte; Marilao; Sta. Maria;Apalit; Calumpit; Meycauayan; Guiginto
Marilao River; Sta Maria River; Pampanga River; Meycauayan River; Guiguinto River
West Bay of Laguna de Bay
San Pedro; Cabuyao; San Cristobal;Santa Cruz
Dagupan City, Pangasinan
Dagupan River
San Fernando City, Pampanga
San Fernando River
Calapan City, Mindoro Oriental
Calapan River
Cebu City Guadalupe River; Cotcot River
Iloilo City Jaro River; Iloilo River
Zamboanga City Saaz River; Manicahan River
Butuan, Agusan del Norte
Agusan River
Source: DENR-EMB 2003.
Box 2.2. Schistosomiasis in Gonzaga, Cagayan Province
Barangay Tapel is a rural barangay, where themain sources of livelihood are farming andfishing. Most of the farming areas are irrigatedby community-constructed irrigation canals. A study in 2004 found that 6.3 percent of the population—most of whom were farmers—tested positive for schistosomiasis. The disease was found to be transmitted via the Nagbabaguian Creek. The creek, which is near the farmers’ fields and commonly floods them, is inhabited by 92,000 vector snailsand is visibly contaminated with human waste. Asnearly 90 percent of the barangays have sanitary toilets with septic tanks and open defecation by farmers is common, the disease is likely spread through water contaminated by farmers whodefecate openly in their fields or in the creek andthen wade in the water without protective boots, allowing for transmission of the disease throughthe skin.
Source: DOH-NEC 2004b.
Waterways polluted with sewerage are common in urban areas in the Philippines.Source: Authors.

20
Chapter 1. INTRODUCTIONChapter 1. INTRODUCTION
PHILIPPINES ENVIRONMENT MONITOR
WATER POLLUTION, SANITATION AND HEALTH
Red tides are common in Philippines. Between
1983 and 2002, there were 42 major red tides
with toxic algal booms that cause paralytic
shellfi sh poisoning. These occur in coastal areas
in many parts of the country and were very
common in the Visayas in the 1980s and 1990s.
The most common areas for red tides more
recently have been on the coast of Zamboanga
del Sur and in Manila Bay. The impact of the
occurrence of red tide on health has declined
signifi cantly due to government monitoring and
regulation of the consumption of shellfi sh in
affected areas.20
Heavy metal contamination from mining
activities is a commonly reported source of
toxic water pollution. In 1996 the Marcopper
mine released an estimated 1.5 million m3 of
mine tailings containing heavy metals which
contaminated drinking water, agricultural fi elds,
the Boac River, and nearby villages, causing
elevated levels of heavy metals in some of the
residents of the area. In addition to this case,
several other mining operations have exposed
populations to heavy metals. These include:
a mercury mine near Honda Bay that
contaminated surface water with mercury,
•
Environmental Risks
20 BFAR website and NEC-DOH 2004a.
leading to the accumulation of the metal in
fi sh and in people in the area;
gold mining activities in Sibutad Western
Mindanao that contaminated surface water,
leading to elevated levels of mercury in the
exposed population;
gold mining activities in Monkayo Mindanao
that contaminated the Naboc River with
mercury, which accumulated in fi sh and
in rice cultivated in the area and led to
high levels of mercury in a portion of the
population; and
gold processing activities in Apolon, Tagum,
Davao Del Norte that caused elevated levels
of mercury in water and a portion of the fi sh
and children in the area.
Studies in the Philippines have found that
people with elevated levels of mercury can have
higher incidence of some health problems such
as gingivitis, skin discoloration, neurological
disorders, and anemia.21
Other toxic pollution incidences have also
been reported. For example, an electronics
company reported to DENR (March 2007)
that groundwater in Las Piñas in the vicinity
of a site previously used by the company
was contaminated by trichloroethylene.
Trichloroethylene and the chemicals it forms
after decomposition can lead to short-term
symptoms such as dizziness and headaches
and longer term effects such as cancer. The
municipality, the company, DENR, DOH, and
Maynilad Water Company are working to
better understand the extent of the
contamination and provide those people using
the groundwater with alternative sources of
water supply.
•
•
•
Farmers in schistosomiasis endemic areas such as CARAGA risk acquiring the disease when in contact with contaminated water. Source: World Bank Photo Library.
21 Akagi et al. 2000 (Apokon case); Maramba et al. 2006 (Honda Bay case); Castillo et al. 2003; Cortes-Maramba et al. 2006 (Sibutad case); Tauli Corpez http://www.twnside.org.sg/title/toxic-ch.htm(Marcopper case); Appleton et al. 2006 (Moncayo case).

21ENVIRONMENTAL HEALTH
WATER POLLUTION, SANITATION AND HEALTHEnvironmental Risks
The Risks of Inadequate Water Supply
Both the quantity and quality of water supplied
to households are important factors that can
increase exposure to water pollution and waste.
The source of the water and the distribution
system can create opportunities for water
supplies to be contaminated in poorly designed
wells, leaky public distribution systems, or
through transport from trucks and water
vendors. Having an adequate quantity of water
to undertake hygienic practices (including hand
washing and bathing) and for household
cleaning of sanitation facilities and food
preparation areas is also an important factor
in reducing disease transmission.
22 Taken from data and trends presented in WHO/UNICEF 2006.23 NSO 2003b.
Figure 2.7 Water use by level of service
Level I: Point sources, including shallow wells, deep hand pumps, and spring development.Level II: Communal faucets and public taps.Level III: Individual household connections.Source: SWS and World Bank, 2000. A similar, more recent survey in Metro Manila found similar results, MWSS/MWSI,unpublished data, 2007.
Gains made in household connections have
increased the amount of water available
for hygiene. Between 1993 and 2003,
the use of traditional water sources such
as wells, ponds, rivers, and springs for
drinking water decreased from 62 to 40
percent, while piped household connections
increased from 26 to 40 percent over the
same time period. As a result, an estimated 58
A house water supply connection in Manila.Source: Authors.
percent of the population in urban areas and
23 percent in rural areas have water supplied
through house connections.22
The larger quantity of house connections has
increased the water available for hygiene
purposes. Surveys have found that people with
house connections use 150 liters of water per
day, which is two to three times higher than
those using other sources. It is estimated that
optimal health benefi ts can be achieved using
100 liters of water per day combined with
good hand washing habits (Figure 2.7).
People are increasingly reliant on water vendors.
While household connections have expanded
nationally, they have not been able to keep
up with population growth, resulting in an
increased use of water peddlers, trucks, bottled
water, or water refi lling stations. Twelve percent
of the population in urban areas is dependent
on these alternative sources of water.23

22
Chapter 1. INTRODUCTIONChapter 1. INTRODUCTION
PHILIPPINES ENVIRONMENT MONITOR
WATER POLLUTION, SANITATION AND HEALTH
Regular monitoring of water refi lling stations
and bottled water has been strengthened
signifi cantly through the DOH and local
sanitary inspectors, which helps better ensure
the quality of the water from these sources.
Informal, unregistered peddlers, however, are
in many cases not regulated or monitored
actively. The quality of the water and
handling practices and their associated health
risks are therefore largely unknown. The high
cost and time necessary to obtain water from
water vendors can also reduce water use and
diminish the associated hygiene benefi ts in
many cases. In part due to these concerns,
they are not recognized as improved water
sources for purposes of meeting the country’s
Millennium Development Goal for water
supply. With this growing dependence on
these sources, the Philippines is now off track
to meet this goal.24
Environmental Risks
Unsafe water quality is common. Studies of
groundwater quality found that 58 percent of
the sampled groundwater tested positive for
coliform bacteria. Surveys of LGUs have also
indicated that one half or more of their public
water systems do not meet drinking water
quality standards.25 In addition to contributing
to endemic levels of disease from daily
consumption and exposure, contaminated
water supplies have resulted in outbreaks
causing 5,000 cases of diarrhea, typhoid, and
cholera over the past three years (Table 2.7).
The reasons for the contamination can largely
be traced to a combination of an inadequate
sanitation system and a water supply system
that is susceptible to contamination (Box 2.4
and 2.5.A water vendor in Manila.Source: Water and Sanitation Program.
Table 2.7 Recent diseases outbreaks caused by contaminated water supplies
City Diseases(# of cases) Deaths
Ibajay, Aklan (2006) Typhoid (82) –
Sibulan , Negros Oriental(2005)
Typhoid (82) –
San Andres and Virac , Catanduanes (2005)
Cholera (444) 14
Virac, Catanduanes (2004) Diarrhea (675) –
Tondo, NCR (2003) Diarrhea (385 )Cholera (41)
8
45 locations, Pangasinan (2004)
Cholera (3,424) 47
Muntinlupa, NCR (2004) Cholera (82) –
Marabut, Samar (2004) Typhoid (32) 3
Source: NEC.
25 Compiled from feasibility studies under the World Bank LGU Water and Sanitation Project.
24 The joint monitoring program for the MDGs has reported that access to improved water sources declined from 87 to 85 percent between 1990 and 2004. UNICEF 2006. In urban areas, access to improved water sources decreased from 95 to 87 percent.
23ENVIRONMENTAL HEALTH
WATER POLLUTION, SANITATION AND HEALTH
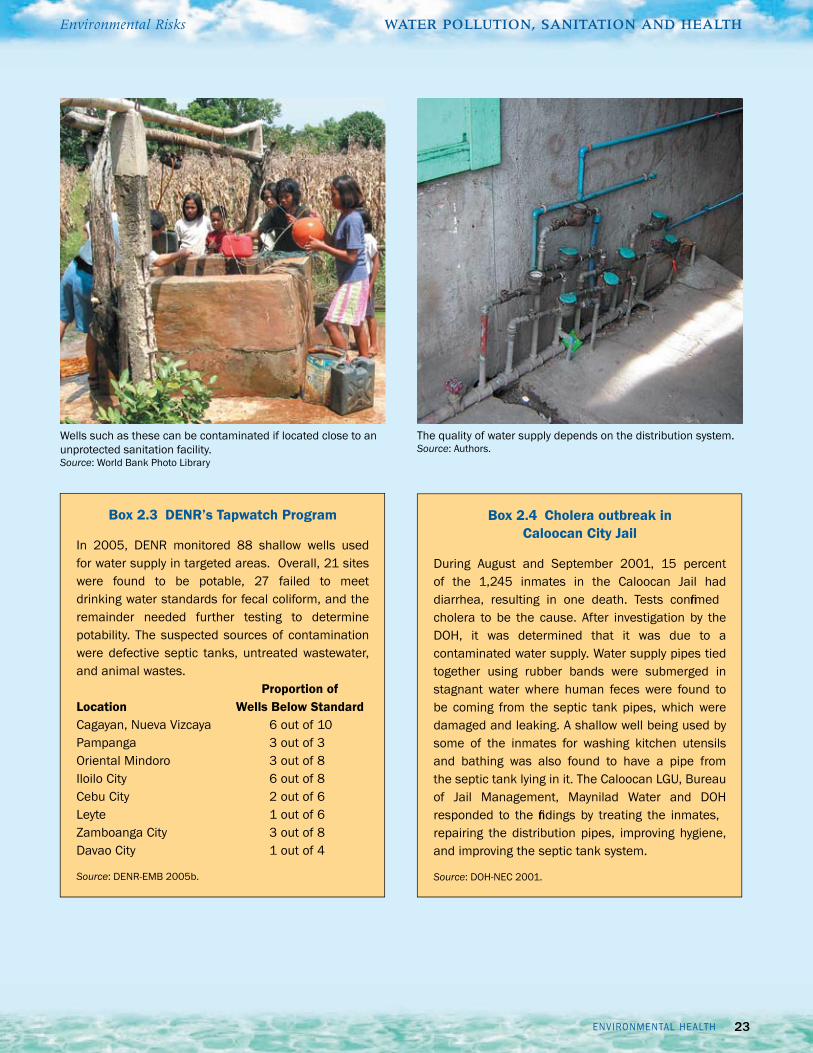
The quality of water supply depends on the distribution system.Source: Authors.
Box 2.4 Cholera outbreak inCaloocan City Jail
During August and September 2001, 15 percentof the 1,245 inmates in the Caloocan Jail had diarrhea, resulting in one death. Tests confirmed cholera to be the cause. After investigation by the DOH, it was determined that it was due to a contaminated water supply. Water supply pipes tied together using rubber bands were submerged in stagnant water where human feces were found tobe coming from the septic tank pipes, which were damaged and leaking. A shallow well being used by some of the inmates for washing kitchen utensils and bathing was also found to have a pipe fromthe septic tank lying in it. The Caloocan LGU, Bureau of Jail Management, Maynilad Water and DOHresponded to the findings by treating the inmates, repairing the distribution pipes, improving hygiene, and improving the septic tank system.
Source: DOH-NEC 2001.
Box 2.3 DENR’s Tapwatch Program
In 2005, DENR monitored 88 shallow wells usedfor water supply in targeted areas. Overall, 21 sites were found to be potable, 27 failed to meetdrinking water standards for fecal coliform, and the remainder needed further testing to determine potability. The suspected sources of contamination were defective septic tanks, untreated wastewater, and animal wastes.
Proportion ofLocation Wells Below StandardCagayan, Nueva Vizcaya 6 out of 10Pampanga 3 out of 3Oriental Mindoro 3 out of 8Iloilo City 6 out of 8Cebu City 2 out of 6Leyte 1 out of 6Zamboanga City 3 out of 8Davao City 1 out of 4
Source: DENR-EMB 2005b.
Wells such as these can be contaminated if located close to an unprotected sanitation facility. Source: World Bank Photo Library
Environmental Risks

24
Chapter 1. INTRODUCTIONChapter 1. INTRODUCTION
PHILIPPINES ENVIRONMENT MONITOR
WATER POLLUTION, SANITATION AND HEALTH Environmental Risks
Box 2.5 What are the risks to your water supply?
Individual well systems. The depth and location of a well are risk factors for well-water systems. Shallow wellsdraw from groundwater nearest to the land surface, which is the most likely to be affected by contaminationsources. Deeper wells extract groundwater from areas that benefit from further filtration through soil and from sources less likely to be affected by surface activities.
Countermeasures. Locate the well away from and on higher ground than sanitation facilities, sewers, fueltanks, livestock activities, and solid waste disposal sites; dig deep wells where possible; prevent channelingof surface water into well systems using a casing around the well borehole and a well cap; and regularly testthe water quality.
Piped water supply. Risks to piped water systems relate to the adequacy of treatment and the integrity ofthe distribution system. Typically water service providers treat the water using sediment removal anddisinfection and other treatment depending on the quality of the source water. In cases where the treatmentsystem is adequate, the risk is associated with a malfunctioning water system, especially in cases of floodingor power failure. Low water pressure due to aging or unmaintained pipelines also provides an opportunity forsewage to flow into the water supply system or for backflow of contaminated water from users with directconnection to a contaminated pipe or vessel, such as illegal connections or industrial processes. Stores ofbacteria and other material in sediment deposits in low water pressure networks or biofilm formation on pipescan also be resuspended in cases of rapid changes in flow.
Countermeasures. Operation, testing, and public information on treatment system performance; providingresidual chlorine to disinfect leakages and control biofilms; reducing the length of time in distribution systemsand pressure surges; providing devices (stop valves or air gaps) that prevent backflow into the water system; providing regular maintenance and rehabilitation of network leaks; and locating new network systems awayfrom septic tanks and sewers.
Water vendors. Registered water refilling stations and bottled water are regularly monitored by the Departmentof Health. However, there is limited knowledge and transparency about the source, treatment, and water qualityfrom informal water vendors. The major risks depend on the source of water and share similar risks as pipedwater and wells. For example, shallow wells in urban areas would be considered high-risk sources, while illegal connections or reselling of utility water would share similar risks associated with piped water supply. Duringtransport, delivery, and storage, there are risks associated with the contamination of public faucets, tanks, orother vessels.
Countermeasures. Better knowledge of the source, treatment process, and quality; similar measures to ensure quality of source water as above; and disinfection and covering water transport and storage containers.