Embed Size (px)
Citation preview
Discrimination in Healthcare as a Barrier to Care
Experiences of socially disadvantaged populations in France
Presented by Mathieu Ichou (INED)Co-authored with Joshua Rivenbark (Duke University)
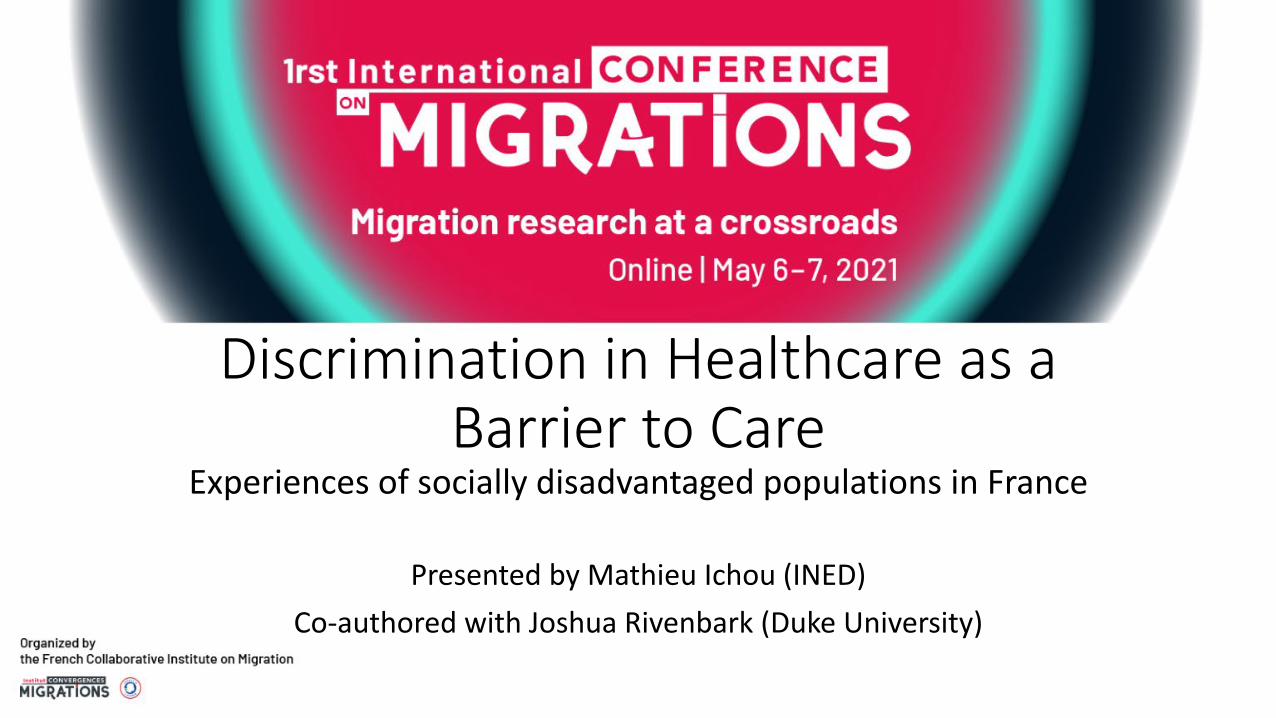
Background: Discrimination and Health• Link between experiences of discrimination and worse health (Lewis et al, 2015;
Williams & Mohammed, 2009)
• Direct – Physiological stress responses from discrimination“direct encounters with discriminatory events
contribute to negative health outcomes” (Harrell, et al 2003, p. 243)
• Indirect – Behavioral changesPerceived discrimination associated with health-related behaviors such as diet, exercise, sleep, substance use (Meta-analysis: Pascoe & Richman, 2009)
• Much less is known on association between discrimination and utilization of healthcare
Discrimination and Healthcare Engagement• Mechanism: Healthcare may be perceived as setting of increased risk of
discrimination and thus be avoided
• Parallel line of research: HIV-related stigma associated with lower retention in care among patients with HIV (Geng et al, 2009; Valenzuela et al, 2015)
• One previous study: Swedish mail survey (Wamala et al, 2007)• Higher rates of discrimination in healthcare for women vs men• Reported discrimination over 3 months → higher odds of foregone care over same
period• Focus on gender comparisons
Research questions
1. What is the prevalence of • reported discrimination within the healthcare setting, • foregoing medical care,
across a range of social groups in France (gender, immigrant generation, race/ethnicity, religion) ?
2. To what extent disparities in foregone care can be explained by discrimination in healthcare ?
French context• Large immigrant population (Beauchemin, Hamel, & Simon, 2018), ethnically and
religiously diverse
• French republican model of integration (Favell, 2016)• Race/ethnicity statistics not used for official purposes• Data on ethnic minority groups limited…• …But discrimination is not (Quillian et al., 2019)
• High quality of healthcare and universal insurance coverage (Durand-Zaleski, 2015; WHO, 2000)
Trajectories and Origins (TeO) survey
• Conducted by INED and INSEE from 2008 – 2009 (Beauchemin, Hamel, & Simon, 2018)
• Nationally representative survey of French adults aged 18 to 59• N = 21,761 • Oversamples of immigrants and children of immigrants (>8,000 in each group)
• 1-hour face-to-face questionnaire, including a (small) health module
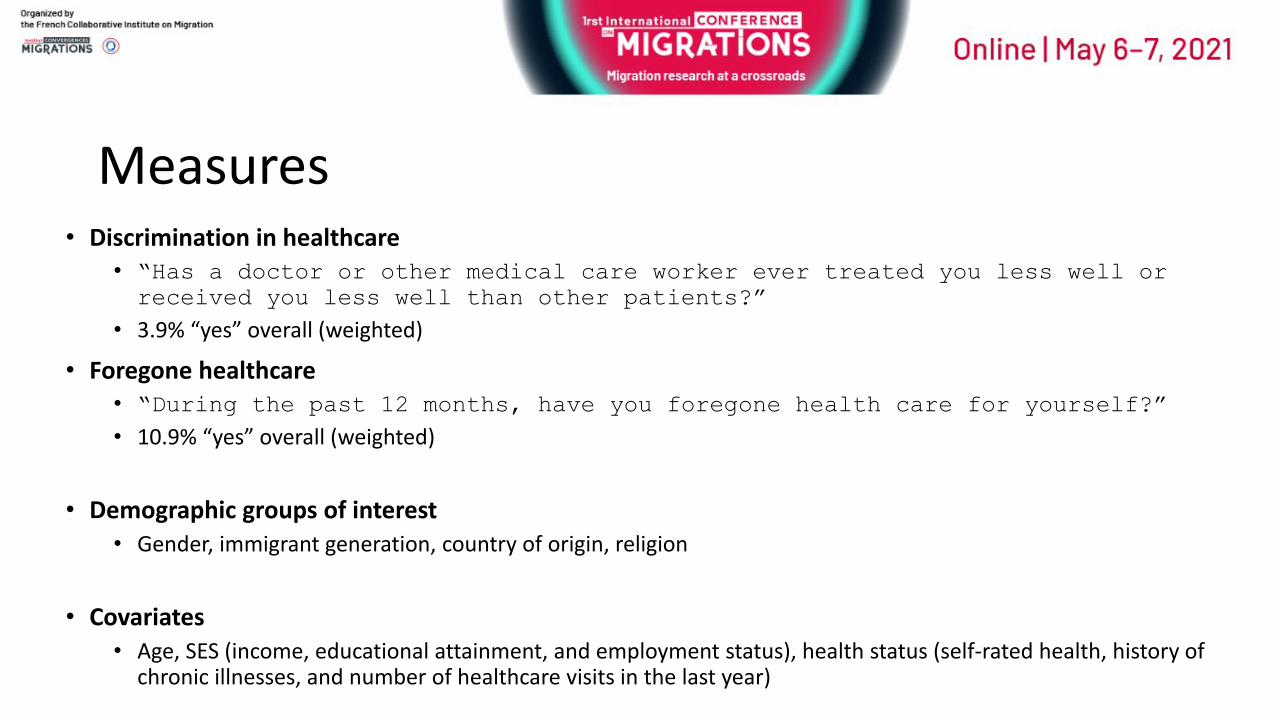
Measures• Discrimination in healthcare
• “Has a doctor or other medical care worker ever treated you less well or received you less well than other patients?”
• 3.9% “yes” overall (weighted)
• Foregone healthcare• “During the past 12 months, have you foregone health care for yourself?” • 10.9% “yes” overall (weighted)
• Demographic groups of interest• Gender, immigrant generation, country of origin, religion
• Covariates• Age, SES (income, educational attainment, and employment status), health status (self-rated health, history of
chronic illnesses, and number of healthcare visits in the last year)
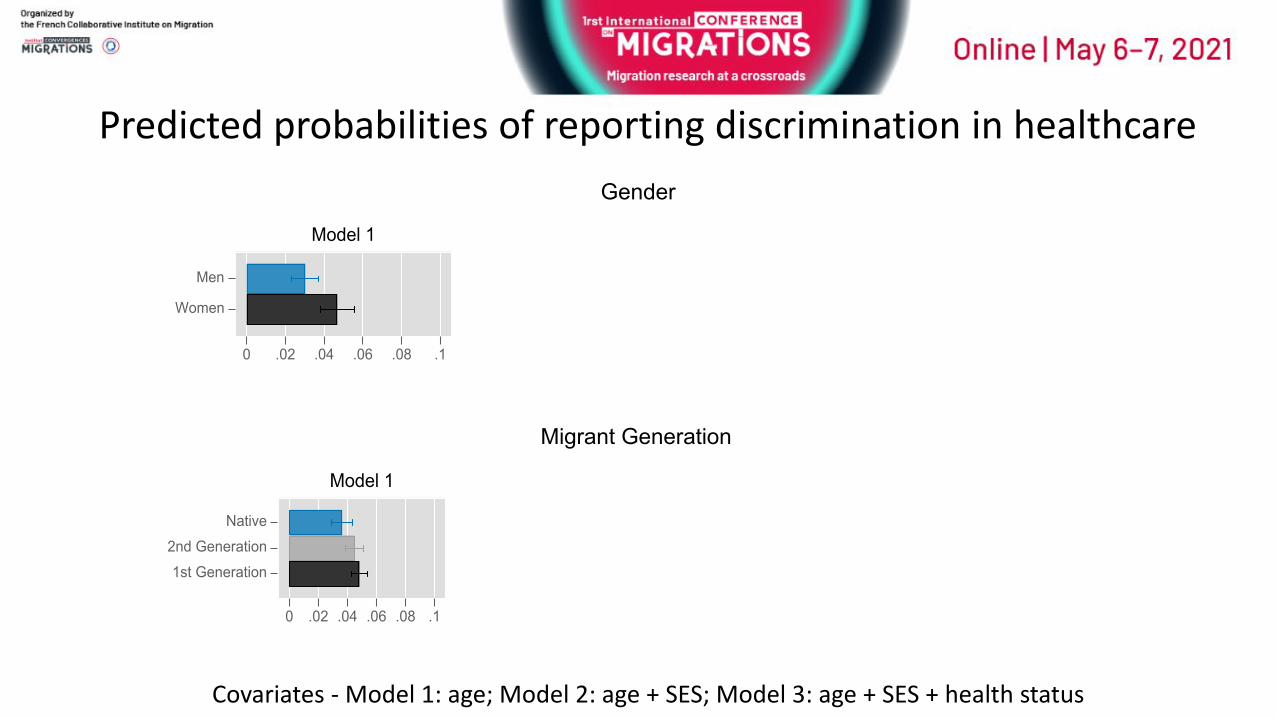
Predicted probabilities of reporting discrimination in healthcare
Gender
Migrant Generation
Men
Women
0 .02 .04 .06 .08 .1
Model 1
Men
Women
0 .02 .04 .06 .08 .1
Model 2
Men
Women
0 .02 .04 .06 .08 .1
Model 3
Native2nd Generation1st Generation
0 .02 .04 .06 .08 .1
Model 1
Native2nd Generation1st Generation
0 .02 .04 .06 .08 .1
Model 2
Native2nd Generation1st Generation
0 .02 .04 .06 .08 .1
Model 3
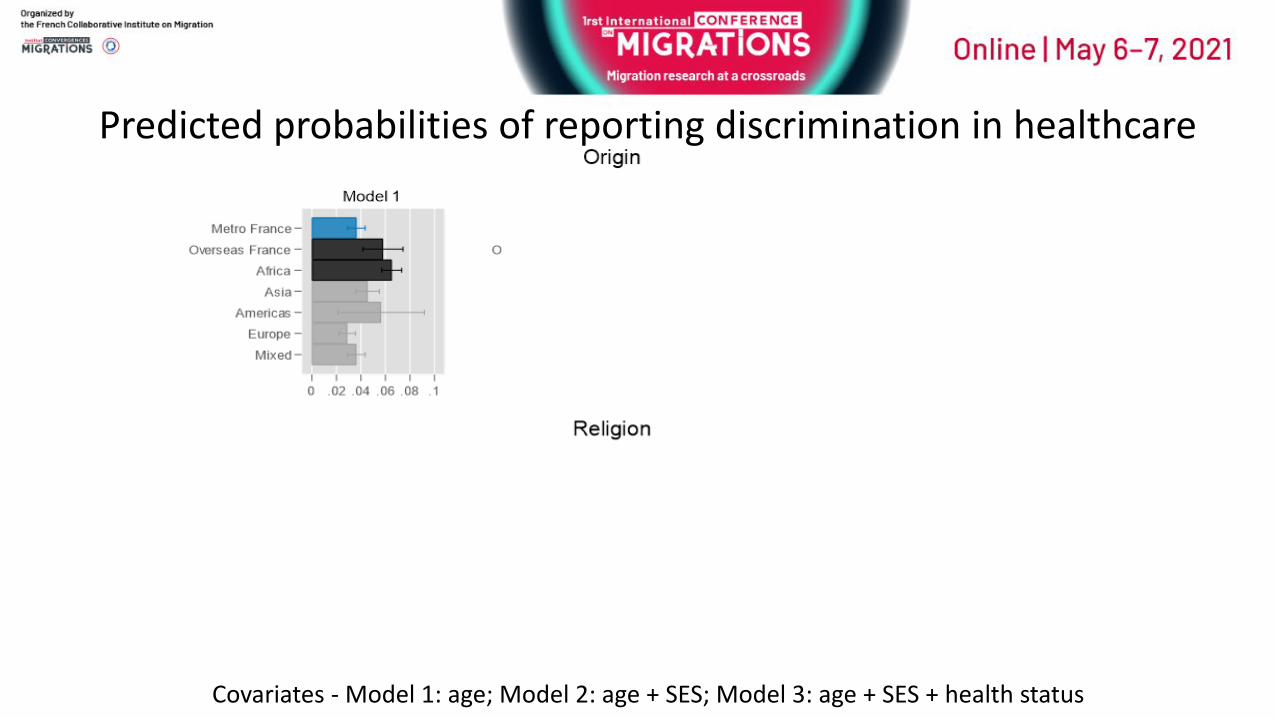
Covariates - Model 1: age; Model 2: age + SES; Model 3: age + SES + health status
Covariates - Model 1: age; Model 2: age + SES; Model 3: age + SES + health status
Predicted probabilities of reporting discrimination in healthcare
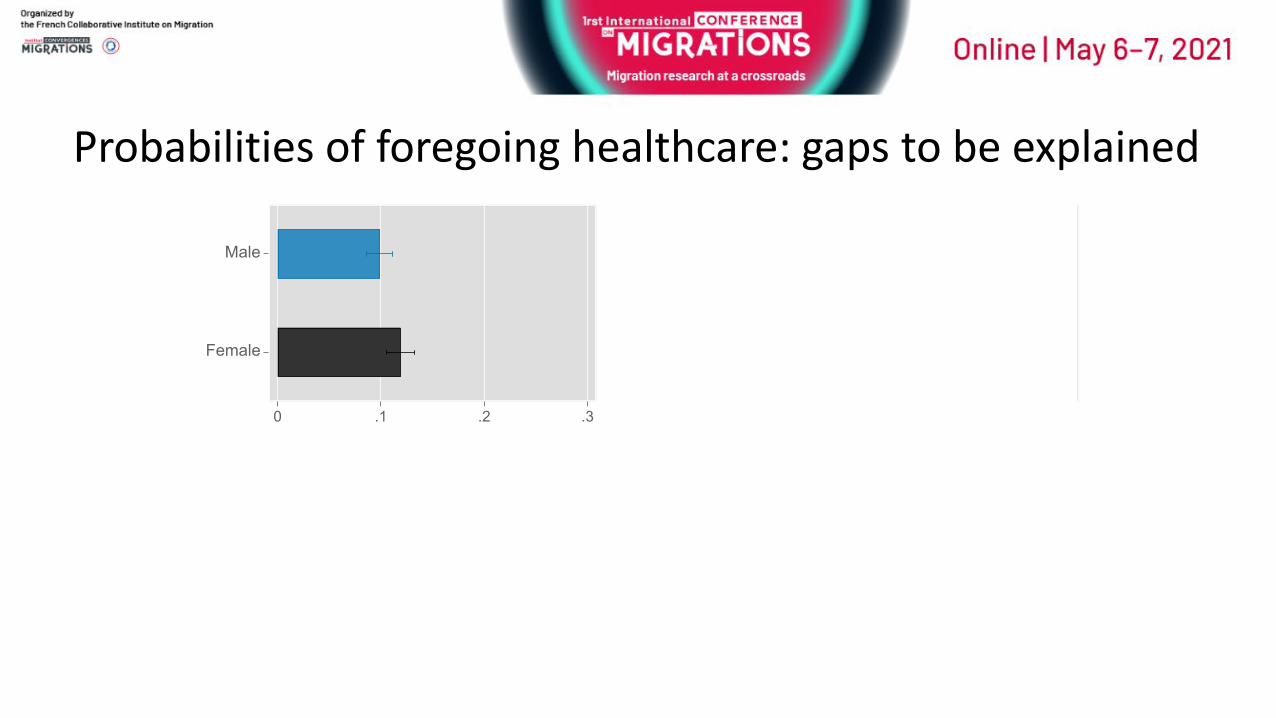
Probabilities of foregoing healthcare: gaps to be explained
Male
Female
0 .1 .2 .3
Metro France
Overseas France
Africa
Asia
Americas
Europe
Mixed
0 .1 .2 .3
Native
2nd Generation
1st Generation
0 .1 .2 .3
Christian
No Religion
Muslim
Jewish
Buddhist
Hindu/Sikh
0 .1 .2 .3
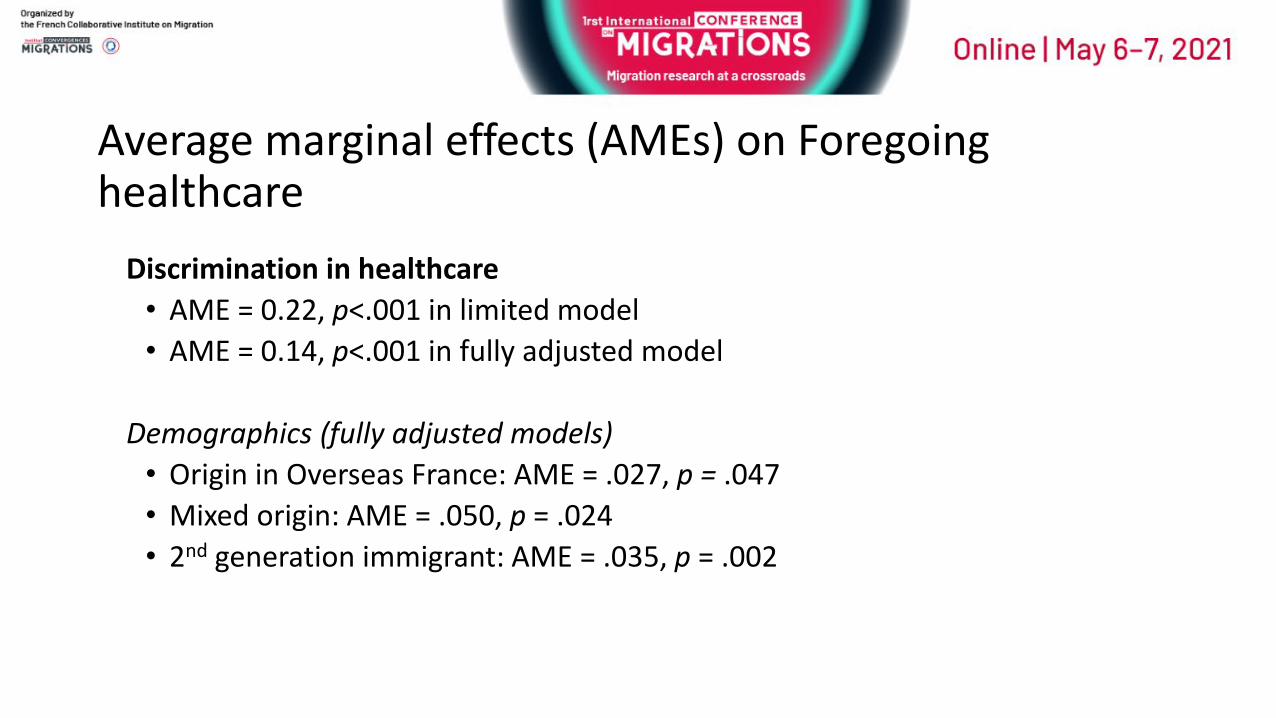
Average marginal effects (AMEs) on Foregoing healthcare
Discrimination in healthcare• AME = 0.22, p<.001 in limited model• AME = 0.14, p<.001 in fully adjusted model
Demographics (fully adjusted models)• Origin in Overseas France: AME = .027, p = .047• Mixed origin: AME = .050, p = .024• 2nd generation immigrant: AME = .035, p = .002
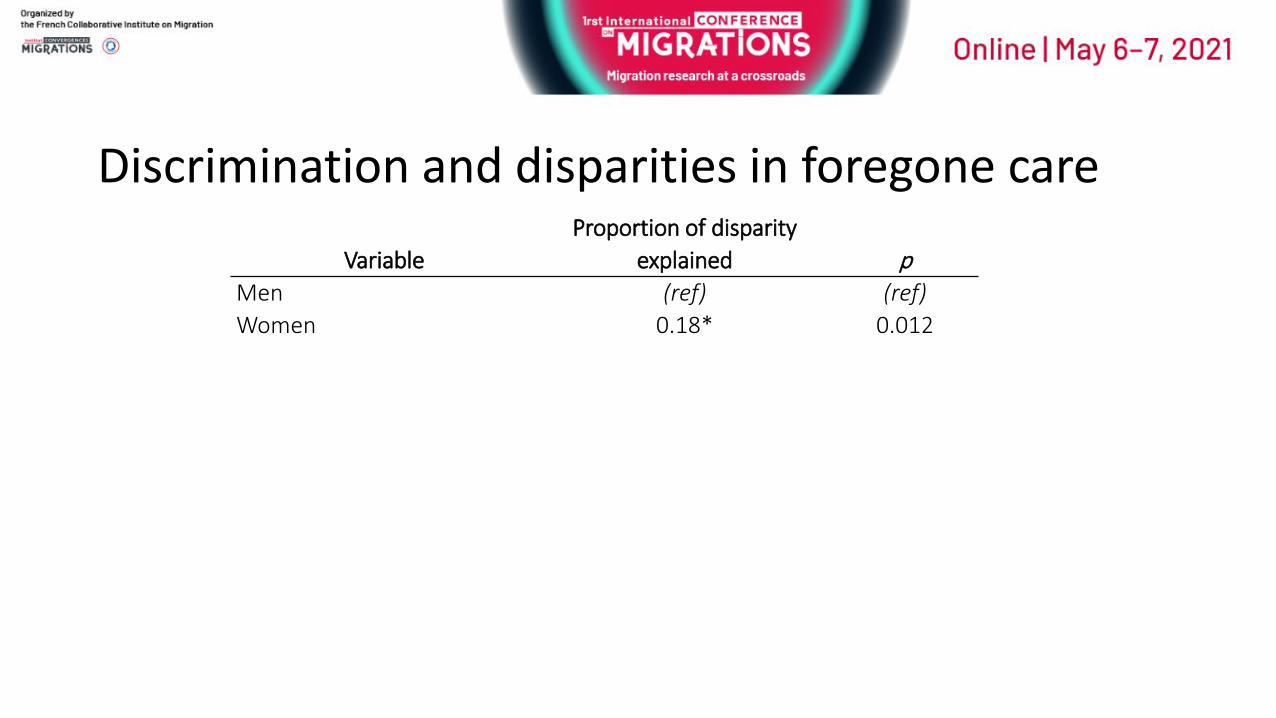
Discrimination and disparities in foregone care
VariableProportion of disparity
explained pMen (ref) (ref)Women 0.18* 0.012
Native (ref) (ref)2nd Generation 0.06* 0.036
Metro France (ref) (ref)Overseas France 0.15* 0.037Africa 0.22*** <0.001Mixed 0.01 0.837
Christian (ref) (ref)Muslim 0.24*** <0.001
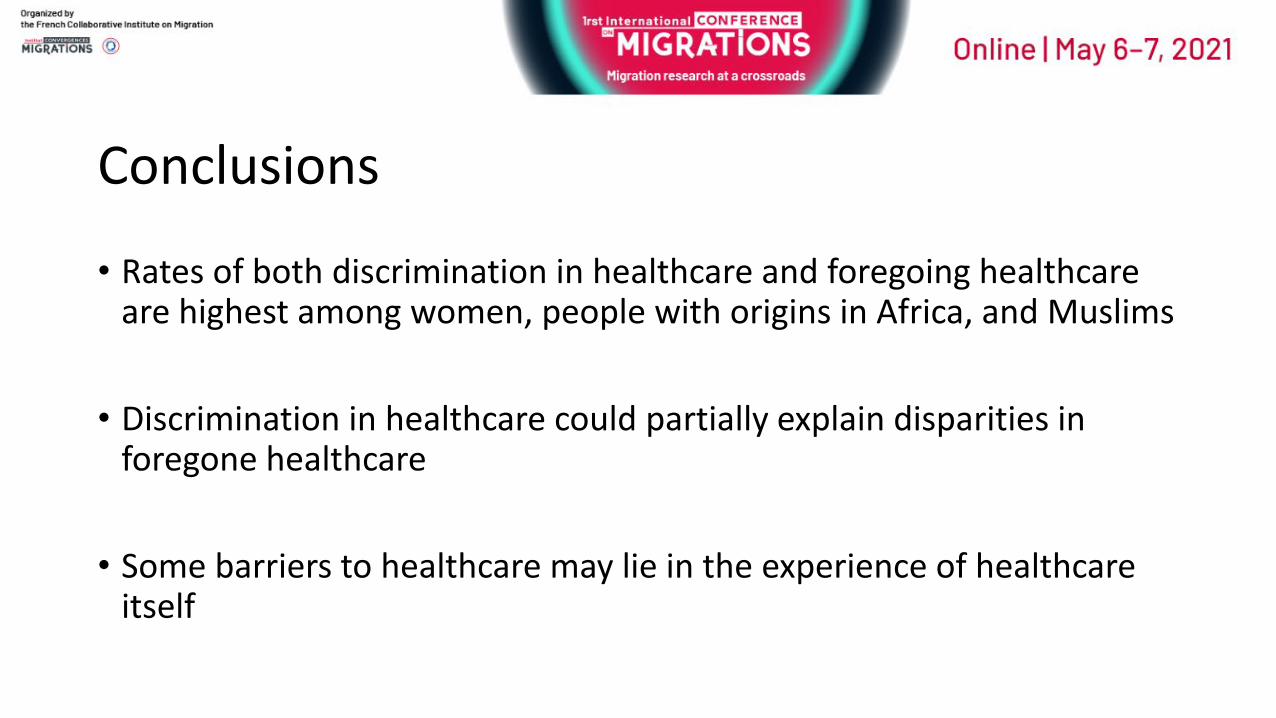
Conclusions
• Rates of both discrimination in healthcare and foregoing healthcare are highest among women, people with origins in Africa, and Muslims
• Discrimination in healthcare could partially explain disparities in foregone healthcare
• Some barriers to healthcare may lie in the experience of healthcare itself
Learn more
Rivenbark, J. G., & Ichou, M. (2020). Discrimination in healthcare as a barrier to care: experiences of socially disadvantaged populations in France from a nationally representative survey. BMC Public Health, 20(31), 1-10.
https://bmcpublichealth.biomedcentral.com/articles/10.1186/s12889-019-8124-z

What next?
• The new edition of the TeO survey has many more questions on health
• It will be available to researchers by mid 2022 -https://teo.site.ined.fr/en/
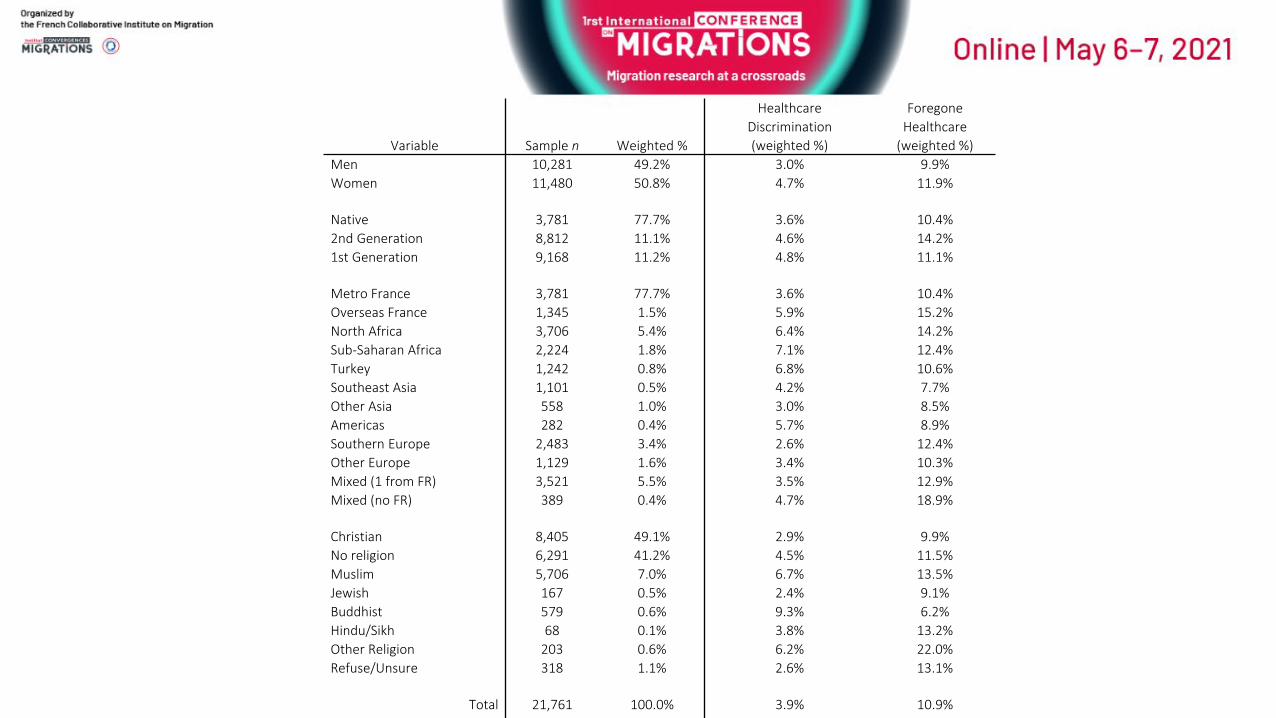
Variable Sample n Weighted %
Healthcare Discrimination (weighted %)
Foregone Healthcare
(weighted %)Men 10,281 49.2% 3.0% 9.9%Women 11,480 50.8% 4.7% 11.9%
Native 3,781 77.7% 3.6% 10.4%2nd Generation 8,812 11.1% 4.6% 14.2%1st Generation 9,168 11.2% 4.8% 11.1%
Metro France 3,781 77.7% 3.6% 10.4%Overseas France 1,345 1.5% 5.9% 15.2%North Africa 3,706 5.4% 6.4% 14.2%Sub-Saharan Africa 2,224 1.8% 7.1% 12.4%Turkey 1,242 0.8% 6.8% 10.6%Southeast Asia 1,101 0.5% 4.2% 7.7%Other Asia 558 1.0% 3.0% 8.5%Americas 282 0.4% 5.7% 8.9%Southern Europe 2,483 3.4% 2.6% 12.4%Other Europe 1,129 1.6% 3.4% 10.3%Mixed (1 from FR) 3,521 5.5% 3.5% 12.9%Mixed (no FR) 389 0.4% 4.7% 18.9%
Christian 8,405 49.1% 2.9% 9.9%No religion 6,291 41.2% 4.5% 11.5%Muslim 5,706 7.0% 6.7% 13.5%Jewish 167 0.5% 2.4% 9.1%Buddhist 579 0.6% 9.3% 6.2%Hindu/Sikh 68 0.1% 3.8% 13.2%Other Religion 203 0.6% 6.2% 22.0%Refuse/Unsure 318 1.1% 2.6% 13.1%
Total 21,761 100.0% 3.9% 10.9%