Embed Size (px)
Citation preview
Page 2
Disclosure Statement
This presentation and the accompanying slides (the “Presentation”) which have been prepared by
Samsonite International S.A. (“Samsonite” or the “Company”) do not constitute any offer or invitation to
purchase or subscribe for any securities, and shall not form the basis for or be relied on in connection
with any contract or binding commitment whatsoever. This Presentation has been prepared by the
Company based on information and data which the Company considers reliable, but the Company
makes no representation or warranty, express or implied, whatsoever, on the truth, accuracy,
completeness, fairness and reasonableness of the contents of this Presentation. This Presentation
may not be all-inclusive and may not contain all of the information that you may consider material.
Any liability in respect of the contents of or any omission from this Presentation is expressly excluded.
Certain matters discussed in this presentation may contain statements regarding the Company’s
market opportunity and business prospects that are individually and collectively forward-looking
statements. Such forward-looking statements are not guarantees of future performance and are
subject to known and unknown risks, uncertainties and assumptions that are difficult to predict. The
Company’s actual results, levels of activity, performance or achievements could differ materially and
adversely from results expressed in or implied by this Presentation, including, amongst others:
whether the Company can successfully penetrate new markets and the degree to which the Company
gains traction in these new markets; the sustainability of recent growth rates; the anticipation of the
growth of certain market segments; the positioning of the Company’s products in those segments; the
competitive environment; and general market conditions. The Company is not responsible for any
forward-looking statements and projections made by third parties included in this Presentation.
Page 3
Agenda
Results Highlights
Business Overview
Financial Overview
Outlook and Strategy for 2015
Q&A
Page 4
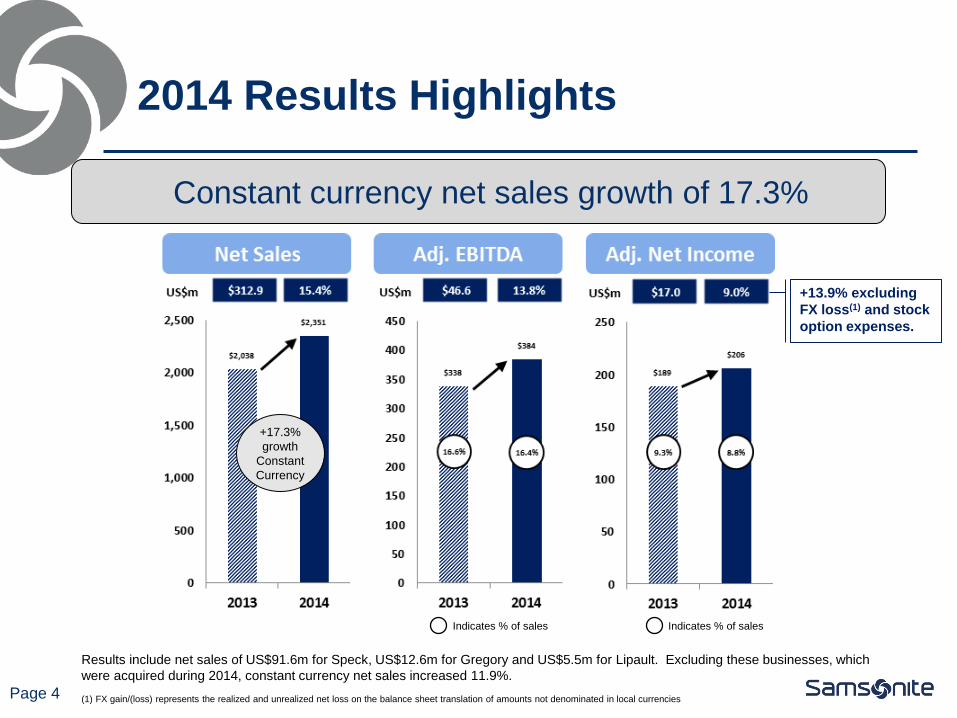
2014 Results Highlights
Results include net sales of US$91.6m for Speck, US$12.6m for Gregory and US$5.5m for Lipault. Excluding these businesses, which
were acquired during 2014, constant currency net sales increased 11.9%.
Indicates % of sales Indicates % of sales
+17.3%
growth
Constant
Currency
Constant currency net sales growth of 17.3%
+13.9% excluding
FX loss(1) and stock
option expenses.
(1) FX gain/(loss) represents the realized and unrealized net loss on the balance sheet translation of amounts not denominated in local currencies

Page 5
Key Financial Highlights
Net Sales:
Net sales increased by 17.3% on a constant currency basis to a
record US$2,351 million.
Currency fluctuation had a negative impact of approximately
US$40 million on year-over-year sales, driven mostly by the
devaluation of the Chilean Peso (US$8.7 million), Russian
Ruble (US$7.2 million), Japanese Yen (US$7.1 million), India
Rupee (US$5.9 million) and Australian Dollar (US$3.1 million) to
the USD.
Excluding the net sales from 2014 acquisitions of Speck
(US$91.6 million), Gregory (US$12.6 million) and Lipault
(US$5.5 million), growth in net sales was US$203.2 million or
10.0%, or 11.9% on a constant currency basis.
Gross Margin:
Gross margin increased 14.3%. As a percentage of sales,
gross margin decreased 50bps due largely to the impact of
acquisitions, mainly Speck which has margins similar to US
Wholesale business, and lower gross margin percent in Latin
America as we transitioned Brazil to a direct sales model, partly
offset by higher gross margin percent in Asia and Europe.
Excluding acquisitions, gross margin as a percentage of sales
increased by 30bp to 53.7%.
+17.3%
growth
Constant
Currency
Indicates % of sales

Page 6
Key Financial Highlights
Adjusted EBITDA:
Adjusted EBITDA is up 13.8% driven by sales growth in all
regions. Adjusted EBITDA margin decrease is due mainly to:
Impact of acquisitions (approximately -40bp);
Temporary reduction in Latin America’s Adjusted EBITDA
margin from reduced gross margins and ramp up of Brazil
operations;
Excluding acquisitions, Adjusted EBITDA margin increased by
approximately 20bp to 16.8%.
Adjusted Net Income:
Excluding FX loss(1) and stock compensation expense, Adjusted
Net Income is up 13.9% from 2013 and, as a percentage of
sales, is down 20bp from 9.7% in 2013 to 9.5% in 2014 due
largely to the impact of acquisitions.
Effective tax rate increase from 27.0% in 2013 to 27.3% in
2014.
Indicates % of sales (1) FX gain/(loss) represents the realized and unrealized net loss on the balance sheet translation of amounts
not denominated in local currencies
Page 7
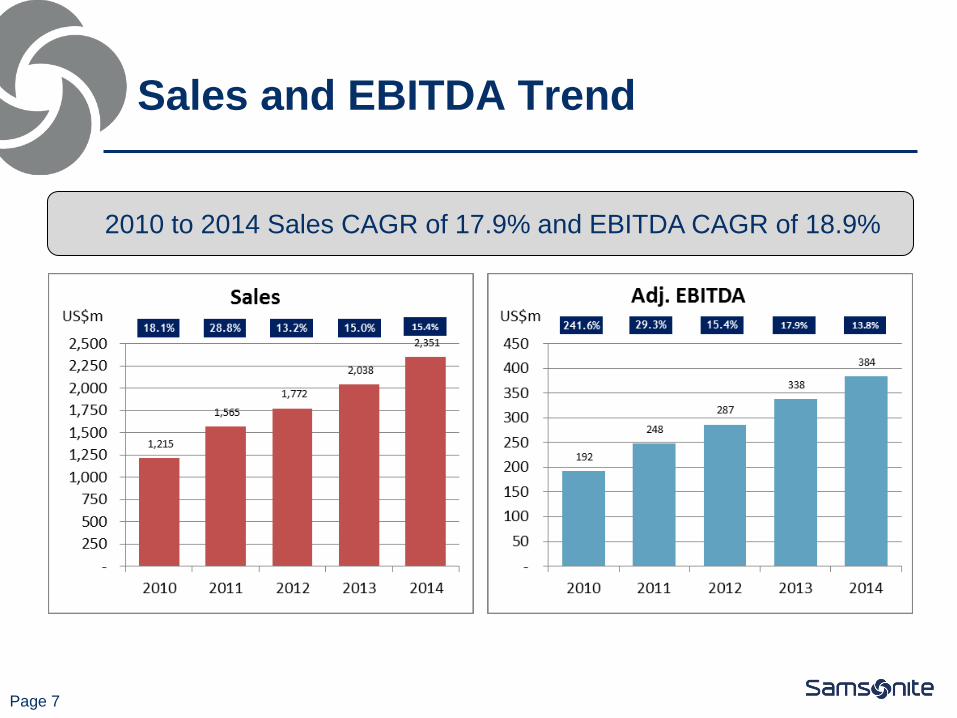
Sales and EBITDA Trend
2010 to 2014 Sales CAGR of 17.9% and EBITDA CAGR of 18.9%
Page 8
Agenda
Results Highlights
Business Overview
Financial Overview
Outlook and Strategy for 2015
Q&A
Page 9
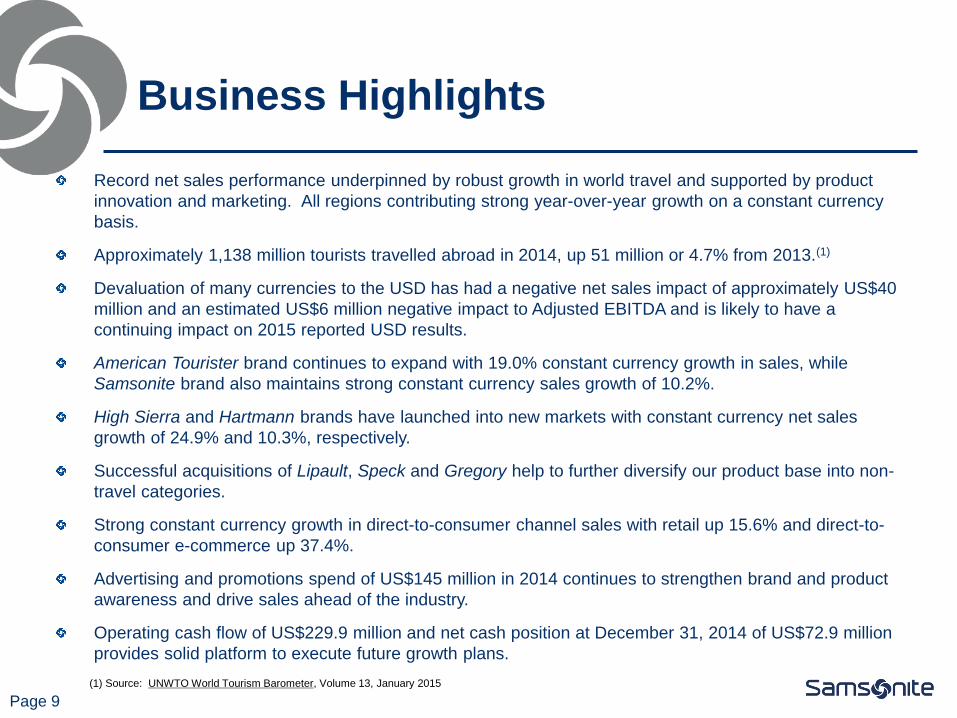
Record net sales performance underpinned by robust growth in world travel and supported by product
innovation and marketing. All regions contributing strong year-over-year growth on a constant currency
basis.
Approximately 1,138 million tourists travelled abroad in 2014, up 51 million or 4.7% from 2013.(1)
Devaluation of many currencies to the USD has had a negative net sales impact of approximately US$40
million and an estimated US$6 million negative impact to Adjusted EBITDA and is likely to have a
continuing impact on 2015 reported USD results.
American Tourister brand continues to expand with 19.0% constant currency growth in sales, while
Samsonite brand also maintains strong constant currency sales growth of 10.2%.
High Sierra and Hartmann brands have launched into new markets with constant currency net sales
growth of 24.9% and 10.3%, respectively.
Successful acquisitions of Lipault, Speck and Gregory help to further diversify our product base into non-
travel categories.
Strong constant currency growth in direct-to-consumer channel sales with retail up 15.6% and direct-to-
consumer e-commerce up 37.4%.
Advertising and promotions spend of US$145 million in 2014 continues to strengthen brand and product
awareness and drive sales ahead of the industry.
Operating cash flow of US$229.9 million and net cash position at December 31, 2014 of US$72.9 million
provides solid platform to execute future growth plans.
Business Highlights
(1) Source: UNWTO World Tourism Barometer, Volume 13, January 2015
Page 10
Strong Sales Growth in All Regions
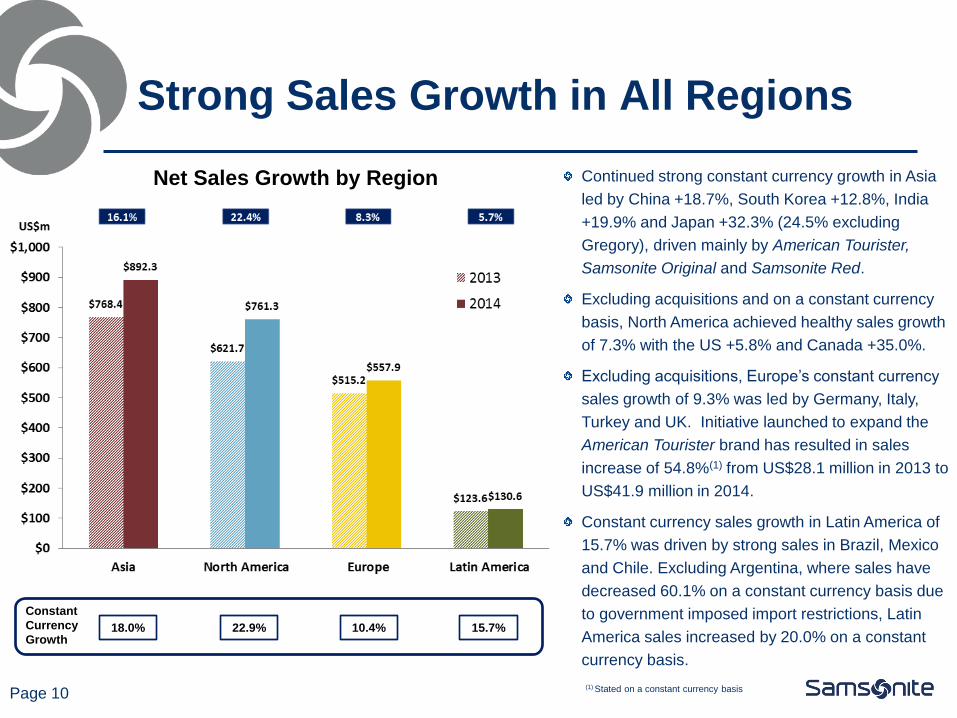
Net Sales Growth by Region Continued strong constant currency growth in Asia
led by China +18.7%, South Korea +12.8%, India
+19.9% and Japan +32.3% (24.5% excluding
Gregory), driven mainly by American Tourister,
Samsonite Original and Samsonite Red.
Excluding acquisitions and on a constant currency
basis, North America achieved healthy sales growth
of 7.3% with the US +5.8% and Canada +35.0%.
Excluding acquisitions, Europe’s constant currency
sales growth of 9.3% was led by Germany, Italy,
Turkey and UK. Initiative launched to expand the
American Tourister brand has resulted in sales
increase of 54.8%(1) from US$28.1 million in 2013 to
US$41.9 million in 2014.
Constant currency sales growth in Latin America of
15.7% was driven by strong sales in Brazil, Mexico
and Chile. Excluding Argentina, where sales have
decreased 60.1% on a constant currency basis due
to government imposed import restrictions, Latin
America sales increased by 20.0% on a constant
currency basis.
Constant
Currency
Growth 18.0% 22.9% 10.4% 15.7%
(1) Stated on a constant currency basis
Asia – Continued strong growth and profitability
led by China, South Korea, India and Japan(1)
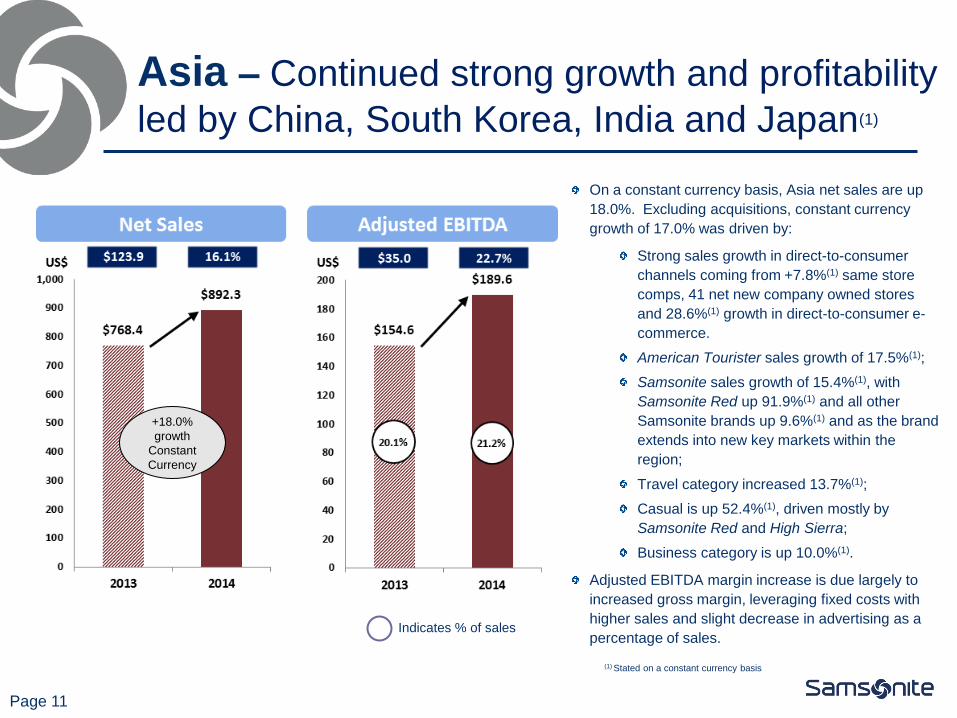
On a constant currency basis, Asia net sales are up
18.0%. Excluding acquisitions, constant currency
growth of 17.0% was driven by:
Strong sales growth in direct-to-consumer
channels coming from +7.8%(1) same store
comps, 41 net new company owned stores
and 28.6%(1) growth in direct-to-consumer e-
commerce.
American Tourister sales growth of 17.5%(1);
Samsonite sales growth of 15.4%(1), with
Samsonite Red up 91.9%(1) and all other
Samsonite brands up 9.6%(1) and as the brand
extends into new key markets within the
region;
Travel category increased 13.7%(1);
Casual is up 52.4%(1), driven mostly by
Samsonite Red and High Sierra;
Business category is up 10.0%(1).
Adjusted EBITDA margin increase is due largely to
increased gross margin, leveraging fixed costs with
higher sales and slight decrease in advertising as a
percentage of sales.
Page 11
+18.0%
growth
Constant
Currency
Indicates % of sales
(1) Stated on a constant currency basis

Key Asia Markets - Continued strong growth
in all key markets(1)
Page 12
* Includes Macau
(1) Stated on a constant currency basis
Strong China sales growth of 18.7%(1) driven by
American Tourister, Samsonite Original and
Samsonite Red. Solid growth in the direct-to-
consumer channels is the result of 6.7%(1) retail
comps, 13 net new stores and direct-to-consumer e-
commerce growth of 75.7%(1). Additionally, wholesale
growth of 17.1%(1) is due largely to increases in TV
home shopping and B2B.
South Korea sales growth of 12.8%(1) is driven by the
continued strong growth of the Samsonite Red brand,
up 66.9%(1) to US$31.2 million, as well as Samsonite
Original, American Tourister and High Sierra.
Sales growth in India of 19.9%(1) is driven by the
continued success of American Tourister and the
introduction of High Sierra, which increased from
US$0.5 million in 2013 to US$4.6 million in 2014.
Japan sales are up 32.3%(1). Excluding the acquisition
of Gregory, sales growth of 24.5%(1) is led by strong
growth of Samsonite and American Tourister.
Hong Kong* sales growth of 12.2%(1) is led by growth
of Samsonite Red and the acquisition of Gregory.
Sales experienced a slowdown at the end of the year
due to protesters.
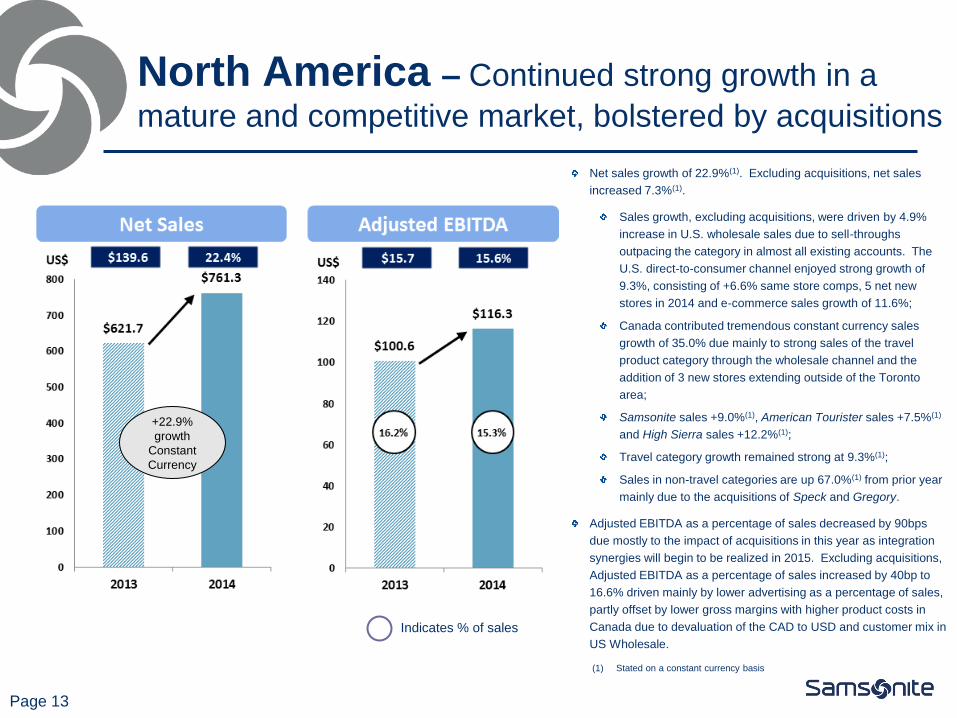
Net sales growth of 22.9%(1). Excluding acquisitions, net sales
increased 7.3%(1).
Sales growth, excluding acquisitions, were driven by 4.9%
increase in U.S. wholesale sales due to sell-throughs
outpacing the category in almost all existing accounts. The
U.S. direct-to-consumer channel enjoyed strong growth of
9.3%, consisting of +6.6% same store comps, 5 net new
stores in 2014 and e-commerce sales growth of 11.6%;
Canada contributed tremendous constant currency sales
growth of 35.0% due mainly to strong sales of the travel
product category through the wholesale channel and the
addition of 3 new stores extending outside of the Toronto
area;
Samsonite sales +9.0%(1), American Tourister sales +7.5%(1)
and High Sierra sales +12.2%(1);
Travel category growth remained strong at 9.3%(1);
Sales in non-travel categories are up 67.0%(1) from prior year
mainly due to the acquisitions of Speck and Gregory.
Adjusted EBITDA as a percentage of sales decreased by 90bps
due mostly to the impact of acquisitions in this year as integration
synergies will begin to be realized in 2015. Excluding acquisitions,
Adjusted EBITDA as a percentage of sales increased by 40bp to
16.6% driven mainly by lower advertising as a percentage of sales,
partly offset by lower gross margins with higher product costs in
Canada due to devaluation of the CAD to USD and customer mix in
US Wholesale.
North America – Continued strong growth in a
mature and competitive market, bolstered by acquisitions
Page 13
+22.9%
growth
Constant
Currency
Indicates % of sales
(1) Stated on a constant currency basis
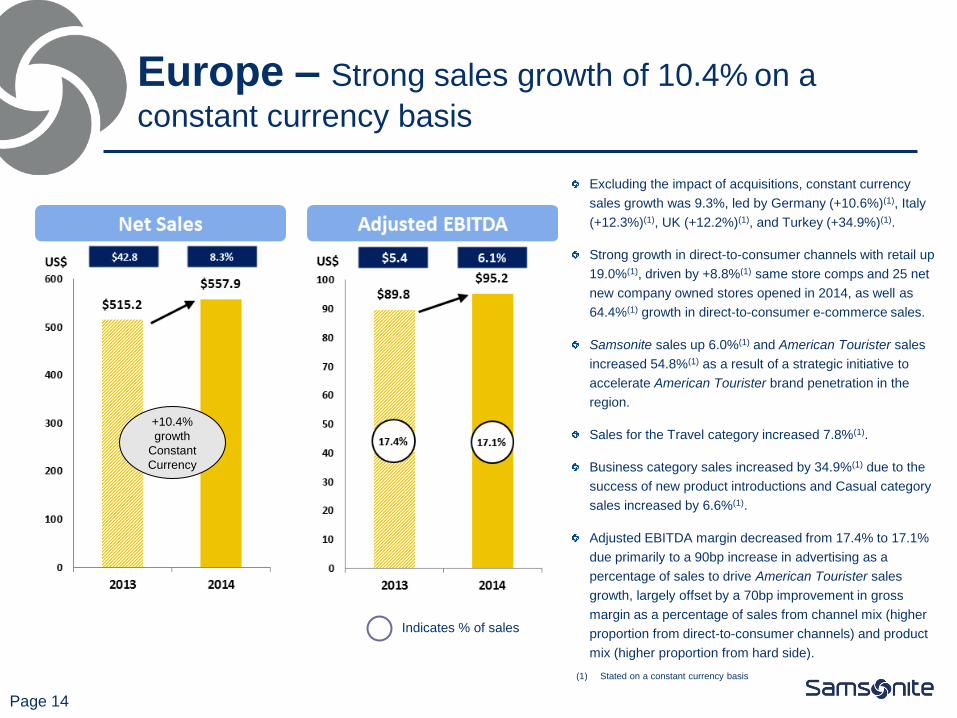
Europe – Strong sales growth of 10.4% on a
constant currency basis
Excluding the impact of acquisitions, constant currency
sales growth was 9.3%, led by Germany (+10.6%)(1), Italy
(+12.3%)(1), UK (+12.2%)(1), and Turkey (+34.9%)(1).
Strong growth in direct-to-consumer channels with retail up
19.0%(1), driven by +8.8%(1) same store comps and 25 net
new company owned stores opened in 2014, as well as
64.4%(1) growth in direct-to-consumer e-commerce sales.
Samsonite sales up 6.0%(1) and American Tourister sales
increased 54.8%(1) as a result of a strategic initiative to
accelerate American Tourister brand penetration in the
region.
Sales for the Travel category increased 7.8%(1).
Business category sales increased by 34.9%(1) due to the
success of new product introductions and Casual category
sales increased by 6.6%(1).
Adjusted EBITDA margin decreased from 17.4% to 17.1%
due primarily to a 90bp increase in advertising as a
percentage of sales to drive American Tourister sales
growth, largely offset by a 70bp improvement in gross
margin as a percentage of sales from channel mix (higher
proportion from direct-to-consumer channels) and product
mix (higher proportion from hard side).
Page 14
+10.4%
growth
Constant
Currency
(1) Stated on a constant currency basis
Indicates % of sales
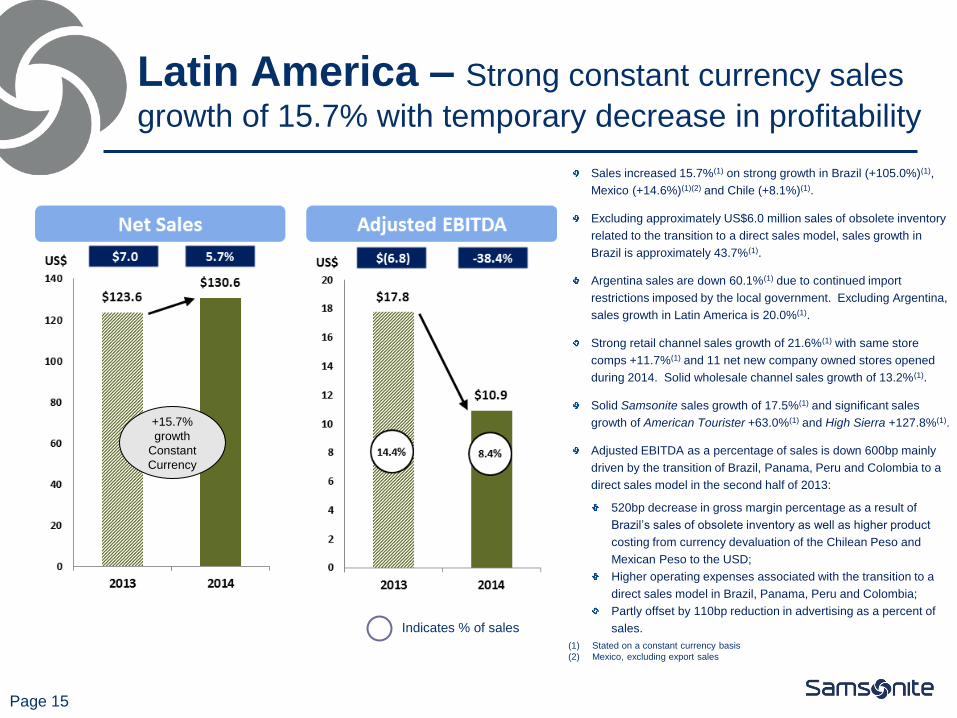
Sales increased 15.7%(1) on strong growth in Brazil (+105.0%)(1),
Mexico (+14.6%)(1)(2) and Chile (+8.1%)(1).
Excluding approximately US$6.0 million sales of obsolete inventory
related to the transition to a direct sales model, sales growth in
Brazil is approximately 43.7%(1).
Argentina sales are down 60.1%(1) due to continued import
restrictions imposed by the local government. Excluding Argentina,
sales growth in Latin America is 20.0%(1).
Strong retail channel sales growth of 21.6%(1) with same store
comps +11.7%(1) and 11 net new company owned stores opened
during 2014. Solid wholesale channel sales growth of 13.2%(1).
Solid Samsonite sales growth of 17.5%(1) and significant sales
growth of American Tourister +63.0%(1) and High Sierra +127.8%(1).
Adjusted EBITDA as a percentage of sales is down 600bp mainly
driven by the transition of Brazil, Panama, Peru and Colombia to a
direct sales model in the second half of 2013:
520bp decrease in gross margin percentage as a result of
Brazil’s sales of obsolete inventory as well as higher product
costing from currency devaluation of the Chilean Peso and
Mexican Peso to the USD;
Higher operating expenses associated with the transition to a
direct sales model in Brazil, Panama, Peru and Colombia;
Partly offset by 110bp reduction in advertising as a percent of
sales.
Latin America – Strong constant currency sales
growth of 15.7% with temporary decrease in profitability
Page 15
+15.7%
growth
Constant
Currency
(1) Stated on a constant currency basis
(2) Mexico, excluding export sales
Indicates % of sales

Page 16
Sales in Key Markets
Strong constant currency growth in all key markets
* Includes Macau
Page 17
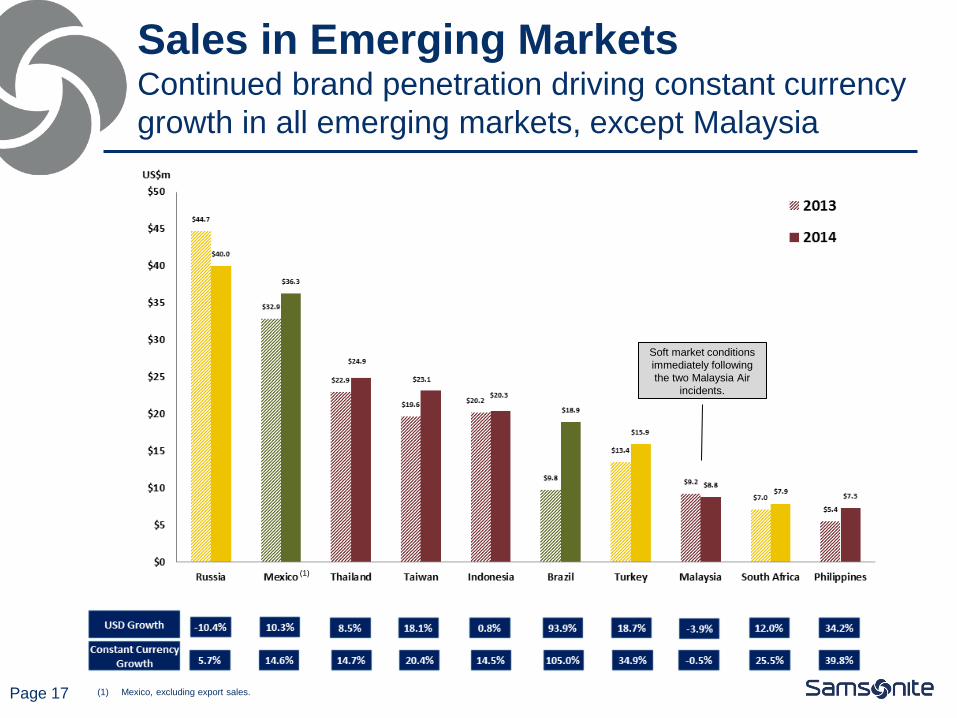
Sales in Emerging Markets
Continued brand penetration driving constant currency
growth in all emerging markets, except Malaysia
Soft market conditions
immediately following
the two Malaysia Air
incidents.
(1) Mexico, excluding export sales.
(1)
Constant
Currency
Growth 10.2% 19.0% NA 24.9%
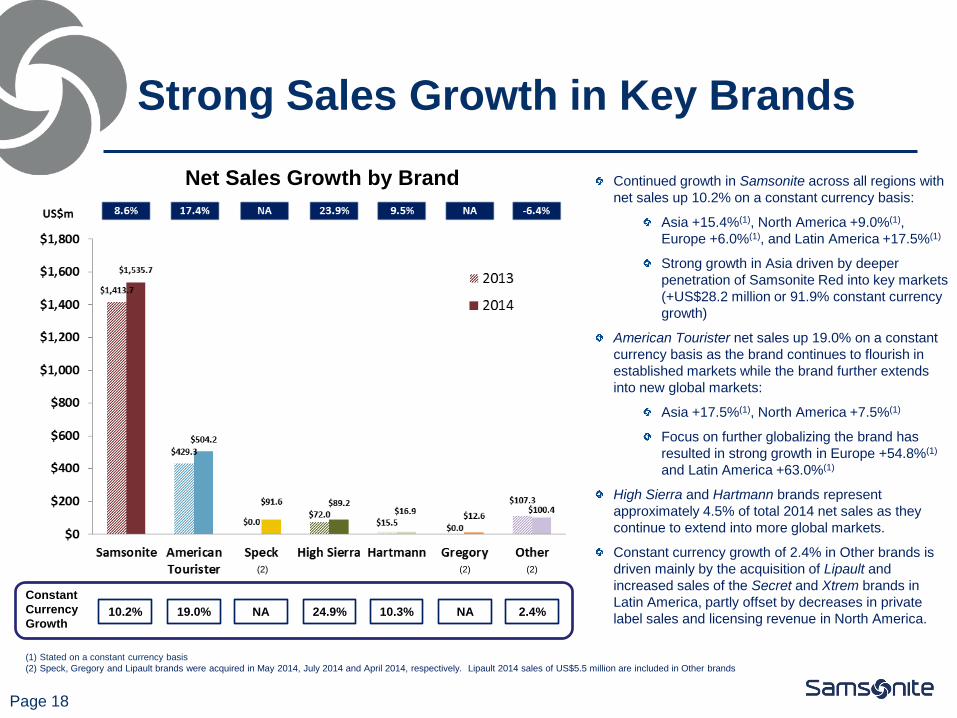
Strong Sales Growth in Key Brands
Page 18
Net Sales Growth by Brand Continued growth in Samsonite across all regions with
net sales up 10.2% on a constant currency basis:
Asia +15.4%(1), North America +9.0%(1),
Europe +6.0%(1), and Latin America +17.5%(1)
Strong growth in Asia driven by deeper
penetration of Samsonite Red into key markets
(+US$28.2 million or 91.9% constant currency
growth)
American Tourister net sales up 19.0% on a constant
currency basis as the brand continues to flourish in
established markets while the brand further extends
into new global markets:
Asia +17.5%(1), North America +7.5%(1)
Focus on further globalizing the brand has
resulted in strong growth in Europe +54.8%(1)
and Latin America +63.0%(1)
High Sierra and Hartmann brands represent
approximately 4.5% of total 2014 net sales as they
continue to extend into more global markets.
Constant currency growth of 2.4% in Other brands is
driven mainly by the acquisition of Lipault and
increased sales of the Secret and Xtrem brands in
Latin America, partly offset by decreases in private
label sales and licensing revenue in North America.
(1) Stated on a constant currency basis
(2) Speck, Gregory and Lipault brands were acquired in May 2014, July 2014 and April 2014, respectively. Lipault 2014 sales of US$5.5 million are included in Other brands
10.3% NA 2.4%
(2) (2) (2)
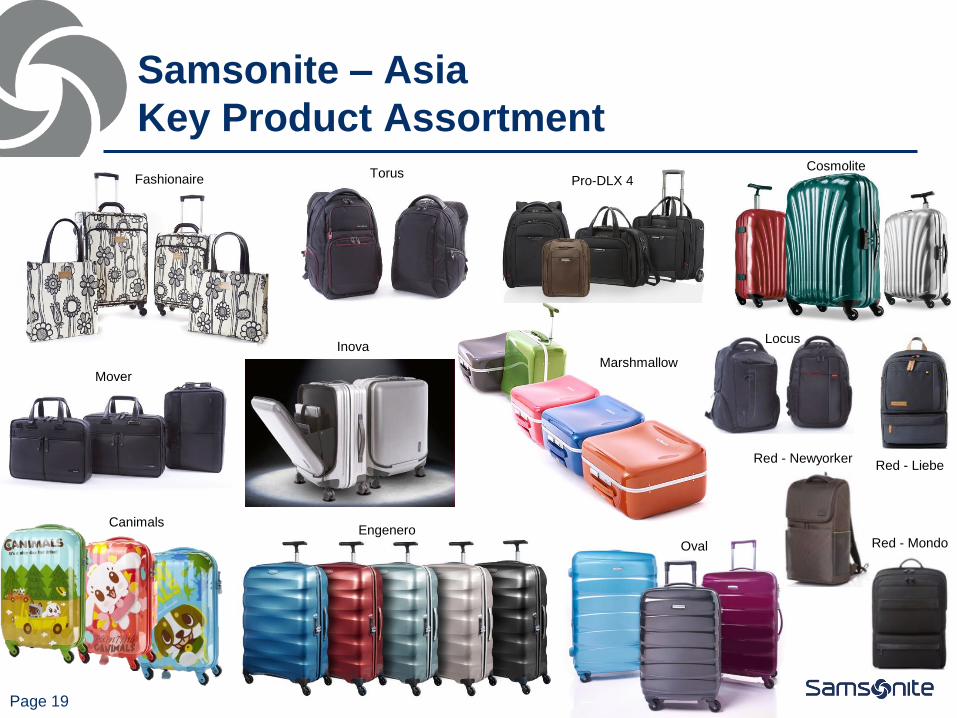
Samsonite – Asia
Key Product Assortment
Page 19
Fashionaire Cosmolite
Inova
Marshmallow
Oval
Engenero Canimals
Torus Pro-DLX 4
Mover
Red - Mondo
Red - Newyorker Red - Liebe
Locus
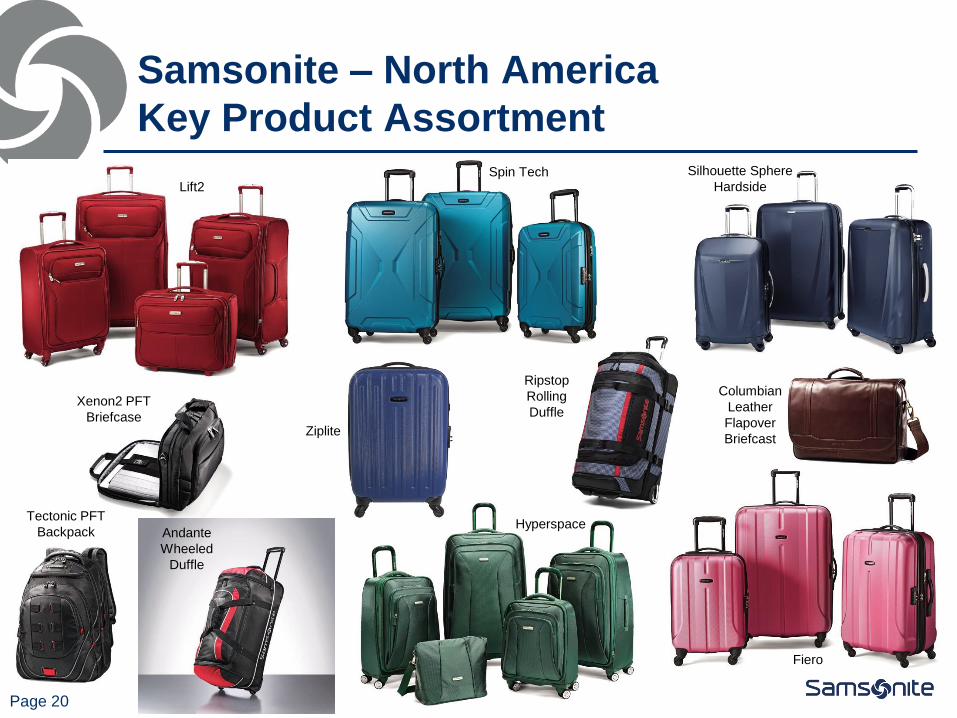
Samsonite – North America
Key Product Assortment
Page 20
Lift2
Hyperspace
Ziplite
Fiero
Spin Tech Silhouette Sphere
Hardside
Columbian
Leather
Flapover
Briefcast
Tectonic PFT
Backpack
Xenon2 PFT
Briefcase
Ripstop
Rolling
Duffle
Andante
Wheeled
Duffle

Samsonite – Europe
New Product Assortment
Page 21
Neopulse
B-Lite
Lite-Shock
S’Cure Spark
Cosmolite
2.0
GT Supreme
Backpack
GT Supreme
Bailhandle
Urban Arc
Backpack
Disney
licensed
products

Samsonite – Latin America
Key Product Assortment
Page 22
Fiero
Xenon II Metropolis Torus
Locus
Jumbo
Ember
Firelite
Puzzle Cosmolite
Glide
I-Lite B-Lite Silhouette
Sphere
Lightcase

American Tourister – Asia
Key Product Assortment
Page 23
HS MV+ Cube Pop
Spot-lite IV
Bon Air
Sky
AT Speedair
Citi-Pro Backpack
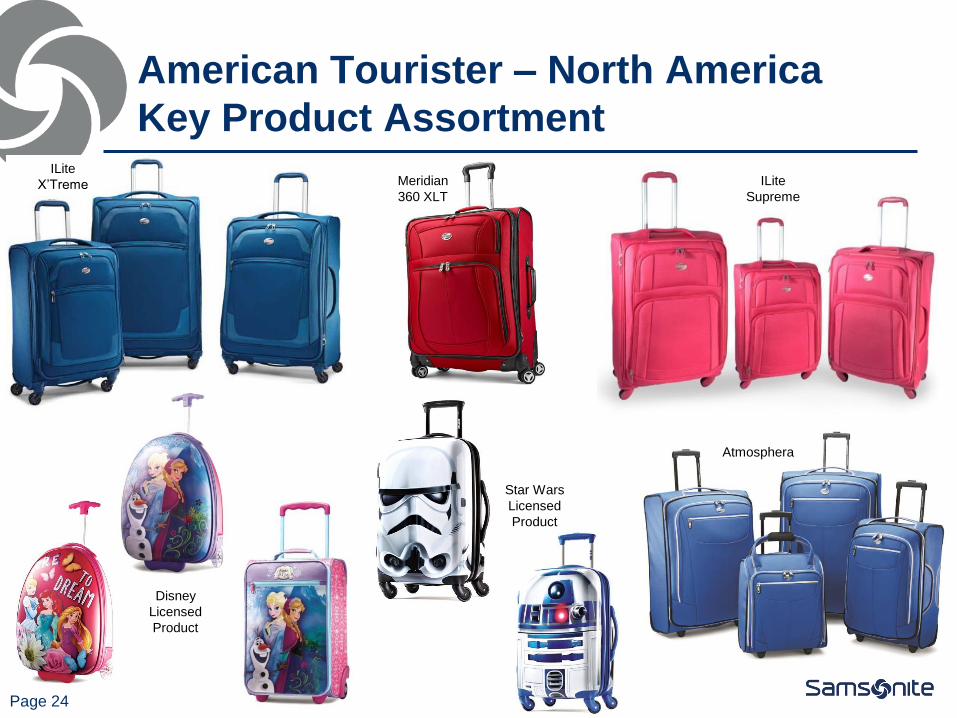
American Tourister – North America
Key Product Assortment
Page 24
Meridian
360 XLT
Atmosphera
ILite
Supreme
ILite
X’Treme
Disney
Licensed
Product
Star Wars
Licensed
Product
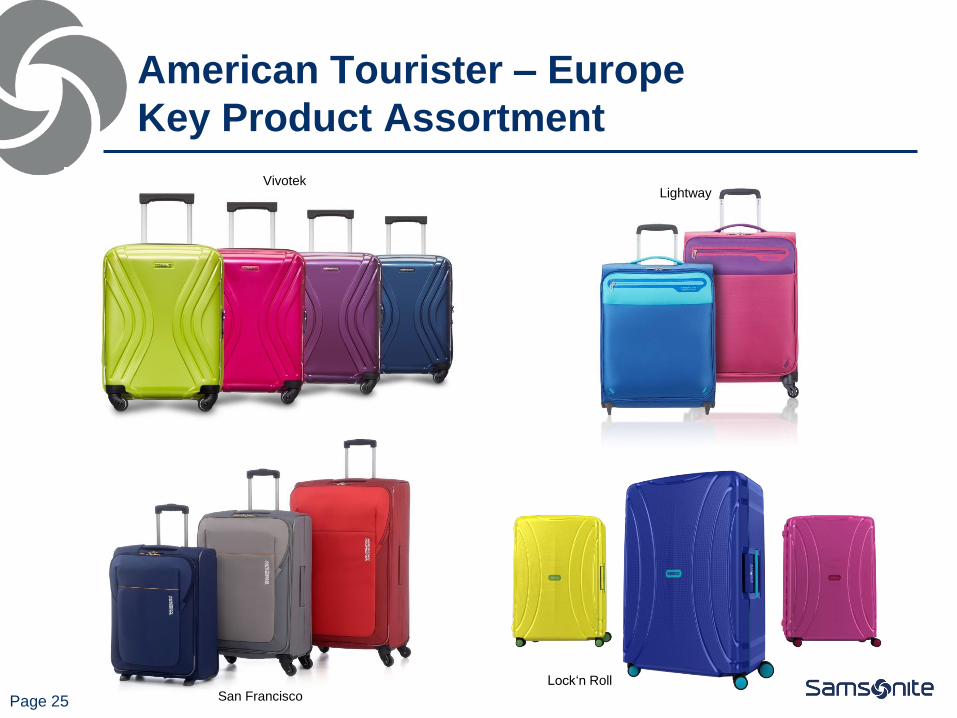
American Tourister – Europe
Key Product Assortment
Page 25
Lock‘n Roll
San Francisco
Vivotek Lightway
2014 Acquisitions
Page 26
Lipault is a youthful, vibrant and chic French luggage brand known for its
functional and fashionable designs.
Acquired all of the outstanding capital stock on April 1, 2014 for approximately
€20 million in cash (approximately US$28 million).
Extends the Company’s brand portfolio to engage with a wider base of
fashionable female consumers through its signature Parisian style and vibrant
colors.
Strategy is to utilize Samsonite’s well-established distribution network and
extensive retail presence to expand Lipault’s respected brand in France and
into additional markets in Europe (historically, over 90% of Lipault’s sales
came from France) while evaluating opportunities to expand further in Asia
and the Americas.
2014 pro-forma full year net sales of US$7.6 million.
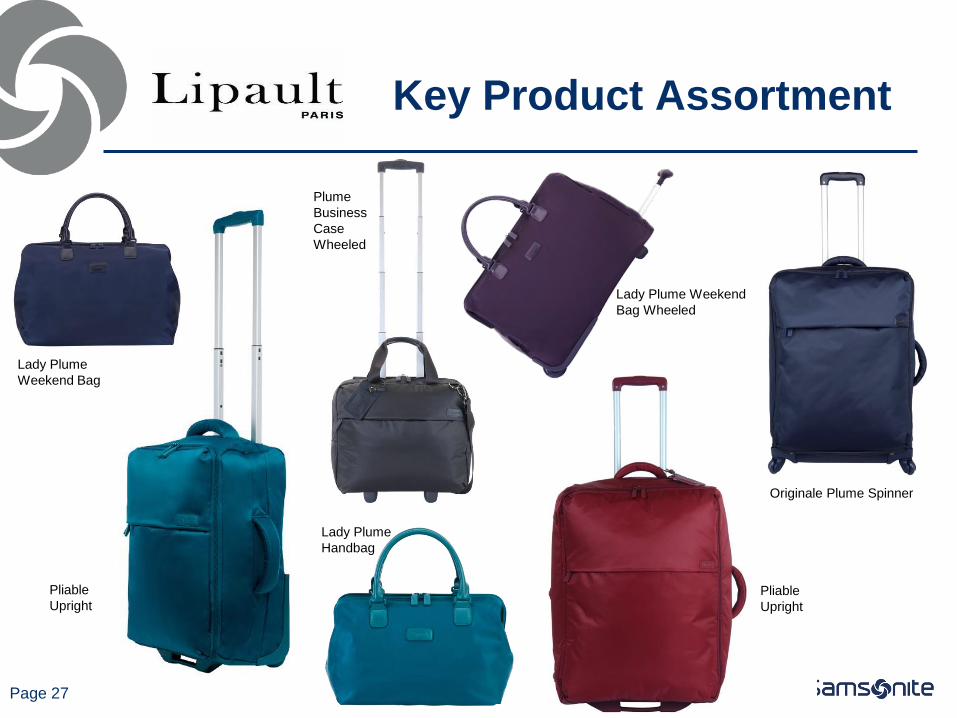
Key Product Assortment
Page 27
Originale Plume Spinner
Plume
Business
Case
Wheeled
Pliable
Upright
Lady Plume
Handbag
Pliable
Upright
Lady Plume Weekend
Bag Wheeled
Lady Plume
Weekend Bag

2014 Acquisitions
Page 28
Speck produces a diverse range of sleek, stylish, and functionally innovative products
that provide superior military-grade protection for mobile devices across multiple brands
and is particularly well-known for its “slim protection” designs such as the iconic
CandyShell “hard-soft” material case – a technology that Speck pioneered.
Acquired all of the outstanding capital stock on May 28, 2014 for approximately US$85
million in cash.
Extends the Company’s brand portfolio beyond its traditional strength in travel luggage
products and provides the Company with a strong brand and product offering resulting
in an immediate foothold in the market for protective cases for smartphones, tablets,
laptops and other personal electronic devices. The market size for phones cases is
estimated to be US$2.3 billion.
Strategy is to utilize Samsonite’s resources, excellence in operations and marketing and
well-established distribution network to further strengthen Speck’s business in the U.S.
and significantly expand the brand’s presence across Asia, Europe and Latin America.
2014 pro-forma full year net sales of US$137.0 million.

Key Product Assortment
Page 29 SeeThru StyleFolio
CandyShell
CARD
CandyShell CandyShell
INKED
CandyShell
GRIP
iGuy
MightyShell
2014 Acquisitions
Page 30
Gregory Mountain Products (“Gregory”) is an iconic technical outdoor backpack brand
that is known as a pioneer in its field and is well-respected by active outdoor and
adventure enthusiasts. Gregory is also a popular brand for lifestyle products in Japan.
The purchase of substantially all of the assets of Gregory was closed July 23, 2014 for
approximately US$84 million in cash.
Extends the Company’s brand portfolio into the premium segment of the outdoor bag
category as a perfect complement to High Sierra, which is a well-known and respected
brand in the mid-market segment.
Gregory's lifestyle products which are widely popular in Japan represents a unique
opportunity to further develop and replicate the success of the premium lifestyle fashion
brand in other key Asian markets.
Strategy is to leverage Samsonite’s marketing, sourcing and well-established
distribution capabilities to further expand Gregory’s business in the U.S. and
significantly grow the Gregory brand internationally.
2014 pro-forma full year net sales of US$31.2 million.
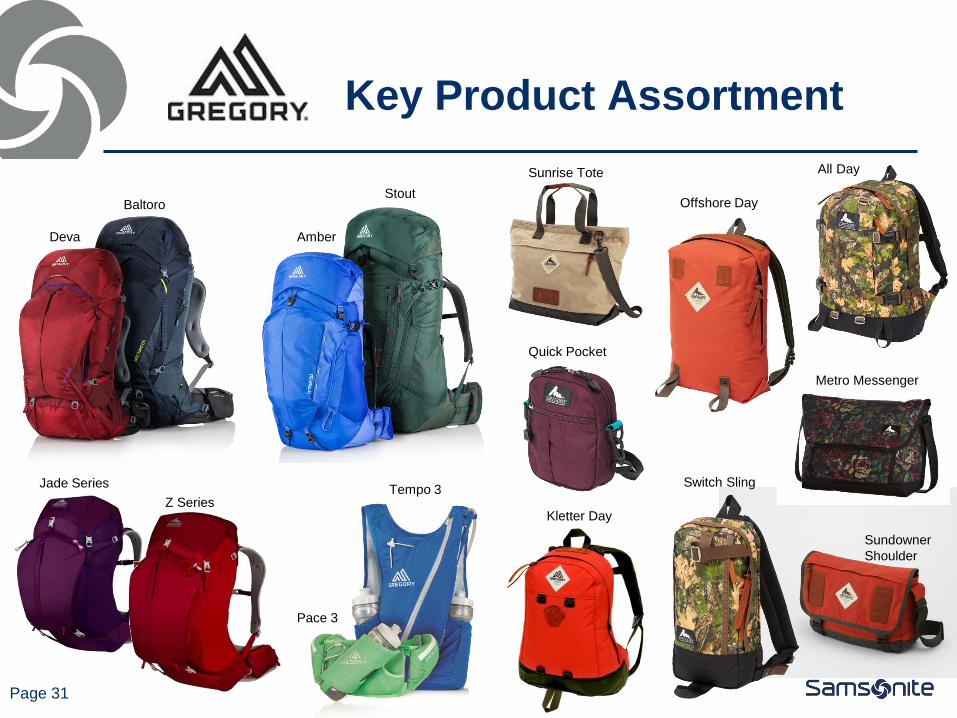
Key Product Assortment
Page 31
All Day
Jade Series
Z Series
Deva
Baltoro
Amber
Stout
Sunrise Tote
Metro Messenger
Pace 3
Tempo 3
Offshore Day
Quick Pocket
Switch Sling
Sundowner
Shoulder
Kletter Day
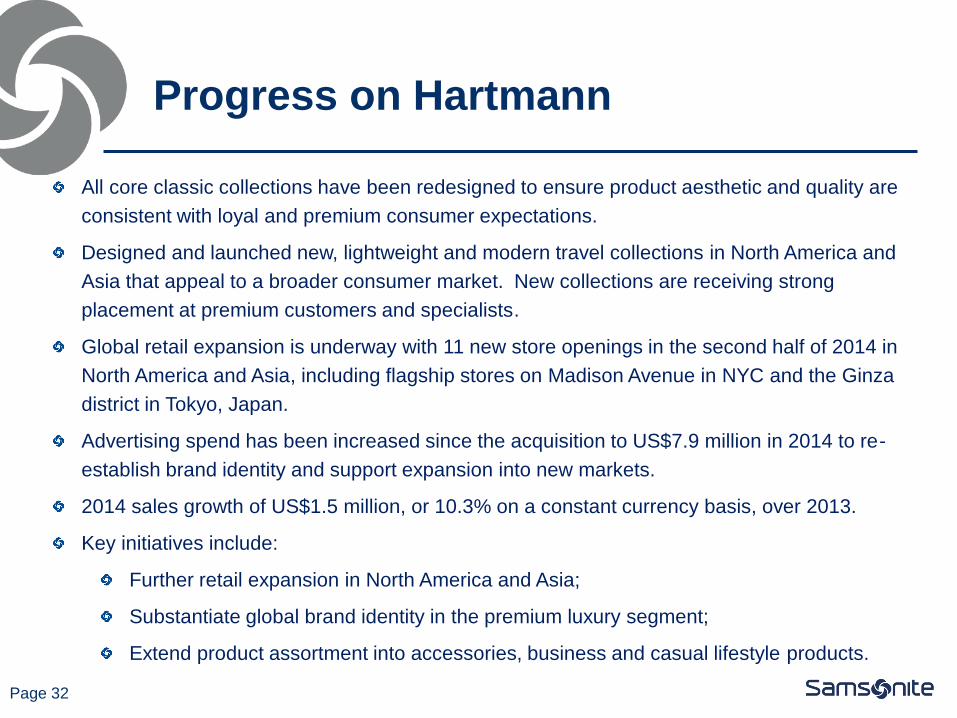
Progress on Hartmann
All core classic collections have been redesigned to ensure product aesthetic and quality are
consistent with loyal and premium consumer expectations.
Designed and launched new, lightweight and modern travel collections in North America and
Asia that appeal to a broader consumer market. New collections are receiving strong
placement at premium customers and specialists.
Global retail expansion is underway with 11 new store openings in the second half of 2014 in
North America and Asia, including flagship stores on Madison Avenue in NYC and the Ginza
district in Tokyo, Japan.
Advertising spend has been increased since the acquisition to US$7.9 million in 2014 to re-
establish brand identity and support expansion into new markets.
2014 sales growth of US$1.5 million, or 10.3% on a constant currency basis, over 2013.
Key initiatives include:
Further retail expansion in North America and Asia;
Substantiate global brand identity in the premium luxury segment;
Extend product assortment into accessories, business and casual lifestyle products.
Page 32
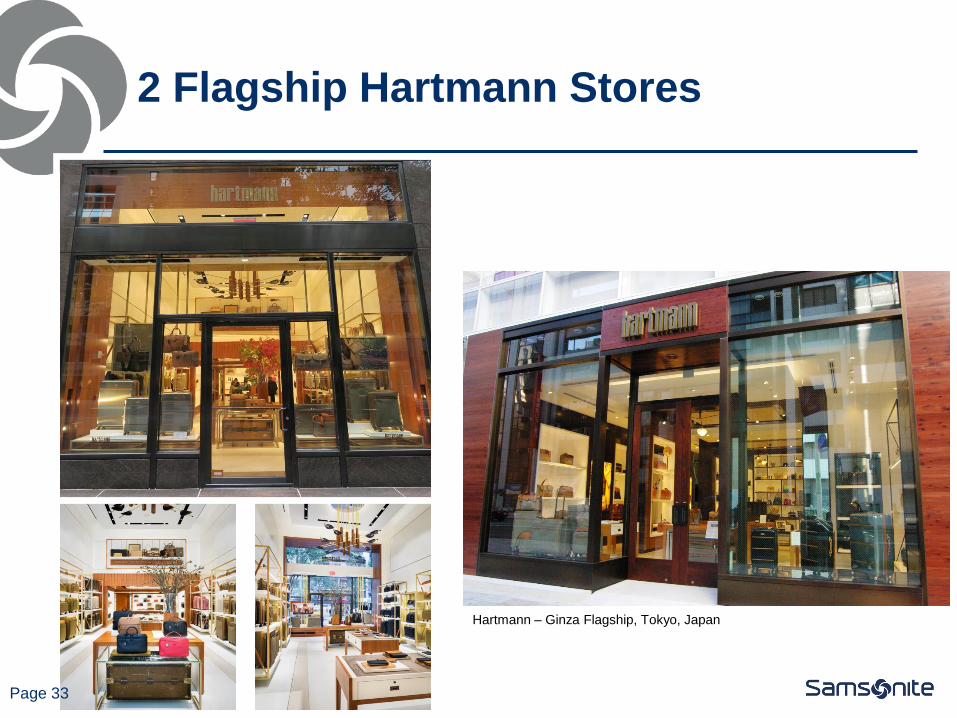
2 Flagship Hartmann Stores
Page 33
Hartmann – Ginza Flagship, Tokyo, Japan
Page 34
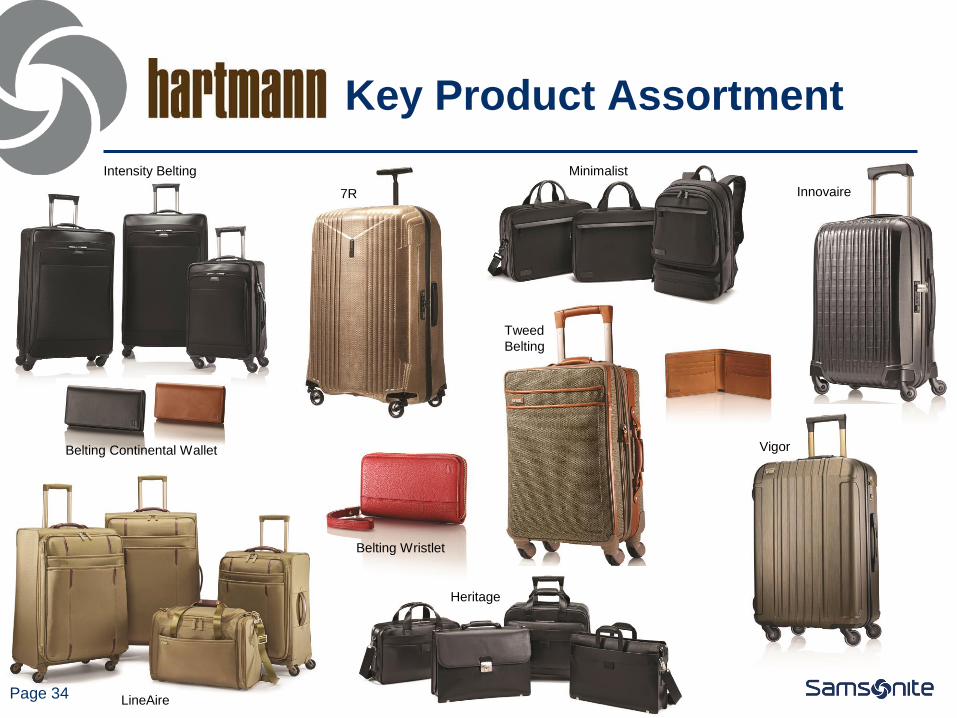
Key Product Assortment
7R
Heritage
Innovaire
LineAire
Minimalist
Vigor
Belting Wristlet
Belting Continental Wallet
Intensity Belting
Tweed
Belting
Progress on High Sierra
Leveraging the brand in North America, Asia and Europe with each region
developing new products consistent with the brand image to meet the needs
of the consumer in each market.
Brand has launched in Asia, where it has grown from US$5.5 million in 2013
to US$11.7 million in 2014 and in Europe, with 2014 sales of US$1.9 million.
Advertising spend has been increased to US$9.9 million in 2014 to enhance
brand awareness and support global expansion.
2014 sales growth of US$17.2 million, or 24.9% on a constant currency basis,
over 2013.
Initiatives include:
Further expansion into Asia and Europe wholesale accounts supported
with additional marketing;
License the brand for other outdoor products and launch apparel.
Page 35

Page 36
Key Product Assortment
Rock (Asia)
UFO (Asia) Wheeled
Duffle
(Asia)
Tactic (Asia)
Classic 2
Hiking Collection
Tech 2
Hiking Collection
Tech Hydration XBT
Collection Lifestyle Collection
Ski Boot Bag
BTS Collection
Ultimate Access 2.0 Wheeled Duffle

Page 37
Strong Sales Growth in Travel and
Casual Product Categories
Net Sales Growth by Product Category Travel remains our largest product category and
traditional strength with all regions contributing
to growth of 10.9%(1).
Casual category net sales rose 25.1%(1) driven
by the acquisition of Gregory and growth of
Samsonite Red in Asia and High Sierra in all
regions.
Net sales in Business category increased by
34.6%(1) (12.1%(1), excluding Speck) with strong
organic growth in Asia and Europe:
106.6%(1) increase in North America (1.4%
increase, excluding Speck.)
34.9%(1) growth in Europe driven by
successful new product introductions.
Increase of 10.0%(1) in Asia.
Growth of 76.3%(1) in the Accessories category
(20.4%(1), excluding Speck).
Growth in the Other category is driven largely by
increased sales of kids products with Disney-
licensed product beginning to ship in the second
half of 2014.
(1) Stated on a constant currency basis
Constant
Currency
Growth 10.9% 25.1% 34.6% 76.3% 12.4%
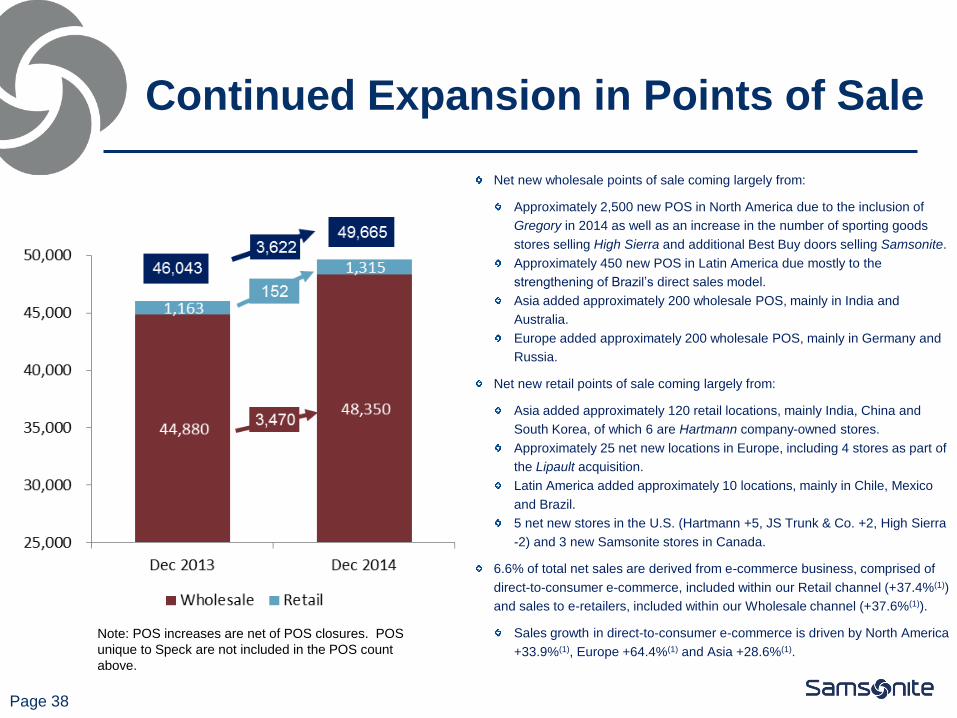
Continued Expansion in Points of Sale
Note: POS increases are net of POS closures. POS
unique to Speck are not included in the POS count
above.
Page 38
Net new wholesale points of sale coming largely from:
Approximately 2,500 new POS in North America due to the inclusion of
Gregory in 2014 as well as an increase in the number of sporting goods
stores selling High Sierra and additional Best Buy doors selling Samsonite.
Approximately 450 new POS in Latin America due mostly to the
strengthening of Brazil’s direct sales model.
Asia added approximately 200 wholesale POS, mainly in India and
Australia.
Europe added approximately 200 wholesale POS, mainly in Germany and
Russia.
Net new retail points of sale coming largely from:
Asia added approximately 120 retail locations, mainly India, China and
South Korea, of which 6 are Hartmann company-owned stores.
Approximately 25 net new locations in Europe, including 4 stores as part of
the Lipault acquisition.
Latin America added approximately 10 locations, mainly in Chile, Mexico
and Brazil.
5 net new stores in the U.S. (Hartmann +5, JS Trunk & Co. +2, High Sierra
-2) and 3 new Samsonite stores in Canada.
6.6% of total net sales are derived from e-commerce business, comprised of
direct-to-consumer e-commerce, included within our Retail channel (+37.4%(1))
and sales to e-retailers, included within our Wholesale channel (+37.6%(1)).
Sales growth in direct-to-consumer e-commerce is driven by North America
+33.9%(1), Europe +64.4%(1) and Asia +28.6%(1).
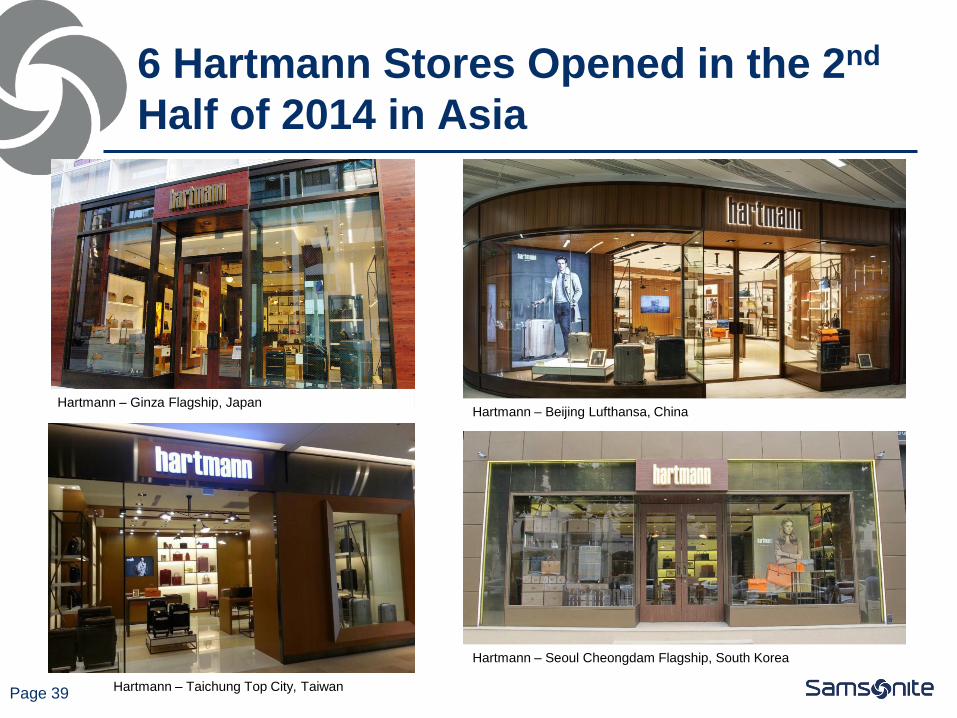
6 Hartmann Stores Opened in the 2nd
Half of 2014 in Asia
Page 39
Hartmann – Ginza Flagship, Japan
Hartmann – Seoul Cheongdam Flagship, South Korea
Hartmann – Beijing Lufthansa, China
Hartmann – Taichung Top City, Taiwan
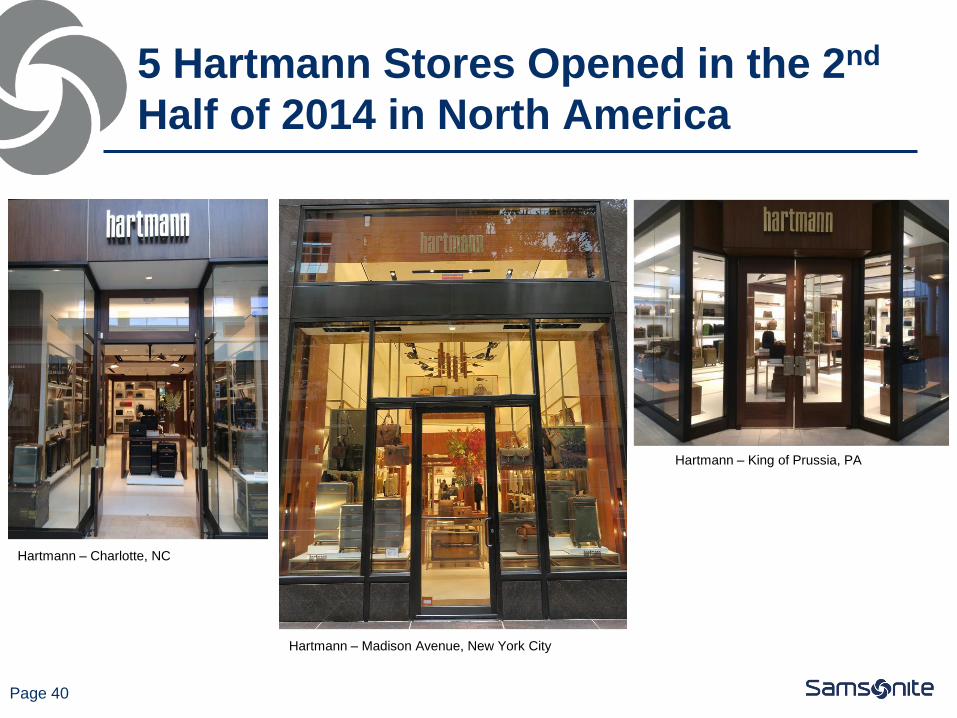
5 Hartmann Stores Opened in the 2nd
Half of 2014 in North America
Page 40
Hartmann – King of Prussia, PA
Hartmann – Charlotte, NC
Hartmann – Madison Avenue, New York City
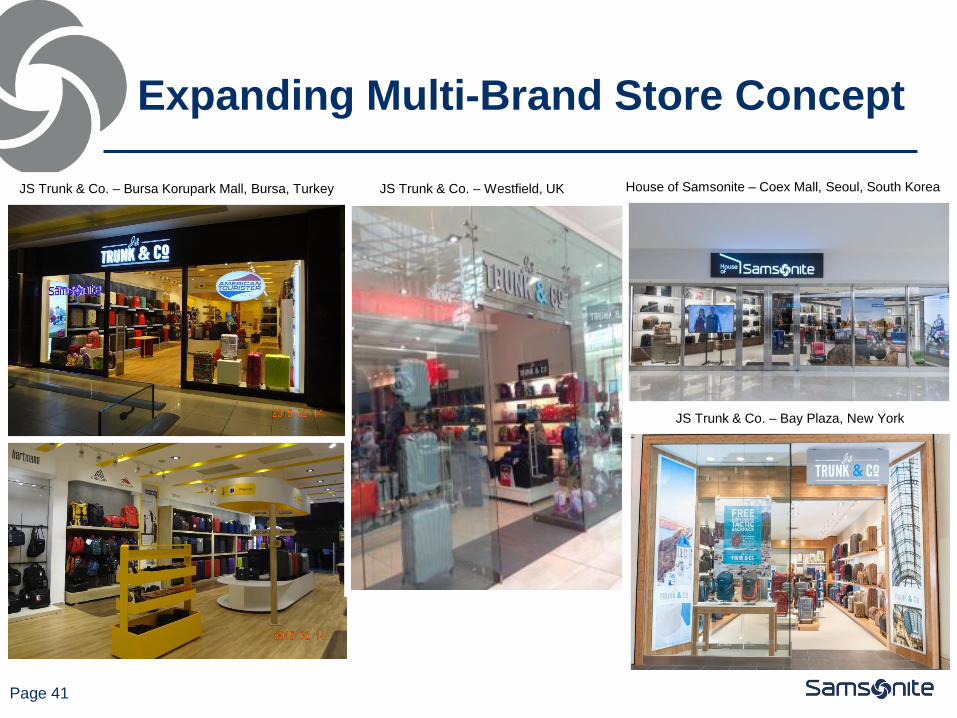
House of Samsonite – Coex Mall, Seoul, South Korea
Expanding Multi-Brand Store Concept
Page 41
JS Trunk & Co. – Westfield, UK
JS Trunk & Co. – Bay Plaza, New York
JS Trunk & Co. – Bursa Korupark Mall, Bursa, Turkey

Lipault Acquisition Included 4 Stores
Page 42 Lipault – Mozart, Paris, France
Lipault – Madeleine, Paris, France
Lipault – Rennes, Paris, France

Retail Expansion in Latin America
Page 43
Samsonite - Mall Tesoro, Medellin, Colombia
Samsonite - Mall Andino, Bogota, Colombia
Samsonite – Jardins, Sao Paulo, Brazil Samsonite - Mall Sante Fe, Medellin, Colombia Samsonite - Mall Unicentro, Bogota, Colombia
Samsonite - Mall Santa Fe, Mexico City, Mexico

Selection of Other Retail Stores Opened
in the 2nd Half of 2014
Page 44
Samsonite – Mirabel, Quebec, Canada
Samsonite – Capucines, France
Samsonite – Gotheburg, Sweden
American Tourister – Marina Square, Singapore
Samsonite – Grand Kawanua City, Indonesia
Samsonite – Budapest Allee Mall 2, Hungary
Page 45
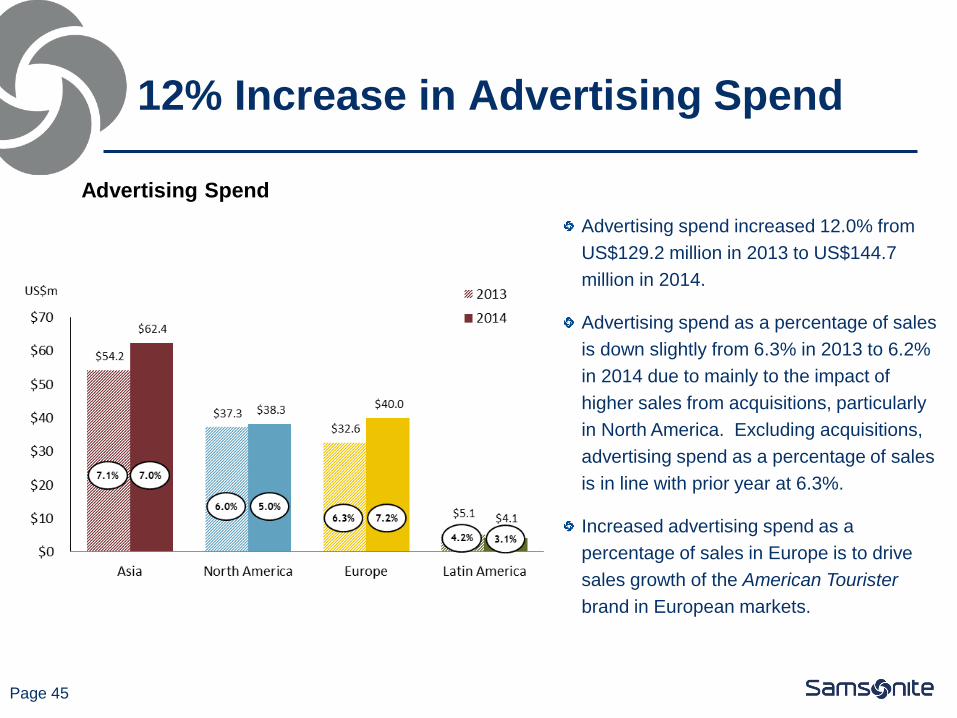
12% Increase in Advertising Spend
Advertising Spend
Advertising spend increased 12.0% from
US$129.2 million in 2013 to US$144.7
million in 2014.
Advertising spend as a percentage of sales
is down slightly from 6.3% in 2013 to 6.2%
in 2014 due to mainly to the impact of
higher sales from acquisitions, particularly
in North America. Excluding acquisitions,
advertising spend as a percentage of sales
is in line with prior year at 6.3%.
Increased advertising spend as a
percentage of sales in Europe is to drive
sales growth of the American Tourister
brand in European markets.
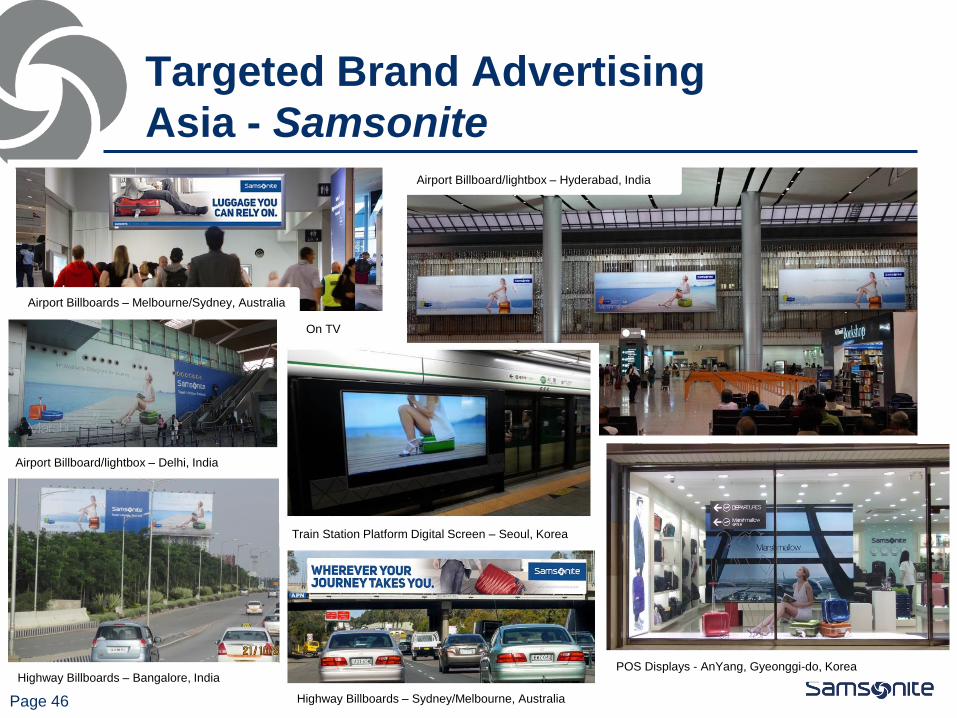
Targeted Brand Advertising
Asia - Samsonite
Page 46
Airport Billboards – Melbourne/Sydney, Australia
Highway Billboards – Sydney/Melbourne, Australia
Airport Billboard/lightbox – Delhi, India
Airport Billboard/lightbox – Hyderabad, India
Highway Billboards – Bangalore, India POS Displays - AnYang, Gyeonggi-do, Korea
On TV
Train Station Platform Digital Screen – Seoul, Korea
Page 47
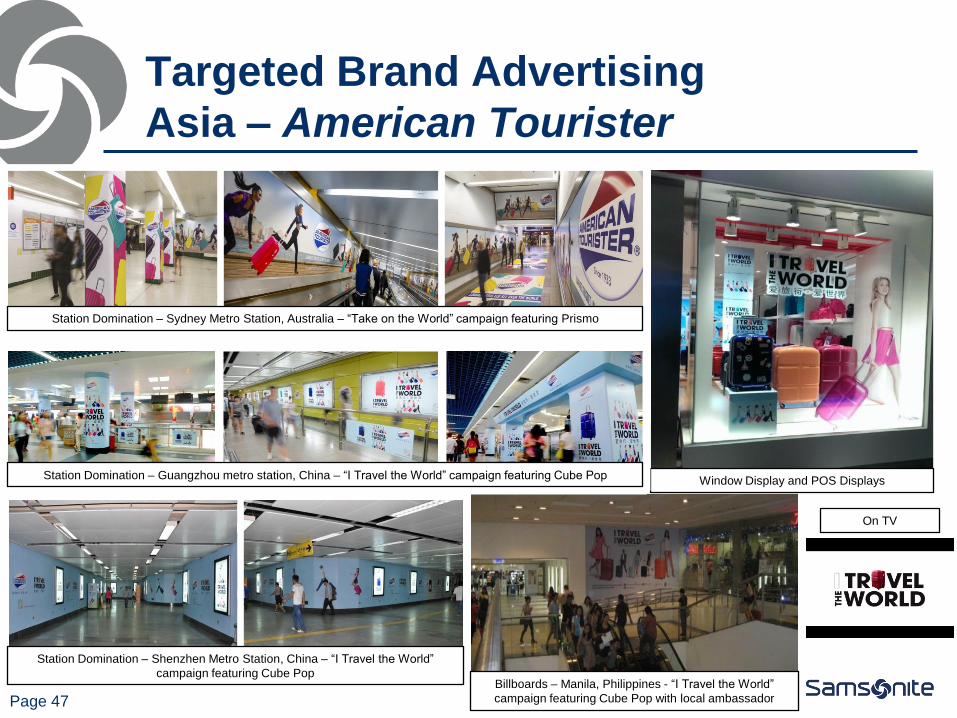
Targeted Brand Advertising
Asia – American Tourister
Station Domination – Sydney Metro Station, Australia – “Take on the World” campaign featuring Prismo
Station Domination – Shenzhen Metro Station, China – “I Travel the World”
campaign featuring Cube Pop Billboards – Manila, Philippines - “I Travel the World”
campaign featuring Cube Pop with local ambassador
Window Display and POS Displays Station Domination – Guangzhou metro station, China – “I Travel the World” campaign featuring Cube Pop
On TV

Page 48
Targeted Product Advertising
North America - Samsonite
Airport Billboards – Chicago O’Hare, Illinois, USA
Train Billboards – Atlanta, Georgia, USA
Airport Billboards – Boston Logan, Massachusetts, USA
Print Media
Page 49
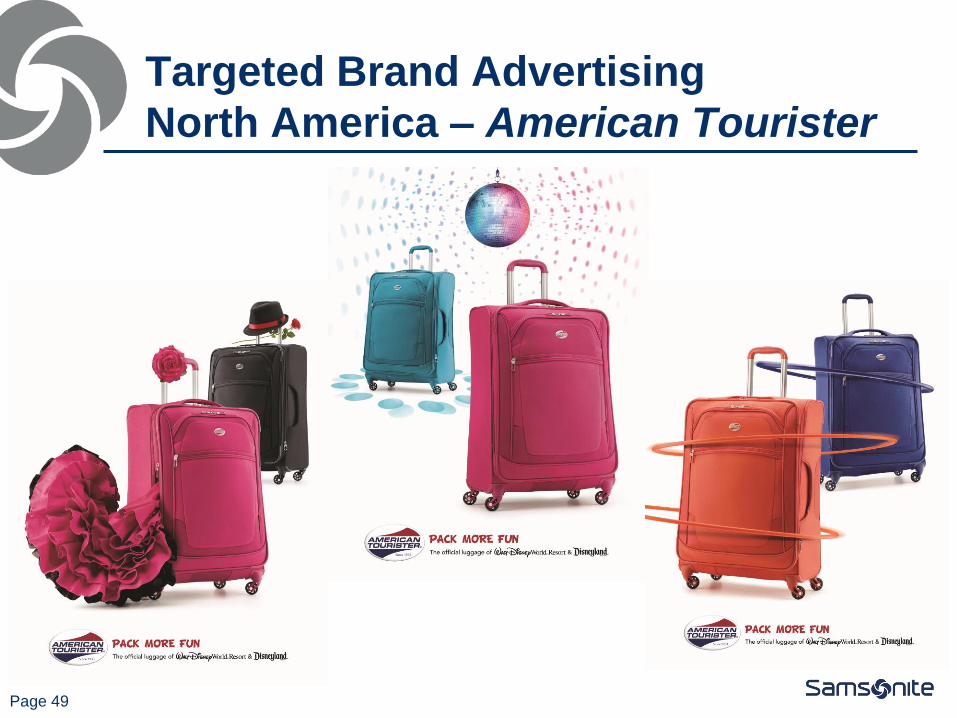
Targeted Brand Advertising
North America – American Tourister
Page 50
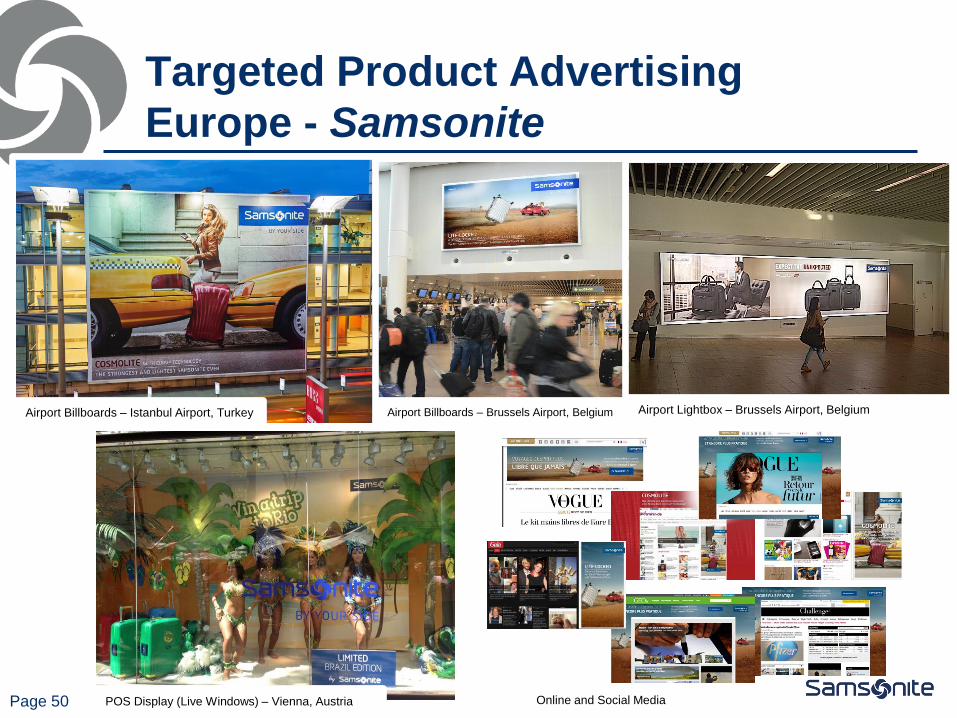
Targeted Product Advertising
Europe - Samsonite
POS Display (Live Windows) – Vienna, Austria
Airport Lightbox – Brussels Airport, Belgium Airport Billboards – Brussels Airport, Belgium Airport Billboards – Istanbul Airport, Turkey
Online and Social Media
Page 51
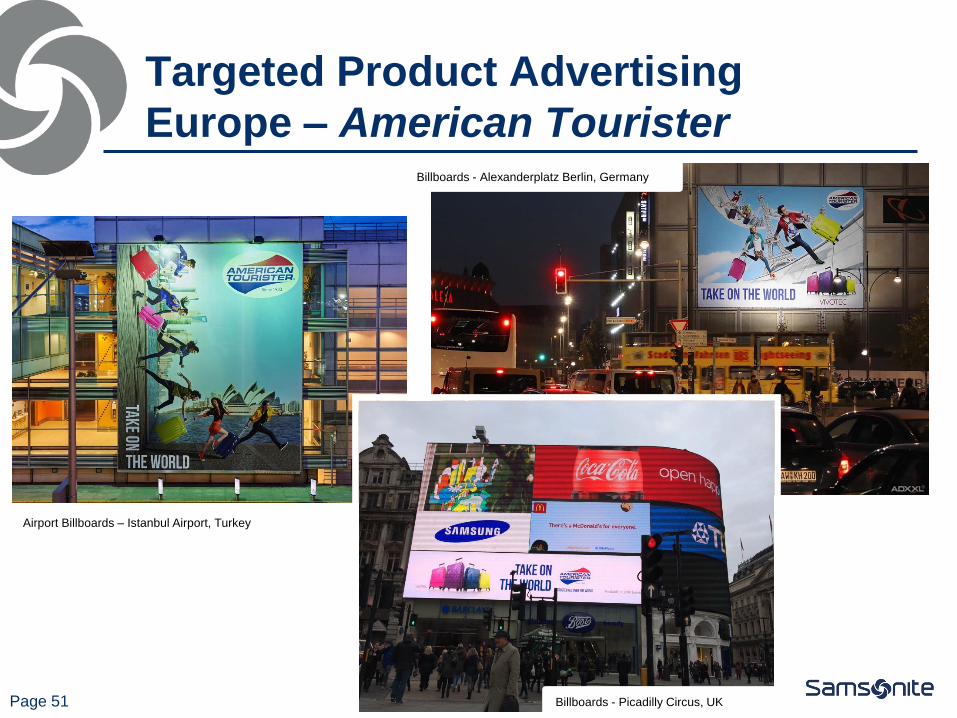
Targeted Product Advertising
Europe – American Tourister
Billboards - Picadilly Circus, UK
Billboards - Alexanderplatz Berlin, Germany
Airport Billboards – Istanbul Airport, Turkey

Targeted Product Advertising
Latin America
Page 52
Print Media
TV Exposure Social Media
Out-of-Home Placements

Page 53
Agenda
Results Highlights
Business Overview
Financial Overview
Outlook and Strategy for 2015
Q&A

Page 54
Excluding acquisitions, Adjusted EBITDA margin increased by approximately 20bp to
16.8%.
Net cash position of US$72.9 million with borrowing capacity on the revolving credit
facility of US$437.5 million as of December 31, 2014.
Net working capital efficiency of 12.7% continues to run better than target level of 14%.
Capital expenditure of US$69.6 million in 2014 is up from US$57.2 million in 2013, as
the Company invested in expanding its warehouse and production facilities in Europe
and expanded retail doors.
Reported net income attributable to the equity holders is up 5.8%, Adjusted Net Income
up 9.0%. Excluding FX loss(1) and stock compensation expense, Adjusted Net Income
is up 13.9% from 2013.
Basic earnings per share on an adjusted basis rose 9.7% from US$0.134 in 2013 to
US$0.147 in 2014.
The Board recommends a cash distribution of US$88.0 million or approximately
US$0.0625 per share, up 10% from the US$80.0 million distribution paid in 2014.
Key Financial Highlights
(1) FX loss represents the realized and unrealized net loss on the balance sheet translation of amounts not denominated in local currencies

Page 55
Strong Balance Sheet
Net cash decreased by US$137.0
million from US$209.8 million at
December 31, 2013 to US$72.9 million
at December 31, 2014 with cash flows
from operations of US$229.9 million
offset by outflows for acquisitions of
US$197 million (Speck US$85 million,
Gregory US$84 million and Lipault
US$28 million).
Continued strong working capital
efficiency of 12.7%.
Revolving credit facility expanded from
US$300 million to US$500 million in
June 2014. At December 31, 2014,
US$437.5 million is available to be
borrowed with US$60 million of
outstanding borrowings and the
utilization of US$2.5 million of the
facility for outstanding letters of credit
extended to certain creditors.
US$m December 31, December 31,
2014 2013
Cash and cash equivalents 140.4 225.3 (84.9) -37.7%
Trade and other receivables, net 290.8 246.4 44.5 18.0%
Inventories, net 332.3 298.4 33.9 11.4%
Other current assets 71.7 65.3 6.5 9.9%
Non-current assets 1,296.0 1,099.5 196.5 17.9%
Total Assets 2,131.3 1,934.9 196.4 10.2%
Current liabilities (excluding debt) 538.4 488.1 50.3 10.3%
Non-current liabilities (excluding debt) 220.3 202.5 17.7 8.8%
Total borrowings 65.1 13.7 51.5 376.3%
Total equity 1,307.4 1,230.6 76.9 6.2%
Total Liabilities and Equity 2,131.3 1,934.9 196.4 10.2%
Total Net Cash (Debt)(1) 72.9 209.8 (137.0) -65.3%
(1) Total Net Cash (Debt) excludes deferred financing costs, which are included in total borrowings
$ Chg Dec-14
vs. Dec-13
% Chg Dec-14
vs. Dec-13

Page 56
Efficiently Managing Working Capital
• Inventory turnover days calculated as ending inventory balance divided by cost of sales for the period and multiplied by the number of days in the period.
• Trade and other receivables turnover days calculated as ending trade and other receivables balance divided by sales for the period and multiplied by the number of days in the period.
• Trade payables turnover days calculated as ending trade payables balance divided by cost of sales for the period and multiplied by the number of days in the period.
Working capital continues to be managed
efficiently at 12.7% of sales at December
31, 2014.
Inventory turnover of 106 days is down 9
days from December 31, 2013.
Trade and other receivables turnover of
44 days is consistent with December 31,
2013.
Trade payables turnover of 100 days is
down 8 days from December 31, 2013
due largely to the timing of inventory
purchases and payments.
(1)
(1) 2014 net working capital as a percentage of sales and turnover days are adjusted for pro forma full year sales
and COGS of Lipault, Speck and Gregory.
US$m December 31, December 31,
2014 2013
Working Capital Items
Inventories 332.3$ 298.4$ 33.9$ 11.4%
Trade and Other Receivables 290.8$ 246.4$ 44.5$ 18.0%
Trade Payables 316.5$ 282.2$ 34.3$ 12.2%
Net Working Capital 306.6$ 262.6$ 44.0$ 16.8%
% of Net Sales 12.7% 12.9%
Turnover Days
Inventory Days 106 115
Trade and Other Receivables Days 44 44
Trade Payables Days 100 108
Net Working Capital Days 50 51
$ Chg Dec-14
vs. Dec-13
% Chg Dec-14
vs. Dec-13

Page 57
Capital Expenditure
Capital Expenditure by Project Type
2014 Retail Capex consists mainly of new
stores and remodels in Asia of US$12.9 million,
North America of US$7.2 million and Europe of
US$4.6 million with 85 net new company-owned
stores opened in 2014.
Capex on product development / R&D / Supply
includes US$11.6 million on manufacturing
facilities and equipment, US$7.3m on product
tooling and molds and US$7.0 million on
warehousing in Europe. US$2.8 million was
spent on tooling and equipment for Speck.
Information Services and Facilities consists
largely of retail and e-commerce software and
finance and business intelligence system
enhancements.
US$m 2014 2013
Retail 27.9 20.5
Product Development / R&D/ Supply 32.4 23.5
Information Services and Facilities 7.2 11.0
Other 2.1 2.2
Total Capital Expenditures $69.6 $57.2

Page 58
Shareholder Information and
Distribution to Shareholders
On January 7, 2015, the Group granted 16,006,812 options to certain directors, key management personnel, and other
employees.
On January 7, 2015, the Group granted an additional 10,040,399 options with a longer term vesting schedule to an Executive
Director and to five additional members of the Group’s senior management team.
Shares outstanding 1,408,026,456
Stock Price (HK$) 23.09
Amounts below stated in US$
2014 Basic EPS (US$) $0.132
2014 Adjusted EPS (US$) $0.147
Recommended distribution to shareholders (US$) $88,000,000
Payout ratio 47.2%
Distribution per share (US$) $0.0625
Distribution yield* 2.10%
*Assumes stock price of HK$23.09 at an exchange rate of 7.755HKD/USD
Shareholder Information as of December 31, 2014
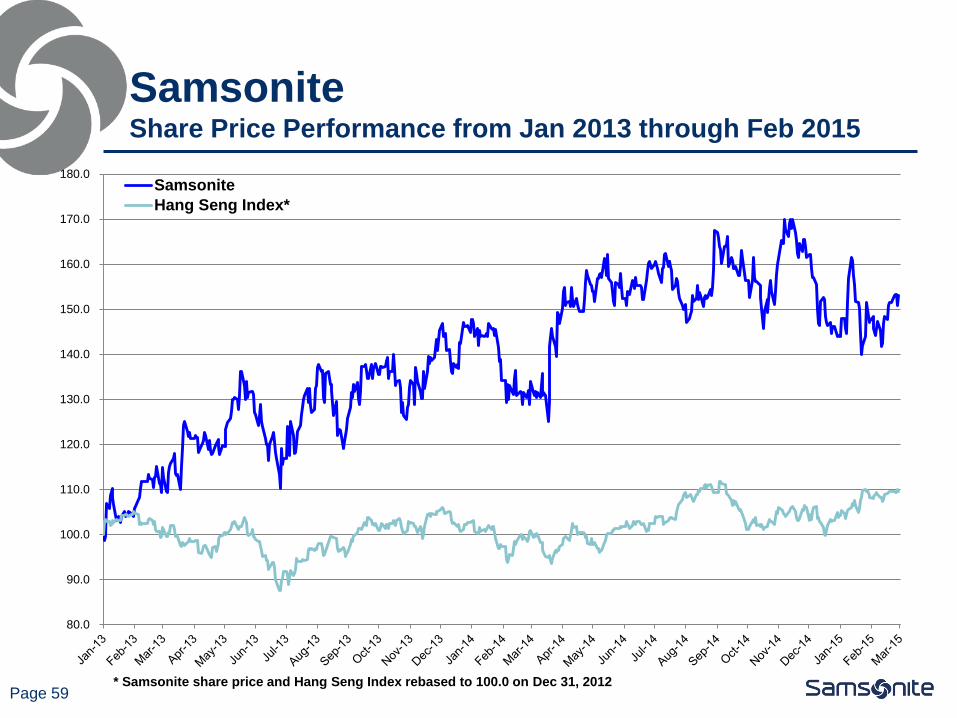
Page 59 * Samsonite share price and Hang Seng Index rebased to 100.0 on Dec 31, 2012
Samsonite Share Price Performance from Jan 2013 through Feb 2015
80.0
90.0
100.0
110.0
120.0
130.0
140.0
150.0
160.0
170.0
180.0Samsonite
Hang Seng Index*
Page 60
Agenda
Results Highlights
Business Overview
Financial Overview
Outlook and Strategy for 2015
Q&A

Engines Of Future Growth
Page 61
Continuing global expansion of travel & tourism
“UNWTO forecasts international tourist arrivals to grow between 3% and 4% in 2015. By region, growth
is expected to be strongest in the Americas and in Asia and the Pacific (both +4% to +5%), and
somewhat more moderate in Europe (+3% to +4%)”(1).
Increase the proportion of sales from our direct-to-consumer channels by growing our e-commerce sales and
expanding our retail presence.
Raise the Hartmann brand in the premium and luxury segments of North America, Asia and Europe by offering a
full category assortment of exceptional products supported by brand marketing and retail expansion.
Implement synergies and execute on market opportunities for newly acquired brands to further diversify our
product offering into non-travel categories.
Continue to invest in our core brands with exciting products, new materials and increased marketing spend.
Tactfully deploy multiple brands to operate wider price points and wider consumer demographics in each
category.
Continue to explore strategic M&A opportunities in adjacent spaces to gain distribution in less represented
markets or to grow direct-to-consumer sales.
We see merit in continuing and even strengthening our existing strategy of developing Samsonite into a well
diversified multi-brand, multi-category and multi-channel bag and luggage business.
(1) Source: UNWTO World Tourism Barometer, Volume 13, January 2015

Page 62
Agenda
Results Highlights
Business Overview
Financial Overview
Outlook and Strategy for 2015
Q&A