Embed Size (px)
Citation preview

COVER SHEET
A S O 9 1 1 9 6 2 0 6 S.E.C. REGISTRATION NUMBER
S P L A S H C O R P O R A T I O N
(COMPANY’S FULL NAME)
H B C C O R P O R A T E C E N T R E
5 4 8 M I N D A N A O A V E N U E C O R .
Q U I R I N O H I G H W A Y
Q U E Z O N C I T Y
(Business Address: No. Street/City/Town/Province)
ATTY. MA. LOURDES B. RODRIGUEZ 984-5555 Contact Person Company Telephone Number DECEMBER 31 Definitive Information Statement 3rd Saturday of June ___________ ______________ ________________________ ____________ _____________ Month Day Form Type Month Day Fiscal Year Annual Meeting
____________________________________________ Secondary License Type, If Applicable
Corporation Finance Department ___________________________________ ____________________________________ Department Requiring this Document Amended Articles Number / Section Total Amount of Borrowings _____________________ __________________ _________________ Total no. of Subscribers Domestic Foreign ----------------------------------------------------------------------------------------------------------------------------------------------------------------------------
TO BE ACCOMPLISHED BY SEC PERSONNEL CONCERNED
File Number ______________________________________________ LCU
Document I.D. ______________________________________________ Cashier

SECURITIES AND EXCHANGE COMMISSION
SEC FORM 20 - IS
1. Date of Report : May 19, 2009 2. SEC Identification Number: ASO91-196206. 3. BIR Tax Identification No: 001-096-221 4. Exact name of issuer as specified in its charter Splash Corporation 5. Province, country or other jurisdiction of incorporation 6. Industry Classification Code: (SEC Use Only) 7. Address of principal office: 3F HBC Corporate Centre Mindanao Ave., Q.C. 1116 8. Issuer's telephone number, including area code: (02) 984-5555 9. Former name or former address, if changed since last report NA 10.Securities registered pursuant to Sections 8 and 12 of the SRC or Sections 4 and 8 of the
RSA Number of Shares of Common Stock Common Shares listed in the Philippine 223,848,107 common shares Stock Exchange 11. Indicate the item numbers reported herein:
Submission of the Definitive Information Statement
SIGNATURE Pursuant to the requirement of the Securities Regulation Code, the issuer has duly caused this report to be signed on its behalf by the undersigned, duly authorized for the purpose. SPLASH CORPORATION By: ATTY. MA. LOURDES B. RODRIGUEZ Compliance Officer

May 19, 2009 Disclosure Department The Philippine Stock Exchange, Inc. Philippine Stock Exchange Centre Exchange Road, Ortigas Center Pasig City
Attention: Ms. Janet A. Encarnacion Head, Disclosure Department
Subject: Filing of Splash Corporation’s Definitive
Information Statement under SEC Form 20-IS
Gentlemen: Please be informed that Splash Corporation (SPH) hereby discloses the filing of its Definitive Information Statement (SEC Form 20-IS) with the Securities and Exchange Commission. Thank you. Very truly yours, ATTY. MA. LOURDES B. RODRIGUEZ Corporate Secretary cc : Director Justina F. Callangan Corporate Finance Department
Securities and Exchange Commission

1
NOTICE OF ANNUAL MEETING OF STOCKHOLDERS
TO ALL STOCKHOLDERS: Notice is hereby given that the Annual Meeting of the Stockholders of Splash Corporation will be held on Saturday, June 20, 2009, at nine o’clock in the morning at the Crowne Plaza Galleria Manila, ADB Avenue, Pasig City to consider and act upon the following matters:
1. Certification on sending of notices and quorum 2. Annual Report of the President and Chief Operating Officer 3. Ratification of the Actions of the Board of Directors and the Corporate Officers for the
year 2008 4. Ratification of the Annual Report and Ratification of the Actions of the Board of Directors
and Corporate Officers 5. Declaration of Dividends 6. Appointment of External Auditors 7. Election of Directors 8. Adjournment Only stockholders of record as of May 20, 2009 will be entitled to attend and vote at the
meeting. For this purpose, the Stock and Transfer Books of the Corporation will be closed on May 20, 2009. Please be advised that we are not soliciting your proxy FOR THE BOARD OF DIRECTORS
MA. LOURDES R. BANTEGUI- RODRIGUEZ
Corporate Secretary

2
Instructions
We are not soliciting your proxy. However, if you would be unable to attend the meeting but would like to be represented thereat, you may accomplish the proxy form herein provided below for the purpose and submit the same to the Office of the Secretariat at Stock Transfer Service, Inc. (STSI), Tel. Nos. (632) 898-7555 / 898-7611, c/o Mr. Richard D. Regala, Jr., Assistant Manager-Operations Head, 8th Floor, Phinma Plaza, 39 Plaza Drive, Rockwell Center, 1211 Makati City on or before June 5, 2009. This Proxy, when properly executed, will be voted in the manner as Directed herein by the Stockholder. If no direction is made, this Proxy will be voted “FOR” the election of all nominees, “FOR” the ratification of all previous acts and resolutions of the outgoing Board of Directors and Management, and “FOR” such other matters as may properly come before the meeting. Revocability of Proxy A stockholder giving a proxy has the power to revoke it at any time prior to its exercise by giving written notice to the Corporate Secretary at least six (6) working days prior to the Annual Meeting or by personal presence of the stockholder at the said meeting.
SPLASH CORPORATION P R O X Y
I/WE hereby name and appoint __________________________________, or in his/her absence, the Chairman of the Meeting, as my/our proxy at the annual stockholders’ meeting of SPLASH CORPORATION to be held at the Crowne Plaza Galleria Manila, ADB Avenue, Pasig City on Saturday, June 20, 2009 at 9:00 A.M. and at any postponement or adjournment thereof. _____________________________ ______________________________ Place Date __________________________________________ Printed Name & Signature Number of shares held: __________________

3
SPLASH CORPORATION
INFORMATION STATEMENT PURSUANT TO RULE 20 OF THE SECURITIES REGULATION CODE
A. GENERAL INFORMATION
Item 1 - Date, Time and Place of Meeting
The Annual Meeting of Stockholders of Splash Corporation is scheduled on June 20, 2009 at 9:00 A.M. at the Ruby Ballroom, Crown Plaza Galleria Manila, ADB Avenue, Pasig City. The complete mailing address of the principal:
Office of the Secretariat at Stock Transfer Service, Inc. (STSI) c/o Mr. Richard D. Regala, Jr. Assistant Manager-Operations Head 8th Floor, Phinma Plaza, 39 Plaza Drive, Rockwell Center, 1211 Makati City Tel. Nos. (632) 898-7555 / 898-7611
The information statement and form of proxy is targeted to be mailed to the stockholders on or before May 29, 2009
Item 2 - Dissenter’s Right of Appraisal
There are no corporate actions or matters that will be taken up during the meeting that will entitle dissenting stockholders to exercise their right of appraisal under Section 81 of the Corporation Code of the Philippines, which provides as follows: Any stockholder of a corporation shall have the right to dissent and demand payment of the fair value of his shares in the following instances: 1. In case any amendment to the Articles of Incorporation has the effect of changing or
restricting the rights of any stockholder or class of shares, or of authorizing preferences in any respect superior to those of outstanding shares of any class, or of extending or shortening the term of corporate existence;
2. In case of sale, lease, exchange, transfer, mortgage, pledge or other disposition of all or
substantially all of the corporate property and assets as provided in this Code; and 3. In case of merger or consolidation.
Item 3 - Interest of Certain Persons or Opposition to Matters to be Acted Upon
The Registrant is not a party to any arrangement with any person with regard to any matter to be acted upon at the meeting. No director has informed the Registrant that he intends to oppose any action intended to be taken by the Registrant. Neither has any director or executive officer of the corporation, or nominee for director, or any associate of the foregoing persons have any substantial interest, direct or indirect, in any matter to be acted upon, other than election to office.

4
B. CONTROL AND COMPENSATION INFORMATION
Item 4 - Voting Securities and Principal Holders
There are 691,290,326 shares of Splash Corporation common stock issued and outstanding and entitled to vote at the Annual Meeting. Only stockholders of record as of May 20, 2008, will be entitled to notice of and to vote at the Annual Meeting. An agenda item at the Annual Meeting is the election of directors for the ensuing year. Article II, Section 6 of the Company’s Amended By-Laws, provides:
VOTING – At all meetings of the stockholders, each stockholder shall be entitled to one vote for each share of stock outstanding in his name in the stock transfer books of the Corporation. In the election, a stockholder may vote his shares in person or by proxy for all the nominees for directors, or he may cumulate said shares and give one nominee as many votes as the number of directors to be elected multiplied by the number his shares shall equal, or he may distribute them on the same principle among as many nominees as he shall see fit. Provided, however, that the whole number of votes cast by him shall not exceed the number of shares outstanding in his name in the stock transfer books of the Corporation multiplied by the number of directors to be elected.
Discretionary authority to cumulate votes is not solicited. Security Ownership of Certain Record and Beneficial Owners of more than 5%: The following table is a list of the top stockholders as of December 31, 2008 including stockholders with beneficial ownership of more than 5%.

5
Rank
Stock- holder
Number Name and Address Citizenship Holdings %1 1 SPLASH HOLDINGS INC.
3/F HBC CORPORATE CENTER 548 MINDANAO AVE. QUEZON CITY
2 9 PCD NOMINEE CORP.(FIL.) THE ENTERPRISE BLDG. AYALA AVE. MAKATI CITY
3 10 PCD NOMINEE CORP. (NON-FIL.) THE ENTERPRISE BLDG. AYALA AVE. MAKATI CITY
4 483 YAO ALFREDO M. 84 DAPITAN STREET QUEZON CITY
5 20 ENRILE WILLIAM T. VICENTE MADRIGAL AVENUE CORINTHIAN GARDEN, QUEZON CITY
6 481 BAYOG ROMEO D. 4420 SCARLET STREET SUNVALLEY SUBD. BRGY. SUNVALLEY PARANAQUE CITY
7 479 YAO ANNIKA SHERRYN 158 SUERTE STREET PASAY CITY
8 482 KHO DAVID LIMQUECO 35 QUEZON AVENUE QUEZON CITY
9 19 DUY WINSTON L. J.P. CABAGUIO AVENUE DAVAO CITY
10 485 REYES ANNA KARENINA E. BLK 1 LOT 37 SUGARTOWNE SUBD. BATASAN HILLS QUEZON CITY
11 488 OLIVEROS FEDERICO S. JR. 10 PEARL STREET SEVERINA DIAMOND SUBDPARANAQUE CITY
12 489 SOLOMON ANTONINA SABLAN 17-D REYNADO STREET TIERRA BELLA HOMETANDANG SORA QUEZON CITY
13 21 SANTOS ALFREDO M. 40 AUGUST STREET, VISTA VERDE VILLAGE CAINTA RIZAL
14 469 ALMIRA PILAR P. 135 ANONAS EXTENSION SIKATUNA VILLAGEQUEZON CITY
15 487 HWANG DAVID Y. 1209 ACACIA ROAD DASMARINAS VILLAGE MAKATI CITY
16 12 CHERYL LADD CHING OR CHRISTOPHER CHIN103 KAMUNING ROAD KAMUNING QUEZON CITY
17 11 JOSE A. FERRIOLS &/OR EDUARDO A. FERRIO1612 TAYUMAN STREET STA. CRUZ MANILA
18 478 YU KEVIN &/OR EMMA CONCEPCION YU UNIT 3 101 4TH STREET NEW MANILA QUEZON CITY
19 17 AGUAS RENE Q. 491 KAYUMANGI STREET PLAINVIEW MANDALUYONG CITY
20 16 TIO ELSON A. ELSON AUTO SUPPLY R. MAGSAYSAY AVENUE, DAVAO CITY
Total Top 20 Shareholders 691,248,821 99.99%
Other 41,505 0.01%
Total Outstanding Shares 691,290,326 100.00%
0.00%
0.00%
0.00%
0.00%
0.00%
0.00%
0.00%
0.00%Filipino 5,000
Filipino
Filipino
5,000
5,000
Filipino 10,000
Filipino 10,000
Filipino
Filipino 5,000
Filipino 5,000
5,000
Filipino23,000
Filipino20,000
Filipino10,000
0.00%
0.00%
0.00%
Filipino 50,000
Filipino 50,000
Filipino 50,000
0.01%
0.01%
0.01%
Filipino 599,000
Filipino 320,000
Filipino 56,000
0.09%
0.05%
0.01%
Filipino
Filipino
Foreign
492,009,214
93,031,107
104,980,500
71.17%
13.46%
15.19%

6
Security Ownership of Management
Name Citizenship Shareholdings % to TotalRolando B. Hortaleza, M.D., Chairman and Chief Executive Officer
Filipino 1 0.0000001%
Sinforoso Jesus R. Soriano, President Filipino 20,000 0.0028931%
Item 5 – Directors and Executive Officers
1. Directors
The following table lists the Directors of the Company, and following this table are profiles of each Director
Name PositionRolando B. Hortaleza, M.D. ChairmanRosalinda A. Hortaliza, M.D. Vice‐ChairmanSinforoso Jesus R. Soriano DirectorAllue Krisanne A. Hortaleza DirectorMaurice P. Ligot DirectorRizalino D. Rivera, Independent Director Independent DirectorJimmy T. Yaoksin, Independent Director Independent Director
Rolando B. Hortaleza, M.D. Dr. Hortaleza, 50, Filipino, is the Chairman of the Board and Chief Executive Officer of Splash Corporation which he co-founded with his wife, Rosalinda, also a medical doctor, in 1985. He is a scion of the Hortaleza family which pioneered the Hortaleza Vaciador and Beauty Supplies, a trail-blazing chain of stores that sells cosmetic products, nippers, scissors and other beauty salon supplies. Dr. Hortaleza also sits as Chairman of Splash Holding, Inc. and Vice-Chairman of the following corporations: HBC, Inc., World Partners Bank and World Partners Finance Corporation. He is also Vice-Chairman of Splash Foundation, Inc. Dr. Hortaleza graduated with a Bachelor of Science degree in Preparatory Medicine (Pre-Med) from the University of the East and obtained his degree in Medicine from Our Lady of Fatima University in 1984. Dr. Hortaleza also attended the Owners and Presidents Management Program at the Harvard Business School in Boston, Massachusetts from 1997 to 1998. Rosalinda Ang-Hortaleza, M.D. Dr. Ang-Hortaleza, 51, Filipino, is the Vice-Chairman of Splash Corporation. She also sits as Vice Chairman of Splash Holdings, Inc., and is the Chairman and Chief Executive Officer of HBC, Inc., Splash Foundation, Inc., World Partners Bank, and World Partners Finance Corporation. She graduated with a Bachelor of Science degree in Medical Technology from the University of Santo Tomas in 1980. She obtained her degree in Medicine from Our Lady of Fatima University in 1984. She attended the Advanced Management Program at the Harvard Business School in Boston, Massachusetts in 2000.

7
Sinforoso Soriano. Mr. Soriano, 46, Filipino, is the President and Chief Operating Officer of Splash Corporation. He is also heads the Company’s Investor Relations. He joined Splash in 2005. He was formerly the President/COO of Splash Nutraceutical Corporation until June 2006. Thereafter, he held the President/COO position of Splash Holdings, Inc. until his appointment to Splash Corporation in August 2007. Prior to joining Splash, Mr. Soriano spent his entire professional career with Eli Lilly (Philippines), Inc. where he started as a Professional Medical Sales Representative in 1987. He was assigned to various positions in the Eli Lily’s sales and marketing organization in the Philippines and the United States, highlighted by his appointment as Asia-Pacific Area Operations Manager (Sales) based in Singapore and as National Sales Director for the Philippines, a position he held until he left the company in February 2004. Mr. Soriano graduated from the University of Santo Tomas with a Bachelor of Science degree in Pharmacy. He passed the Pharmacy Licensure Examinations in 1986. He obtained his Master in Business Administration degree from St. Louis College. Allue Krisanne A. Hortaleza. Ms. Hortaleza, 24 Filipino, is the eldest daughter of Drs. Rolando and Rosalinda Hortaleza and was elected to the Board in 2007. She obtained her Bachelor of Science degree in Management from the Ateneo de Manila University in March 2007. She is currently the Executive Assistant to the Chairman/CEO of HBC, Inc. Maurice P. Ligot. Ms. Ligot, 57, Filipino, has been a Director of Splash Corporation since 2002 and President and Chief Operating Officer of Splash Foundation, Inc. since 1997. Ms. Ligot is also a member of the Board of Directors of World Partners Finance Corporation and HBC, Inc. Prior to her present positions, she was with Splash Manufacturing Corporation as Production Manager, Quality Assurance Manager and then Total Quality Manager. Ms. Ligot obtained her Bachelor of Science degree in Pharmacy from the Centro Escolar University (CEU) where she was Outstanding Alumna of the School of Pharmacy in 2000 and Centennial Awardee in 2007. She earned units in Master of Science in Pharmacy from the University of the Philippines. She also obtained diplomas in Creating Value in CSR from the Asian Institute of Management in Indonesia; Triple Bottomline: Operationalizing The Doing Good from Asian Institute of Management, Philippines; and Corporate Governance from the University of the Philippines. Ms. Ligot was Trustee and Treasurer of the League of Corporate Foundations in 2003 – 2007 and currently, a trustee of Ninoy and Cory Aquino Center for Leadership. Rizalino D. Rivera. Mr. Rivera, 47 Filipino, was elected to the Board of Splash Corporation on 1 October 2007. He is in charge of Management Planning for Digital Alliance which is a group of companies involved in ICT and Broadcast. He is President of Change Consultants, Inc. which offers consultancy services to top business corporations as well as government organizations, the academe, and development work. Mr. Rivera is the Faculty Chair for the Human Resource Cluster of the Ateneo Graduate School of Business. He is also involved with the Institute of People Power and Development of the Benigno S. Aquino, Jr. Foundation and is a member of the advisory team to former President Corazon C. Aquino. Mr. Rivera has been a senior consultant on human resource management and organizational development for several companies which include Nestle Philippines, Kraft Foods, Jollibee Foods Corporation, Wyeth Philippines, Pfizer, La Farge Cement, HBC, Inc. and the Asian Development Bank. Mr. Rivera has a Bachelor of Arts degree in Political Science from the University of the Philippines. He is a candidate for the Master of Arts in Counseling Psychology program of the Ateneo de Manila University as well as the Master of Science in Organization Development program of the Pepperdine University, U.S.A.
Jimmy T. Yaokasin. Mr. Yaokasin, 40, Filipino, was elected to the Board of Splash Corporation on October 1, 2007. He is currently the Chairman of the Board of Trustees of the Development Academy of the Philippines in his capacity as the representative of the Office of the President. He is also a member of the Board of Directors of MRC Allied, Inc., Menlo

8
Capital, Leyte Cable TV Network, Inc. and the YKS Group of Companies. Mr. Yaokasin is an active member of civic and community organizations – Paul Harris Fellow of Rotary International, Gideons International and former National President of the Philippine Jaycees. Mr. Yaokasin obtained his degree in Business Administration major in Accountancy (Magna cum Laude) from the University of the Philippines. He obtained his Master in Business Administration (MBA) under the joint Executive MBA program of the Kellogg School of Management of Northwestern University, Chicago and the Hongkong University of Science and Technology. Mr. Yaokasin is a Certified Public Accountant. Independent Directors: Among the seven (7) Directors, Messrs. Rizalino D. Rivera and Jimmy Tiu Yaokasin, Jr. are the independent directors of the company, having been as such pursuant to Article III, Section 1(a) of the By-Laws of the Corporation. For 2009, the following have been nominated by the stockholders as independent Directors: Nominees as Independent Directors: Messrs. Rizalino D. Rivera and Jimmy Tiu Yaokasin, Jr. were nominated by Splash Holdings, Inc., represented by Dr. Rolando B. Hortaleza. Messrs. Rivera and Yaokasin have no family or business relationships with the person who nominated them, and have accepted their nominations to again serve as Independent Directors. They possess the qualifications and none of the disqualifications of an Independent Director. The Certification of Independent Director Rizalino D. Rivera was submitted to the Securities and Exchange Commission on July 18, 2009 while the Certification of Independent Director Jimmy Tiu Yaokasin, Jr. was filed with the said Office on July 21, 2009. Nominations for Directors and Independent Directors will be received during the period May 1 to 7, 2009, all of which are compliant with Art. III, Sec. 2(a) of the By-Laws of the Corporation requiring submission of same in writing to the Corporate Secretary not later than thirty (30) days prior to the date of the regular meeting of stockholders for the election of directors. The Nominations Committee evaluated the qualifications of the seven (7) nominees and concluded that they have more than the required qualifications and have none of the disqualifications for directorship as set out in the Corporation’s By-Laws and Manual on Corporate Governance which are based on SRC Rule 38-1. The Committee submitted the list of qualified nominees to the Board on May 15, 2009, in compliance with the By-Laws requiring submission of same at least 30 days before the Annual Meeting.

9
2. Executive Officers
Name PositionRolando B. Hortaleza, M.D. Chief Executive OfficerSinforoso Jesus R. Soriano President and Chief Operating OfficerRamon G. Trajano Chief Financial OfficerEdgardo I. Patron General Manager for International OperationsDeogracia G. Orpilla General Manager for Domestic OperationsAtty. Ma. Lourdes Bantegui‐Rodriguez Corporate SecretaryHiginio P. Porte, Jr. Head ‐ Research and Supply Chain ManagementTeodulo L. Manlubatan Head ‐ Corporate ServicesTeresa M. Conde Head ‐ Marketing and Brand Development Rico B. Lavalle Head ‐ Customer and Business DevelopmentGaryzalde O. Morales Head ‐ Brand Activation GroupKriskyril Peteilhard M. Lapitan Head ‐ Human ResourcesMenchie P. Sadornas Head ‐ FinanceArthur P. Bautista Head ‐ Splash Research InstituteLoida S. de Vera Head ‐ Strategic ProcurementEmyl B. Rendon Head ‐ Plant Operations and Logistics DivisionGrace D. del Rosario Head ‐ Regulatory AffairsLoida E. Moreno Head ‐ Market Research
Ramon G. Trajano, 53, Filipino, Chief Financial Officer. Mr. Trajano joined Splash in August 2008. Prior to Splash he was Finance Director of APAC Manila (a Nasdaq-listed BPO company) , CFO of Globalstride Corp (a Philippine call center), and finance head of two Ayala Corporation companies: CFO of Ayala Health Care and Finance Director of Ayala Life. Mr. Trajano graduated with degrees of Bachelor of Arts (Economics) and Bachelor of Science in Commerce (Accounting) from De La Salle University, Manila. He obtained his M.B.A. from the Wharton School of the University of Pennsylvania. He is a Certified Public Accountant. Deogracia G. Orpilla, 38, Filipino, EVP and General Manager for Domestic Operations. Mr. Orpilla joined Splash in 2006. Prior to joining Splash, he was Sales Director of Reckitt Benckiser from 2004 to 2006. He was National Sales Manager in Master Foods (Mars, Inc.) from 1996 to 2004. Mr. Orpilla graduated with a Bachelor of Arts degree in Public Administration from the University of the Philippines, Diliman, Quezon City. Edgardo I. Patron, 50, Filipino. EVP and General Manager for International Operations. Mr. Patron joined Splash in January 2005. Prior to joining Splash, he was with Kraft Foods International from 2000 to 2004 where he held senior positions in the company’s Southeast Asian operations, his last position being General Manager for Thailand. Mr. Patron completed the Management Development Program of the Asian Institute of Management and obtained his Bachelor of Science degree in Commerce from San Sebastian College, Manila.

10
Ma. Lourdes R. Bantegui-Rodriguez, 53, Filipino, Head of Corporate Legal Affairs and Corporate Secretary. Atty. Rodriguez joined Splash Corporation in January 2007. Prior to joining Splash she was the Corporate Counsel and the Corporate Secretary of Araneta Properties, Inc. Atty. Rodriguez graduated cum laude with a Bachelor of Arts degree in Mass Communications from the Far Eastern University where she also obtained her Bachelor of Laws. Higinio P. Porte, 46, Filipino, Vice President and Head of the Research and Supply Chain Management Division. Prior to joining Splash, he was with Interphil Laboratories, Inc. from 1987 to June 2000 where he last position was Division Head for Logistics and Materials Management. Mr. Porte obtained his Bachelor’s degree in Chemical Engineering from the University of the Philippines. He was a Director’s Awardee of the Management Development Program, Ateneo Professional Schools. Teodulo L. Manlubatan , 48, Filipino, Vice President and Head of Corporate Services. Mr. Manlubatan also worked for Lamoiyan Corporation as Senior Assistant Vice-President for Supply Chain Management. He holds a bachelors degree in Chemical Engineering from the University of the Philippines where he also completed academic requirements for a Masters degree in Chemical Engineering.
Teresa M. Conde, 36, Filipino, Head of Marketing and Brand Development. Ms. Conde was Infant Food Category Manager for Philippine Health Food Center, Inc. (a subsidiary of Unilab) from 1998 to 2001; and Senior Product Manager for RFM Swift Foods Inc. from 1994 to 1998. Ms. Conde graduated with a Bachelor of Science degree in Commerce from St. Paul’s College (Quezon City) and obtained her Master in Business Administration degree from the De La Salle University. Rico Ramon B. Lavalle, 39, Filipino, Head of Customer and Business Development. Mr. Lavalle was with the Pure Foods Corporation sales organization from 1993 to 1997. He also worked for Mead Johnson Philippines. He holds a Bachelors Degree in Commerce, major in Economics from the Central Philippine University in Iloilo. He is likewise a holder of a Diploma in Business Administration from the Ateneo Graduate School of Business Arthur P. Bautista, 34, Filipino. Head of Splash Research Institute. Before joining Splash, he was Faculty Member and Department Chairman of the Industrial Pharmacy Department of the College of Pharmacy, University of the Philippines, Manila. Mr. Bautista obtained his Bachelor of Science degree in Industrial Pharmacy from the University of the Philippines. Loida S. De Vera., 50, Filipino, Head of Strategic Procurement. Prior to joining Splash, she was the Strategic Sourcing Manager of Stephan Phils. Inc.. Ms. De Vera obtained her Bachelor of Science in Chemical Engineering from the University of Sto. Tomas.
Emyl B. Rendon. 36, Filipino, Head of Plant Operations and Logistics Division. Prior to joining Splash, Mr. Rendon was the Warehouse and Distribution Manager for Red Ribbon Bakeshop Inc. He and holds a Bachelor’s Degree in Electrical Engineering from the Mapua Institute of Technology and is a Registered Electrical Engineer. Grace S. Domingo-Del Rosario, 53, Head of Regulatory Affairs. Filipino. Before joining Splash, she was Senior Vice-President of Federal Chemicals, Inc. Ms. Del Rosario graduated from the University of the Philippines where she obtained her Bachelor of Science degree in Chemistry.

11
Loida E. Moreno, 33, Filipino, Head of Market Research Prior to joining Splash, Ms. Moreno was International Relations Assistant of PRTC Inc. She obtained her Bachelor of Arts degree in Psychology from De La Salle University.
3. Relationships and Related Transactions
The Registrant sells to the following affiliates: HBC, Inc. and PT Splash Indonesia (PTSI), companies owned by Splash Holdings, Inc. where Dr. Rolando B. Hortaleza, Dr. Rosalinda Ang-Hortaleza, and Allue Krisanne A. Hortaleza are members of the Board of Directors and/or executive officers. The Company sells to HBC, Inc. and PTSE on an arm’s length basis. HBC accounted for 4.3% of total Company sales while PTSI accounted for 1.3%. There are no material transactions which were negotiated by Splash Corporation with parties whose relationship with the Corporation fall outside the definition of “related parties” under SFA/IAS No. 24 but with whom Splash Corporation has relationship that enables such parties to negotiate terms that may not be available from other, more clearly independent parties on an arm’s length basis. With the exception of the spouses Dr. Rolando B. Hortaleza and Dr. Rosalinda Ang-Hortaleza and their eldest daughter Allue Krisanne A. Hortaleza who are the Chairman, Vice-Chairman, and Director, respectively, of the Company, there are no family relationships either by consanguinity or affinity up to the fourth (4th) civil degree among the directors, executive officers and nominees for election as directors.
Splash Holdings, Inc (SHI) is the parent company of Splash Corporation (SC). SHI sold Php100 million of SC shares of stock to SC, and used the proceeds to partially pay P.T. Indonesia’s (PTSI) Notes Payable to SC. SHI is guarantor of this Notes Payable.
Item 6 - Compensation of Directors and Executive Officers All the members of the Board of Directors are entitled to P20,000.00 per diem for attendance in any regular or special meeting. The compensation table which follows summarizes total salaries, allowances and bonuses for the last two fiscal years (2007 and 2008) and estimated to be paid for 2009 to the principal executive, operating and financial officers.
Other than the election of directors, there is no action to be taken at the Annual Stockholders’ Meeting that will affect directors and executive officers relative to bonus, profit sharing, pension/retirement plan, granting or extension of any option, and warrants or rights to purchase any securities. The members of the Compensation Committee are Maurice P. Ligot as Chairman with Allue Krisanne A. Hortaleza and Rizalino D. Rivera (Independent Director), as members.

12
Salary Php Mil)
Rolando B. Hortaleza, M.D.Chiarman and Chief Executive OfficerSinforoso Jesus R. SorianoPresident and Chief Operating OfficerRamon G. TrajanoChief Financial OfficerDeogracia G. OrpillaEVP and GM for Domestic OperationsEdgardo I. PatronEVP and GM for International OperationsHiginio P. Porte, Jr.VP for Research and Supply Chain ManagementAtty. Ma. Lourdes Bantegui‐RodriguezAVP ‐ Corporate Legal / Corporate SecretaryTeresa M. CondeAVP ‐ Marketing and Brand Development
Actual 2007 39.473 9.929Actual 2008 60.028 13.170Projected 2009 60.510 13.917Actual 2007 25.847 6.502Actual 2008 31.727 6.948Projected 2009 37.691 8.669
*Senior Managers and above
Name and Principal Position Year Other Variable Pay (Php Mil)
CEO and most highly compensated Executive Officers
All other officers* as a group unnamed
Item 7 – Independent Public Accountant Sycip, Gorres, Velayo (SGV) is the Company’s independent external auditor and is proposed to be retained. There are no disagreements with SGV regarding accounting and financial disclosure. A representative of SGV will be at the annual general meeting and will have the opportunity to make a statement if they desire to do so, and, will respond to appropriate questions. The table below summarized fees billed by SGV in the past two years:
2007 2008Audit fees 2,395,646 3,531,336 Other audit related fees 69,930 263,298 Tax services fees 425,600 300,000 Other fees 246,400 246,400 Totals 3,137,576 4,341,034
The members of the Audit Committee are Jimmy Tiu Yaokasin, Jr. (Independent Director) of the corporation as Chairman with Rosalinda Ang-Hortaleza and Maurice P. Ligot as members.

13
C. NATURE AND SCOPE OF BUSINESS
1. Business Overview
Splash Corporation (the Company) was incorporated in the Philippines and registered with the Philippine Securities and Exchange Commission (SEC) on September 30, 1991 primarily to develop, manufacture, bottle, pack, and market cosmetics and other beauty products, and pharmaceutical products in the Philippines and abroad. On November 14, 2008, the Company’s Board of Directors (BOD) approved to amend the primary purpose of the Articles of Incorporation to include the development or acquisition of technology to manufacture and sell personal care, pharmaceuticals, food, health, home, household care and other ancillary products in the Philippines and abroad.
Before the Company listed its shares of stock with the Philippine Stock Exchange (PSE), the Company was a wholly owned subsidiary of Splash Holdings, Inc. (SHI). On November 15, 2007, the Company’s shares of stock were listed and traded in the PSE. After the IPO wherein the Company offered 30% of outstanding shares (both primary and secondary) to the public, the Company became 70% owned by SHI. On December 4, 2008, the BOD approved to buy back the Company’s shares of stock totaling 30.3 million shares held by SHI. After the buyback, SHI’s ownership of the company increased from 70% to 71.17% and SHI continues to exercise control over the Company.
The Company’s registered office address is HBC Corporate Centre, 548 Mindanao Avenue corner Quirino Highway, Quezon City.
2. Products and Brands
The Company markets and sells its products and brands in the Philippines (Domestic segment) and abroad (International segment). In turn, the Company’s products and brands sold in these two segments fall under the following categories:
• Hair care – Consists of hair care products, with sales derived from the following brands: Kolours (premium hair dye), Vitress (cuticle coat), and Control (hair dressing)
• Skin care – Products positioned to provide total skin care solution through the use of potent non-herbal active ingredients. Revenues are largely generated by Maxipeel (exfoliants) and Skin White (skin whitening). These brands each generate sales in excess of P1 billion.
• Naturals – Products with active ingredients derived from natural or herbal sources. Sales result from the following brands: Biolink VCO (Virgin Coconut Oil), Biolink Tea Tree Oil, Biolink Green Papaya, Extract (calamansi, papaya, avocado and cucumber), and Baby Spa.
• Health and wellness – Consists of products with naturally-derived ingredients which promote health and general well-being. Revenues are generated by Theraherb VCO.

14
The Skin care, Hair care and Naturals categories comprise the Personal care business of the Company. The following table shows the Company’s market leadership position tracked by A.C. Nielsen across several category/brand/product lines:
Splash Brand Market Share Market Standing
Maxi-peel Exfoliant Solution 82% Market LeaderSkinwhite Lotion 29% Market Leader Extract Lotion 4% Biolink GP Lotion 1%Total Splash (Whitening Lotion) 34%Skinwhite Soap 45% Market Leader Extract Soap 6% Biolink GP Soap 4%Total Splash (Whitening Soap) 55%Extract Facial Cleanser 10% Strong Challenger Biolink GP Facial Cleanser 3% Skinwhite Toner 1%Total Splash (Facial Cleanser) 14%Kolours Hair Dye 58% Market LeaderSource: AC Nielsen Retail Audit, 31 Dec 2008
3. Marketing
The Company is positioned as a marketer of innovative personal care products. This positioning combined with an effective communication, pricing, sales and distribution strategies, provide a compelling value proposition for the Philippine mass market. Through new product launches and product reformatting, the Company keeps market excitement for its brands and product lines at high levels, resulting in market share growth. The Company uses television, radio and print advertising as well as in-store activities and promotions to communicate the benefits and features of its products to consumers. In addition to nationwide advertising programs, regional campaigns are also undertaken to increase consumer demand in specific geographic markets. The Company develops annual brand marketing plans that are based on market studies, trend analyses, focus groups, surveys, and portfolio reviews. These marketing plans go through an intensive approval process that forms part of the Company’s strategic and annual business planning cycle. Post-implementation evaluation studies are done to assess the effectiveness of the marketing initiatives and approaches.
4. Selling and Distribution
The Company’s distribution network consists of in-house and third party distributors. The Company delivers directly to strategic accounts, or what it calls the National Accounts Group (NAG). These accounts are Super Value, Inc. and Super SM (of the SM Group), Mercury Drug Inc., Watson’s, Robinson’s, HBC and IDS Philippines Inc. . For other key accounts and outlets, Splash utilizes twenty-four (24) third party distributors which are assigned specific territories.
Apart from National Accounts, Splash products are also sold to two other major trade groups: Modern Trade and General Trade. Modern Trade consists of all large accounts outside of NAG such as the Gaisano Group, Ever Gotesco, Puregold, Cherry Foodarama, and The Landmark. General Trade is composed of small retail trade outlets including groceries, stand-alone drugstores, sari-sari stores and market stalls.

15
The table below summarizes percent contribution to sales, indicating relative balance of revenue sources. The largest contributor is General Trade which accounted for 41% of sales in 2008.
2008 2007
National Accounts 28% 29% Splash Corp.Modern Trade 31% 32%General Trade 41% 39%Totals 100% 100%
Account Group
Distributors
Contribution to Total SalesServed By
In Metro Manila, South Luzon, North Luzon, and the Samar-Leyte islands, goods are delivered over land using third party service providers. For the rest of Visayas and Mindanao regions, delivery is by sea using third party service providers. The Company employs demand-based production planning and inventory management systems. Each distributor maintains an optimal level of inventory which is automatically replenished whenever inventory levels fall to re-order point. The following diagram illustrates the Company’s distribution network in the Philippines:
Internationally, the Company has established market presence in 38 countries through its distributors and local consolidators. These countries include the ASEAN counties, China/Hong Kong, Japan, Korea, India, and countries in the Middle East (United Arab Emirates and Saudi Arabia among them) and in Africa (notably Nigeria).
5. Manufacturing Facilities
The Company’s industrial plant, where substantially all of its manufacturing are conducted, is situated at F. Lazaro Street, West Canumay, Valenzuela City with an estimated lot area of 29,410 square meters and buildings with a total floor area of 20,910 square meters. The properties and structures located in the plant include the following: Production Building, Finished Goods Warehouse, the Splash Research Institute Building, Chemical Storage Building, Soap Plant, Canteen, Power House, Engineering Building, Substation, Recovery Warehouse, Guard House, Multi-purpose Hall, Alcohol Storage, and the Waste Water Treatment Plant.
Supermarkets
Department Stores GT
24 National Distributors
Splash Factory or Warehouse
Minimarts MT
Convenience Stores
Small Pharmacies
National Accounts

16
6. Manufacturing Facilities
The Company established the Splash Research Institute (SRI) to continuously develop, by employing cutting-edge technology, new products that will meet the growing needs of the personal care market. It adopted the “open innovation” concept whereby the Company collaborates with its suppliers to come up with new and better product formulations in a cost effective manner. It also developed a flexible brand and product creation process that allows it to quickly respond to changes in consumer preferences. The Company strives to have at least two (2) years worth of new products in the pipeline at any given time. SRI departments (Product Research and Development, Packaging Innovations, Product Testing and Documentation, and Skin Research) work interdependently towards creating innovative products which address the felt and latent needs of consumers.

17
D. OTHER MATTERS
1. Legal Proceedings
During the past 5 years, 2004-2008, there has been no pending Legal Proceeding, Bankruptcy petition, or conviction by final judgment, against any Director and Executive Officer of the Registrant that is material to an evaluation of their ability or integrity to become a Director or Executive Officer of the Company. Neither has any of them been subject to any Order, Judgment, or Decree, nor involved in any proceeding for violation of a Securities or Commodities law. There are pending legal cases against the Company that are being contested by the Company and its legal counsels. Management and its legal counsels believe that the final resolution of these cases will not have material effect on the financial position and operating results of the Company.
2. Vote on Certain Matters
The Board of Directors recommends a vote on the following matters: (i) Election of the seven (7) members of the Board who are indicated above. (ii) Appointment of External Auditor. (iii) The President’s Report, Annual Report and the Financial Report as of December 31,
2008 will be submitted to the stockholders for their approval. Likewise, the stockholders will be asked to confirm and ratify the resolutions or actions of the outgoing Board of Directors and the Management of the Company in 2008, on matters related to budget, cost control and cost reduction measures, and marketing strategies. The resolutions adopted by the Board in 2008 pertain to: a) Approval to sell the shares of stock of the Corporation in Professional Services, Inc.; b) Approval of Share Buy Back Program; c) Approval of the Amendment of the Articles of Incorporation by a majority of the Board
of Directors and the Stockholders; d) MOU with IDS Philippines, Inc.; e) Approval to buy back shares owned by Splash Holdings, Inc.; f) Approval for a new subsidiary in Indonesia; g) Authority to open or close bank accounts, and designation of authorized signatories;
and h) Authority to sell used motor vehicles.
(iv) Declaration of Dividends for stockholders on record as of May 20, 2009.
3. Voting Procedures
The voting procedure for election and approval of corporate action in which Stockholders’ approval will be required shall be by “viva voce” unless voting by balloting is demanded by the stockholders representing at least 20% of the outstanding capital stock entitled to vote. (i) The vote required for approval
The approval of any corporate action shall require the majority vote of all stockholders present either in person or represented by proxy in the meeting, if constituting a quorum, except the Amendment to the Articles of Incorporation which shall require two-thirds vote. For election of Directors, Section 24 of the Corporation Code shall apply.

18
(ii) The methods by which vote will be counted
Except in cases where voting by ballot is required by law, voting and counting shall be by “viva voce”. If by ballot, counting shall be supervised by external auditors.

19
SIGNATURE PAGE
After reasonable inquiry and to the best of my knowledge and belief, I certify that the information set
forth in this report is true, complete and correct. This report is signed in the City of Quezon City on May
18, 2009
By: RAMON G. TRAJANO Chief Financial Officer

20
MANAGEMENT REPORT
1. Audited Financial Statements and Interim Financial Statements
Registrant incorporates by reference the Annual Report containing the financial report of the corporation as of December 31, 2008, and other related information. Accompanying this Annual Report is the Statement of Management’s Responsibility for Financial Statements The Annual Report will be handed to stockholders together with this Information Statement and copies of the Minutes of the June 21, 2008 Annual Stockholders’ Meeting. The interim financial statements for the first quarter of 2009 are also provided.
2. Management’s Discussion and Analysis

21
Revenues Net sales in 2008 was Php3.165 million, Php154.4 million or 5.1% higher than last year. In spite of adverse economic conditions marked by record oil price increases and the global financial crisis in 2008, revenue growth was achieved by sustained marketing activities and new product introductions.
Amounts in Php 000s 2008 2007 2006
Net sales 3,165,224 3,010,832 2,399,082Change 154,392 611,750 ‐294,233 % 5.1% 25.5% ‐10.9%
The Company introduced the following new products in 2008:
• Extraderm New Generation Sunblock Cream
• Maxi-Peel Facial Cleanser
• Maxi-Peel Exfoliant Neck & Body Lotion
• Maxi-Peel Exfoliant Soap
• Maxi-Peel Exfoliant Cream
• Skin White Power Whitening Lotion
• Skin White Power Whitening Bath Soap
• Skin White Power Whitening Face Cream Powder
• Skin White Milk Soap
• Skin White Glutathione Lotion
• Skin White Glutathione Bath Soap
• Skin White Gluta Capsules
• Extract Whitening Face Cream Sales from these new products contributed 23% of revenues in 2008.

22
Business Segments and Market Performance The tables below shows shares in the domestic and international segments, broken down further by product category. The split of domestic to international sales (92% to 8%) remained unchanged in 2008 and 2007. In the core skin care category, share of domestic sales was 91% in 2008, up from 87% in 2007. This resulted from the 40% growth in domestic sales of skin care products from Php1.481 billion in 2007 to Php2.066 billion in 2008 (when Skin White and Maxi-Peel reached P1 billion in sales). For hair care, share of domestic sales was virtually relative flat year on year (98% in 2008 versus 99% in 2007)
Personal Care: Skin Care 2,066,794 91% 209,238 9% 2,276,032 100% Hair Care 511,662 98% 9,887 2% 521,549 100% Naturals 266,903 85% 46,459 15% 313,362 100% Other 8,489 100% ‐ 0% 8,489 100% Total Personal Care 2,853,848 91% 265,583 9% 3,119,431 100%Health and Wellness 45,004 98% 789 2% 45,793 100%Totals 2,898,852 92% 266,372 8% 3,165,224 100%
TotalNet Sales ‐ 2008 (Amounts in Php 000s)
Product CategoryDomestic Int'l
Personal Care: Skin Care 1,481,295 87% 213,487 13% 1,694,782 100% Hair Care 536,414 99% 7,143 1% 543,557 100% Naturals 628,519 97% 19,866 3% 648,385 100% Other 105,000 100% ‐ 0% 105,000 100% Total Personal Care 2,751,228 92% 240,496 8% 2,991,724 100%Health and Wellness 13,812 72% 5,302 28% 19,114 100%Totals 2,765,040 92% 245,798 8% 3,010,838 100%
Product CategoryNet Sales ‐ 2007 (Amounts in Php 000s)
TotalDomestic Int'l
In 2008, the lead brands of the skin care category continue to maintain market leadership as shown by market share data from AC Nielsen summarized in the preceding table (Products and Brands).
Expenses As shown by the cost summary table below, total cost and operating expenses increased by Php221 million (8.2%) to Php2.908 billion in 2008. (By comparison, total costs rose by Php535 million to Php2.687 billion in 2007). The increase in 2008 was largely due to the Php192 (15.9%) million rise in operating costs. Cost of goods sold increased by Php29 million (2%) to Php1.504 billion in 2008 Operating expenses increased in 2008 mainly as a result of the Php194 million (26.9%) rise in advertising and promotions (Php916 million in 2008) as the Company intensified its marketing and brand building initiatives in 2008. Increases in personnel costs (Php47 million:27%) and transportation and travel expenses (Php25 milllion: 37%) were largely offset by declines in other expense categories notably outside services (down Php43 million or 59.5%), and bad debts expense (lower by Php15 million or 76.3%).

23
Amounts in Php 000s 2008 2007 2006Net Sales 3,165,224 3,010,832 2,399,082 Cost of goods sold 1,504,004 1,475,161 1,093,979
% to Net sales 47.5% 49.0% 45.6%Advertising and promotions 916,440 722,013 648,145 Personnel costs 221,093 174,049 122,300 Transportation and travel 92,229 67,327 43,681 Outside services 29,250 72,136 124,682 Taxes and licenses 22,521 18,071 17,338 Rent 20,583 11,939 8,173 Depreciation and Amortization 20,477 16,278 32,151 Insurance 13,032 13,663 10,020 Communication, light and water 11,234 11,895 6,561 Membership, dues and subscriptions 5,628 7,173 1,774 Provision for doubtful accounts 4,732 19,948 3,000 Repairs and maintenance 3,849 4,257 3,200 Research and development 3,404 11,050 6,068 Supplies 2,571 7,548 5,826 Product samples and give‐aways 1,964 7,511 3,757 Others 34,668 46,535 20,729 Total operating expenses 1,403,677 1,211,395 1,057,403
% to Net sales 44.3% 40.2% 44.1%
Total COGS and expenses 2,907,680 2,686,556 2,151,382 % to Net sales 91.9% 89.2% 89.7%
Profitability Gross profit margin improved to 10.5% of sales in 2008, from 4.1% in 2007 as a result of lower costs of goods. With higher operating expenses however, operating profit margin declined to 8.1% in 2008 from 10.8% the previous year. Net income margin of 9.4% in 2008 is virtually flat to 9.3% for 2006 and 2007
Amounts in Php 000s 2008 2007 2006Net sales 3,165,224 3,010,832 2,399,082Cost of goods sold 1,504,004 1,475,161 1,093,979Gross profit 1,661,221 1,535,671 1,305,103 Margin 10.5% 4.1% 19.3%Operating expenses 1,403,677 1,211,395 1,057,403
Operating profit 257,544 324,276 247,700 Margin 8.1% 10.8% 10.3%
Net income after tax 297,734 279,271 223,607 % to net sales 9.4% 9.3% 9.3%

24
. The following two tables summarize segment profitability. The domestic business segment accounted for 90% of gross profits in 2008, unchanged from the previous two years; and delivered 67% of operating profit in 2008 and 2007.
2008 2007 2006 Domestic 1,498,467 90% 1,380,735 90% 1,175,144 90% International 162,754 10% 154,936 10% 129,959 10%Totals 1,661,221 100% 1,535,671 100% 1,305,103 100%
Business SegmentGross Profit (Amounts in Php 000s)
2008 2007 2006 Domestic 172,283 67% 217,796 67% 170,612 69% International 85,261 33% 106,480 33% 77,089 31%Totals 257,544 100% 324,276 100% 247,701 100%
Operating Profit (Amounts in Php 000s)Business Segment
Key Indicators The table which follows summarizes the Company’s key financial and market share measures. It shows that year on year, net sales grew by 5.1%; net income after tax (NIAT) improved by 6.6%; and EBITDA increased by 1.3%. EBITDA margin was 10.9% in 2008 versus 11.3% in 2007. Turnover of both trade receivables and inventory declined: 3.5 for receivables in 2008 (from 5.0 the previous year); 4.2 for inventory in 2008 (from 5.8 in 2007)
Key Indicators 2008 2007 Change
Amounts in Php millionsNet Sales 3,165.2 3,010.8 5.1%Sales of new products 736.9 482.0 52.9%Net income after tax 297.7 279.3 6.6%EBITDA 346.0 341.4 1.3% Margin 10.9% 11.3% ‐0.4%
Trade receivables turnover 3.5 5.0 ‐1.5Inventory turnover 4.2 5.8 ‐1.5
Market shares of core brands* Maxi-peel Exfoliant 82% 81% 1.0% Skin White Lotion 29% 25% 4.0% Skin White Soap 45% 36% 9.0% Extract Facial Clenser 10% 11% ‐1.0% Kolours Hair Dye 58% 49% 9.0%*Source: AC Nielsen Retail Audit, 31 Dec 2008

25
Liquidity and capital resources
The Company remains liquid with current assets more than four times current liabilities, resulting in current ratios of 4.2 and 4,4 in 2008 and 2007, respectively. Net cash flow from operations was Php321 million in 2008 compared to Php103 million in 2007, while cash flow from investing activities was Php 26 million in 2008 compared to a net outflow of Php128 million the previous year.
Total equity was relatively flat at Php2.677 billion in 2008 versus Php 2.712 billion in 2007. Debt to equity ratio was steady at 0.7 in both years.
Amounts in Php millions 2008 2007
Current assets 3,548.3 3,547.7Current liabilities 850.3 809.5 Current ratio 4.2 4.4
Cash flow from operations 320.9 103.3Cash flow from investing activities 26.4 (127.5)
Total Equity 2,676.7 2,711.8Debt to equity 0.7 0.7
3. Market Information
The Company’s common shares are traded at the Philippine Stock Exchange. The table below summarizes the monthly high, low and closing prices for the months of Q4/2008, as well as the closing share prices for the first nine months of 2008:
Q4/2008 High Low CloseOctober 6.10 3.00 3.40November 3.45 2.60 3.40December 3.65 2.70 3.00
Q1 to Q4/2008 CloseJanuary 6.30February 6.20March 5.30April 4.50May 4.80June 4.40July 3.85August 3.70September 5.60

26
4. Stockholders
The following table is a list of the top stockholders as of April 30, 2009
Rank
Stock- holder
No. Stockholder Citizenship Holdings %1 1 SPLASH HOLDINGS INC. FILIPINO 492,009,214 71.17%2 9 PCD NOMINEE CORP.(FIL.) FILIPINO 92,655,107 13.40%3 10 PCD NOMINEE CORP. (NON-FIL.) FOREIGN 104,980,500 15.19%4 483 YAO ALFREDO M. FILIPINO 599,000 0.09%5 20 ENRILE WILLIAM T. FILIPINO 320,000 0.05%6 498 COBANKIAT JOHNNY FILIPINO 111,000 0.02%7 495 GOTIANSE PAUL L. FILIPINO 100,000 0.01%8 481 BAYOG ROMEO D. FILIPINO 56,000 0.01%9 482 KHO DAVID LIMQUECO FILIPINO 50,000 0.01%
10 19 DUY WINSTON L. FILIPINO 50,000 0.01%11 479 YAO ANNIKA SHERRYN FILIPINO 50,000 0.01%12 500 QUALITY INVESTMENTS & SECURITIES CORPORATION FILIPINO 50,000 0.01%13 501 ZANTUA NILO C. FILIPINO 50,000 0.01%14 502 SOLINAP GERONIMO A. FILIPINO 30,000 0.00%15 485 REYES ANNA KARENINA E. FILIPINO 23,000 0.00%16 488 OLIVEROS FEDERICO S. JR. FILIPINO 20,000 0.00%17 497 PABLO DELLA LOUISE A. FILIPINO 15,000 0.00%18 499 GO IRENE CHAN FILIPINO 10,000 0.00%19 489 SOLOMON ANTONINA SABLAN FILIPINO 10,000 0.00%20 21 SANTOS ALFREDO M. FILIPINO 10,000 0.00%
Total Top 20 Shareholders 691,198,821 99.99%Other 91,505 0.01%Total Outstanding Shares 691,290,326 100.00%
5. Dividends
Below are details of cash dividends declared and paid in 2007 and 2008: Declaration Date Dividend per Share Amount Record Date August 31, 2007 P 1.59 P 350,000,000 August 31, 2007
June 19, 2008 P 0.18 134,308,864 May 22, 2008
Declaration and payment of dividends in the aggregate for any given year shall not exceed 50% of the Company’s net income after tax as stated in the Company’s audited financial statements for the most recent fiscal year as provided for in the negative covenants of its Floating Rate Note (FRN) Agreement.
6. Sales of unregistered securities
There were no recent sales of unregistered or exempt securities including recent issuance of securities constituting an exempt transaction.

27
7. Governance Practices
a) The Company’s Manual of Corporate Governance and the 2008 Corporate Governance Scorecard for Publicly Listed companies prepared by the Institute of Corporate Directors in collaboration with the Philippine Stock Exchange and the Securities and Exchange Commission serve as the bases of an evaluation system established by the Company to measure or determine the level of compliance of the Board of Directors and top-level management with good governance practices
b) Measures consistently undertaken by the Company to fully comply with leading practices
in good corporate governance include:
i. The offer of equitable shares of the profits or cash dividends to the shareholders; ii. The shareholders’ opportunity to elect each board member individually through voting
by ballots during the Annual General Meeting; iii. The observance of at least two (2) weeks for the notice to call shareholders for the
Annual General meeting; iv. Adequate information on the individual profile of the new directors and the returning
directors; v. Adequate public information on the Company’s ownership structure; vi. The opportunity of the shareholders to ask questions/raise issues in the Annual
General Meeting and on meetings duly constituted for the purpose; vii. The prompt disclosure to the Philippine Stock Exchange and the Securities and
Exchange Commission of material information or events occurring in the Company; viii. The provision of a retirement fund for its employees which is held in a trust fund with
Metrobank; ix. The continuous honoring of the Company’s debt agreements and timely payment of
its debt obligations; x. The recognition by the Company of its broader obligations to society and/or the
community through the projects and activities of the Splash Foundation, Inc.; xi. The existence of an internal audit operation as a separate unit in the Company
c) There has been no deviation from the Company’s Manual of Corporate Governance as of
31 December 2008. d) As the need arises or in compliance with other leading governance practices, the
Company intends to adopt other measures which will improve its corporate governance. The Company undertakes to provide without charge to each person, on the written request of any such person, a copy of its annual report on SEC Form 17-A, indicating in the copy the name and address of the requesting person.

37

38

*SGVMC308954*
Splash Corporation (A Subsidiary of Splash Holdings, Inc.)
Financial Statements December 31, 2008 and 2007 and Years Ended December 31, 2008, 2007 and 2006 and Independent Auditors’ Report SyCip Gorres Velayo & Co.

A S 0 9 1 9 6 2 0 6
SEC Registration Number
S P L A S H C O R P O R A T I O N
( A S u b s i d i a r y o f S p l a s h
H o l d i n g s , I n c . )
(Company’s Full Name)
H B C C o r p o r a t e C e n t r e
5 4 8 M i n d a n a o A v e n u e c o r n e r
Q u i r i n o H i g h w a y , Q u e z o n C i t y
(Business Address: No. Street City/Town/Province)
Mr. Ramon G. Trajano 984-5555 (Contact Person) (Company Telephone Number)
1 2 3 1 A A F S 0 4 1 9Month Day (Form Type) Month Day
(Calendar Year) (Annual Meeting)
Not Applicable (Secondary License Type, If Applicable)
Dept. Requiring this Doc. Amended Articles Number/Section Total Amount of Borrowings
153 Total No. of Stockholders Domestic Foreign
To be accomplished by SEC Personnel concerned
File Number LCU
Document ID Cashier
S T A M P S Remarks: Please use BLACK ink for scanning purposes.
COVER SHEET


SPLASH CORPORATION (A Subsidiary of Splash Holdings, Inc.) BALANCE SHEETS December 31
2008
2007(As restated,
Note 2)ASSETS Current Assets Cash and cash equivalents (Notes 4 and 15) P=1,842,075,488 P=1,975,037,566Receivables - net (Notes 5, 8, 11 and 15) 1,087,810,564 1,024,454,563 Current portion of note receivable (Notes 8 and 15) 54,215,416 50,030,502 Advances to a stockholder (Note 15) 137,370,246 137,370,246 Inventories - net (Note 6) 381,756,239 328,675,357 Prepaid expenses and other current assets (Note 7) 45,023,355 32,155,443 Total Current Assets 3,548,251,308 3,547,723,677 Noncurrent Assets Note receivable- net of current portion (Notes 8 and 15) 150,091,505 200,122,007 Property, plant and equipment - net (Note 9) 272,065,531 294,573,396 Available-for-sale investments (Note 10) 215,945,000 219,770,000 Land for development (Note 11) 141,956,454 141,956,454 Deferred income tax assets (Note 20) 33,193,965 37,045,274 Other noncurrent assets (Note 20) 56,948,398 56,422,097 Total Noncurrent Assets 870,200,853 949,889,228TOTAL ASSETS P=4,418,452,161 P=4,497,612,905 LIABILITIES AND EQUITY Current Liabilities Accounts payable and accrued expenses (Note 12) P=803,343,598 P=762,491,968 Current portion of floating rate notes payable (Note 13) 46,923,404 46,990,002 Total Current Liabilities 850,267,002 809,481,970 Noncurrent Liabilities Floating rate notes payable - net of current portion (Note 13) 891,503,397 938,426,801 Retirement benefits liability (Note 18) – 37,930,101 Total Noncurrent Liabilities 891,503,397 976,356,902 Total Liabilities 1,741,770,399 1,785,838,872 Equity (Note 14) Capital stock 746,160,357 746,160,357Additional paid-in capital 1,676,712,406 1,676,712,406 Unrealized valuation gain on available-for-sale investments (Note 10) 718,100 4,543,100 Cumulative actuarial gain (loss) on defined benefit plan (Note 2) 13,962,294 (27,524,027)Treasury stock (236,178,536) – Retained earnings (Note 2) 475,307,141 311,882,197Total Equity 2,676,681,762 2,711,774,033 TOTAL LIABILITIES AND EQUITY P=4,418,452,161 P=4,497,612,905 See accompanying Notes to Financial Statements.

SPLASH CORPORATION (A Subsidiary of Splash Holdings, Inc.) STATEMENTS OF RECOGNIZED INCOME AND EXPENSE FOR THE YEARS ENDED DECEMBER 31, 2008, 2007 AND 2006 December 31 2008 2007 2006
Actuarial gain (loss) on defined benefit plan (Notes 2, 18 and 22) P=73,227,686 (P=6,524,288) (P=27,957,832)Adjustment on asset ceiling (Notes 18 and 22) (21,454,563) – –Effect of deferred income tax (10,286,802) (1,512,917) 9,835,789Net actuarial gain (loss) on defined benefit plan
and adjustment on asset ceiling 41,486,321 (8,037,205) (18,122,043)Unrealized gain (loss) on available-for-sale
investments (3,825,000) 5,520,000 1,400,000
NET INCOME (EXPENSE) RECOGNIZED DIRECTLY IN EQUITY 37,661,321 (2,517,205) (16,722,043)
NET INCOME FOR THE YEAR 297,733,808 279,270,860 223,606,843
TOTAL RECOGNIZED NET INCOME FOR THE YEAR P=335,395,129 P=276,753,655 P=206,884,800
See accompanying Notes to Financial Statements.

SPLASH CORPORATION (A Subsidiary of Splash Holdings, Inc.) STATEMENTS OF INCOME Years Ended December 31
2008
2007 (As restated,
Note 2)
2006 (As restated,
Note 2)
NET SALES (Notes 11 and 15) P=3,165,224,133 P=3,010,832,030 P=2,399,082,430
COST OF GOODS SOLD (Notes 11 and 16) 1,504,003,578 1,475,161,239 1,093,979,127
GROSS PROFIT 1,661,220,555 1,535,670,791 1,305,103,303
OPERATING EXPENSES (Note 17)
(1,403,676,775)
(1,211,395,081)
(1,057,402,607)
INTEREST INCOME (Notes 4, 8, 15 and 19)
96,206,842
36,022,712
2,580,950
INTEREST EXPENSE (Notes 13 and 19) (73,015,901) (74,509,990) (62,655,776)
OTHER INCOME (CHARGES) Foreign exchange gain (loss) - net (Note 7) 14,515,826 (14,836,325) (7,330,087)Provision for probable loss (Note 27) (12,000,000) – – Reversal of excess provision (Note 12) – – 60,461,525 Others 13,583,176 7,619,896 3,328,078
INCOME BEFORE INCOME TAX 296,833,723 278,572,003 244,085,386
PROVISION FOR (BENEFIT FROM) INCOME TAX (Note 20)
(900,085)
(698,857)
20,478,543
NET INCOME P=297,733,808 P=279,270,860 P=223,606,843
Earnings Per Share (Note 23) P=0.40 P=0.98 P=2.08 See accompanying Notes to Financial Statements.

SPLASH CORPORATION (A Subsidiary of Splash Holdings, Inc.) STATEMENTS OF CASH FLOWS Years Ended December 31 2008 2007 2006 CASH FLOWS FROM OPERATING ACTIVITIES Income before income tax P=296,833,723 P=278,572,003 P=244,085,386 Adjustments for: Interest income (Note 19) (96,206,842) (36,022,712) (2,580,950) Interest expense (Note 19) 73,015,901 74,509,990 62,655,776 Depreciation and amortization (Notes 9 and 17) 47,348,669 50,731,775 78,113,226 Provision for probable loss 12,000,000 – – Unrealized foreign exchange loss (gain) (9,010,630) 12,220,520 1,040,176 Dividend income (3,785,844) – – Gain on sale of property and equipment (2,109,119) (814,489) (736,742) Reversal of excess provision (Note 12) – – (60,461,525)Operating income before working capital changes 318,085,858 379,197,087 322,115,347 Decrease (increase) in: Receivables (54,600,894) (329,449,802) (179,231,185) Inventories (53,080,882) (146,216,699) 60,270,048 Prepaid expenses and other current assets (2,280,625) (49,497,453) 4,540,752 Increase (decrease) in: Accounts payable and accrued expenses 22,557,793 274,989,605 (34,433,608) Retirement benefits liability (Note 18) 13,843,022 (15,593,621) (120,328)Net cash generated from operations 244,524,272 113,429,117 173,141,026 Interest received 92,456,323 3,756,502 2,580,950 Income taxes paid (16,122,695) (13,918,678) (19,514,404)Net cash flows from operating activities 320,857,900 103,266,941 156,207,572 CASH FLOWS FROM INVESTING ACTIVITIES Collection of note receivable (Note 8) 45,845,588 – – Additions to property, plant and equipment (Note 9) (24,887,804) (20,585,127) (2,901,900)Dividends received 3,785,844 – – Increase in other noncurrent assets (526,300) (1,175,477) (665,880)Proceeds from sale of property and equipment 2,156,119 1,424,276 1,067,375Cash advances to a stockholder – (117,012,421) (52,986,905)Decrease in other investments – 9,835,205 – Net cash flows from (used in) investing activities 26,373,447 (127,513,544) (55,487,310)CASH FLOWS FROM FINANCING ACTIVITIES Acquisition of treasury stock (Note 14) (236,178,536) – – Payments of: Dividends (134,308,864) (350,000,000) – Interest (66,642,984) (70,431,990) (62,655,776) Floating rate notes (46,990,002) – – Bank loans – (640,000,000) (220,000,000)Proceeds from issuance of capital stock - net (Note 14) – 2,058,182,348 – Proceeds from availment of: Floating rate notes – 985,416,803 433,500,000 Bank loans – 280,000,000 270,000,000 Payment of long-term debt – (367,173,612) (499,826,389)Net cash flows from (used in) financing activities (484,120,386) 1,895,993,549 (78,982,165)EFFECT OF EXCHANGE RATE CHANGES ON CASH AND CASH EQUIVALENTS 3,926,961
(8,569,832) (137,747)
NET INCREASE (DECREASE) IN CASH AND CASH EQUIVALENTS (132,962,078)
1,863,177,114 21,600,350
CASH AND CASH EQUIVALENTS AT BEGINNING OF YEAR 1,975,037,566
111,860,452 90,260,102
CASH AND CASH EQUIVALENTS AT END OF YEAR (Notes 4 and 15) P=1,842,075,488 P=1,975,037,566 P=111,860,452 See accompanying Notes to Financial Statements.

SPLASH CORPORATION (A Subsidiary of Splash Holdings, Inc.) NOTES TO FINANCIAL STATEMENTS 1. Corporate Information General Splash Corporation (the Company) was incorporated in the Philippines and registered with the
Philippine Securities and Exchange Commission (SEC) on September 30, 1991 primarily to develop, manufacture, bottle, pack, and market cosmetics and other beauty products, and pharmaceutical products in the Philippines and abroad. On March 4, 2009, the SEC approved the Company’s amendment of the primary purpose of the Articles of Incorporation to include the development or acquisition of technology to manufacture and sell personal care, pharmaceuticals, food, health, home, household care and other ancillary products in the Philippines and abroad. Before the Company listed its shares of stock with the Philippine Stock Exchange (PSE) on November 15, 2007, the Company is a wholly-owned subsidiary of Splash Holdings, Inc. (SHI).
On November 15, 2007, the Company’s shares of stock were listed and traded in the PSE. After
the Initial Public Offering (IPO) wherein the Company offered 30% of its outstanding shares (both primary and secondary) to the public, the Company became 70%-owned by SHI. On December 4, 2008, the BOD approved to buyback the Company’s shares of stock totalling 30.30 million shares held by SHI (see Note 14f). After the buyback, SHI’s ownership in the Company increased from 70% to 71.17%, and SHI continues to exercise control over the Company (see Note 14).
The Company’s registered office address is HBC Corporate Centre, 548 Mindanao Avenue corner Quirino Highway, Quezon City.
The accompanying financial statements were authorized for issuance by the BOD on April 14, 2009.
2. Summary of Significant Accounting and Financial Reporting Policies
Basis of Financial Statement Preparation The accompanying financial statements have been prepared under the historical cost basis, except for derivative financial instruments and available-for-sale (AFS) financial assets which have been measured at fair value. The financial statements are presented in Philippine peso, which is the Company’s functional currency.
Statement of Compliance The Company’s financial statements have been prepared in conformity with Philippine Financial Reporting Standards (PFRS).
Changes in Accounting Policies and Disclosures The accounting policies adopted are consistent with those of the previous financial year, except for the following: • PFRS 8, Operating Segments. The Company early adopted PFRS 8 which will become
effective on January 1, 2009. PFRS 8 replaces PAS 14, Segment Reporting, and adopts a full management approach to identifying, measuring and disclosing the results of an entity’s

- 2 -
operating segments. The information reported is that which management uses internally for evaluating the performance of operating segments and allocating resources to those segments. Such information may be different from that reported in the balance sheet and statement of income, and the Company will provide explanations and reconciliations of the differences, if any. The adoption of this standard resulted in a change in the reportable segments from business segments consisting of naturals, skin care and hair care to geographical areas where the Company’s products are sold. Comparatives for 2007 and 2006 have been restated. The changes of disclosures relating to segment information are fully discussed in Note 21 to the financial statements.
• In 2008, the Company changed its accounting policy for actuarial gains or losses from
immediate recognition as income or expense to full recognition directly in equity under the statement of recognized income and expense (SORIE). This is to align the Company’s accounting policy with comparable companies within the industry.
The change in accounting policy was accounted for retroactively which resulted in the following:
Increase (Decrease)
December 31,
2007December 31,
2006 January 1,
2006 Retained earnings P=8,037,205 P=18,122,043 P=1,364,779 Actuarial loss on defined benefit plan 8,037,205 18,122,043 1,364,779 Retirement benefits cost (6,524,288) (27,957,832) – Provision for income tax - deferred (1,512,917) 9,835,789 –
Additional disclosures required as a result of the change in accounting policy were made in the financial statements (see Notes 18 and 22).
The following Philippine Interpretations International Financial Reporting Interpretations Committee (IFRIC) interpretations which became effective on January 1, 2008 and an amendment to an existing Philippine Accounting Standard (PAS) that became effective on July 1, 2008 are determined by management to be not relevant and not applicable to the Company. • Philippine Interpretation IFRIC 11, PFRS 2, Group and Treasury Share Transactions
This Interpretation addresses issues relating to whether transactions should be accounted for as equity-settled or as cash-settled under PFRS 2 and issues concerning share-based payment arrangement involving entities within the same group. The Company has no share-based payments.
• Philippine Interpretation IFRIC 12, Service Concession Arrangements
This Interpretation applies to contractual arrangements whereby a private sector party participates in the development, financing, operation and maintenance of infrastructure for public sector services. The Company has no service concession arrangements.
• Philippine Interpretation IFRIC 14, PAS 19 - The Limit on a Defined Benefit Asset, Minimum Funding Requirements and their Interaction Philippine Interpretation IFRIC 14 addresses how to assess the limit under PAS 19, Employee Benefits, on the amount of the pension scheme surplus that can be recognized as an asset in balance sheet, in particular, when a minimum funding requirement exists. This Interpretation has no impact on the Company’s financial statements.

- 3 -
• Amendments to PAS 39, Financial Instruments: Recognition and Measurement, and PFRS 7, Financial Instruments: Disclosures - Reclassification of Financial Assets Entities are not permitted to reclassify financial assets in accordance with the amendments before July 1, 2008. Any reclassification of a financial asset made in periods beginning on or after November 15, 2008 will take effect only from the date the reclassification is made. The amendments to PAS 39 permit an entity to: (1) reclassify non-derivative financial assets (other than those designated at fair value through profit or loss by the entity upon initial recognition) out of the fair value through profit or loss category if the financial asset is no longer held for the purpose of selling or repurchasing it in the near term in particular circumstances; and (2) transfer from the available-for-sale category to the loans and receivables category a financial asset that would have met the definition of loans and receivables (if the financial asset had not been designated as available-for-sale), if the entity has the intention and ability to hold that financial asset for the foreseeable future. This amendment had no impact on the Company’s financial statements.
New Accounting Standards, Interpretations and Amendments to
Existing Standards Effective Subsequent to December 31, 2008 The Company will adopt the following standards, amendment to existing standard and Interpretations enumerated below when these become effective. Except as otherwise indicated, the Company does not expect the adoption of these new and amended PFRS and Philippine Interpretations to have significant impact on its financial statements.
Effective in 2009
• PFRS 1, First-time Adoption of Philippine Financial Reporting Standards - Cost of an Investment in a Subsidiary, Jointly Controlled Entity or Associate The amended PFRS 1 allows an entity, in its separate financial statements, to determine the cost of investments in subsidiaries, jointly controlled entities or associates (in its opening PFRS financial statements) as one of the following amounts: a) cost determined in accordance with PAS 27; b) at the fair value of the investment at the date of transition to PFRS, determined in accordance with PAS 39; or c) previous carrying amount (as determined under generally accepted accounting principles) of the investment at the date of transition to PFRS.
• PFRS 2, Share-based Payment - Vesting Condition and Cancellations The standard has been revised to clarify the definition of a vesting condition and prescribes the treatment for an award that is effectively cancelled. It defines a vesting condition as a condition that includes an explicit or implicit requirement to provide services. It further requires non-vesting conditions to be treated in a similar fashion to market conditions. Failure to satisfy a non-vesting condition that is within the control of either the entity or the counterparty is accounted for as cancellation. However, failure to satisfy a non-vesting condition that is beyond the control of either party does not give rise to a cancellation.
• Amendments to PAS 1, Presentation of Financial Statements
These Amendments introduce a new statement of comprehensive income that combines all items of income and expenses recognized in the profit or loss together with “other comprehensive income” (OCI). Entities may choose to present all items in one statement, or to present two linked statements, a separate statement of income and a statement of comprehensive income. These amendments also require additional requirements in the presentation of the balance sheet and owner’s equity as well as additional disclosures to be included in the financial statements.
- 4 -
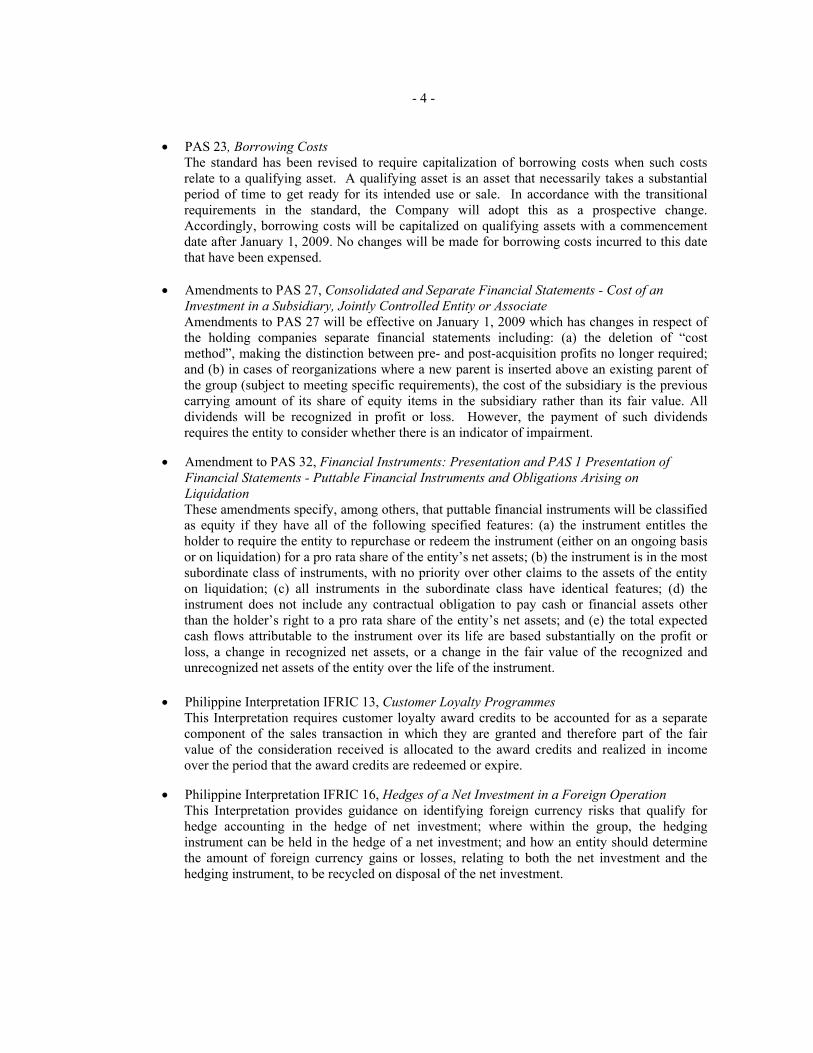
• PAS 23, Borrowing Costs
The standard has been revised to require capitalization of borrowing costs when such costs relate to a qualifying asset. A qualifying asset is an asset that necessarily takes a substantial period of time to get ready for its intended use or sale. In accordance with the transitional requirements in the standard, the Company will adopt this as a prospective change. Accordingly, borrowing costs will be capitalized on qualifying assets with a commencement date after January 1, 2009. No changes will be made for borrowing costs incurred to this date that have been expensed.
• Amendments to PAS 27, Consolidated and Separate Financial Statements - Cost of an
Investment in a Subsidiary, Jointly Controlled Entity or Associate Amendments to PAS 27 will be effective on January 1, 2009 which has changes in respect of the holding companies separate financial statements including: (a) the deletion of “cost method”, making the distinction between pre- and post-acquisition profits no longer required; and (b) in cases of reorganizations where a new parent is inserted above an existing parent of the group (subject to meeting specific requirements), the cost of the subsidiary is the previous carrying amount of its share of equity items in the subsidiary rather than its fair value. All dividends will be recognized in profit or loss. However, the payment of such dividends requires the entity to consider whether there is an indicator of impairment.
• Amendment to PAS 32, Financial Instruments: Presentation and PAS 1 Presentation of
Financial Statements - Puttable Financial Instruments and Obligations Arising on Liquidation These amendments specify, among others, that puttable financial instruments will be classified as equity if they have all of the following specified features: (a) the instrument entitles the holder to require the entity to repurchase or redeem the instrument (either on an ongoing basis or on liquidation) for a pro rata share of the entity’s net assets; (b) the instrument is in the most subordinate class of instruments, with no priority over other claims to the assets of the entity on liquidation; (c) all instruments in the subordinate class have identical features; (d) the instrument does not include any contractual obligation to pay cash or financial assets other than the holder’s right to a pro rata share of the entity’s net assets; and (e) the total expected cash flows attributable to the instrument over its life are based substantially on the profit or loss, a change in recognized net assets, or a change in the fair value of the recognized and unrecognized net assets of the entity over the life of the instrument.
• Philippine Interpretation IFRIC 13, Customer Loyalty Programmes This Interpretation requires customer loyalty award credits to be accounted for as a separate component of the sales transaction in which they are granted and therefore part of the fair value of the consideration received is allocated to the award credits and realized in income over the period that the award credits are redeemed or expire.
• Philippine Interpretation IFRIC 16, Hedges of a Net Investment in a Foreign Operation
This Interpretation provides guidance on identifying foreign currency risks that qualify for hedge accounting in the hedge of net investment; where within the group, the hedging instrument can be held in the hedge of a net investment; and how an entity should determine the amount of foreign currency gains or losses, relating to both the net investment and the hedging instrument, to be recycled on disposal of the net investment.

- 5 -
Improvements to PFRS In May 2008, the International Accounting Standards Board issued its first omnibus of amendments to certain standards, primarily with a view to removing inconsistencies and clarifying wording. There are separate transitional provisions for each standard:
Effective in 2009
• PFRS 5, Non-current Assets Held for Sale and Discontinued Operations When a subsidiary is held for sale, all of its assets and liabilities will be classified as held for
sale under PFRS 5, even when the entity retains a non-controlling interest in the subsidiary after the sale.
• PAS 1, Presentation of Financial Statements Assets and liabilities classified as held for trading are not automatically classified as current in
the balance sheet.
• PAS 16, Property, Plant and Equipment The amendment replaces the term “net selling price” with “fair value less costs to sell”, to be
consistent with PFRS 5, Non-current Assets Held for Sale and Discontinued Operations and PAS 36, Impairment of Assets.
Items of property, plant and equipment held for rental that are routinely sold in the ordinary course of business after rental, are transferred to inventory when rental ceases and they are held for sale. Proceeds of such sales are subsequently shown as revenue. Cash payments on initial recognition of such items, the cash receipts from rents and subsequent sales are all shown as cash flows from operating activities.
• PAS 19, Employee Benefits Revises the definition of “past service costs” to include reductions in benefits related to past
services (“negative past service costs”) and to exclude reductions in benefits related to future services that arise from plan amendments. Amendments to plans that result in a reduction in benefits related to future services are accounted for as a curtailment.
Revises the definition of “return on plan assets” to exclude plan administration costs if they
have already been included in the actuarial assumptions used to measure the defined benefit obligation.
Revises the definition of “short-term” and “other long-term” employee benefits to focus on the
point in time at which the liability is due to be settled. Deletes the reference to the recognition of contingent liabilities to ensure consistency with
PAS 37, Provisions, Contingent Liabilities and Contingent Assets.
• PAS 20, Accounting for Government Grants and Disclosures of Government Assistance Loans granted with no or low interest rates will not be exempt from the requirement to impute
interest. The difference between the amount received and the discounted amount is accounted for as a government grant.
• PAS 23, Borrowing Costs Revises the definition of borrowing costs to consolidate the types of items that are considered
components of “borrowing costs”, i.e., components of the interest expense calculated using the effective interest rate method.

- 6 -
• PAS 28, Investment in Associates If an associate is accounted for at fair value in accordance with PAS 39, only the requirement
of PAS 28 to disclose the nature and extent of any significant restrictions on the ability of the associate to transfer funds to the entity in the form of cash or repayment of loans applies. An investment in an associate is a single asset for the purpose of conducting the impairment test. Therefore, any impairment test is not separately allocated to the goodwill included in the investment balance.
• PAS 29, Financial Reporting in Hyperinflationary Economies Revises the reference to the exception that assets and liabilities should be measured at
historical cost, such that it notes property, plant and equipment as being an example, rather than implying that it is a definitive list.
• PAS 31, Interest in Joint ventures If a joint venture is accounted for at fair value, in accordance with PAS 39, only the
requirements of PAS 31 to disclose the commitments of the venturer and the joint venture, as well as summary financial information about the assets, liabilities, income and expense will apply.
• PAS 36, Impairment of Assets When discounted cash flows are used to estimate “fair value less cost to sell” additional
disclosure is required about the discount rate, consistent with disclosures required when the discounted cash flows are used to estimate “value in use”.
• PAS 38, Intangible Assets Expenditure on advertising and promotional activities is recognized as an expense when the
Company either has the right to access the goods or has received the services. Advertising and promotional activities now specifically include mail order catalogues.
Deletes references to there being rarely, if ever, persuasive evidence to support an
amortization method for finite life intangible assets that results in a lower amount of accumulated amortization than under the straight-line method, thereby effectively allowing the use of the unit of production method.
• PAS 39, Financial Instruments: Recognition and Measurement Changes in circumstances relating to derivatives - specifically derivatives designated or de-
designated as hedging instruments after initial recognition - are not reclassifications. When financial assets are reclassified as a result of an insurance company changing its
accounting policy in accordance with paragraph 45 of PFRS 4, Insurance Contracts, this is a change in circumstance, not a reclassification.
Removes the reference to a “segment” when determining whether an instrument qualifies as a
hedge. Requires use of the revised effective interest rate (rather than the original effective interest
rate) when re-measuring a debt instrument on the cessation of fair value hedge accounting.

- 7 -
• PAS 40, Investment Properties Revises the scope (and the scope of PAS 16, Property, Plant and Equipment) to include
property that is being constructed or developed for future use as an investment property. Where an entity is unable to determine the fair value of an investment property under construction, but expects to be able to determine its fair value on completion, the investment under construction will be measured at cost until such time as fair value can be determined or construction is complete.
• PAS 41, Agriculture Removes the reference to the use of a pre-tax discount rate to determine fair value, thereby
allowing use of either a pre-tax or post-tax discount rate depending on the valuation methodology used.
Removes the prohibition to take into account cash flows resulting from any additional
transformations when estimating fair value. Instead, cash flows that are expected to be generated in the “most relevant market” are taken into account.
Effective in 2010
• Revised PFRS 3, Business Combinations and PAS 27, Consolidated and Separate Financial Statements
The revised PFRS 3 introduces a number of changes in the accounting for business combinations that will impact the amount of goodwill recognized, the reported results in the period that an acquisition occurs, and future reported results. The revised PAS 27 requires, among others, that (a) change in ownership interests of a subsidiary (that do not result in loss of control) will be accounted for as an equity transaction and will have no impact on goodwill nor will it give rise to a gain or loss; (b) losses incurred by the subsidiary will be allocated between the controlling and non-controlling interests (previously referred to as ‘minority interests’); even if the losses exceed the non-controlling equity investment in the subsidiary; and (c) on loss of control of a subsidiary, any retained interest will be remeasured to fair value and this will impact the gain or loss recognized on disposal. The changes introduced by the revised PFRS 3 and PAS 27 must be applied prospectively and will affect future acquisitions and transactions with non-controlling interests.
• Amendment to PAS 39, Financial Instruments: Recognition and Measurement - Eligible Hedged Items
Amendment to PAS 39 will be effective on July 1, 2009, which addresses only the designation of a one-sided risk in a hedged item, and the designation of inflation as a hedged risk or portion in particular situations. The amendment clarifies that an entity is permitted to designate a portion of the fair value changes or cash flow variability of a financial instrument as a hedged item.
Effective in 2012
• Philippine Interpretation IFRIC 15, Agreement for Construction of Real Estate This Interpretation covers accounting for revenue and associated expenses by entities that undertake the construction of real estate directly or through subcontractors. This Interpretation requires that revenue on construction of real estate be recognized only upon completion, except when such contract qualifies as construction contract to be accounted for under

- 8 -
PAS 11, Construction Contracts, or involves rendering of services in which case revenue is recognized based on stage of completion. Contracts involving provision of services with the construction materials and where the risks and reward of ownership are transferred to the buyer on a continuous basis, will also be accounted for based on stage of completion.
Cash and Cash Equivalents
Cash includes cash on hand and in banks. Cash equivalents are short-term, highly liquid investments that are readily convertible to known amounts of cash with original maturities of three months or less from dates of acquisition and that are subject to an insignificant risk of changes in value. Financial Assets and Financial Liabilities
Date of recognition The Company recognizes a financial asset or a financial liability in the balance sheet when it
becomes a party to the contractual provisions of the instrument. In the case of a regular way purchase or sale of financial assets, recognition and derecognition, as applicable, is done using settlement date accounting. Regular way purchases or sales are purchases or sales of financial assets that require delivery of assets within the period generally established by regulation or convention in the market place.
Initial recognition of financial instruments All financial assets and financial liabilities are recognized initially at fair value. Except for financial instruments measured at fair value through profit or loss (FVPL), the initial measurement of all financial assets includes transaction costs. The Company classifies its financial assets in the following categories: financial assets at FVPL, loans and receivables, held-to-maturity (HTM) investments and AFS investments. The Company also classifies its financial liabilities into financial liabilities at FVPL and other financial liabilities. The classification depends on the purpose for which the investments were acquired and whether they are quoted in an active market. The Company determines the classification of its financial assets at initial recognition and, where allowed and appropriate, re-evaluates such designation at every reporting date.
As of December 31, 2008 and 2007, the Company has no financial instruments classified as HTM investments.
Financial instruments are classified as liabilities or equity in accordance with the substance of the contractual arrangement. Interest, dividends, gains and losses relating to a financial instrument or a component that is a financial liability, are reported as expense or income. Distributions to holders of financial instruments classified as equity are charged directly to equity, net of any related income tax benefits. Determination of fair value The fair value of financial instruments that are actively traded in organized financial market is determined by reference to quoted market bid prices at the close of business at the balance sheet date. When the current bid and asking prices are not available, the price of the most recent transaction provides evidence of the current fair value as long as there has not been a significant change in economic circumstances since the time of the transaction.
For all other financial instruments not listed in an active market, the fair value is determined by using appropriate valuation methodologies. Valuation methodologies include net present value techniques, comparison to similar instrument for which market observable prices exist and other relevant valuation models.

- 9 -
Day 1 profit Where the transaction price in a non-active market is different from the fair value from other observable current market transactions in the same instrument or based on a valuation technique whose variables include only data from observable market, the Company recognizes the difference between the transaction price and fair value (a Day 1 profit) in the statement of income, unless it qualifies for recognition as some other type of asset. In cases where use of data is made which are not observable, the difference between the transaction price and model value is only recognized in the statement of income when the inputs become observable or when the instrument is derecognized. For each transaction, the Company determines the appropriate method of recognizing the “Day 1” profit amount. Financial assets and financial liabilities at FVPL
Financial assets and financial liabilities at FVPL include financial assets and liabilities held for trading purposes, derivative financial instruments or those financial assets and liabilities designated upon initial recognition as at FVPL. Financial assets and financial liabilities are classified as held for trading if they are acquired for the purpose of selling or repurchasing in the near term. Derivative instruments, including separated embedded derivatives are also classified as held for trading unless they are designated as effective hedging instruments in hedge accounting or a financial guarantee contract.
Financial assets and financial liabilities may be designated at initial recognition as at FVPL if any of the following criteria are met: • the designation eliminates or significantly reduces the inconsistent treatment that would
otherwise arise from measuring the assets or liabilities or recognizing gains or losses on a different basis; or
• the assets and liabilities are part of a group of financial assets, financial liabilities or both which are managed and their performance are evaluated on a fair value basis in accordance with a documented risk management or investment strategy; or
• the financial instrument contains an embedded derivative, unless the embedded derivative does not significantly modify the cash flows or it is clear, with little or no analysis, that it would not be separately recorded.
Financial assets and financial liabilities at FVPL are recorded in the balance sheet at fair value. Changes in fair value are accounted for in the statement of income. Interest earned or incurred is recorded as interest income or expense, respectively. Dividend income is recorded in other income when the right to receive payment has been established.
The Company’s embedded derivative is included under this category.
Embedded Derivative
An embedded derivative is separated from the host contract and accounted for as a derivative if all of the following conditions are met: a) the economic characteristics and risks of the embedded derivative are not closely related to the economic characteristics and risks of the host contract; b) a separate instrument with the same terms as the embedded derivative would meet the definition of a derivative; and c) the hybrid or combined instrument is not recognized at FVPL.
The Company assesses whether embedded derivatives are required to be separated from the host
contracts when the Company first becomes a party to the contract. Subsequent reassessment is prohibited unless there is a change in the terms of the contract that significantly modifies the cash flows that otherwise would be required under the contract, in which case reassessment is required.

- 10 -
The Company determines whether a modification to cash flows is significant by considering the extent to which the expected future cash flows associated with the embedded derivative, the host contract or both have changed and whether the change is significant relative to the previously expected cash flows on the contract. The Company has identified certain contracts with embedded third-currency derivatives (see Notes 7 and 25).
Loans and receivables Loans and receivables are non-derivative financial assets with fixed or determinable payments that are not quoted in an active market. After initial recognition measurement, such assets are subsequently carried at amortized cost using the effective interest method, less any allowance for impairment losses. Amortized cost is calculated by taking into account any discount or premium on acquisition and fees that are an integral part of the effective interest rate. Gains and losses are recognized in the statement of income when the loans and receivables are derecognized or impaired, as well as through the amortization process. Loans and receivables are included in current assets if maturity is within 12 months of the balance sheet date. Otherwise, these are classified as noncurrent assets (see Notes 5 and 8).
The Company’s cash and cash equivalents, receivables, note receivable and advances to a
stockholder are classified under this category. AFS investments AFS investments are non-derivative financial assets that are designated as such or do not qualify
to be classified as designated as at FVPL, loans and receivables or HTM investments. They are purchased and held indefinitely, and may be sold in response to liquidity requirements or changes in market conditions.
After initial recognition, the Company measures its AFS investments at fair value with gains or
losses being recognized as a separate component of equity under “Unrealized Valuation Gain on Available-for-Sale Investments” until the investment is derecognized or until the investment is determined to be impaired at which time the cumulative gain or loss previously reported in equity is included in the statement of income. These financial assets are classified as noncurrent assets unless there is intention to dispose such assets within 12 months of the balance sheet date.
When the fair value of AFS investments cannot be measured reliably because of lack of reliable
estimates of future cash flows and discount rates necessary to calculate the fair value of unquoted equity instruments, these investments are carried at cost, less any allowance for impairment losses.
When the security is disposed of, the cumulative gain or loss previously recognized in equity is
recognized in the statement of income. Where the Company holds more than one investment in the same security, these are deemed to be disposed of on a first-in-first-out basis. Interest earned on the AFS investment is reported as interest income using the effective interest rate. Dividends earned are recognized on the statement of income when the right to receive payment is established. The losses arising from impairment investments are recognized in the statement of income.
The Company’s AFS investments consist of investments in quoted and unquoted equity shares and
are classified under noncurrent assets (see Note 10).

- 11 -
Other financial liabilities This category pertains to financial liabilities that are not held for trading or designated as at FVPL upon the inception of the liability. These include liabilities arising from operations (e.g. accounts payable and accrued liabilities) and loans and borrowings. All loans and borrowings are initially recognized at fair value less debt issue costs associated with the borrowings.
After initial recognition, interest-bearing loans and borrowings are subsequently measured at amortized cost using the effective interest method. Amortized cost is calculated by taking into account any discount or premium on the issue and debt issue costs that are an integral part of the effective interest rate. Gains and losses are recognized in profit or loss when the liabilities are derecognized as well as through the amortization process. The Company’s other financial liabilities consist of accounts payable and accrued expenses and floating-rate notes payable (see Notes 12 and 13). Impairment of Financial Assets The Company assesses at each balance sheet date whether there is objective evidence that a financial asset or group of financial assets may be impaired. A financial asset or group of financial assets is deemed to be impaired if, and only if, there is objective evidence of impairment as a result of one or more events that has occurred after the initial recognition of the asset (an incurred “loss event”) and that loss event or events has an impact on the estimated future cash flows of the financial asset or group of financial assets that can be reliably estimated. Objective evidence of impairment may include indications that the borrower is experiencing significant financial difficulty, default or delinquency in payments, the probability that they will enter bankruptcy or other financial reorganization and where observable data indicate that there is measurable decrease in the estimated future cash flows, such as changes in arrears or economic conditions that correlate with defaults.
Assets carried at amortized cost If there is objective evidence that an impairment loss on loans and receivables carried at amortized cost has been incurred, the amount of the loss is measured as the difference between the asset’s carrying amount and the present value of estimated future cash flows (excluding future credit losses that have not been incurred) discounted at the financial asset’s original effective interest rate (i.e. the effective interest rate computed at initial recognition). The carrying amount of the asset shall be reduced either directly or through the use of an allowance account. The amount of the loss shall be recognized in the statement of income. Loans and receivables, together with the associated allowance accounts, are written off when there is no realistic prospect of future recovery. The Company first assesses whether objective evidence of impairment exists individually for financial assets that are individually significant, and individually or collectively for financial assets that are not individually significant. If it is determined that no objective evidence of impairment exists for an individually assessed financial asset, whether significant or not, the asset is included in a group of financial assets with similar credit risk characteristics and that group of financial assets is collectively assessed for impairment. Assets that are individually assessed for impairment and for which an impairment loss is or continues to be recognized are not included in a collective assessment of impairment. If, in a subsequent period, the amount of the impairment loss decreases and the decrease can be related objectively to an event occurring after the impairment was recognized, the previously recognized impairment loss will be reversed. Any subsequent reversal of an impairment loss is recognized in the statement of income, to the extent that the carrying value of the asset does not exceed its amortized cost at the reversal date.

- 12 -
With respect to receivables, the Company performs a regular review of the age and status of these accounts, designed to identify accounts with objective evidence of impairment and provide the appropriate allowance for impairment losses. The review is accomplished using a combination of specific and collective assessment approaches, with the impairment losses being determined for each risk grouping identified by the Company.
AFS investments carried at fair value For AFS investment, the Company assesses at each balance sheet whether there is objective evidence that an investment is impaired. If an AFS investment carried at fair value is impaired, an amount comprising the difference between its cost and its current fair value, less any impairment loss previously recognized in the statement of income, is transferred from equity to the statement of income. In the case of equity investment classified as AFS investments, objective evidence of impairment would include a significant or prolonged decline in the fair value of the investments below its cost. Reversals of impairment losses in respect of equity instruments classified as AFS are not recognized in the statement of income.
Assets carried at cost If there is objective evidence that an impairment loss has been incurred in an unquoted equity instrument that is not carried at fair value because fair value cannot be reliably measured, or on a derivative asset that is linked to and must be settled by delivery of such an unquoted equity instrument, the amount of the loss is measured as the difference between the asset’s carrying amount and the present value of the estimated future cash flows discounted at the current market rate of return for a similar financial asset.
Renegotiated receivables
The Company seeks to restructure receivables rather than to take further legal actions. This involves extending the payment arrangements and the arrangement of the new receivable conditions. Once the terms have been renegotiated, the receivables are no longer considered past due. Management continuously reviews renegotiated receivables to ensure that future payments are likely to occur. The receivables continue to be subject to individual or collective impairment assessment.
Derecognition of Financial Assets and Financial Liabilities
Financial assets A financial asset (or, where applicable a part of a financial asset or part of a group of similar financial assets) is derecognized where:
a. the right to receive cash flows from the asset has expired; b. the Company retains the right to receive cash flows from the asset, but has assumed an
obligation to pay them in full without material delay to a third party under a ‘pass-through’ arrangement; or
c. the Company has transferred its right to receive cash flows from the asset and either has transferred substantially all the risks and rewards of the asset or has neither transferred nor retained substantially all the risks and rewards of the asset, but has transferred control of the asset.
Where the Company has transferred its right to receive cash flows from an asset and has neither transferred nor retained substantially all the risks and rewards of the asset nor transferred control of the asset, the asset is recognized to the extent of the Company’s continuing involvement in the asset. Continuing involvement that takes the form of a guarantee over the transferred asset is measured at the lower of the original carrying amount of the asset and the maximum amount of consideration that the Company could be required to repay.

- 13 -
Financial liabilities A financial liability is derecognized when the obligation under the liability is discharged, cancelled or has expired.
Where an existing financial liability is replaced by another from the same lender on substantially different terms, or the terms of an existing liability are substantially modified, such an exchange or modification is treated as a derecognition of the original liability and the recognition of a new liability, and the difference in the respective carrying amounts is recognized in the statement of income.
Offsetting of Financial Instruments Financial assets and financial liabilities are offset and the net amount reported in the balance sheet if, and only if, there is a currently enforceable legal right to offset the recognized amounts and there is an intention to settle on a net basis, or to realize the asset and settle the liability simultaneously. This is not generally the case with master netting agreements, and the related assets and liabilities are presented gross in the balance sheet.
Inventories
Inventories are stated at the lower of cost and net realizable value (NRV). Costs incurred in bringing each inventories to its present location and condition are accounted for as follows:
Finished goods and work in process - Cost is determined based on the moving average
method. Cost includes direct materials, labor and a proportion of manufacturing overhead costs based on normal operating capacity.
Raw materials - Cost is determined using the moving average
method. Land for development - Carried at the lower of cost and NRV.
NRV is the estimated selling price in the ordinary course of business, less estimated costs of completion and the estimated costs necessary to make the sale.
Property, Plant and Equipment Property, plant and equipment, except land, are carried at cost less accumulated depreciation, amortization and impairment losses. Land is stated at cost less any impairment losses.
The initial cost of an item of property, plant and equipment includes its purchase price and any
directly attributable costs of bringing the asset to its working condition and location for its intended use. Expenditures incurred after the property, plant and equipment have been put into operation, such as repairs and maintenance costs, are normally charged to income in the period the costs are incurred. In situations where it can be clearly demonstrated that the expenditures have resulted in an increase in the future economic benefits expected to be obtained from the use of an item of property, plant and equipment beyond its originally assessed standard of performance, the expenditures are capitalized as additional costs of the property, plant and equipment.
Assets under installation are carried at cost and transferred to the related property, plant and
equipment account when the installation and related activities necessary to prepare the assets for their intended use are complete and the assets are ready for use.

- 14 - Depreciation commences once the property, plant and equipment are available for use and
computed using the straight-line method over the estimated useful lives of the assets as follows:
YearsBuildings and improvements 10-15 Machinery and equipment 5 Transportation equipment 5 Office furniture and fixtures 2-5 Other equipment 2-5
Each part of an item of property, plant and equipment with a cost that is significant in relation to
the total cost of the item is depreciated separately. Fully depreciated assets are retained in the accounts until they are no longer in use and no further
depreciation and amortization are credited to or charged against current operations.
The assets’ residual values, useful lives and depreciation method are reviewed periodically to ensure that the residual values, periods and method of depreciation are consistent with the expected pattern of economic benefits from items of property, plant and equipment. When assets are retired or otherwise disposed of, the cost and the related accumulated depreciation and amortization and any impairment loss are removed from the accounts and any resulting gain or loss is credited to or charged against current operations.
Impairment of Nonfinancial Assets The Company assesses at each balance sheet date whether there is an indication that the
nonfinancial assets, like property, plant and equipment may be impaired. If any such indication exists, the Company makes an estimate of the asset’s recoverable amount.
An asset’s recoverable amount is the higher of an asset’s or cash-generating unit’s fair
value less costs to sell and its value in use and is determined for an individual asset, unless the asset does not generate cash inflows that are largely independent of those from other assets or groups of assets. Where the carrying amount of an asset exceeds its recoverable amount, the asset is considered impaired and is written down to its recoverable amount. In assessing value-in-use, the estimated future cash flows are discounted to their present value using pretax discount rate that reflects current market assessments of the time value of money and the risks specific to the asset. Impairment losses on continuing operations are recognized in the statement of income.
An assessment is further made at each balance sheet date as to whether there is any indication that previously recognized impairment losses may no longer exist or may have decreased. If such indication exists, the recoverable amount is estimated. A previously recognized impairment loss is reversed only if there has been a change in the estimates used to determine the asset’s recoverable amount since the last impairment loss was recognized. If that is the case, the carrying amount of the asset is increased to its recoverable amount. That increased amount cannot exceed the carrying amount that would have been determined, net of depreciation, had no impairment loss been recognized for the asset in prior years. Such reversal is recognized in the statement of income. After such a reversal, the depreciation charge is adjusted in future periods to allocate the asset’s revised carrying amount, less any residual value, on a systematic basis over its remaining useful life.

- 15 -
Debt Issuance Costs Transaction costs paid in relation to the issuance of the floating rate promissory notes issued to a syndicate of lenders, shown as a contra-liability account to the floating rate notes payable, are deferred and being amortized over the term of the notes starting August 1, 2007 until August 31, 2012 using the effective interest rate method.
Provisions Provisions are recognized when the Company has a present obligation (legal or constructive) as a result of a past event, it is probable that an outflow of resources embodying economic benefits will be required to settle the obligation and a reliable estimate can be made of the amount of the obligation. Where the Company expects some or all of a provision to be reimbursed, for example under an insurance contract, the reimbursement is recognized as a separate asset but only when the reimbursement is virtually certain. The expense relating to any provision is presented in the statement of income, net of any reimbursement. If the effect of the time value of money is material, provisions are discounted using a current pre-tax rate that reflects, where appropriate, the risks specific to the liability. Where discounting is used, the increase in the provision due to the passage of time is recognized as interest expense in the statement of income.
Treasury Stock Treasury stock is recorded at cost and is presented as deduction from equity. When the shares are retired, the capital stock account is reduced by its par value and the excess of cost over par value upon retirement is debited to additional paid-in-capital to the extent of the specific or average additional paid-in-capital when the shares were issued and to retained earnings for the remaining balance.
Revenue Recognition Revenue is recognized when it is probable that the economic benefits associated with the transaction will flow to the enterprise and the amount of revenue can be reliably measured. The following specific recognition criteria must also be met before revenue is recognized: Sales are recognized upon delivery of goods to customers. Land for development - revenue on sale of land for development is recognized only to the extent cash is received or when the exchange consideration can be measured reliably. Rental income is accounted for on a straight-line basis over the term of the lease. Interest income is recognized as it accrues using the effective interest rate method. Retirement Benefits Cost Retirement benefits cost is actuarially determined using the projected unit credit actuarial valuation method. This method considers each period of service as giving rise to an additional unit of benefit entitlement and measures each separately to build up the final obligation. Past service costs are recognized on a straight-line basis over the average period until the amended benefits become vested. To the extent that the benefits are already vested immediately, upon introduction of a new plan or improvement of an existing plan, past service costs are immediately expensed. Any actuarial gains and losses and adjustments arising from the limits on asset ceiling test are taken directly to equity. Gains or losses on the curtailment or settlement of pension benefits are recognized in the statement of income when the curtailment or settlement occurs.

- 16 -
The defined benefit asset or liability comprises the present value of the defined benefit obligation less past service cost not yet recognized and less the fair value of plan assets out of which the obligations are to be settled directly. The value of any asset is restricted to the sum of any past service cost not yet recognized and the present value of any economic benefits available in the form of refunds from the plan or reductions in future contributions to the plan.
Leases
The determination of whether an arrangement is, or contains a lease is based on the substance of the arrangement and requires an assessment of whether the fulfillment of the arrangement is dependent on the use of a specific asset and the arrangement conveys a right to use the asset.
Operating lease payments where the Company is a lessee are recognized as expense on a straight-line basis over the terms of the lease contracts.
Borrowing Costs Borrowing costs are generally expensed as incurred and are capitalized if they are directly attributable to the acquisition or construction of a qualifying asset. Capitalization of borrowing costs commences when the activities to prepare the asset are in progress and expenditures and borrowing costs are being incurred. Borrowing costs are capitalized until the assets are substantially ready for their intended use. If the carrying amount of the asset exceeds its recoverable amount, an impairment loss is recorded.
Foreign Currency Transactions Transactions in foreign currencies are initially recorded in Philippine peso, the Company’s functional currency, based on the exchange rates prevailing at the transaction date. Outstanding foreign currency-denominated monetary assets and liabilities are restated to Philippine peso using the closing exchange rates prevailing at the balance sheet date. Foreign exchange gains or losses arising from the translation or settlement of foreign currency-denominated monetary assets and liabilities at exchange rates different from those at which the assets and liabilities are initially recorded, are taken to the statement of income.
Income Tax Current Income Tax Current income tax assets and liabilities for the current and prior periods are measured at the amount expected to be recovered from or paid to the taxation authorities. The tax rates and tax laws used to compute the amount are those that are enacted or substantively enacted at the balance sheet date. Deferred Income Tax Deferred income tax is provided, using the balance sheet liability method, on all temporary differences at the balance sheet date between the tax bases of assets and liabilities and their carrying amounts for financial reporting purposes. Deferred income tax liabilities are recognized for all taxable temporary differences. Deferred income tax assets are recognized for all deductible temporary differences, carryforward benefits of unused tax credits from excess minimum corporate income tax (MCIT) and unused tax losses or net operating loss carry over (NOLCO) to the extent that it is probable that taxable profit will be available against which the deductible temporary differences and carryforward benefits of unused tax credits and unused tax losses can be utilized.
Deferred income tax relating to items recognized directly in equity is recognized in equity and not
in the statement of income.

- 17 -
The carrying amount of deferred income tax assets is reviewed at each balance sheet date and reduced to the extent that it is no longer probable that sufficient taxable profit will be available to allow all or part of the deferred income tax asset to be utilized.
Deferred income tax assets and liabilities are measured at the tax rates that are expected to apply to the period when the asset is realized or the liability is settled, based on tax rates and tax laws that have been enacted or substantively enacted at the balance sheet date.
Earnings Per Share (EPS) Basic EPS is determined by dividing net income by the weighted average number of shares issued and outstanding, after giving retroactive adjustments for any stock split and stock dividends or reverse stock splits during the year. The Company does not have dilutive potential common shares.
Segment Reporting The Company chose to organize the entity into geographical areas, where the Company’s products are sold. The Company’s operating segments consist of: (1) Domestic operations and (2) International operations. In addition, the operating segments are reported in a manner that is more consistent with the internal reporting provided to the Chief Operating Decision Maker (CODM). The CODM, who is responsible for allocating resources and assessing performance of the operating segments, has been identified as the BOD that makes strategic decisions. The Company has no inter-segment sales and transactions.
Contingencies Contingent liabilities are not recognized in the financial statements. These are disclosed unless the
possibility of an outflow of resources embodying economic benefits is remote. Contingent assets are not recognized in the financial statements but are disclosed when an inflow of economic benefits is probable.
Events After the Balance Sheet Date Post year-end events that provide additional information about the Company’s position at the
balance sheet date (adjusting events) are reflected in the financial statements. Post year-end events that are not adjusting events are disclosed in the notes to financial statements when material.
3. Management’s Significant Accounting Judgments and Use of Estimates
The preparation of the financial statements in conformity with PFRS requires management to make estimates and assumptions that affect the amounts reported in the financial statements and accompanying notes.
In the opinion of management, these financial statements reflect all adjustments necessary to present fairly the results for the periods presented. Actual results could differ from these estimates, and the effect of any change in estimates will be reflected in the financial statements when they become reasonably determinable.

- 18 - Judgments In the process of applying the Company’s accounting policies, management has made the following judgments, apart from those involving estimations, which have the most significant effect on the amounts recognized in the financial statements as follows:
Determination of the Company’s functional currency Based on the economic substance of the underlying circumstances relevant to the Company, the functional currency of the Company has been determined to be the Philippine peso. It is the currency that mainly influences the selling price of goods and cost of producing and selling the goods.
Assessment whether the lease agreement is a finance or operating lease The management assesses at the inception of the lease whether the arrangement is a finance or operating lease based on who bears substantially all the risks and benefits incidental to ownership of the leased item. The Company has entered into a property lease where it has determined that the risks and rewards related to the property are retained with the lessor. As such, the agreement is accounted for as an operating lease.
Impairment of AFS investments The Company treats AFS equity investments as impaired when there has been a significant or prolonged decline in the fair value below its cost or where other objective evidence of impairment exists. The determination of what is “significant” or “prolonged” requires judgment. The Company treats “significant” generally as 20% or more of the original cost of investment, and “prolonged”, greater than 6 months. In addition, the Company evaluates other factors, including normal volatility in share price for quoted equities and the future cash flows and the discount factors for unquoted equities. As of December 31, 2008 and 2007, the carrying value of the Company’s AFS investments amounted to P=215.95 million and P=219.77 million, respectively (see Note 10).
Estimation Uncertainty The key assumptions concerning the future and other key sources of estimation uncertainty at the balance sheet date, that have a significant risk of causing a material adjustment to the carrying amounts of assets and liabilities within the next financial year are discussed below:
Estimation of allowance for doubtful accounts Provisions are made using a combination of specific and collective assessment approaches, with impairment losses being determined for each risk grouping identified by the Company. The level of this allowance is evaluated by management on the basis of factors that affect the collectibility of the accounts. These factors include, but are not limited to, the length of the Company’s relationship with its debtors, the debtors’ payment behavior and known market factors. The amount and timing of recorded expenses for any period would differ if the Company made different judgments or utilized different methodologies. An increase in allowance for doubtful accounts would increase the recorded operating expenses and decrease current assets. Allowance for doubtful accounts amounted to P=33.82 million and P=29.09 million as of December 31, 2008 and 2007, respectively. The amount of receivables, net of allowance for doubtful accounts, amounted to P=1,087.81 million and P=1,024.45 million as of December 31, 2008 and 2007, respectively (see Note 5).

- 19 -
Estimation of allowance for inventory obsolescence and market decline The Company, in determining the NRV of inventories, considers any adjustments necessary for obsolescence, which is generally provided 100% allowance on nonmoving items or expired or near expiring (inventories which will expire within six months) inventories. The Company adjusts the cost of the inventory to its recoverable value at a level considered adequate to reflect market decline in the value of the recorded inventories. The amount and timing of recorded expenses for any period would differ if different judgments were made or different estimates were utilized. An increase in allowance for inventory obsolescence and market decline would increase recorded operating expenses and decrease current assets. As of December 31, 2008 and 2007, allowance for inventory obsolescence amounted to P=34.89 million and P=36.00 million, respectively (see Note 6).
Estimation of the useful lives of property, plant and equipment The useful life of each of the item of property, plant and equipment are estimated based on the period over which the asset is expected to be available for use. Such estimation is based on a collective assessment of industry practice, internal technical evaluation and experience with similar assets. The estimated useful life of each asset is reviewed periodically and updated if expectations differ from previous estimates due to physical wear and tear, technical or commercial obsolescence and legal or other limits on the use of the asset. It is possible, however, that future results of operations could be materially affected by changes in the amounts and timing of recorded expenses brought about by changes in the factors mentioned above. A reduction in the estimated useful life of property, plant and equipment would increase the recorded operating expenses and decrease the noncurrent assets.
There is no change in the estimated useful lives of property, plant and equipment as of December 31, 2008 and 2007. The carrying values of property, plant and equipment amounted to P=272.07 million and P=294.57 million as of December 31, 2008 and 2007, respectively (see Note 9).
Asset impairment The Company assesses impairment of assets (property, plant and equipment) whenever events or changes in circumstances indicate that the carrying amount of an asset may not be recoverable. The factors that would trigger an impairment review include the following: • Significant underperformance relative to the future sales performance and projected operating
results. • Significant negative industry or market trends. An impairment loss is recognized whenever the carrying amount of an asset exceeds its recoverable amount. The recoverable amount is the higher of an asset’s net selling price and value-in-use. The net selling price is the amount obtainable from the sale of an asset in an arm’s length transaction while value-in-use is the present value of the estimated future cash flows expected to arise from the continuing use of an asset and from its disposal at the end of its useful life. Recoverable amounts are estimated for individual assets if it is not possible, for the cash-generating unit to which the asset belongs. For impairment loss on a specific asset, the recoverable amount represents the net selling price. Based on the evaluation made by management, as of December 31, 2008 and 2007, no indication of impairment was noted.

- 20 -
Recognition of deferred income tax assets The Company reviews the carrying amounts of deferred income taxes at each balance sheet date and reduces deferred income tax assets to the extent that it is no longer probable that sufficient taxable income will be available to allow all or part of the deferred income tax assets to be utilized. However, there is no assurance that the Company will generate sufficient taxable income to allow all or part of its recognized deferred income tax assets to be utilized. As of December 31, 2008 and 2007, the Company recognized deferred income tax assets amounting to P=33.19 million and P=37.05 million, respectively (see Note 20). Retirement benefits cost and obligation The present value of the pension obligation depends on a number of factors that are determined on an actuarial basis using a number of assumptions. The assumptions used in determining the net cost for pensions include the discount rate, mortality rate and compensation increase.
The Company determines the appropriate discount rate at the end of each year. This is the discount rate that should be used to determine the present value of estimated future cash outflows expected to be required to settle the pension obligations. In determining the appropriate discount rate, the Company considers the interest rates on government bonds that are denominated in Philippine peso, and that have terms to maturity approximating the terms of the related pension liability. The details of retirement benefits cost are disclosed in Note 18. Retirement benefits liability recognized by the Company as of December 31, 2007 amounted to P=37.93 million (nil in 2008). Retirement benefits cost amounted to P=13.84 million, P=10.28 million and P=6.88 million in 2008, 2007 and 2006, respectively (see Note 18).
Provisions and contingencies The estimate of probable costs of resolution of possible claims has been developed in consultation with external counsels handling the Company’s defense in these matters and is based upon an analysis of potential results. The Company is a party to certain lawsuits or claims arising from the ordinary course of business. However, the Company’s management and legal counsel believe that the eventual liabilities under these lawsuits or claims, if any, will not have a material effect on the Company’s financial statements (see Note 27).
Fair value of financial instruments Where the fair values of financial assets and financial liabilities recorded in the balance sheet or disclosed in the financial statements cannot be derived from active markets, they are determined using internal valuation techniques using generally accepted market valuation models. The inputs to these models are taken from observable market where possible, but where this is not feasible, estimates are used in establishing fair values.
The carrying values and fair values of financial instruments, as well as the methods on how the fair values were derived are discussed in Note 25.
4. Cash and Cash Equivalents
2008 2007Cash on hand and in banks P=259,573,171 P=251,990,457Short-term placements (Note 15) 1,582,502,317 1,723,047,109 P=1,842,075,488 P=1,975,037,566

- 21 -
Cash in banks earn interest at the respective bank deposit rates. Short-term placements are made for varying periods of up to three months depending on the immediate cash requirements of the Company, and earn interest at the respective short-term placements rates.
5. Receivables
2008 2007 Trade: Distributors and other accounts P=912,882,470 P=626,917,661 Related party (Note 15) 137,578,453 131,288,422 1,050,460,923 758,206,083 Others: Related parties (Notes 4, 8 and 15) 6,188,739 187,564,772 Third parties 46,230,549 32,771,012 Receivable from a land developer (Note 11) 18,750,000 75,000,000 1,121,630,211 1,053,541,867 Less allowance for doubtful accounts 33,819,647 29,087,304
P=1,087,810,564 P=1,024,454,563
Trade receivables from third parties are noninterest-bearing and are generally on 30-90 days’ terms.
Movements in the allowance for doubtful accounts related to trade receivables - distributors and
other accounts are as follows:
2008 2007 Balance at beginning of year P=29,087,304 P=11,604,212 Provisions for the year (Note 17) 4,732,343 19,948,367 Write-off – (2,465,275)Balance at end of year P=33,819,647 P=29,087,304
6. Inventories
2008 2007 Finished goods P=156,007,133 P=130,843,753 Work in process 13,238,348 12,654,473 Raw materials 212,510,758 185,177,131 P=381,756,239 P=328,675,357
The cost of inventories carried at NRV amounted to P=34,893,095 and P=36,000,000 as of December 31, 2008 and 2007, respectively. The inventories valued at NRV are fully provided with allowance for obsolescence.
Movements in the allowance for inventory obsolescence are as follows:
2008 2007 Balance at beginning of year P=36,000,000 P=35,000,002 Provisions for the year 63,336,465 999,998 Write-off (64,443,370) –Balance at end of year P=34,893,095 P=36,000,000

- 22 - 7. Prepaid Expenses and Other Current Assets
2008 2007 Prepaid income tax P=21,539,379 P=10,952,092Supplies 11,706,938 12,895,127 Derivative asset – 1,076,940 Others 11,777,038 7,231,284 P=45,023,355 P=32,155,443
Embedded Derivatives Embedded foreign currency derivative was bifurcated from the Company’s purchase contract, which is denominated in a currency that is neither the functional currency of a substantial party to the contract nor the routine currency for the transaction. The total outstanding notional amount of such embedded foreign currency derivative amounting to US$122,952 as of December 31, 2007 is fully settled in 2008.
In 2008 and 2007, the net mark-to-market loss/(gain) on the outstanding embedded derivative amounted to P=907,069 and (P=2,486,462), respectively was netted against “Foreign exchange loss - net” account in the statements of income.
The net movements in fair value changes of the Company’s derivative instruments are as follows:
2008 2007 Balance at beginning of year P=1,076,940 P=– Net changes in fair value of derivatives not designated as accounting hedges (907,069) 2,486,462 169,871 2,486,462 Less fair value of settled instruments 169,871 1,409,522 Balance at the end of the year P=– P=1,076,940
8. Note Receivable
The noninterest-bearing, due and demandable note receivable issued by P.T. Splash Indonesia (PTSI) in favor of the Company on December 31, 2006 in settlement of PTSI’s trade and nontrade accounts with the Company as of December 31, 2006 has been restructured on February 1, 2007, amounting to P=250,152,509. The new promissory note is collectible in five (5) equal annual installments starting December 31, 2008 and is subject to 11.2949% interest per year.
The details of the account follows:
2008 2007Balance at beginning of year P=250,152,509 P=259,987,715 Less collections 45,845,588 9,835,206 Balance at end of year 204,306,921 250,152,509 Less current portion 54,215,416 50,030,502 Noncurrent portion at end of year P=150,091,505 P=200,122,007
The note receivable is guaranteed by SHI.

- 23 - The interest is collectible annually with the first collection on July 1, 2008, covering all accrued
interest starting February 1, 2007. Interest income amounted to P=28,254,476 and P=25,899,936 in 2008 and 2007, respectively (see Notes 15 and 19). On December 4, 2008, the Company collected all the interest receivables accrued in 2008 and 2007.
9. Property, Plant and Equipment As of December 31, 2008:
Machinery Office Buildings and and Transportation Furniture Other Assets for Land Improvements Equipment Equipment and Fixtures Equipment Installation Total
Cost: Beginning balances P=149,614,341 P=419,797,262 P=221,274,017 P=62,111,357 P=16,773,320 P=143,032,234 P=16,472,647 P=1,029,075,178 Additions – 485,983 2,643,032 10,509,511 – 6,500,000 4,749,278 24,887,804 Reclassification – 1,510,340 – – – 10,556,323 (12,066,663) – Disposals – – – (17,371,545) – – – (17,371,545)Ending balances 149,614,341 421,793,585 223,917,049 55,249,323 16,773,320 160,088,557 9,155,262 1,036,591,437
Accumulated Depreciation and Amortization: Beginning balances – 318,930,935 214,589,101 44,982,712 16,154,882 139,844,152 – 734,501,782 Depreciation and amortization
– 26,543,290 3,925,864 9,553,398 618,438
6,707,679
– 47,348,669
Disposals – – – (17,324,545) – – – (17,324,545)Ending balances – 345,474,225 218,514,965 37,211,565 16,773,320 146,551,831 – 764,525,906 Net Book Values P=149,614,341 P=76,319,360 P=5,402,084 P=18,037,758 P=– P=13,536,726 P=9,155,262 P=272,065,531
As of December 31, 2007:
Machinery Office Buildings and and Transportation Furniture Other Assets for Land Improvements Equipment Equipment and Fixtures Equipment Installation Total
Cost: Beginning balances P=396,570,795 P=419,083,619 P=220,210,291 P=54,232,134 P=15,602,560 P=141,542,080 P=10,839,180 P=1,258,080,659 Additions – 713,643 1,063,726 10,513,377 1,170,760 1,490,154 5,633,467 20,585,127Reclassification (Note 11) (246,956,454) – – – – – – (246,956,454)Disposals – – – (2,634,154) – – – (2,634,154)Ending balances 149,614,341 419,797,262 221,274,017 62,111,357 16,773,320 143,032,234 16,472,647 1,029,075,178
Accumulated Depreciation and Amortization: Beginning balances – 291,687,324 204,257,567 38,758,162 15,256,667 135,834,655 – 685,794,375Depreciation and amortization
– 27,243,611 10,331,534 8,248,918 898,215
4,009,497
– 50,731,775
Disposals – – – (2,024,368) – – – (2,024,368)Ending balances – 318,930,935 214,589,101 44,982,712 16,154,882 139,844,152 – 734,501,782 Net Book Values P=149,614,341 P=100,866,327 P=6,684,916 P=17,128,645 P=618,438 P=3,188,082 P=16,472,647 P=294,573,396
The total cost of fully depreciated property, plant and equipment still in use amounted to
P=502,272,967 and P=499,177,938 as of December 31, 2008 and 2007, respectively. 10. Available-for-Sale Investments
This account consists of investments in:
2008 2007 Shares of stock: Unquoted P=200,000,000 P=200,000,000 Quoted 15,226,900 15,226,900 215,226,900 215,226,900 Unrealized valuation gain - net 718,100 4,543,100 P=215,945,000 P=219,770,000

- 24 -
The cost of unquoted investments in shares of stock represents the cost of the investment in common shares (50,000 shares representing 7.21% ownership) in Professional Services, Inc., the owner and operator of Medical City, previously owned by SHI, which SHI assigned to the Company on September 27, 2007 in settlement of SHI’s cash advances from the Company (see Note 15c). As of December 31, 2008, the Company has no intention to dispose its investment in common shares of Professional Services, Inc.
Movements in the net unrealized valuation gain (loss) on AFS investments are as follows:
2008 2007 Balance at beginning of year P=4,543,100 (P=976,900)Gain (loss) recognized in equity (3,825,000) 5,520,000 Balance at end of year P=718,100 P=4,543,100
11. Land for Development
Land for development represents a parcel of land owned by the Company, which is held for sale to Crown Asia Properties, Inc. (the developer) under a Memorandum of Agreement (MOA) dated November 28, 2007, executed between the Company and the developer, wherein the developer undertakes to develop the entire parcel of land into a mixed-used residential and commercial condominium project. Under the MOA, the Company receives consideration (1) payable in cash amounting to P=105,000,000 and (2) a minimum of 3,383.4 square meters of gross office/condotel areas and 26 parking slots or 7.5% of the condominium building, whichever is greater. The cash consideration is collectible as follows: November 30, 2007 - P=30 million and P=18.75 million in each of the quarters ending March 31, 2008, June 30, 2008, September 30, 2008, and December 31, 2008. The last installment payment was received on January 20, 2009.
Under the MOA, the developer shall have full, exclusive and absolute authority over the implementation of the project, including the planning, conceptualization, design, construction and financing of the Project in accordance with the terms of the Agreement.
In 2007, the Company accounted for the cash component of the payment by the developer as sale of land using the “cost recovery method”. Accordingly, sales and cost of sales amounting to P=105.00 million has been recognized in the 2007 statement of income. The value of the land amounting to P=141.96 million is shown as “Land for development” in the balance sheets as the Company’s intention is to sell the condominium units.
12. Accounts Payable and Accrued Expenses
2008 2007 Trade payables P=637,956,867 P=637,434,171 Accrued expenses: Advertising and promotions 111,432,170 81,480,424 Interest payable (Note 13) 6,372,917 4,078,000 Others 19,284,726 17,010,549 VAT payable 20,957,560 11,133,496 Other current liabilities 7,339,358 11,355,328 P=803,343,598 P=762,491,968
The Company reversed excess provision amounting to P=60,461,525 in 2006.

- 25 - 13. Floating Rate Notes
The Company entered into a Floating Rate Notes (FRNs) Facility Agreement (Notes Facility) for the issuance of P=1 billion FRNs to a syndicate of lenders (four local financial institutions). The FRNs were issued on August 31, 2007 and are payable in five (5) annual installments.
The proceeds of the FRNs were used to pay in full all seven outstanding unsecured bank loans and long-term loans, with principal amounts totaling P430 million and P306.77 million, respectively, and interest in September 2007. The short-term loan from local banks and long-term debt bear interest rates ranging from 6.5% to 9.0% and 6.75% to 11.16%, respectively per year As of December 31, 2008 and 2007, the maturities of the FRNs at nominal values, excluding the unamortized debt issuance costs follow:
Due in 2008 20072008 P=– P=50,000,0002009 50,000,000 50,000,0002010 50,000,000 50,000,0002011 50,000,000 50,000,0002012 800,000,000 800,000,000 P=950,000,000 P=1,000,000,000
The FRNs bear interest starting August 31, 2007 and such interest is payable on each interest payment date which falls three months after the preceding interest payment date, in the case of the first interest payment date, after August 31, 2007. The rate of interest for such interest period shall be based on the Interest Rate 1 Setting Date by reference to the three- (3) month Philippine Dealing System Treasury Rate 1 at approximately 11:16 A.M., Manila time, on such date, plus an interest spread of 165 basis points (1.65%) per year.
All payments by the Company under the Notes Facility, whether of principal, interest, fees, early redemption or otherwise, shall be made without set-off or counterclaim for indemnifiable taxes, and are free and clear and without any deduction or withholding on account of any indemnifiable taxes, unless such withholding is required by law.
The Notes Facility provides, among other terms and conditions, that, for as long as the FRNs remain outstanding, the Company is subject to certain negative covenants requiring prior written approval from the majority of the Note Holders for specified acts which include, but are not limited to: amendment of Articles of Incorporation and other organization documents, e.g., materially changing the nature of its present business; entering into merger or consolidation; granting of loans or advances to or investment in which its directors, officers, stockholders and other related persons, except those made in the ordinary course of business; creation of lien with respect to any of its properties; sale or lease of assets; guaranteeing indebtedness; prepaying long-term indebtedness, except for those provided in Section 2.07 of the Notes Facility; entering into additional loans; entering into any new management contracts; declaration or payment of dividends in excess of fifty percent (50%) of the Company’s net income for the most recent fiscal year; purchase, redeem, retire or otherwise acquire for value its capital stock; declare or pay management bonuses or profits sharing; and execute any act which shall have a material adverse effect. In addition, the Notes Facility provides that the Company has to maintain a ratio of current assets to current liabilities of at least 2.0 times and its equity-to-debt ratio should not be more than 1.5 times until final payment date. As of December 31, 2008 and 2007, the Company is in compliance with the negative debt covenants.

- 26 -
In the event of default as provided under the Note Facility, the default penalty is 2% per month, or a fraction of a year.
The Notes Facility also provides for early redemption, at the option of the Company, starting at the end of the thirty-sixth (36th) month from the issue date, without premium or penalty. In addition, the Company has a one-time option, at any interest rate settling date, to convert the interest from a floating interest rate structure to a fixed interest rate structure on the remaining life of the outstanding amount of the Notes. The fixed interest rate shall be based on the applicable Fixed Base Rate plus a spread of 165 basis points (1.65%) per annum subject to certain conditions stipulated in the Notes Facility. The total transaction costs of the FRNs amounting to P=15,540,298, is capitalized and is being amortized over the term of the FRNs using the effective interest rate method. Movement of the unamortized debt issuance costs follows:
2008 2007 Balance beginning of year P=14,583,197 P=– Additions – 15,540,298 Amortization (3,009,998) (957,101)Balance at end of year P=11,573,199 P=14,583,197
Outstanding balance of the FRNs is as follows: As of December 31, 2008:
Current Long-term TotalNominal amount P=50,000,000 P=900,000,000 P=950,000,000Unamortized debt issuance costs (3,076,596) (8,496,603) (11,573,199) P=46,923,404 P=891,503,397 P=938,426,801
As of December 31, 2007:
Current Long-term TotalNominal amount P=50,000,000 P=950,000,000 P=1,000,000,000Unamortized debt issuance costs (3,009,998) (11,573,199) (14,583,197) P=46,990,002 P=938,426,801 P=985,416,803
14. Equity
a. The details of capital stock are shown below: December 31, 2008 December 31, 2007
Number
of Shares AmountNumber
of Shares AmountAuthorized - par value of
P=1 per share (Note b) 1,000,000,000 P=1,000,000,000 1,000,000,000 P=1,000,000,000
(Forward)

- 27 -
December 31, 2008 December 31, 2007
Number
of Shares AmountNumber
of Shares Amount
Issued: Balance at beginning of
year 746,160,357 P=746,160,357 107,312,250 P=107,312,250 Additional issuance before the IPO (Notes b and c) – – 450,000,000 450,000,000 Issuances through the IPO (Note e) – – 188,848,107 188,848,107
Issued 746,160,357 746,160,357 746,160,357 746,160,357Less treasury stock (Note f) 54,870,031 236,178,536 – –Outstanding at end of year 691,290,326 P=509,981,821 746,160,357 P=746,160,357
b. Increase in authorized capital stock On June 25, 2007, the BOD and stockholders approved the increase in the Company’s
authorized capital stock from P=400 million to P=1,000 million, divided into 400 million common shares with P=1.00 par value and 1,000 million common shares with P=1.00 par value, respectively. The increase in the Company’s authorized capital stock was approved by the SEC on September 20, 2007. Out of the P=600 million increase in authorized capital stock, SHI, the Company’s parent, subscribed and paid P=112.50 million for 112.50 million shares of stock.
c. On September 4, 2007, SHI subscribed and paid for additional shares amounting to
P=337.50 million for 337.50 million shares. d. Cash dividends Information on the Company’s declaration of cash dividends follow:
Declaration Date Dividend per Share Amount Record Date June 19, 2008 P=0.18 P=134,308,864 May 22, 2008August 31, 2007 P=1.59 P=350,000,000 August 31, 2007
There was no cash dividend declaration to stockholders in 2006. e. IPO
On November 15, 2007, the Company completed its IPO of common shares, at an offer price of P=8.98 a share. The total net proceeds from the Primary Share Offer of 188,848,107 shares amounted to P=1,608,182,348 (net of IPO cost of P=87,673,652). The excess of net proceeds from par value of the shares issued of P=1,419,334,241 is credited to additional paid-in capital in the balance sheets. The net proceeds from the Primary Share Offer are intended to be used by the Company in projects that will further enhance its research and development capabilities, support brand building, new product introductions and future acquisitions.
f. Treasury stock
On September 17, 2008, the BOD approved the Share Buyback Program of the Company. The Company reacquired its common shares totalling 24,567,000 shares for P=136,178,536 at an average price of P=5.52 per share.
On December 12, 2008, the BOD also approved the buyback of the Company’s 30,303,031 shares owned by SHI for P=100 million at P=3.30 per share.
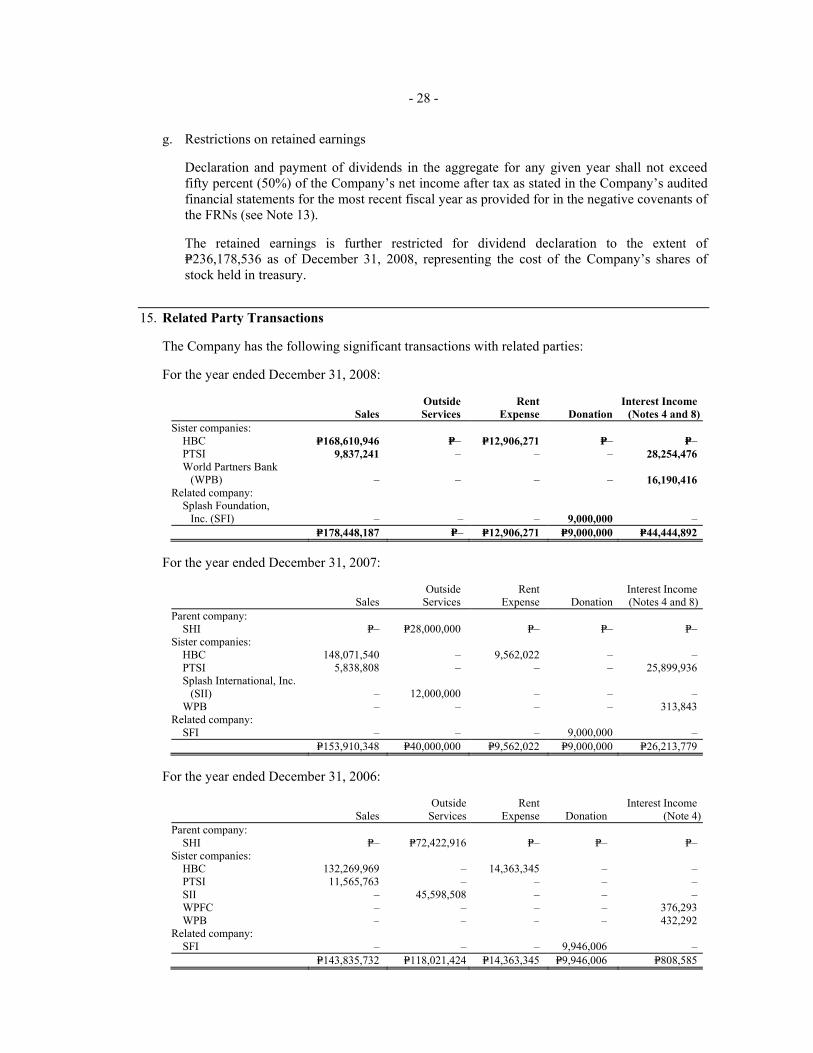
- 28 -
g. Restrictions on retained earnings
Declaration and payment of dividends in the aggregate for any given year shall not exceed fifty percent (50%) of the Company’s net income after tax as stated in the Company’s audited financial statements for the most recent fiscal year as provided for in the negative covenants of the FRNs (see Note 13).
The retained earnings is further restricted for dividend declaration to the extent of
P=236,178,536 as of December 31, 2008, representing the cost of the Company’s shares of stock held in treasury.
15. Related Party Transactions
The Company has the following significant transactions with related parties:
For the year ended December 31, 2008:
Outside Rent Interest Income Sales Services Expense Donation (Notes 4 and 8)Sister companies: HBC P=168,610,946 P=– P=12,906,271 P=– P=– PTSI 9,837,241 – – – 28,254,476 World Partners Bank (WPB)
–
–
–
– 16,190,416
Related company: Splash Foundation, Inc. (SFI) – – – 9,000,000 – P=178,448,187 P=– P=12,906,271 P=9,000,000 P=44,444,892
For the year ended December 31, 2007:
Outside Rent Interest Income Sales Services Expense Donation (Notes 4 and 8)Parent company: SHI P=– P=28,000,000 P=– P=– P=–Sister companies: HBC 148,071,540 – 9,562,022 – – PTSI 5,838,808 – – – 25,899,936 Splash International, Inc. (SII) – 12,000,000 –
– –
WPB – – – – 313,843Related company: SFI – – – 9,000,000 – P=153,910,348 P=40,000,000 P=9,562,022 P=9,000,000 P=26,213,779
For the year ended December 31, 2006:
Outside Rent Interest Income Sales Services Expense Donation (Note 4)Parent company: SHI P=– P=72,422,916 P=– P=– P=–Sister companies: HBC 132,269,969 – 14,363,345 – – PTSI 11,565,763 – – – – SII – 45,598,508 – – – WPFC – – – – 376,293 WPB – – – – 432,292Related company: SFI – – – 9,946,006 – P=143,835,732 P=118,021,424 P=14,363,345 P=9,946,006 P=808,585

- 29 - The Company has the following account balances with related parties:
December 31, 2008: Cash and Other Cash Trade Receivables Note Advances Equivalents
(Note 4) Receivables
(Note 5) (Notes 5
and 8) Receivable
(Note 8) to a
Stockholder Parent company: SHI P=– P=– P=– P=– P=137,370,246 Sister companies: WPB 750,199,322 – 2,113,969 – – HBC – 136,456,921 – – – PTSI – 1,121,532 – 204,306,921 – SII – – 1,287,234 – – WPFC – – 2,787,536 – – P=750,199,322 P=137,578,453 P=6,188,739 P=204,306,921 P=137,370,246
December 31, 2007:
Cash and Other Cash Trade Receivables Note Advances Equivalents
(Note 4) Receivables
(Note 5) (Notes 5
and 8) Receivable
(Note 8) to a
Stockholder Parent company: SHI P=– P=– P=– P=– P=137,370,246 Sister companies: WPB 328,860,516 – 94,444 – – HBC – 130,647,605 4,255,418 – – PTSI – 640,817 25,899,936 250,152,509 – SII – – 29,881,267 – – WPFC – – 2,870,326 – – SNC – – 124,563,381 – – P=328,860,516 P=131,288,422 P=187,564,772 P=250,152,509 P=137,370,246
The Company has the following transactions with related parties:
a. Maintains bank accounts and short-term cash placements with WPB subject to the prevailing market interest rates. As of December 31, 2008 and 2007, the Company’s time deposits (shown as part of cash equivalents amounted to P=715,866,106 and P=300,094,444, respectively (see Note 4).
b. Has an outstanding note receivable from PTSI amounting to P=204,306,921 and P=250,152,509
as of December 31, 2008 and 2007, respectively. The advances are guaranteed by SHI (see Note 8 for a more detailed discussion).
c. Has extended cash advances to SHI with an outstanding balance of P=137,370,246 as of
December 31, 2008 and 2007. These advances do not have fixed repayment terms. In September 2007, SHI assigned all its rights in SHI’s investment in shares of stock in Professional Services, Inc. valued at P=200 million as partial payment for SHI’s advances (see Note 10 for a more detailed discussion).
d. Sells goods to HBC and PTSI, two of the Company’s distributors. e. Has lease agreement with HBC for the lease of the Company’s office space for a year,
renewable annually upon mutual agreement of both parties, for a monthly fee of P=768,398.
f. Donates to SFI to support SFI’s various outreach programs.

- 30 -
g. Had Marketing Services Agreement with SII to market the Company’s products and goods in the international market at a monthly fee of P=1.50 million until August 2007. Starting September 2007, the Company manages its own international operations.
h. Had Management Services Agreement with SHI to provide the Company with its expertise
and facilities in the conduct and operations of the Company, for a monthly fee of P=3.50 million until August 2007. Starting September 1, 2007, the Company has assumed the functions being done by SHI.
i. There are certain patents owned by Dr. Rolando Hortaleza, Chairman and Chief Executive
Officer, which the Company uses free of charge.
j. Compensation of key management personnel of the Company are as follows:
2008 2007 2006Short-term employee benefits P=70,598,595 P=76,082,019 P=52,678,141 Post-employment retirement benefits 4,194,600 5,669,162 4,008,326 P=74,793,195 P=81,751,181 P=56,686,467
16. Cost of Goods Sold
2008 2007 2006 Raw materials and changes in inventories (Note 11) P=1,400,322,459
P=1,369,611,637 P=962,523,439
Direct and indirect labor (Note 17b) 43,974,255 49,054,759 43,198,617 Depreciation and amortization (Note 17a) 26,871,422 34,453,715 45,962,397 Other overhead costs 32,835,442 22,041,128 42,294,674 P=1,504,003,578 P=1,475,161,239 P=1,093,979,127
17. Operating Expenses
2008
2007 (As restated,
Note 2)
2006(As restated,
Note 2)Advertising and promotions P=916,440,475 P=722,012,581 P=648,144,571Personnel costs (Notes 2 and 17b) 221,092,909 174,049,355 122,300,335Transportation and travel 92,228,895 67,327,381 43,680,597Outside services (Note 15) 29,250,176 72,136,430 124,681,966Taxes and licenses 22,521,186 18,070,934 17,338,075Rent (Note 15) 20,582,564 11,939,319 8,173,075Depreciation and amortization (Note 17a) 20,477,247 16,278,060 32,150,829Insurance 13,031,880 13,663,113 10,019,762Communication, light and water 11,234,230 11,894,820 6,561,015Membership, dues and subscriptions 5,628,122 7,173,334 1,773,541Provision for doubtful accounts (Note 5) 4,732,343 19,948,367 3,000,000Repairs and maintenance 3,849,371 4,256,903 3,199,565Research and development 3,404,124 11,049,536 6,067,506Supplies 2,571,168 7,548,380 5,825,660Product samples and give aways 1,963,761 7,511,300 3,757,067Others 34,668,324 46,535,268 20,729,043 P=1,403,676,775 P=1,211,395,081 P=1,057,402,607

- 31 - a. Depreciation and amortization expense are charged to the following:
2008 2007 2006Cost of goods sold (Note 16) P=26,871,422 P=34,453,715 P=45,962,397Operating expenses 20,477,247 16,278,060 32,150,829 P=47,348,669 P=50,731,775 P=78,113,226
b. Personnel costs are composed of the following:
2008
2007 (As restated,
Note 2)
2006 (As restated,
Note 2)Salaries and wages P=196,534,924 P=160,747,162 P=118,757,492Retirement benefits cost (Note 18) 13,843,022 10,278,863 6,879,672 Employees’ benefits 54,689,218 52,078,089 39,861,788 P=265,067,164 P=223,104,114 P=165,498,952
Personnel costs are charged to the following:
2008 2007 2006 Cost of goods sold (Note 16) P=43,974,255 P=49,054,759 P=43,198,617 Operating expenses 221,092,909 174,049,355 122,300,335 P=265,067,164 P=223,104,114 P=165,498,952
18. Retirement Benefits
The Company has a funded, noncontributory, defined benefit retirement plan covering substantially all its regular employees. The benefits are based on years of service and compensation on the last year of employment. The latest actuarial valuation of the defined benefit retirement plan is as of December 31, 2008.
The components of retirement benefits cost (included in “Personnel Costs” and “Direct and Indirect Labor” under operating expenses and cost of goods sold, respectively) in the statements of income are as follows:
2008
2007 (As restated,
Note 2)
2006(As restated,
Note 2)Current service cost P=7,206,200 P=6,526,733 P=3,713,683 Interest cost on benefit obligation 12,155,324 8,230,778 7,498,780 Expected return on plan assets (5,518,502) (4,478,648) (4,332,791)Retirement benefits cost P=13,843,022 P=10,278,863 P=6,879,672
The unfunded status shown as “Retirement benefits liability” in the balance sheets are as follows:
2008 2007Present value of defined benefit obligation P=60,441,000 P=116,765,841 Fair value of plan assets (81,895,563) (78,835,740)Adjustment on asset ceiling 21,454,563 – Retirement benefits liability P=– P=37,930,101

- 32 -
The following tables present the changes in the present value of defined benefit obligation and fair value of plan assets:
Defined benefit obligation
2008 2007 Balance at beginning of year P=116,765,841 P=99,623,372 Current service cost 7,206,200 6,526,733 Interest cost 12,155,324 8,230,778 Benefits paid (2,377,011) (5,570,777)Transfer from affiliate – 2,242,689 Actuarial losses (gain) (73,309,354) 5,713,046 Balance at end of year P=60,441,000 P=116,765,841
Fair value of plan assets
2008 2007 Balance at beginning of year P=78,835,740 P=52,623,938 Expected return on plan assets 5,518,502 4,478,648 Contributions – 16,758,424 Benefits paid (2,377,011) (5,570,777)Transfer from affiliate – 11,356,749 Actuarial losses (81,668) (811,242)Balance at end of year P=81,895,563 P=78,835,740
The allocation of the fair value of the plan assets follows:
2008 2007 Government securities 73% 70%Investment in shares of stock 5% 7%Cash and cash equivalents 8% 22%Other receivables and investments 14% 1% 100% 100%
The actual return of plan assets amounted to P=5,436,834 and P=3,667,406 in 2008 and 2007, respectively. The overall expected rate of return on plan assets is determined based on the market prices prevailing on that date, applicable to the period within which the obligation is to be settled.
The principal actuarial assumptions used to determine the retirement benefits cost as of January 1 are as follows:
2008 2007 2006 Discount rate 10.41% 8.08% 12.00%Salary increase rate 7.5% 9.00% 7.50%Expected rate of return on plan assets 7.5% 7.00% 10.00%
The discount rate used to determine retirement benefits obligation as of December 31, 2008 is 13.8%.

- 33 -
Amounts for the current and previous three (3) years are as follows:
2008 2007 2006 2005Defined benefit obligation P=60,441,000 P=116,765,841 P=99,623,372 P=62,489,836Plan assets (81,895,563) (78,835,740) (52,623,938) (43,327,906)Unfunded (excess) (P=21,454,563) P=37,930,101 P=46,999,434 P=19,161,930
2008 2007 2006 2005 Actuarial loss (gain) on benefit obligation:
Effects of changes in actuarial assumptions (P=46,226,900) P=3,572,244
P=1,341,365 P=3,572,244
Experience adjustments on benefit obligation (27,082,454) 2,140,802
23,640,613 (772,526)
(73,309,354) 5,713,046 24,981,978 2,799,718 Actuarial loss (gain) on plan assets: Experience adjustments on plan assets 81,668 811,242
2,975,854 (777,824)
Net actuarial losses (gains) (P=73,227,686) P=6,524,288 P=27,957,832 P=2,021,894
Cumulative actuarial losses (gains) (P=36,723,672) P=36,504,014 P=29,979,726 P=2,021,894 Movements in the retirement benefits liability for 2008 and 2007 are as follows:
2008 2007 Balance at beginning of year P=37,930,101 P=46,999,434 Retirement benefits cost for the year 13,843,022 10,278,863 Actuarial gain (loss) recognized in SORIE (73,227,686) 6,524,288 Adjustment in asset ceiling recognized in SORIE 21,454,563 – Contributions paid – (16,758,424)Transfer from affiliate – (9,114,060)Balance at end of year P=– P=37,930,101
The Company does not expect to contribute to the retirement plan in 2008. 19. Interest Income and Interest Expense a. Interest income was derived from:
2008 2007 2006Note receivable (Notes 8 and 15) P=28,254,476 P=25,899,936 P=–Cash and cash equivalents (Notes 4 and 15) 67,952,366 10,122,776 2,580,950 P=96,206,842 P=36,022,712 P=2,580,950
b. Interest expense (see Note 13) consists of:
2008 2007 2006FRNs P=70,005,903 P=21,199,044 P=–Amortization of debt issuance cost and others 3,009,998
4,727,235 –
Bank loans – 18,418,069 30,364,288Long-term debt – 30,165,642 32,291,488 P=73,015,901 P=74,509,990 P=62,655,776

- 34 - 20. Income Taxes
a. The components of the Company’s net deferred income tax assets represent the deferred income tax effects of the following:
2008 2007 2006 Accruals for expenses P=18,770,422 P=– P=– Allowances for: Doubtful accounts 8,379,663 9,395,804 4,061,474 Inventory obsolescence 2,011,188 10,332,000 12,250,000 Unamortized portion of past service cost 5,220,529 5,527,124 5,096,290 Unrealized foreign exchange loss (gain) (1,187,837) 2,459,541 364,063 Retirement benefits liability – 9,330,805 16,449,802 P=33,193,965 P=37,045,274 P=38,221,629
The Company did not recognize the excess of MCIT over regular corporate income tax
(RCIT) incurred in 2008 amounting to P=5,341,856 since management believes that the Company has no sufficient taxable income in the future against which the excess MCIT can be utilized prior to its expiration in 2011.
b. A reconciliation of the income tax expense computed by applying the statutory income tax
rate of 35% to the provision for (benefit from) income tax as shown in the statements of income is summarized as follows:
2008
2007 (As restated,
Note 2)
2006(As restated,
Note 2)Provision for income tax at 35% P=103,891,803 P=97,500,201 P=85,429,885 Additions to (reductions in) income tax resulting from: Nontaxable net income under ITH (107,126,182) (49,853,979) (43,410,478) Interest income subjected to final tax (23,783,328) (2,590,522) (903,332) Nondeductible interest expense 12,483,869 1,441,741 473,454 Nondeductible expenses 4,614,905 3,941,241 – Nontaxable dividend income (1,325,045) – – Mark-to-market gain (loss) on derivative asset (27,678)
636,294 –
Recovery of prior income taxes paid – (47,469,548) – Reversal of excess provision – – (21,161,534) Effect of change in income tax rate and others 10,371,571
(4,304,285) 50,548
Provision for (benefit from) income tax (P=900,085) (P=698,857) P=20,478,543 The breakdown of provision for (benefit from) income tax follows:
2008
2007 (As restated,
Note 2)
2006(As restated,
Note 2)Currently payable (MCIT in 2008 and RCIT in 2007 and 2006) P=5,535,408
P=47,107,253 P=19,514,404
Deferred (6,435,493) (336,562) 964,139 Recovery of prior income taxes paid (see Note 20d) –
(47,469,548) –
(P=900,085) (P=698,857) P=20,478,543

- 35 -
c. The Bureau of Internal Revenue (BIR) on various dates from February 2, 2004 to December 27, 2008 granted the Company income tax exemption under Republic Act (RA) No. 7459, otherwise known as the Inventors and Inventions Incentives Act of the Philippines, for the following patented designs or products:
Utility Model No./ Patent Registration No.
Date of First Sale
Products Covered
2-2008-000258 2008 Maxipeel Exfoliating Soap, Skinwhite Power Whitening Soap, Extraderm White and Smooth Soap
2-2008-000196 2008 Skinwhite HBL - SPF 10, SPF 20, Cooling and Hydrating, Skinwhite Face Cream
2-2008-000422 2008 Vitress Hair Cuticle Coat, Vitress Hair Cuticle Coat - Hair Repair, Heat Protection, Instant Relief, Vitress Hair Solutions - Hair Repair Cuticle Coat, Heat Protection Cuticle Coat, Instant Relax Cuticle Coat
UM -8471 2001 Extraderm Exfoliant Plus 1, 2, 3 & 4 and Maxipeel 2 2 -1997 -15095 1997 Maxipeel 3 2 -1999 -00320 1999 Extract Therapy with Tea Tree Oil 2 -2001 -000110 2006 Maxipeel Solution No. 3 2 -2001 -000291 2006
2005
Extraderm Exfoliating Facial Wash 1, 2, & 3Extraderm Oil and Shine Control Purifying Facial Wash, Skinwhite Whitening Body Wash and Biolink Green Papaya Whitening Facial Wash and Facial Scrub
2 -2003 -000284 2003 2006
Extraderm Clear Solution # 1, 2 & 3 and Extraderm Age-defy Solutions # 1, 2 & 3
2 -2004 -000075 2005 Livermore Illumiderm Glutathione Capsule 2-2000-000161 2002 Vitasoft Cologne Gel 2-2006-000297 2007 Biolink VCO Moisturizing Bath Soap 2-2007-000428 2008 Extraderm W&S Solution #1,2 &3,
Maxipeel New Generation Solution #1, 2 and 3, Skinwhite Power Radiance Solution, Skinwhite Power Whitening Face Hand & Body Lotion SPF 20, Skinwhite Whitening Face Solution, Maxipeel Exfoliant Face Scrub, Maxipeel Exfoliant Facial Wash, Maxipeel Exfoliant Serum
2-2007-000192 2007 Extract Papaya Calamansi Soap, Extract Green, Papaya Calamansi Soap Extract Papaya Calamansi Lotion, Extract Papaya Calamansi Facial Cleanser, Extract Green Papaya Calamansi Facial Cleanser, Extract Papaya Calamansi Facial Cream, Extract Hand and Body Lotion Papaya Calamansi, Extract Hard and Body Lotion-Green Papaya Calamansi

- 36 -
The income tax exemption is granted to promote, encourage, develop and accelerate commercialization of technologies developed by local researchers or adopted locally from foreign sources including invention. Any income derived from these technologies shall be exempted from income taxes during the first ten (10) years from the date of the first sale on a commercial scale. Gross profit and net operating income covered by the income tax exemption amounted to: 2008 - P=1,426.9 million and P=406.78 million; 2007 - P=421.0 million and P=191.6 million; and 2006 - P=489.1 million and P=124.0 million.
d. On May 29, 2007, the Court of Tax Appeals (CTA) Second Division decided in favor of the
Company and ordered the BIR to refund the claim for refund for excess income taxes the Company paid for the taxable year 2002 amounting to P=47,469,548 arising from its retroactive application of the income tax exemption incentives under RA No. 7459. On October 30, 2007, the CTA denied the Motion for Reconsideration that the BIR filed. On December 7, 2007, the BIR filed a petition for review with the CTA En Banc which the CTA En Banc denied. On May 6, 2008, the CTA En Banc unanimously decided in favor of the Company.
Based on the above facts, the Company recognized the receivable from the BIR amounting to
P=47,469,548 and recognized “Recovery of prior income taxes paid” for the same amount in 2007 (see Note 20).
On August 4, 2008, the Supreme Court denied the Petition for Review on Certiorari filed by
the BIR. On February 17, 2009, the CTA Second Division granted the Motion of Execution that the Company filed.
e. The regular corporate income tax effective January 1, 2009 is 30% as provided under Republic
No. 9337 on the E-VAT Act of 2005.
21. Segment Reporting
The Company’s reportable segments in accordance with PFRS 8 are as follows:
Domestic Operations - sells and markets personal, health and beauty products through distributors located within the Philippines.
International Operations - sells and markets personal, health and beauty products through foreign distributors located outside the Philippines and through local consolidators located within the Philippines.
For management purposes, the Company chose to organize the entity into geographical areas where its products are sold. Management monitors the operating results of business segments separately for the purpose of making decisions about resources to be allocated and of assessing performance. Segment performance is evaluated based on Net sales and Operating profit or loss. Operating profit is obtained only by deducting operating expenses from gross profit. Finance costs, finance income and income taxes are managed at the Company level. Segment assets only include receivables and inventories. All other assets are not allocated to the segments as part of information provided to CODM. Segment liabilities are not reported to the CODM.

- 37 -
The Company’s segment information is as follows (in thousands):
December 31, 2008 Domestic International Total Net sales (Notes a and b) P=2,898,852 P=266,372 P=3,165,224 Cost of goods sold (Note b) 1,400,385 103,618 1,504,003 Gross profit 1,498,467 162,754 1,661,221 Operating expenses 1,326,184 77,493 1,403,677 Operating profit (Note c) P=172,283 P=85,261 P=257,544
Depreciation and amortization (Note d) P=42,745 P=56 P=42,801 Segment Assets (Note e): Trade receivables (Notes a and b) P=909,093 P=141,368 P=1,050,461 Inventories (Notes b and g) 388,673 27,976 416,649 Total P=1,297,766 P=169,344 P=1,467,110 Capital expenditures (Note f) P=24,888 – 24,888
December 31, 2007
Domestic International Total Net sales (Notes a and b) P=2,765,040 P=245,792 P=3,010,832 Cost of goods sold (Note b) 1,384,305 90,856 1,475,161 Gross profit 1,380,735 154,936 1,535,671Operating expenses 1,162,939 48,456 1,211,395 Operating profit (Note c) P=217,796 P=106,480 P=324,276 Depreciation and amortization (Note d) P=50,676 P=56 P=50,732
Segment Assets (Note e): Trade receivables (Notes a and b) P=690,974 P=67,232 P=758,206 Inventories (Notes b and g) 344,477 20,198 364,675 Total P=1,035,451 P=87,430 P=1,122,881 Capital expenditures (Note f) P=20,585 P=– P=20,585
December 31, 2006
Domestic International Total Net sales (Notes a and b) P=2,184,909 P=214,173 P=2,399,082 Cost of goods sold (Note b) 1,009,765 84,214 1,093,979 Gross profit 1,175,144 129,959 1,305,103 Operating expenses 1,004,532 52,870 1,057,402 Operating profit (Note c) P=170,612 P=77,089 P=247,701 Depreciation and amortization (Note d) P=77,970 P=143 P=78,113
Segment Assets (Note e): Trade receivables (Notes a and b) P=390,796 P=51,710 P=442,506 Inventories (Notes b and g) 207,600 9,859 217,459 Total P=598,396 P=61,569 P=659,965 Capital expenditures (Note f) P=2,902 P=– P=2,902
Notes:
a. Segment revenues and related receivables for both domestic and international segments are recognized when the goods are delivered to distributors/local consolidators which is the same recognition followed and reflected in the financial statements.

- 38 -
b. There are no inter-segment sales or transactions. Consequently, the sum of the Domestic and International segment accounts agree with the amounts reflected in the statements of income.
c. Operating profit is obtained only by deducting operating expenses from gross profit. Other revenue and expenses to arrive at net income such as finance costs, finance income and income taxes are managed at the Company level.
d. Depreciation and amortization expense is allocated to the segments based on asset utilization without allocating the related depreciable assets to that segment.
e. Total segment assets include receivables and inventories. All other assets such as cash and other financial instruments and property, plant and equipment are not allocated to the segments. Segment liabilities are not reported to the CODM.
f. Capital expenditures consist mainly of additions to property, plant and equipment. g. Inventories are presented at cost; thus allowance for inventory obsolescence are not deducted
from the amounts reported. Product Category net sales information (in thousands):
December 31, 2008 Domestic International TotalPersonal Care Hair Care P=511,662 P=9,887 P=521,549 Skin Care 2,066,794 209,238 2,276,032 Naturals 266,903 46,458 313,361 Others 8,489 – 8,489Total Personal Care 2,853,848 265,583 3,119,431Health and Wellness 45,004 789 45,793 P=2,898,852 P=266,372 P=3,165,224
December 31, 2007
Domestic International TotalPersonal Care Hair Care P=536,414 P=7,143 P=543,557 Skin Care 1,481,295 213,481 1,694,776 Naturals 628,519 19,866 648,385 Others 105,000 – 105,000Total Personal Care 2,751,228 240,490 2,991,718Health and Wellness 13,812 5,302 19,114 P=2,765,040 P=245,792 P=3,010,832
December 31, 2006
Domestic International TotalPersonal Care Hair Care P=480,524 P=2,718 P=483,242 Skin Care 1,388,444 188,711 1,577,155 Naturals 302,691 21,303 323,994Total Personal Care 2,171,659 212,732 2,384,391Health and Wellness 13,250 1,441 14,691 P=2,184,909 P=214,173 P=2,399,082

- 39 - Geographic Information - Net Sales from External Customers (in thousands):
2008 2007 2006 Philippines P=2,898,852 P=2,765,040 P=2,184,909 UAE 139,304 116,931 91,694 USA 51,820 8,777 1,695Indonesia 30,337 48,779 49,874 Nigeria 23,011 5,347 3,905 Malaysia 8,061 4,464 12,691 Other countries 13,839 61,494 54,314 266,372 245,792 214,173 P=3,165,224 P=3,010,832 P=2,399,082
The net sales information above is based on the location of the customer.
Major customer: Net sales from one (1) customer, who is the biggest drug store chain in the Philippines, in the domestic market amounted to P=314,450,533 or 10% of total Net sales in 2008. Sales to this customer amounted to P=368,069,440 and P=212,790,798 in 2007and 2006, respectively.
22. Rollforward and Reconciliation of the Amounts Reflected in the
Equity Section of the Balance Sheets (See Pages 40 and 41)
23. Earnings Per Share
December 31,
2008
December 31, 2007
(As restated, Note 2)
December 31, 2006
(As restated,Note 2)
(a) Net income P=297,733,808 P=279,270,860 P=223,606,843
(b) Weighted average number of shares 739,676,293 284,638,677 107,312,250
(c) Earnings Per Share [(a)/(b)] P=0.40 P=0.98 P=2.08 24. Other Agreements and Commitments
Agreements with Toll Manufacturers
a. Full Toll Manufacturing
The Company has an agreement with a certain contractor for the compounding, processing, and packaging of pure coconut chips, to be converted into the Company’s finished products, in accordance with the product specifications and packaging designs provided by the Company. The agreement with the contractor is for a period of one year, renewable at the option of the Company.

- 42 -
b. Partial Toll Manufacturing The Company has existing agreements with various contractors for the packaging of the
Company’s products. The agreements are for the period of one year, renewable at the option of the Company.
Agreements with Suppliers
The Company has agreements with various suppliers for the delivery of raw materials and packaging materials. Billings are based on the terms indicated on the purchase orders as mutually agreed between the parties.
Agreements with Distributors
The Company has agreements with various distributors for the latter to sell the goods of the Company in designated areas as indicated in the contracts. The distributors are given discount packages as stated in the agreement.
25. Financial Instruments Fair values Set out below is a comparison by category of carrying amounts and fair values of all of the
Company’s financial instruments as of December 31, 2008 and 2007:
2008 2007
Carrying Amount
Fair Value
Carrying Amount
Fair Value
(In Thousands) Financial Assets: Loans and Receivables:
Cash and cash equivalents P=1,842,075 P=1,842,075 P=1,975,038 P=1,975,038 Receivables - net Trade: Related party 137,578 137,578 131,288 131,288 Distributors and other accounts 912,882 912,882 626,918 626,918 Others: Related parties 6,189 6,189 187,565 187,565 Third parties 46,230 46,230 32,771 32,771 Receivable from a land developer 18,750 18,750 75,000 75,000 Note receivable, including current portion - per class 204,307 214,145
250,153 281,131
Advances to a stockholder 137,370 137,370 137,370 137,370 3,305,381 3,315,219 3,416,103 3,447,081 AFS Investments: Unquoted 200,000 200,000 200,000 200,000 Quoted 15,945 15,945 19,770 19,770 215,945 215,945 219,770 219,770 Financial assets at FVPL: Derivative asset – – 1,077 1,077 P=3,521,326 P=3,531,164 P=3,636,950 P=3,667,928
(Forward)

- 43 -
2008 2007
Carrying Amount
Fair Value
Carrying Amount
Fair Value
(In Thousands) Financial Liabilities: Other Financial Liabilities Accounts payable and accrued expenses:
Trade payables P=637,956 P=637,956 P=637,434 P=637,434 Accrued expenses 137,090 137,090 113,702 113,702 Other current liabilities 7,339 7,339 11,355 11,355 Floating rate notes payable 938,427 938,427 985,417 985,417 P=1,720,812 P=1,720,812 P=1,747,908 P=1,747,908
Cash and cash equivalents, receivables, advances to a stockholder and accounts payable and accrued expenses The carrying amounts of the aforementioned financial assets and liabilities approximate the fair values due to the short-term nature of these accounts.
Note receivable The fair value of the note receivable with fixed interest rate is determined by discounting the future cash flows using the prevailing rate as of the reporting date. Discount rates used range from 7.65% to 8.38% and 7.30% to 7.61% as of December 31, 2008 and 2007, respectively.
AFS investments The fair value of quoted AFS investments was determined by reference to market bid quotation as of balance sheet date. The fair value of unquoted AFS investments was determined based on the latest sale transaction as of balance sheet date as confirmed by the issuer.
Floating rate notes payable The carrying value approximates the fair value because of the quarterly repricing of interest rates
based on market conditions. Derivative asset The fair value of derivative asset is based on valuation technique using market observable inputs
such as interest rates and spot rates. 26. Financial Risk Management Objectives and Policies
The Company’s principal financial instruments comprise of cash and cash equivalents, notes receivable, advances to a stockholder, AFS investment, and floating rate notes payable. The main purpose of the Company’s financial instruments is to fund its operations and capital expenditures. The Company has various other financial assets and liabilities such as trade and other receivables, accounts payable and accrued expense which arise directly from its operations.
The main risks arising from the Company’s financial instruments are interest rate risk, foreign currency risk, credit risk and liquidity risk. The BOD reviews and agrees policies for managing each of these risks and they are summarized below.
Interest rate risk Interest rate risk is the risk that future cash flows from a financial instrument (cash interest rate risk) or its fair value (fair value interest rate risk) will fluctuate because of changes in market interest rates.

- 44 -
The Company’s floating rate notes payable is exposed to cash flow interest rate risk (see Note 13). The repricing of the floating rate notes payable is done on intervals of three (3) months.
The Company regularly monitors interest rate movements and, on the basis of current and
projected economic and monetary data, decides on the best alternative to take. The Company has a one time option under its Notes Facility to convert the interest rate from floating to fixed rate. The Company monitors the interest rate volatility to determine whether the option to change the interest rate to fixed rate has to be exercised, to protect it from spiraling interest costs should interest rates go up.
The following table demonstrates the sensitivity of income before income tax as of December 31, 2008 and 2007 due to a reasonably possible change in interest rates, with all other variables held constant.
Increase/decrease in market basis points
Effect on income before income tax Increase (decrease)
2008 +240 bps (P=22.79 million) -240 bps 22.79 million
2007 +10bps (P=1.00 million) -10bps 1.00 million
There is no other impact on the Company’s equity other than those already affecting profit on loss.
Foreign currency risk The Company is exposed to foreign currency exchange risk arising from its exposure to the US dollar rate fluctuation on its trade receivables on export sales and cash and cash equivalents denominated in US dollars.
It is not considered practical or cost effective at present to use financial instruments or derivatives to manage the Company’s exposure to exchange rate fluctuation. Instead, foreign exchange rates are reviewed and monitored periodically by the Company’s BOD. The Company maintains U.S. dollar accounts to manage its foreign currency denominated transactions.
The outstanding balance as of December 31, 2008 and 2007 of the Company’s foreign currency-denominated financial assets and liabilities are as follows:
2008 2007 In U.S. dollar In Php In U.S. dollar In Php Financial assets: Cash and cash equivalents $568,820 P=27,030,334 $1,144,169 P=47,231,296 Receivables - net 2,974,290 141,368,000 1,613,105 66,588,974 3,543,110 168,398,334 2,757,274 113,820,270Financial liabilities: Accounts payable and accrued expenses – –
(122,952) (5,075,458)
$3,543,110 P=168,398,334 $2,634,322 P=108,744,812

- 45 -
The following table demonstrates the sensitivity to a reasonably possible movement of the Philippine peso against the U.S. dollar, with all other variables held constant, of the Company’s income before income tax due to changes in fair value of monetary assets and liabilities.
Appreciation (depreciation) of Php rate against
U.S. dollar
Effect on profit before tax
2008 + 9% (P=15.15 million) - 9% 15.15 million 2007 +6.73% (P=7.32 million) -6.73% 7.32 million
Credit risk Credit risk is the risk that the Company will incur a loss because its customers or counterparties failed to discharge their contractual obligations. The Company trades only with recognized, creditworthy customers. It is the Company’s policy that all customers who wish to trade on credit terms are subject to credit verification procedures and credit positions are monitored on a regular basis. In addition, receivable balances are monitored on an ongoing basis with the result that the Company’s exposure to bad debts is not significant. Outstanding receivables are mostly from big retail store chains which the Company services directly. Credit lines on these accounts are reviewed on a regular basis. The maximum exposure to credit risk is represented by the carrying amount of each financial asset in the balance sheets.
The table below shows the credit quality of the Company’s receivables based on their historical experience with the corresponding third parties. December 31, 2008 (in Millions) Neither past due nor impaired
Past Due or
Impaired Total High GradeStandard
Grade
Sub-Standard
GradeCash and cash equivalents P=1,842.08 P=– P=– P=– P=1,842.08Receivables Trade Related party 1.12 – 100.84 35.62 137.58 Distributor and
others 198.43 78.68 167.74 468.03 912.88 Others Related parties – 6.19 – – 6.19 Third parties 46.23 – – – 46.23 Receivable from a land
developer 18.75 – – – 18.75Note receivable, including
current portion – 204.31 – – 204.31Advances to a stockholder – 137.37 – – 137.37AFS investments: Unquoted 200.00 – – – 200.00 Quoted 15.94 – – – 15.94 P=2,322.55 P=426.55 P=268.58 P=503.65 P=3,521.33

- 46 -
December 31, 2007 (in Millions) Neither past due nor impaired
Past Due or
Impaired Total High GradeStandard
Grade
Sub-Standard
GradeDerivative asset P=1.08 P=– P=– P=– P=1.08Cash and cash equivalents 1,975.04 – – – 1,975.04Receivables Trade: Related party 71.60 – – 59.69 131.29 Distributor and
others 249.53 107.09 60.53 209.77 626.92 Others: Related parties 2.87 184.69 – – 187.56 Third parties 32.77 – – – 32.77 Receivable from a
land developer 75.00 – – – 75.00Note receivable, including
current portion – 250.15 – – 250.15Advances to a stockholder 137.37 – – – 137.37AFS investments: Unquoted 200.00 – – – 200.00 Quoted 19.77 – – – 19.77 P=2,765.03 P=541.93 P=60.53 P=269.46 P=3,636.95
High Grade financial assets are those cash and cash equivalents transacted with reputable local banks and related party, receivables from clients or customers that consistently pay their accounts on or before the due date and AFS investments transacted with counterparties that regularly declare dividends. Standard grade receivables includes receivables that are collected on their due dates even without an effort from the Company to follow them up while receivables which are collected on their due dates provided that the Company made a persistent effort to collect them are included under Sub-standard Grade receivables. Past due receivables and advances include those that are past due but are still collectible. An analysis of past due receivables, by age, is provided on the next table. The majority of these past due receivables are not considered to be impaired.
The table below shows an aging analysis of financial assets: December 31, 2008 (in Millions) Neither past
due nor impaired
Past due but not impaired
Impaired Total 1-30
Days 31-60 Days
60-90 Days
91-120 Days
Over 120 Days Subtotal
Cash and cash equivalents P=1,842.08 P=– P=–
P=–
P=– P=– P=–
P=– P=1,842.08
Receivables Trade: Related party 101.97 11.77 17.59
2.55
– 3.70 35.61
–
137.58
Distributor and other 444.85 304.58 70.34
36.58 10.75 11.96 434.21 33.82 912.88
Others: Related parties 6.19 – –
–
– – –
– 6.19
Third parties 46.23 – – – – – – – 46.23
(Forward)

- 47 -
December 31, 2008 (in Millions) Neither past
due nor impaired
Past due but not impaired
Impaired Total 1-30
Days 31-60 Days
60-90 Days
91-120 Days
Over 120 Days Subtotal
Receivable from a land developer P=18.75 P=– P=– P=– P=– P=–
P=– P=– P=18.75
Note receivable, including current portion 204.31 – –
–
– –
– – 204.31 Advances to a stockholder – 137.37 – – – –
137.37 –
137.37
AFS investments Quoted 200.00 – – – – – – – 200.00 Unquoted 15.94 – – – – – – 15.94
P=2,880.32 P=453.72 P=87.93 P=39.13 P=10.75 P=15.66 P=607.19 P=33.82 P=3,521.33
December 31, 2007 (in Millions) Neither past
due nor impaired
Past due but not impaired
Impaired Total 1-30
Days 31-60 Days
60-90 Days
91-120 Days
Over 120 Days Subtotal
Derivative asset P=1.08 P=– P=– P=– P=– P=– P=– P=– P=1.08 Cash and cash equivalents 1,975.04 – –
–
– – –
– 1,975.04
Receivables Trade: Related party 71.61 – –
–
– 53.57 53.57
6.11
131.29
Distributor and other 417.15 106.52 36.54
5.90 0.49 37.34 186.79
22.98 626.92
Others: Related parties 187.56 – –
–
– – –
– 187.56
Third parties 32.77 – – – – – – 32.77 Receivable from a
land developer 75.00 – – – – – –
– 75.00 Note receivable, including current portion 250.15 – –
–
– –
–
– 250.15 Advances to a stockholder 137.37 – – – – –
–
–
137.37
AFS investments Quoted 200.00 – – – – – – – 200.00 Unquoted 19.77 – – – – – – 19.77
P=3,367.50 P=106.52 P=36.54 P=5.90 P=0.49 P=90.91 P=240.36 P=29.09 P=3,636.95
Liquidity risk Liquidity risk is the risk the Company will be unable to meet its payment obligations when they fall under normal and stress circumstances. The Company’s objective is to always maintain a certain level of cash up to 14 days sales. Receivable monitoring is performed on a daily basis to ensure positive liquidity. Standby credit lines are available from overdraft facilities and omnibus lines provided by banks. Excess funds are deposited in high-interest yield placements with terms of between 7 to 30 days.

- 48 -
The table below summarizes the maturity profile of the Company’s financial liabilities as of December 31, 2007 based on undiscounted payments (in thousands):
December 31, 2008:
Less
than 1 1 to 2 2 to 3
3 to 4 Year years years years Total Floating rate notes payable* P=123,689 P=121,468 P=118,311 P=849,925 P=1,213,393 Accounts payable and accrued expenses:
Trade payables 637,956 – – – 637,956 Accrued expenses 117,804 – – – 117,804 Other current liabilities 7,339 – – – 7,339 Total P=886,788 P=121,468 P=118,311 P=849,925 P=1,976,492
December 31, 2007:
Less
than 1 1 to 2 2 to 3
3 to 4
4 to 5 Year years years years years Total Floating rate notes payable* P=121,014 P=123,689 P=121,468 P=118,311 P=849,925 P=1,334,407 Accounts payable and accrued expenses:
Trade payables 637,434 – – – – 637,434 Accrued expenses 98,490 – – – – 98,490 Other current liabilities 11,356 – – – – 11,356 Total P=868,294 P=123,689 P=121,468 P=118,311 P=849,925 P=2,081,687
*Includes interest to maturity.
Capital Management The primary objective of the Company’s capital management is to ensure that it maintains a strong credit rating and healthy capital ratios in order to support its business, continue to provide returns to shareholders and benefits to other stakeholders, and to maintain an optimal capital structure that would reduce the cost of capital.
The Company regularly monitors its use of capital using leverage ratios, such as debt-to-equity ratio, and makes adjustments in the light of changes in economic conditions and its own financial position. To maintain or adjust its capital structure, the Company may adjust the dividend payment to shareholders, return capital to shareholders or issue new shares.
The following table summarizes the total capital considered by the Company as of December 31:
2008
2007(As restated,
Note 2)Floating rate notes payable P=938,426,801 P=985,416,803 Capital stock 746,160,357 746,160,357 Additional paid-in capital 1,676,712,406 1,676,712,406 Treasury stock (236,178,536) –Retained earnings 475,307,141 311,882,197 P=3,600,428,169 P=3,720,171,763
As described in Note 13-Floating Rate Notes, the Company is subject to certain negative covenants that could affect the Company’s capital structure. These include provisions such as contracting additional loans; declaration or payment of dividends in excess of fifty percent (50%) of the Company’s previous year’s net income; purchase, redeem, retire or otherwise acquire for
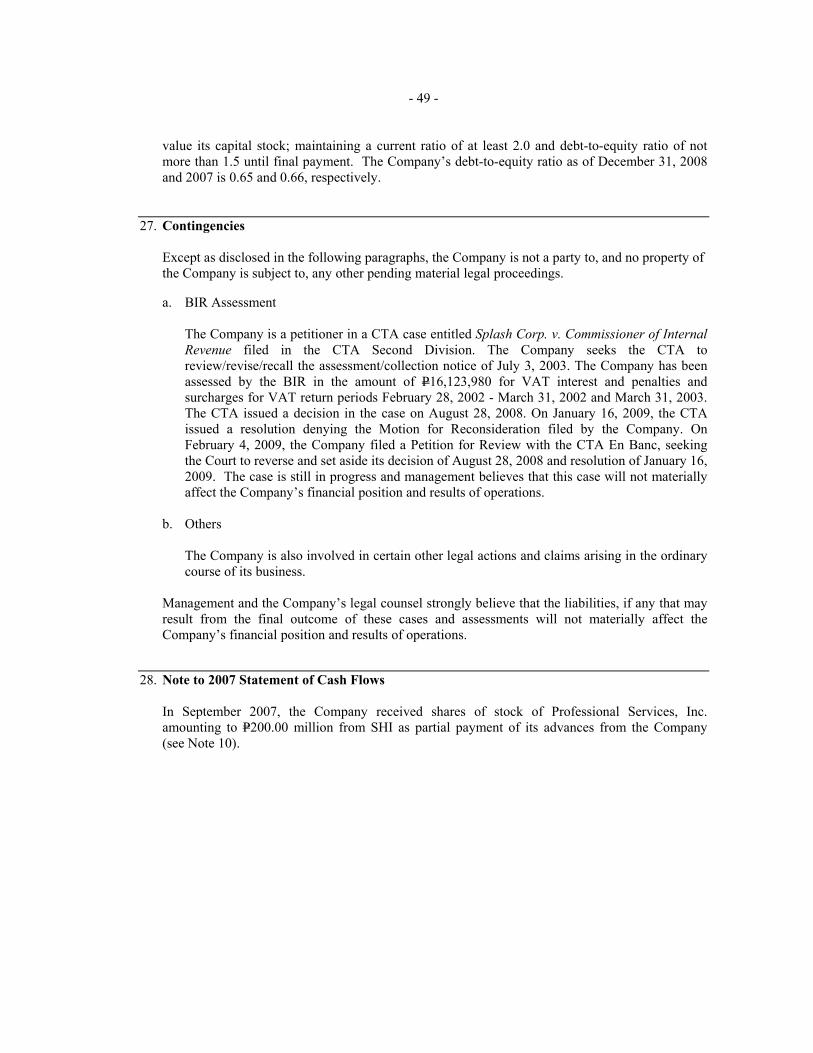
- 49 -
value its capital stock; maintaining a current ratio of at least 2.0 and debt-to-equity ratio of not more than 1.5 until final payment. The Company’s debt-to-equity ratio as of December 31, 2008 and 2007 is 0.65 and 0.66, respectively.
27. Contingencies
Except as disclosed in the following paragraphs, the Company is not a party to, and no property of the Company is subject to, any other pending material legal proceedings.
a. BIR Assessment
The Company is a petitioner in a CTA case entitled Splash Corp. v. Commissioner of Internal
Revenue filed in the CTA Second Division. The Company seeks the CTA to review/revise/recall the assessment/collection notice of July 3, 2003. The Company has been assessed by the BIR in the amount of P16,123,980 for VAT interest and penalties and surcharges for VAT return periods February 28, 2002 - March 31, 2002 and March 31, 2003. The CTA issued a decision in the case on August 28, 2008. On January 16, 2009, the CTA issued a resolution denying the Motion for Reconsideration filed by the Company. On February 4, 2009, the Company filed a Petition for Review with the CTA En Banc, seeking the Court to reverse and set aside its decision of August 28, 2008 and resolution of January 16, 2009. The case is still in progress and management believes that this case will not materially affect the Company’s financial position and results of operations.
b. Others
The Company is also involved in certain other legal actions and claims arising in the ordinary
course of its business.
Management and the Company’s legal counsel strongly believe that the liabilities, if any that may result from the final outcome of these cases and assessments will not materially affect the Company’s financial position and results of operations.
28. Note to 2007 Statement of Cash Flows In September 2007, the Company received shares of stock of Professional Services, Inc. amounting to P=200.00 million from SHI as partial payment of its advances from the Company (see Note 10).

*SGVMC308954*
- 40 - 22. Rollforward and Reconciliation of the Amounts Reflected in the Equity Section of the Balance Sheets
Capital Stock(Note 14)
AdditionalPaid-in Capital
(Note 14)
Cumulative Actuarial Gain (Loss)
on Defined Benefit Plan and Adjustment
on Asset Ceiling
Unrealized Valuation Gain
(Loss) onAvailable-for-sale
Investments
UnappropriatedRetainedEarnings
TreasuryStock Total
BALANCES AT JANUARY 1, 2006, AS PREVIOUSLY REPORTED P=107,312,250 P=257,378,165
P=– (P=2,376,900) P=157,639,715 P=– P=519,953,230
Change in accounting policy on actuarial gain and loss (Note 2) – –
(1,364,779) – 1,364,779 – –
BALANCES AT JANUARY 1, 2006, AS RESTATED 107,312,250 257,378,165
(1,364,779) (2,376,900) 159,004,494 – 519,953,230
Net income for the year, as previously stated – – – – 205,484,800 – 205,484,800Recovery in market value of AFS investments – – – 1,400,000 – – 1,400,000Change in accounting policy on actuarial gain and loss (Note 2) – –
(18,122,043) – 18,122,043 – –
Total recognized income and expense for the year, as restated – –
(18,122,043) 1,400,000 223,606,843 – 206,884,800
BALANCES AT DECEMBER 31, 2006 AS RESTATED P=107,312,250 P=257,378,165
(P=19,486,822) (P=976,900) P=382,611,337 P=– P=726,838,030
BALANCES AT DECEMBER 31, 2006, AS PREVIOUSLY REPORTED P=107,312,250 P=257,378,165 P=– (P=976,900) P=363,124,515 P=– P=726,838,030Change in accounting policy in actuarial gain and loss (Note 2) – – (19,486,822) – 19,486,822 – –
BALANCES AT DECEMBER 31, 2006, AS RESTATED 107,312,250 257,378,165
(19,486,822) (976,900) 382,611,337 – 726,838,030
Net income for the year, as previously stated – – – – 271,233,655 – 271,233,655Recovery in market value of available-for- sale investments – – – 5,520,000 – – 5,520,000
(Forward)

- 41 -
Capital Stock(Note 14)
AdditionalPaid-in Capital
(Note 14)
Cumulative Actuarial Gain (Loss)
on Defined Benefit Plan and Adjustment
on Asset Ceiling
Unrealized Valuation Gain
(Loss) onAvailable-for-sale
Investments
UnappropriatedRetainedEarnings
TreasuryStock Total
Change in accounting policy on actuarial gain and loss (Note 2) P=– P=–
(P=8,037,205) P=– P=8,037,205 P=– P=–
Total recognized income and expense for the year, as restated – –
(8,037,205) 5,520,000 279,270,860 – 276,753,655
Dividends declared (Note 14) – – – – (350,000,000) – (350,000,000)Issuance of common stock (Note 14) 638,848,107 1,419,334,241 – – – – 2,058,182,348
BALANCES AT DECEMBER 31, 2007 P=746,160,357 P=1,676,712,406 (P=27,524,027) P=4,543,100 P=311,882,197 P=– P=2,711,774,033
BALANCES AT DECEMBER 31, 2007, AS PREVIOUSLY REPORTED P=746,160,357 P=1,676,712,406
P=– P=4,543,100 P=284,358,170 P=– P=2,711,774,033
Change in accounting policy on actuarial gain and loss (Note 2) – –
(27,524,027) – 27,524,027 – –
BALANCES AT DECEMBER 31, 2007, AS RESTATED 746,160,357 1,676,712,406
(27,524,027) 4,543,100 311,882,197
2,711,774,033
Recognized net actuarial gain and adjustment on asset ceiling during the year – –
41,486,321
–– – 41,486,321
Decline in market value of AFS investments – – – (3,825,000) – – (3,825,000)Net income for the year – – – – 297,733,808 – 297,733,808Total income and expense for the year – – 41,486,321 (3,825,000) 297,733,808 – 335,395,129
Dividends declared (Note 14) – – – – (134,308,864) – (134,308,864)
Acquisition of treasury stock (Note 14) – – – – – (236,178,536) (236,178,536)
BALANCES AT DECEMBER 31, 2008 P=746,160,357 P=1,676,712,406 P=13,962,294 P=718,100 P=475,307,141 (P=236,178,536) P=2,676,681,762

1
Interim Financial Statements – First Quarter of 2009 BALANCE SHEETS As of March 31, 2009 and December 31, 2008
ASSETSCurrent AssetsCash and cash equivalents 1,782,372,046 1,842,075,488 Receivables - net 1,090,573,522 1,087,810,564 Current portion of notes receivable 49,932,240 54,215,416 Advances to stockholder 137,370,246 137,370,246 Inventories - net 382,883,306 381,756,239 Prepaid expenses and other current assets 139,716,846 45,023,355 Total Current Assets 3,582,848,207 3,548,251,308 Non-Current AssetsNotes receivable - net of current portion 150,091,505 150,091,505 Property, plant and equipment - net 274,523,231 272,065,531 Available for sale investments 215,945,000 215,945,000 Land for development 141,956,454 141,956,454 Deferred income tax assets 33,193,965 33,193,965 Other non-current assets 9,478,849 56,948,398 Total Non-Current Assets 825,189,004 870,200,853 TOTAL ASSSETS 4,408,037,210 4,418,452,161
As of March 31, 2009 (Unaudited)
As of Dec. 31, 2008 (Audited)

2
BALANCE SHEETS As of March 31, 2009 and December 31, 2008
LIABILITIES AND EQUITYCurrent LiabilitiesAccounts payable and accrued expenses 746,373,458 803,343,598 Current portion of floating rate notes payable 46,923,400 46,923,404 Total Current Liabilities 793,296,858 850,267,002 Non-current liabilitiesFloating rate notes payable - net 891,503,397 891,503,397 Retirement benefits liability - Total Non-Current Liabilities 891,503,397 891,503,397 Total Liabilities 1,684,800,255 1,741,770,399
EquityCapital Stock 746,160,357 746,160,357 Additional paid-in capital 1,676,712,406 1,676,712,406 Unrealized valuation gain (loss) on AFS assets 718,000 718,100 Cumulative acturial gain (loss) on defined benefit plan 13,962,300 13,962,294 Treasury stock (236,178,500) (236,178,536) Retained earnings 521,862,393 475,307,141 Total Equity 2,723,236,956 2,676,681,762 TOTAL LIABILITIES AND EQUITY 4,408,037,210 4,418,452,161
As of March 31, 2009 (Unaudited)
As of Dec. 31, 2008 (Audited)

3
STATEMENTS OF INCOME For the Quarters Ended March 31, 2009 and March 31, 2008
2009 2008Net Sales 623,475,258 627,675,000 Cost of goods sold (248,174,224) (259,864,000)
Gross profit 375,301,034 367,811,000 Operating expenses (298,288,090) (297,280,000) Interest income* 15,596,482 Interest expense (18,649,380) (16,004,000) Other income (charges)* Foreign exchange loss - net (8,421,177) Others (16,028,810) Net income before tax 49,510,059 68,700,000 Income tax (2,954,766) (24,045,000) Net income after tax 46,555,293 44,655,000
Earnings per share 0.07 0.06*2008 interest income, foreign exchange gain and other income (charges) reported in Q1/08 as consolidated total of Php14.173 million
For Quarter Ended March 31
14,173,000

4
STATEMENTS OF CHANGES IN STOCKHOLDERS' EQUITY For the Quarters Ended March 31, 2009 and March 31, 2008
Capital StockAdditional Paid In
Capital
Unrealized Valuation Loss
on Available for Sale (AFS)
Investments
Cumulative actuarial gain
(loss) on defined benefit
plan Treasury StockRetained Earnings Total
(Unaudited)Balances as at January 1, 2009 746,160,357 1,676,712,406 718,100 13,962,294 (236,178,536) 475,307,141 2,676,681,762
Net Income for the quarter 46,555,293 46,555,293
Balances as at March 31, 2009 746,160,357 1,676,712,406 718,100 13,962,294 (236,178,536) 521,862,434 2,723,236,956
(Unaudited)Balances as at January 1, 2008 746,160,357 1,676,712,406 4,543,100 284,358,170 2,711,774,033
Net Income for the quarter 68,700,000 68,700,000
Balances as at March 31, 2008 746,160,357 1,676,712,406 4,543,100 - - 353,058,170 2,780,474,033
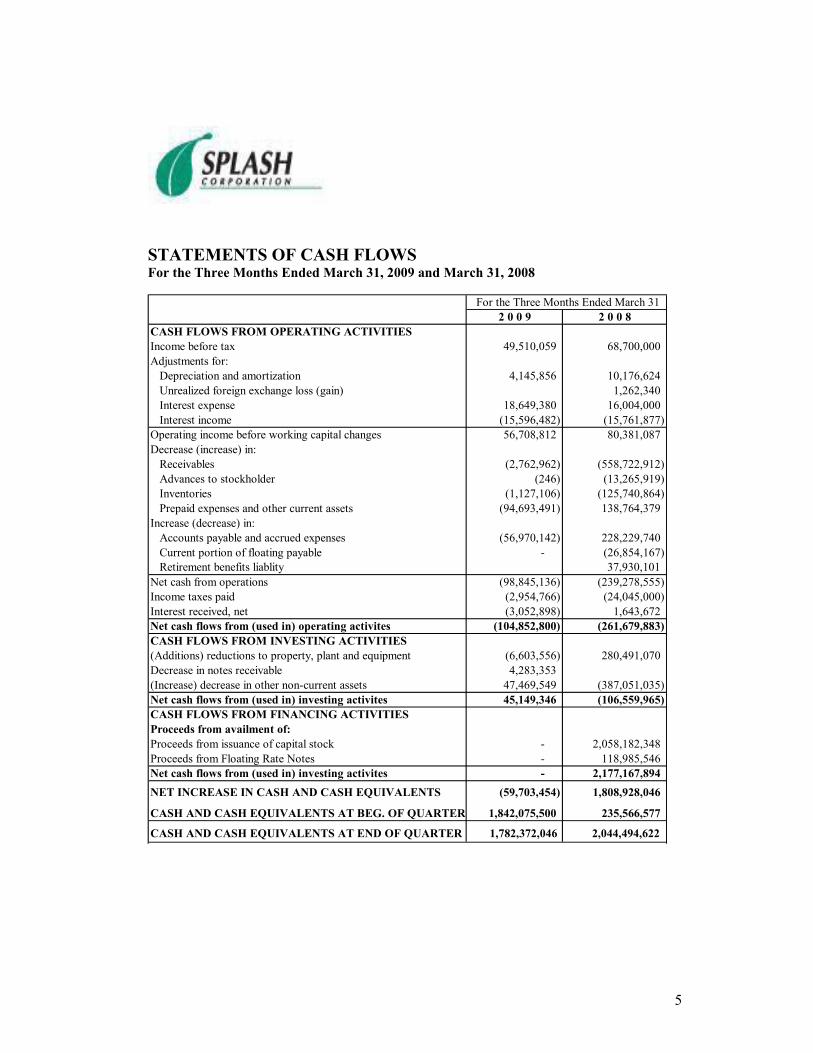
5
STATEMENTS OF CASH FLOWS For the Three Months Ended March 31, 2009 and March 31, 2008
2 0 0 9 2 0 0 8CASH FLOWS FROM OPERATING ACTIVITIESIncome before tax 49,510,059 68,700,000 Adjustments for: Depreciation and amortization 4,145,856 10,176,624 Unrealized foreign exchange loss (gain) 1,262,340 Interest expense 18,649,380 16,004,000 Interest income (15,596,482) (15,761,877) Operating income before working capital changes 56,708,812 80,381,087 Decrease (increase) in: Receivables (2,762,962) (558,722,912) Advances to stockholder (246) (13,265,919) Inventories (1,127,106) (125,740,864) Prepaid expenses and other current assets (94,693,491) 138,764,379 Increase (decrease) in: Accounts payable and accrued expenses (56,970,142) 228,229,740 Current portion of floating payable - (26,854,167) Retirement benefits liablity 37,930,101 Net cash from operations (98,845,136) (239,278,555) Income taxes paid (2,954,766) (24,045,000) Interest received, net (3,052,898) 1,643,672 Net cash flows from (used in) operating activites (104,852,800) (261,679,883) CASH FLOWS FROM INVESTING ACTIVITIES(Additions) reductions to property, plant and equipment (6,603,556) 280,491,070 Decrease in notes receivable 4,283,353 (Increase) decrease in other non-current assets 47,469,549 (387,051,035) Net cash flows from (used in) investing activites 45,149,346 (106,559,965) CASH FLOWS FROM FINANCING ACTIVITIESProceeds from availment of:Proceeds from issuance of capital stock - 2,058,182,348 Proceeds from Floating Rate Notes - 118,985,546 Net cash flows from (used in) investing activites - 2,177,167,894 NET INCREASE IN CASH AND CASH EQUIVALENTS (59,703,454) 1,808,928,046
CASH AND CASH EQUIVALENTS AT BEG. OF QUARTER 1,842,075,500 235,566,577
CASH AND CASH EQUIVALENTS AT END OF QUARTER 1,782,372,046 2,044,494,622
For the Three Months Ended March 31