Embed Size (px)
Citation preview

J. Exp. BM. (1974). 60, 881-899 8 8 lWith 1 plate and 12 text-figuresPrinted in Great Britain
DIRECTIONAL SENSITIVITY OF MICROPHONICPOTENTIALS FROM THE PERCH EAR
BY OLAV SANDInstitute of Zoophysiology, University of Oslo, Oslo, Norway
{Received 25 October 1973)
INTRODUCTION
The sacculus and lagena (pars inferior) form the part of the ear generally believedto be involved in hearing in teleosts (Dijkgraaf, 1950, 1952). Shearing movements ofthe sensory hairs are mediated by the existence of heavy otoliths in close contact withthe maculae. Due to their larger density the otoliths will lag behind the motion of thehair cells when the fish is vibrated in a sound field. The unaided otolith/haircellsystem is therefore sensitive to the kinetic part of the sound (Chapman & Sand, 1974).However, fish possessing a gas-filled swimbladder may utilize this organ as a pressure/displacement transformer, and such fish will respond to sound pressure, although thehair cells are still sensitive to particle motion. Evidence for an accessory role of theswimbladder in fish hearing generally, even in groups with no specialized associationbetween the bladder and the ear, has recently been provided (Chapman & Hawkins,1973; Sand & Enger, 1973; Chapman & Sand, 1974). The aspects offish hearing whichwill be considered in this paper are peripheral frequency analysis, directional hearingand the ability of re-radiated swimbladder pulsations to stimulate different parts ofthe ear.
Although lacking an analogue to the cochlea, fish are able to discriminate betweenfrequencies (see Tavolga, 1971). However, the mechanism for this pitch discriminationis still unknown. Synchronization between sound frequency and action potentials inthe auditory neurones might provide the necessary information, and recordings fromthe auditory nerve in different groups of fish have showed nerve discharges to bephase-locked to the sinusoidal stimuli (Lowenstein & Roberts, 1951; Enger, 1963;Furukawa & Ishii, 1967). Enger (1963) and Furukawa & Ishii (1967) also reporteddifferences in frequency sensitivity between nerve fibres, however, and even if thetuning curves of the individual fibres were rather broad, the possibiKty of a peripheralfrequency analysis in fish was demonstrated. This idea was strengthened by Andersen& Enger (1968) who by recording saccular microphonic potentials from the sculpin(Cottus scorpius) found differences in frequency sensitivity between the anterior andposterior part of the sensory macula. A peripheral frequency analysis might either bedue to differences in physiological properties of various hair cells, or, as in the cochlea,may be due to mechanical frequency analysis. This last possibility was considered byvan Bergeijk (1967), who suggested that travelling waves with frequency-dependentmaxima were generated along the macula during sound stimulation. On the otherhand, in the present paper the notion is put forward that mechanical frequencyanalysis in fish might be based upon a frequency-dependent pattern of otolithmovements.

882 OLAV SAND
It has been suggested that an auditory function of the swimbladder is contra-dictory to directional hearing in fish. Most fish have a single swimbladder, and sincea single pressure receptor is insufficient to locate a sound source, fish would be unableto detect the direction of a pressure wave (van Bergeijk, 1964). Earlier behaviouralstudies supported this view (Reinhardt, 1935; von Frisch & Dijkgraaf, 1935), butthese investigations were conducted in small tanks or at extremely shallow depth inthe field. The acoustical conditions were therefore very complicated and difficult topredict (Parvulescu, 1964, 1967). However, directional responses could be elicited ifthe distance to the sound source was less than a few cm, but in these cases detectionby cutaneous receptors was suggested. On the other hand, recent studies by Olsen(1969 a, b) on herring {Chtpea harengus) and cod {Gadus morkua) and by Schuijf,Baretta & Wildshutt (1972) on wrasse (Labrus bergyltd) were undertaken under free-field conditions in the sea, and clearly demonstrated that these species (which possessa swimbladder) can distinguish between different sound-source directions at a rangeof several metres. The herring was reported to detect differences in sound directionof less than 450 for frequencies from 20 to 6000 Hz, whereas the corresponding figurefor wrasse at 115 Hz (the only frequency tested) was less than 70°, and possibly asgood as io°. Chapman (1973), working on the cod, found that the masking of tonesignals by white noise was reduced when the tone and noise were transmitted fromdifferent directions, thus confirming that even fish with a swimbladder may possesswell-developed directional discrimination.
Sound pressure is a scalar quantity, while particle motion is a vector. Reception ofthe direction of a pressure wave therefore requires comparison of arrival time, in-tensity or phase between at least two pressure detectors. However, for a plane soundwave the particle displacement will be normal to the wave front, and a single kineticvector detector is therefore sufficient to determine the sound direction. Each haircell has an axis of maximal sensitivity (Flock & Wersall, 1962), and groups of hair cellswith different orientation will thus constitute such a detector. By comparing the out-put from each group, the direction of the sound source could be determined directly.However, the amplified particle motions re-radiated from the swimbladder mightmask the incident sound at the two ears, but this masking effect could be reduced byan arrangement of the haircells which made these insensitive to radial displacementsemanating from the swimbladder. The maculae of the pars inferior are situated in anapproximately vertical plane, and the orientation pattern of the saccular hair cells inthe burbot {Lota lota) (Wersall, Flock & Lundquist, 1965) and the goldfish (Caras-sius auratus) (Hama, 1969) indicates maximal sensitivity for vertical displacements ofthe otolith. On the other hand, complex movements of the otoliths might be expectedwhen a fish is vibrated linearly in a sound field, and the directional sensitivity ofdifferent parts of the fish ear can not easily be predicted from morphological data.
Enger et al. (1973) therefore recorded microphonic potentials from the sacculus inthe haddock (Melanogrammus aeglefinus) during horizontal vibration of the fish in air.The fish were mounted on a rotatable vibrating table to obtain well-defined directionalstimuli. The microphonic potential amplitude turned out to be a function of the vibra-tion angle, and maximal amplitude was most often obtained for vibration directionsparallel to the long axis of the fish. The hair cells contributing to this response werethus maximally sensitive to displacement in nearly the same direction as sound-

Directional sensitivity of vucrophomc potentials
1883
Horizontalvibrator
Ballbearing
10 cm
/ n
C 4=n»
u
^
rtr-«fi« o
U»UWJ
^
1rn \ v
•—y—'3 /Velocity transducer
Text-fig. 1. Drawing of the vibration table; lateral (A), frontal (B) and top side (C) view.See text for details.
induced swimbladder pulsations would produce, and this result therefore supportsthe theory of an auditory function of the swimbladder. However, in some cases theoptimal sensitivity was obtained for other vibration directions, and the authors con-cluded that a possible explanation for the ability of fish to detect the direction of asound source could be that different hair cells have different axes of maximal sensi-tivity to vibration.
The recording technique used by Enger et al. (1973) was rather crude, and theexact recording loci were not determined. The electrodes were coarse, and the activityof a large number of hair cells, probably including cells from both ears, was recordedsimultaneously. Furthermore, the stimuli were restricted to horizontal vibrationsonly, whereas the fact that the natural surroundings of most fish is a three-dimensionalmedium makes it interesting to measure the sensitivity to vertical vibrations as well.
The present investigation was thus undertaken to record microphonic potentialsfrom different parts of the pars inferior in perch {Perca fluviatilis) as a function ofvibrations in the horizontal and vertical plane. The stimulation technique used wasdeveloped from that described by Enger et al. (1973). The perch was chosen asexperimental animal because of its rigid skull and skeleton, which facilitated thevibration of the fish, and because its limited auditory frequency range (Wolff, 1967)nearly coincided with the working range of the vibrating table.
MATERIALS AND METHODSFish
Twenty-one perch (Perca fluviatilis) ranging in length from 16 to 24 cm were usedin the experiments. The fish were anaesthetized in a solution of MS 222 (Sandoz Ltd.,

OLAV SAND
Sacculus
Lagena
1 cm
Text-fig. 2. Sketch of the head of a 20 cm long perch with the dorsal part of the skull openedand the brain removed. Recordings were obtained from four electrode positions for each ear,as indicated by black and white dots for the right ear.
Basel), and thereafter clamped by five pairs of steel rods in a special Perspex holder.The first pair had a V-shaped incision which firmly held the skull just above the eyes.The structure of the fish holder is shown in Text-fig. 1.
The dorsal part of the skull was opened and the brain was gently removed, exposingthe sacculus and the lagena (Text-fig. 2). The pars inferior in the perch is positionedin a groove in the skull floor, but while the sacculus is only covered with the saccularmembrane, a thin bony shield protects the lagena. The electrode easily passed throughthe saccular membrane, but before the electrode could be positioned in the lagena asmall hole in the bony shield had to be drilled with a fine needle. The electrode wasplaced as medially as possible, with the tip just inside the sacculus or lagena. Asindicated in Text-fig. 2, recordings from the sacculus were made with anterior, mid
Directional sensitivity of microphonic potentials 885
60
40
2 20
u
•§ 10= 8CL
e 6
.1 4
90° 180°Vibration angle
270° 360°
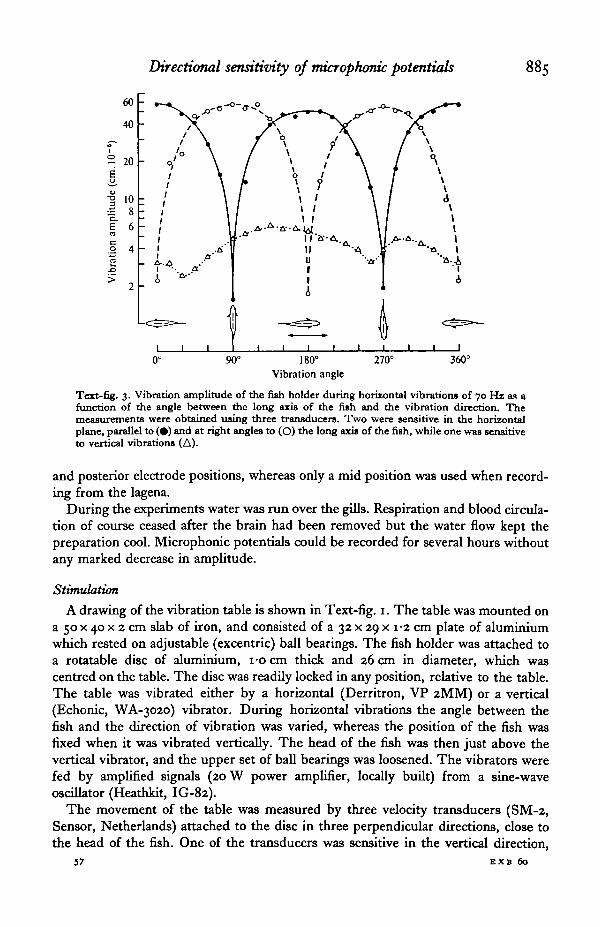
Text-fig. 3. Vibration amplitude of the fish holder during horizontal vibrations of 70 Hi as afunction of the angle between the long axis of the fish and the vibration direction. Themeasurements were obtained using three transducers. Two were sensitive in the horizontalplane, parallel to (#) and at right angles to (O) the long axis of the fish, while one was sensitiveto vertical vibrations (A).
and posterior electrode positions, whereas only a mid position was used when record-ing from the lagena.
During the experiments water was run over the gills. Respiration and blood circula-tion of course ceased after the brain had been removed but the water flow kept thepreparation cool. Microphonic potentials could be recorded for several hours withoutany marked decrease in amplitude.
Stimulation
A drawing of the vibration table is shown in Text-fig. 1. The table was mounted ona 50 x 40 x 2 cm slab of iron, and consisted of a 32 x 29 x 1-2 cm plate of aluminiumwhich rested on adjustable (excentric) ball bearings. The fish holder was attached toa rotatable disc of aluminium, i-ocm thick and 26 cm in diameter, which wascentred on the table. The disc was readily locked in any position, relative to the table.The table was vibrated either by a horizontal (Derritron, VP 2MM) or a vertical(Echonic, WA-3020) vibrator. During horizontal vibrations the angle between thefish and the direction of vibration was varied, whereas the position of the fish wasfixed when it was vibrated vertically. The head of the fish was then just above thevertical vibrator, and the upper set of ball bearings was loosened. The vibrators werefed by amplified signals (20 W power amplifier, locally built) from a sine-waveoscillator (Heathkit, IG-82).
The movement of the table was measured by three velocity transducers (SM-2,Sensor, Netherlands) attached to the disc in three perpendicular directions, close tothe head of the fish. One of the transducers was sensitive in the vertical direction,
57 EXB 60

886 OLAV SAND
whereas the other two were sensitive in the horizontal plane, along the long and shortaxes of the fish, respectively. The motion of the table was thus completely described.The vibration amplitude never exceeded 2 x io~* cm.
Signals from the transducers were fed into separate amplifiers (locally built) andvoltmeters (Briiel & Kjaer, 2409) for amplification and measurement. Text-fig. 3presents a set of vibration measurements at 70 Hz during horizontal vibration androtation of a fish. The vibration velocity values (rms) are here, and throughout thepaper, recalculated to displacement values. The ratio between the horizontal vibrationcomponent parallel to the driving force and the horizontal component normal to thiswas about 45, thus giving nearly linear horizontal movements. The ratio betweenthe horizontal and vertical vibration was about 10.
The table showed rather similar behaviour up to about 200 Hz, above whichfrequency the ratio between horizontal and vertical vibrations dropped drastically.Below 30 Hz the vibrations became markedly distorted, and 30-250 Hz was thus thepractical frequency range for the experiments involving rotation of the fish in thehorizontal plane.
During vertical vibration of the table the ratio between vertical and horizontalvibrations was close to 10, but distortions here occurred below 100 Hz. Only 200 and100 Hz were therefore tested in this type of experiments.
Recording of microphonic potentials
The electrode manipulator (Narishige, C-i) was fixed to the rotatable disc by arigid bridge suspension (Text-fig. 1). Due to the low mass and the rigid suspension ofthe manipulator, the relative movement between the fish and electrode was probablyvery slight. The electrodes were NaCl-filled glass pipettes with tip diameters of10—15/*. Microphonic potentials from the fish were amplified by a pre-amplifier(Tektronix, 122), displayed on an oscilloscope (Tektronix, RM 565) for photographing(Grass Kymograph Camera, C 4) and measured with a vacuum tube voltmeter(Briiel & Kjasr, 2409). Microphonic potentials in this paper are given in dB re 1 /iVrrns.
RESULTS
The microphonic potentials recorded from the pars inferior during vibration of thefish were twice the frequency of vibration, but the two peaks corresponding to onevibration cycle could be of different amplitude. To facilitate comparison betweendifferent recordings, the microphonic potentials were therefore measured by anintegrating a.c. voltmeter. The amplitude of the potentials was a function of both thestimulus strength and the direction of vibration. Two types of experiments wereconducted, namely measurement of relative vertical and horizontal sensitivity of themicrophonic potentials for the different electrode positions, and recording of micro-phonic potentials evoked by horizontal vibration during horizontal rotation of the fish.
Ratio between vertical and horizontal sensitivity of themicrophonic potentials
Text-fig. 4 shows an example of the microphonic potentials recorded from thelagena for vertical and horizontal vibrations of different intensities at 200 Hz. The

Directional sensitivity of microphonic potentials 887
• 2-9 5-5 100
w w w w AAAAAAAA
20 tnsI
Background 5.5 | 0 . 0
o
AA/WWWText-fig. 4. Microphonic potentials (upper trace of each recording) obtained from the lagenaduring vertical and horizontal vibrations of 200 Hz (lower trace of each recording). Theelectrode position wu the same throughout the series, and the vibration amplitudes (cm x io~*)are indicated on the figure. Note that vertical vibrations were the most efficient in evokingmicrophonic potentials.
electrode position was the same for the two vibration modes. During the horizontalvibration the angle between the direction of vibration and the fish was chosen to beoptimal for evoking microphonic potentials. It is seen that a much higher stimulusintensity was necessary for horizontal than for vertical vibrations to generate the sameamplitude of the microphonic potentials.
In Text-fig. 5 these potentials are presented as a function of the vibration amplitude,and the displacement amplitude necessary to evoke microphonic potentials just abovethe electric background noise is taken as a measure of the microphonic sensitivity forthe particular kind of vibration. The higher these threshold values are, the lower isthe microphonic sensitivity. It is seen that for the case presented in Text-fig. 5, themicrophonic sensitivity was about 5-8 times greater for vertical than for horizontalvibrations. Measurements of this type were performed on 5 lagenae for 100 and 200 Hz,and the average ratio between the vertical and horizontal microphonic sensitivity was29 (S.D. = o-8) and 5-6 (s.D. = 1-9), respectively.
In contrast to this high microphonic sensitivity to vertical vibrations, which wasobtained when recording from the lagena, the anterior part of the sacculus gave adifferent picture. This is seen from Text-figs. 4 and 6, which are based on directlycomparable data from two different fish. Text-fig. 6 shows recordings of microphonicpotentials for a fixed electrode position from the anterior part of the sacculus, and themicrophonic sensitivity to vertical and horizontal vibrations was clearly rather similar.Text-fig. 7 gives the microphonic potentials evoked by the two different vibrationmodes as a function of the vibration amplitude, in a comparable way as in the example
37-3

OLAV SAND
28
24
20
oCL 16co
o
12
8 -
• — Vertical
O-— Horizontal
*
o/
/,o
m/
o
o
3 10 30 100Vibration amplitude (cm. 10"')
Text-fig. 5. Microphonic potentials from the lagena as a function of vibration amplitude.Recording locus is the same as in Text-fig. 4. Level of electric background noise is indicatedby hatched area. Note that the horizontal vibration amplitude required to evoke microphonicpotentials just above the electric background noise was 5-8 times greater than the correspondingvertical vibration amplitude.
from the lagena shown in Text-fig. 5. It is seen that the microphonic sensitivity wasnearly identical for horizontal and vertical vibrations. Similar series of measurementswere obtained from nine sacculi for 100 and 200 Hz, and the mean ratio between themicrophonic sensitivity to vertical and horizontal vibrations was 1-2 (S.D. = 03) and1-i (S.D. = 0-4), respectively.
Recordings of microphonic potentials were also obtained from mid and posteriorpositions of the sacculus, and ratios between vertical and horizontal microphonicsensitivity were measured following the same procedure outlined above. From eightmid positions the mean value for 100 and 200 Hz was 1-5 (S.D. = 05) and i-8 (S.D.= 0-7), respectively, whereas the corresponding values from eight posterior positionswere 16 (S.D. = 0-4) and 2*7 (S.D. = 09). For the electrode positions which showedmore pronounced vertical than horizontal sensitivity this difference in sensitivitydecreased when the frequency was changed from 200 to 100 Hz. This phenomenon isshown in Text-fig. 8, where the microphonic potentials evoked in response to hori-zontal and vertical vibrations of 100 and 200 Hz are compared. The electrode positionwas the same for all recordings, and the potentials were picked up from the posteriorpart of the sacculus. It is evident that whereas for the same intensity horizontalvibrations evoked potentials which were but slightly less than the response to vertical

Directional sensitivity of microphonic potentials
04 1-5
/W\A/VW
4-6 Background
wwwv\
A / W W W AAA/WW 20 ms
Text-fig. 6. Microphonic potentials recorded from the anterior part of the sacculus duringvertical and horizontal vibrations of 200 Hz. The recordings are directly comparable to thosein Text-fig. 4. Note that the efficiency of horizontal and vertical vibrations in evoking micro-phonic potentials was about the same.
30
26>.a
22
I 18oo.
I 14n.o
10
A*
—•— Vertical Jt—o— Horizontal /
/
1 3 10 30Vibration amplitude (cm. IO~6)
100
Text-fig. 7. Microphonic potentials from the anterior part of sacculus as a function of vibrationamplitude. Recording locus is the same as in Text-fig. 6. Note that the horizontal vibrationamplitude required to evoke microphonic potentials just above the electric background noisewas only i-t times greater than the corresponding vertical vibration amplitude.

890
100 Hz
OLAV SAND
200 Hz
AA/WVWWBackground
4-8
vwwww
I
20 ms
Text-fig. 8. Recordings of microphonic potentials (upper trace of each recording) from theposterior part of the sacculus in response to vertical and horizontal vibrations (lower trace ofeach recording) of 100 and 200 Hz. The vibration amplitudes (cm x io~*) are indicated on thefigure. The recordings are from the same electrode position. Note that the relative effect ofhorizontal and vertical vibrations is frequency dependent.
28
J2 20
oo.
a.o
16
.s 12
100 Hz
10 30 100 3 10Vibration amplitude (cm. 10"')
30 100
Text-fig. 9. Microphonic potentials evoked by vertical and horizontal vibrations of 100 and200 Hz a8 a function of vibration amplitude. Hatched area indicates level of electric backgroundnoise. Electrode position was the same as for Text-fig. 8. Note that vertical vibrations arerelatively more efficient than horizontal vibrations in evoking microphonic potentials at 200than at 100 Hz.

Directional sensitivity of microphonic potentials
•
II
Ant Mid Post Lag
X
s 'A VA
Text-fig, io. Comparison of the mean ratios between the microphonic sensitivity to horizontal(hatched columns) and vertical (open columns) vibrations for the anterior (Ant) mid (Mid)and posterior (Post) parts of the sacculus, and for the lagena (Lag). The ratios are indicated bythe relative heights of the columns within each pair. The figure does not give any informationabout differences in absolute sensitivity between the different parts of the ear.
vibrations, this difference in response grew considerably when the frequency wasincreased by one octave. Text-fig. 9 presents the microphonic potentials as a functionof vibration amplitude for the two frequencies and stimulation modes. It is seen thatfor 100 Hz the ratio between horizontal and vertical vibration amplitudes giving amicrophonic response just above the level of electrical background noise was about1-5, whereas this ratio increased to 29 at 200 Hz.
The mean ratios between the microphonic sensitivity to vertical and horizontalvibrations at 100 and 200 Hz from different parts of the pars inferior are summarizedin Text-fig. 10. The lagena is predominantly sensitive to vertical vibrations, whereasthe anterior part of the sacculus is equally sensitive to vertical and horizontal vibra-tions. The mid and posterior part of the sacculus give intermediate values. A gradientis seen along the sacculus, in that the more posterior positions show a tendencytowards greater relative vertical sensitivity. Furthermore, it is clear that the micro-phonic potentials recorded from both the lagena and the posterior part of the sacculusare relatively more sensitive to vertical vibrations at 200 than at 100 Hz.

892 OLAV SAND
Background
vAAAAA/ \AAAAAText-fig. 11. Microphonic potentials (upper traces) recorded from the anterior part of thesacculus on the right side during horizontal vibrations of 70 Hz (lower traces). The vibrationamplitude was 3-0 x io~* cm. The angle between the long axis of the fish and the vibrationdirection is indicated on each recording. Note that the potentials were a function of thevibration direction.
Directional sensitivity of the microphonic potentials evoked by horizontal vibrations
For horizontal vibrations of constant amplitude the microphonic potentials werea function of the angle between the fish and the vibration direction. Text-fig. 11presents a series of recordings from the anterior part of a sacculus from the right sideduring 70 Hz vibration. It is seen that variation of the vibration angle has a markedeffect on the microphonic potentials. In this particular case maximal potentials wereobtained at vibration angles around 200 and 2000, whereas the potentials reachedminimum values at no° and 2900. The maximal microphonic potentials were about12 dB above the minimum values. Similar recordings from the left sacculus gave acorresponding picture, but the optimal angles were here 3350 and 155°, whereasminimal potentials were evoked at angles of 650 and 245°. Text-fig. 12 presents therecordings from this fish in a polar coordinate diagram, which gives the amplitude ofthe microphonic potentials as a function of the horizontal vibration angle. As expectedfrom Text-fig. 3, maximal microphonic potentials occurred at angles within ratherwide sectors, and a sharp decline of the potentials was seen towards the angles givingminimum microphonic responses. The angle between the axis of optimal microphonicsensitivity for the right and left otoliths was 45 °, which approximates to the anglebetween the two otoliths.
From the point of view of directional hearing it might have been beneficial for thefish if other parts of the macula showed a different axis of optimal horizontal sensi-tivity. However, this seemed not to be the case. Recordings of the type describedabove were made for numerous frequencies at several positions along the sacculus,but the results were roughly the same as shown in Text-fig. 12. Measurements werethen concentrated about three positions, and from the right sacculus four, six andfour series of recordings were made from the anterior, mid and posterior positions,respectively. The mean angles of the axis of optimal microphonic sensitivity for thethree positions were 18-8° (s.D. = 48), 20-0° (s.D. = 8-9) and 17-5 (s.D. = 8-6), andthe differences between these are not significant (F-test, P < o-oi). Four series ofrecordings from each of the anterior, mid and posterior parts of the left sacculus wereobtained, and the corresponding mean optimal angles were 337-5° (s.D. = 8-6), 338-7°(s.D. = 63) and 340° (s.D. = 70). This again gives no significant differences betweenthe three positions (F-test, P < o-oi). To test whether different vibration frequencies

Directional sensitivity of microphonic potentials
90°
893
Text-fig, ia. Polar diagram giving microphonic potentials recorded from the right (•) andleft (O) sacculus as a function of the horizontal vibration angle. Same fish and recordingconditions as in Text-fig. 11. Note that maximal microphonic responses are evoked by vibrationdirections deviating about 200 from the long axis of the fish.
caused differences in the optimal direction of vibration, the angular deviation of thesedirections from the long axis of the fish were arranged in three groups according tothe stimulation frequency. Data from all the recording loci in both ears were pooledtogether, and eight, eleven and seven series of measurements were obtained for thefrequency groups < 70 Hz, 70-110 Hz and > n o Hz. The respective mean devia-tions were 21-2 (s.D. = 7-4), 200 (s.D. = 81) and 18-6 (S.D. = 5-6). Thus, no signifi-cant differences between these groups were detected (.F-test, P < o-oi). If all therecordings from the right sacculus are combined the mean optimal horizontal vibrationangle is 18-9° (s.D. = 7-4), whereas the corresponding mean value for the left sacculusis 338-7° (s.D. = 6-7). The mean angle between the axis of optimal microphonicsensitivity of the left and right sacculus was thus 40-2°. The radiograms presented inPI. 1, fig. 1, show the position of the sacculi in a living perch. The sacculi have acurved shape, and it is therefore impossible to determine a definite angle betweenthem. However, it is evident from the figure that the mean angle between the twoaxes of optimal horizontal microphonic sensitivity of the right and left sacculus isvery close to the average angle between the two otoliths.

894 OLAV SAND
As shown in the previous section, the lagena was predominantly sensitive to verticalvibrations. However, horizontal vibrations also evoked microphonic potentials, andthese showed axes of optimal and minimal microphonic sensitivity in a similar way asshown for the sacculus. Only three complete series of measurements of this type wereobtained from the lagena, and none of these showed an axis of optimal horizontalmicrophonic sensitivity which deviated more from the long axis of the fish than didthe corresponding values from the sacculus.
DISCUSSION
A fish in water is acoustically nearly transparent, and in a sound field it will there-fore vibrate with the same phase and amplitude as the surrounding medium. Vibrationof the fish in air will thus provide good simulation of the effect caused by water-bornesound. However, since the vibration stimuli have no pressure component, the pressure/displacement transforming ability of the swimbladder will not be activated, and bychanging the angle between the fish and the direction of vibration, well denneddirectional stimuli are readily obtained.
Auditory effect of vibrations radiating from the swimbladder
Due to the high compressibility of gas compared to water, the surface of a gas-filled swimbladder will undergo much larger displacements when exposed to soundthan would the water particles in the absence of the bladder. In an unspecialized fishlike the perch, which has no mechanical linkage between the swimbladder and theear, these amplified displacements will reach the ear through the intervening bodytissues. The swimbladder-induced vibrations stimulating the ear will therefore havea radial direction to the bladder. For all the recording loci the sacculus showedmaximal horizontal sensitivity when it was vibrated approximately parallel to its ownlong axis. This axis has an orientation which ensure nearly optimal horizontal stimula-tion of the saccular macula by vibrations radiating from the swimbladder (Text-fig. 12and PI. 1, fig. 1).
In most of their haddocks Enger et al. (1973) found optimal horizontal sensitivityof the saccular microphonic potentials when vibrating the fish parallel to its long axis,while the present study showed optimal sensitivity at vibrations deviating about 200
from the long axis of the fish. However, due to their coarse recording technique,Enger et al. probably picked up potentials from both right and left sacculi simul-taneously, and this may explain the minor difference between their results and thepresent results. On the other hand, Enger et al. also presented data from a fish whichshowed maximal saccular microphonic potentials when it was vibrated horizontallyat right angle to its long axis, which is in direct contrast to the results from perch.The authors were rather cautious in interpreting these data, and suggested that con-fusion might have occurred by recording from haircells which were sensitive tovertical vibrations, which in this particular case were relatively large. In the light ofthe present study this explanation seems reasonable, and it is concluded that thedirectional sensitivity of the sacculus to horizontal vibrations facilitates reception ofthe sound-induced swimbladder pulsations.

Directional sensitivity of microphonic potentials 895
In perch the anterior part of the sacculus was equally sensitive to vertical andhorizontal vibrations, while responses from the posterior part were most easily evokedby vertical vibrations. If the orientation pattern of the saccular hair cells in burbotand goldfish is valid for perch, i.e. the hair cells are vertically oriented, the observedability of horizontal vibrations to evoke saccular microphonic potentials needs anexplanation. The movements of the otoliths are not necessarily linear when the fishis exposed to sound. Torques acting on the stone during the forced vibrations mayarise from the unsymmetrical shape of the otolith in combination with its suspensionand the surrounding liquid. The result will be rotational or rocking movements of theotolith, and a horizontal driving force may thus be translated into vertical otolithmovements.
The present study showed that the lagena, and to a lesser degree the posteriorpart of the sacculus, were mainly sensitive to vertical vibrations, while the vibrationsradiating from the swimbladder will have a nearly horizontal direction at the ear. For200 Hz the lagena was measured to be 5-6 times, or 15 dB, more sensitive to verticalthan to horizontal vibrations. However, since it was impossible to generate purehorizontal vibrations, this ratio may well be underestimated. At 100 Hz the measuredratio was 2-9 or 9 dB. The auditory gain due to the swimbladder effect is probablynot more than 20 dB at 200 Hz, and the effect will decrease towards lower frequencies(Sand & Enger, 1973; Chapman & Sand, 1974). It is thus not unreasonable to supposethat the lagena is about equally affected by the incident and the re-radiated sound ifthe sound direction is vertical to the fish. This is in contrast to the anterior part ofthe sacullar macula, which seems to be mainly stimulated by swimbladder vibrations,whereas the incident sound has relatively little effect.
Mechanical frequency catalysis
According to the hypothesis described above, linear driving forces may be trans-lated into complicated rotational movements of the otoliths during vibration of thefish. For the lagena and the posterior part of the sacculus the ratio between verticaland horizontal sensitivity was noted to be frequency dependent. Since the sensitivityaxes of the hair cells are independent of frequency, this observation is interpreted asindication of a frequency-dependent pattern of otolith movements during soundstimulation. From this it follows that the part of the macula which is maximallystimulated by the otolith may change with frequency, which constitutes a possiblebasis for peripheral frequency analysis in fish. The evidence for this theory is sparseand unsatisfactory, but techniques are today available which may be used to measurethe vibration pattern of otoliths directly (see for instance Michelsen, 1971). It issuggested that future work should employ such techniques to explore the presentnotion of a frequency-dependent pattern of otolith movements.
In fish possessing a swimbladder the otolith system will be exposed to forcedoscillations radiating from the swimbladder. For most audible frequencies theseoscillations will greatly exceed the amplitude of the displacements due to the incidentsound. Changes in the pattern of movements of the otoliths will therefore be due toalterations of frequency, while a change of the direction of the incident sound willhave comparatively little effect. However, for species without a swimbladder the

896 OLAV SAND
direction of the forced otolith vibrations is not fixed, and it is difficult to imagine howthe mechanism for mechanical frequency analysis outlined above may be operating.
Directional hearing
Enger et al. (1973) suggested that different hair cells in the ear may have differentaxes of maximal sensitivity to vibration, and that this would provide a possible neuro-logical explanation for the ability of fish to detect the direction to a sound source.However, they only studied the effect of horizontal vibrations, and their data did notconclusively support their theory. For fish possessing a swimbladder the main problemwould be possible masking of the incident sound by the amplified vibrations re-radiating from the bladder. Since the lagena is mainly sensitive to vertical vibrations,the swimbladder will influence this part of the ear much less than the sacculus.Although the effect of vertical sound on the sacculus is heavily masked by re-radiatedswimbladder pulsations, especially at the anterior end, the incident sound may beefficient in stimulating the lagena directly. By comparing the nervous output from thelagena and the anterior part of the sacculus, the fish should then be able to get direc-tional information about the vertical position of the sound source. Since no evidenceexists to confirm that such a mechanism is operating in practice, the theory presentedabove must be considered tentative. The same must be stressed for the developmentof the theory below, where a possible mechanism for directional sensitivity in thehorizontal plane is suggested.
For fish lacking a swimbladder, and with a similar directional sensitivity of thesaccular microphonic potentials as shown in Text-fig. 12, directional informationabout the horizontal position of the sound source could be obtained by comparingthe nervous output from the two ears. For instance, if the horizontal direction of thesound source is at an angle of 700 to the long axis of the fish, the microphonicpotentials evoked in the right sacculus would exceed those in the left by approximately8 dB. In sharks, which have no swimbladder, orientation to low-frequency soundsover long distances in their natural environment has been demonstrated (Myrberget al. 1972; Nelson & Johnson, 1972). However, the amplified swimbladder dis-placements will affect the two ears equally, and since the bladder is a pressure/dis-placement transformer, the auditory gain it provides will be independent of the direc-tion to the sound source. The microphonic sensitivity to horizontal vibrations wasnearly maximal for radial directions to the swimbladder for all parts of the parsinferior. It is therefore difficult to imagine how the horizontal component of the inci-dent sound may avoid being masked by the vibrations re-radiating from the swim-bladder. However, the swimbladder effect will not cause a total elimination of thedifference in response to horizontal vibrations between the two ears, and it may bethat the fish is able to utilize these minor differences. Furthermore, the auditoryeffect of the swimbladder will decrease towards lower frequencies, and this mayimprove directional hearing. A fish possessing a swimbladder seems nevertheless tobe better suited for detecting the vertical than the horizontal position of a soundsource, which is in direct contrast to the situation in man (von Bekesy, i960). On theother hand, no information is available on the ability of fish to discriminate betweendifferent sound directions in the vertical plane. In any case, the fish will only getdirectional information from the incident sound, and not from the amplified vibrations

Directional sensitivity of rmcrophonic potentials 897
emanating from the swimbladder. As pointed out by Enger et al. (1973), this impliesthat the threshold for detection of the direction of a sound should be higher than forsimply detecting the sound itself.
This hypothesis for directional hearing in fish is oversimplified. For instance, howthe fish may avoid confusion due to directional ambiguity is not discussed at all. Onthe other hand, it is demonstrated that different parts of the maculae in the parsinferior have different axes of optimal sensitivity, and it is concluded that thesedifferences in sensitivity may be utilized in directional hearing. Such a model wouldbe very simple for fish lacking a swimbladder, but even in fish which take auditoryadvantage of a swimbladder this model provides a possible explanation of the abilityof these fish to detect the direction of a sound source.
The behavioural data on directional hearing in fish is too sparse to support themodel presented above. It is therefore suggested that future behaviouristic experi-ments should be conducted to test the following assumptions. For a fish possessinga swimbladder the threshold for simply detecting a sound should be lower than thethreshold for detecting the sound direction. It should also be easier to detect directionat low frequencies, where the effects of the swimbladder are less. Furthermore, thecapacity of a fish to determine the vertical direction of a sound source should be atleast as good as the ability to detect the horizontal direction.
In regard to the directional sensitivity in the horizontal plane, it is possible, onthe basis of the data given in this paper, to make a tentative estimate of the power ofangle separation. If each of the number 8-shaped microphonic response curves pre-sented in Text-fig. 12 is simplified to consist of two touching circles of diameter a,the difference in response between the two ears is easily calculated. The angle betweenthe long axes of the two 8-shaped figures is 2a, and the angle between the long axisof the fish and the direction of vibration is <j>. Within the sectors 270° + a < <f> <(900 —a) and 90° + a < (j> < (2700 —a) the difference in response is given by:
Fx = a cos (<f> — a) — a cos (?̂ + a) = za sin a sin <j>. (1)
Within the sectors 9 0 0 - a < <j> < 90° + a and 2700 — a < <f> < 2700 + a the differenceis given by:
F% = a c o s ( 0 - a ) + a cos(0 + a) = 2a cos a cos 0. (2)
It is reasonable to propose that the power of angle separation is optimal for thesectors where a small change of vibration angle gives maximal change of the differencein response between the ears; or, in other words, for the vibration angles where thenumerical value of the derivative of F is maximal.
-3-^ = 2a sin a cos <}>, (3)
dF2 . , , .-j-2= = —za cos a sm <p. (4)a<p
For perch the value of a was about 200, which gives:AT?—^ x o-68a cos <{>, (5)
§ « - i'98a sin $. (6)a<p

OLAV SAND
It is seen that the derivative of F has maximum values for o°, 1800 and 900, 2700.Furthermore, because the numerical value of dF^dcj) at its maxima is greater than themaximal dFJd<f> value, this should imply that for horizontal sound waves the powerof angle separation in perch is optimal for sound directions side on to the fish.
SUMMARY
1. Microphonic potentials were recorded from the lagena and from different partsof the sacculus in the perch during horizontal and vertical vibration of the fish in air.This stimulation technique gives a good simulation of sound stimulation in water.
2. The lagena was predominantly sensitive to vertical vibrations, whereas theanterior part of the sacculus was equally sensitive to vertical and horizontal vibrations.A gradient is seen along the sacculus, in that the more posterior positions show atendency towards greater relative vertical sensitivity. By comparing the nervousoutput from the lagena and from the sacculus the fish might thus get informationabout the vertical direction of the sound source.
3. The amplitude of the saccular microphonic potentials evoked by horizontalvibrations was a function of the vibration direction. Maximal responses were obtainedwhen this direction deviated about 200 from the long axis of the fish, which is approxi-mately parallel to the long axis of the sacculi. The difference in response between thetwo ears might be utilized to give directional information about the horizontalposition of the sound source.
4. Sound-induced pulsations radiating from the swimbladder will be efficient inevoking saccular microphonic potentials. This causes masking of the difference inresponse between the two ears, but directional information may still be obtained. It isproposed that the power of angle separation in the horizontal plane should be optimalfor sound waves side on to the fish, and that a fish possessing a swimbladder may beable to detect the sound direction with higher accuracy in the vertical than in thehorizontal plane.
5. The relative effect in evoking microphonic potentials of vertical compared tohorizontal vibrations was frequency dependent, and it is concluded that the pattern ofotolith movements during sound stimulation may also change with frequency. Thisphenomenon constitutes a possible basis for peripheral frequency analysis in fish.
I am greatly indebted to Mr C. J. Chapman, Dr P. S. Enger, Dr A. D. Hawkinsand Mr T. B. Mele for critical comments and positive suggestions for improvingthe manuscript. I thank Mr H. O. Torsen for technical advice, and Dr R. Hoi isacknowledged for help in obtaining the radiographs of living perch.
REFERENCES
ANDERSEN, R. A. & ENGER, P. S. (1968). Microphonic potentials from the sacculus of a teleost Fish.Camp. Biochem. Pkytiol. 37, 879-81.
VON BEKESY, G. (i960). Experiments in Hearing. New York: McGraw-Hill.VAN BERGEIJK, W. A. (1964). Directional and nondirectional hearing in fish. In Marine Bio-Acoustics
(ed. W. N. Tavolga), pp. 281-99. Oxford: Pergamon Press.VAN BERGEIJK, W. A. (1967). Discussion of critical bands in hearing of fishes. In Marine Bio-Acoustics,
vol. 2 (ed. W. N. Tavolga), pp. 244-5. Oxford: Pergamon Press.CHAPMAN, C. J. (1973). Field studies of hearing in teleost fish. HdgolSnder vriss. Meeresunters. 24,
37I-9O-


Journal of Experimental Biology, Vol. 60, No. 3 Plate 1
OLAV SAND (Facing p. 899)

Directional sensitivity of microphonic potentials 899CHAPMAN, C. J. & HAWKINS, A. D. (1973). A field study of hearing in the cod. Gadus morhua L.
J. comp. Pkytiol. 85, 147-67.CHAPMAN, C. J. & SAND, O. (1974). Field studies of hearing in two species of flatfish Pleuroneetet
platetsa (L.) and Umanda limanda (L.) (Family Pleuronectidae). Comp. Biochem. Pkyriol. 47 A,37I-85.
DIJKGRAAF, S. (1950). Untersuchungen (iber die Funktionen des Ohrlabyrinths bei Meeresfischen.Pkytiol. Comp. Oecol. a, 81-106.
DIJKORAAF, S. (1952). Bau und Funktionen der Seitenorgane und des Ohrlaburinths bei Fischen.Experientia 8, 205-16.
ENGER, P. S. (1963). Unit activity in the fish auditory system. Acta pkytiol. scand. 59, suppl. 1-48.ENGER, P. S., HAWKINS, A. D., SAND, O. & CHAPMAN, C. J. (1973). Directional sensitivity of saccular
microphonic potentials in the haddock. J. exp. Biol. 59, 425-34.FLOCK, A. & WERSAIX, J. (1962). A study of the orientation of the sensory hairs of the receptor cells
in the lateral line organ of fish, with special reference to the function of the receptors. J. Cell Biol.15. 19-27-
VON FRISCH, K. & DIJKGRAAF, S. (1935). KOnnen Fische die Schallrichtung wahmehmen? Z. vergl.Pkytiol. aa, 641-55.
FURUKAWA, T. & ISHII, Y. (1967). Neurophysiological studies on hearing in goldfish. J. Neuropkysiol.30, 1377-403-
HAMA, K. (1969). A study on the fine structure of the saccular macula of the gold fish. Z. Zellfortch.mikrotk. Anat. 94, 155-71.
LOWENSTEIN, O. & ROBERTS, T. D. M. (1951). The localization and analysis of the responses to vibra-tion from the isolated elasmobranch labyrinth. A contribution to the problem of the evolution ofhearing in vertebrates. J. Pkytiol., Land. 114, 471-89.
MICHELSEN, A. (1971). The physiology of the locust ear. II. Frequency discrimination based uponresonances in the tympanum. Z. vergl. Pkytiol. 71, 63-101.
MYRBERG, JR., A. A., HA, S. J., WALEWSKI, S. & BANBURY, J. C. (1972). Effectiveness of acousticsignals in attracting epipelagic sharks to an underwater sound source. Bull. mar. Set. Gulf Caribb. aa,926-49.
NELSON, D. R. & JOHNSON, R. H. (1972). Acoustic attraction of Pacific reef sharks: Effect of pulseintermittency and variability. Comp. Biochem. Pkytiol. (A) 4a, 85-95.
OL8EN, K. (1969a). Directional hearing in cod (Gadut morkua L.). 8th I. F. Meeting, Lowestoft. 12 pp.0L8BN, K. (19696). Directional responses in herring to sound and noise stimuli. Int. Coun. Explor. Sea.,
1969/B20, 8 pp.PAHVULESCU, A. (1964). Problems of propagation and processing. In Marine Bio-Acouttia (ed. W. N.
Tavolga), pp. 87-100. Oxford: Pergamon Press.PARVULESCU, A. (1967). Acoustics of small tanks. In Marine Bio-Acouttict (ed. W. N. Tavolga), vol. 2,
pp. 7-13. Oxford: Pergamon Press.REINHARDT, F. (1935). Uber Richtungswahrnehmung bei Fischen, besonders bei der Elritze (Phoxinut
laevit L.) und beim Zwergwels (Amhirut nebulotut Raf.). Z. vergl. Pkytiol. aa, 570-603.SAND, O. & ENGER, P. S. (1973). Evidence for an auditory function of the swimbladder in the cod.
J. exp. Biol. 59, 405-14.SCHUIJF, A., BARETTA, J. W. & WiLDSCHUT, J. T. (1972). A field investigation on the discrimination of
sound direction in Labrut bergylta (Pisces: Perciformes). Neth. J. Zool. aa, 81-104.TAVOLGA, W. N. (1971). Sound production and detection. In Fith Pkytiology, vol. v (ed. W. S. Hoar
and D. J. Randall), pp. 135-205. New York: Academic Press.WERSALL, J., FLOCK, A. & LUNDQUIST, P. G. (1965). Structural basis for directional sensitivity in
cochlear and vestibular sensory receptors. Cold Spring Harb. Symp. quant. Biol. 30, 115-32.WOLFF, D. L. (1967). Das HorvermSgen des Flussbarsches (Perca fluviatilit L.). Biol. Zbl. 86, 449—60.
EXPLANATION OF PLATE
Fig. 1. Radiographs of a 20 cm perch, dorsal (A) and lateral (B) view. Note the position of the sacculi(ia) and the swim-bladder (tb). The angle between the broken rules is 40°, which is close to the anglebetween the sacculi.