Embed Size (px)
Citation preview
[ 434 ]
PROTOPLASMIC STRUCTURE AND MITOSIS
II. THE NATURE AND CAUSE OF BIREFRINGENCE CHANGES INTHE SEA-URCHIN EGG AT ANAPHASE
BY M. M. SWANN
From the Department of Zoology, University of Cambridge,and the Marine Station, MiUport
(Received 15 March 1951)
(With Plates 9 and 10 and Twelve Text-figures)
INTRODUCTION
It is well known from the work of Schmidt (1937, 1939) that the birefringence ofthe mitotic figure of the sea-urchin egg decreases during anaphase. The same effectwas also noticed in chick tissue culture cells by Hughes & Swann (1948). Byanalogy with the contraction of muscle fibres and protozoan myonemes, Schmidtinterpreted this decrease as evidence for the contraction of spindle fibres. Whetheror not his interpretation is correct, however, it is clear that extensive changes inprotoplasmic structure do take place during anaphase. The present paper describesone aspect of these changes.
In the first paper of this series (Swann, 1951a), the technique of quantitativebirefringence analysis for spindles and asters was described. The retardation asmeasured at any point in the mitotic figure is the sum of the retardations of all theelements of the spindle or aster traversed by the illuminating beam at that point.To interpret structure, however, it is preferable to know the coefficient of birefrin-gence within the spindle or aster, rather than the total retardation. In the case ofthe aster, because of its radial symmetry, a curve for coefficient of birefringence canbe calculated exactly from the retardation data. In the case of the spindle, however,a curve for coefficient of birefringence can only be calculated by assuming a definiteshape; but as the spindle is neither clearly defined, nor constant in length, it isusually more satisfactory to compare curves of retardation. The two types of curve,in any case, are rather similar. With the asters, of course, there is no difficultyabout comparing curves for coefficient of birefringence.
In comparing the curves for different stages in anaphase, both increases anddecreases of birefringence are apparent. The molecular interpretation of these changesis ah interesting problem, but not, as will become evident, immediately relevantto the question of what is causing the changes. It can, in fact, only be considered inrelation to the form and intrinsic birefringence of the mitotic figures, and this raisesfurther difficulties, since fixatives and imbibition agents all affect the labile proto-plasmic structures of the egg. A detailed examination of these questions is left toa later paper.
Protoplasmic structure and mitosis 435
SPINDLE CHANGES DURING ANAPHASE
The photographs in PI. 9, figs. 1-4, are taken from a time lapse film (series A) of anegg of PsammecMnus miliaris. They show the egg in metaphase, and at three succes-sive stages in anaphase. It is evident that the birefringence of the whole mitoticfigure decreases steadily, while the asters grow and the spindle lengthens. Becauseof this lengthening, complete spindle retardation curves cannot be superimposed,and the polar and equatorial regions have to be compared separately. This is donein Text-figs. 1 and 2, the curves of which are derived from the photographs inPI. 9, figs. 1-4.
The first retardation curve, 56 min. after fertilization, shows the spindle inmetaphase. It should be compared with the 58 min. curve. At the poles, both curvesfit precisely, and there has evidently been no change in structure there during theinterval of 2 min. At the equator, however, there has been a considerable decreasein retardation, and therefore in coefficient of birefringence. The next curve, at60 min., shows a further decrease at the equator, and a slight decrease near the polesbut a greater decrease midway between the two. The fourth curve, at 62 min.(shortly before cleavage), shows little change at the equator, but a further decreasein the polar and subpolar regions.
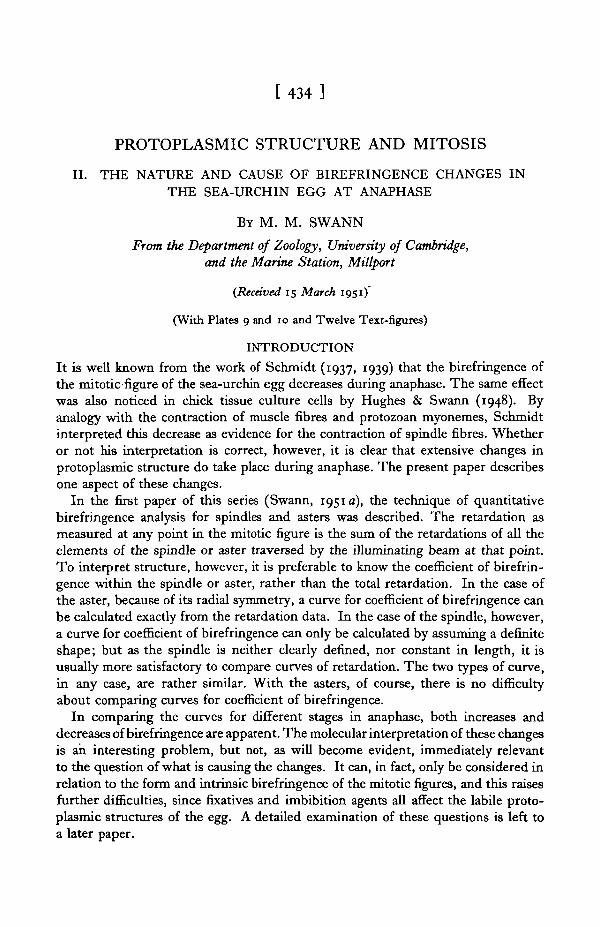
These changes are characteristic. They can be followed in more detail in series B,where the time intervals are shorter. Photographs from this series are shown inPI. 9, figs. 5-10, and the corresponding retardation curves are given in Text-figs. 3and 4. Four photographs of an egg in the two-cell stage during anaphase, showingsimilar changes, are given in PI. 9, figs. 11-14.
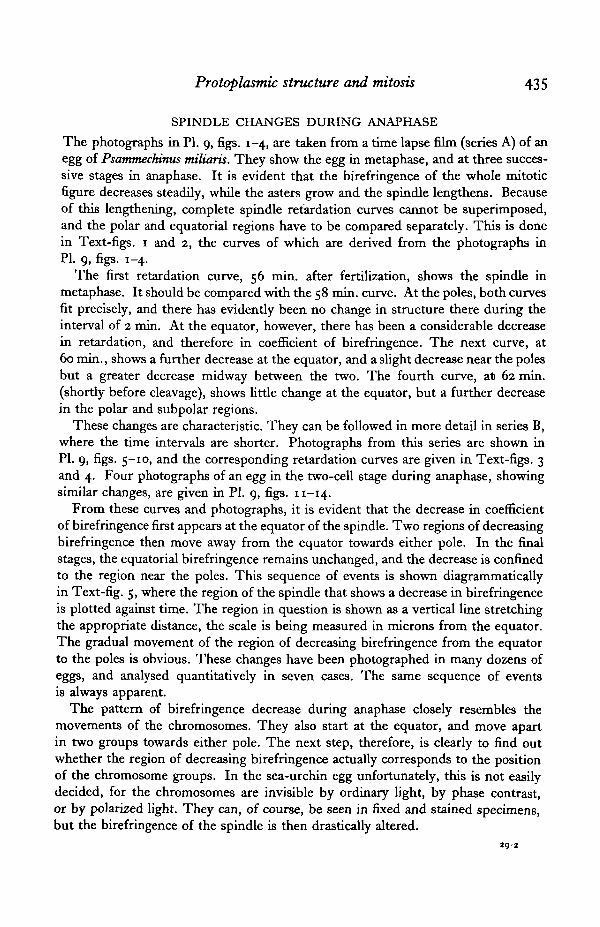
From these curves and photographs, it is evident that the decrease in coefficientof birefringence first appears at the equator of the spindle. Two regions of decreasingbirefringence then move away from the equator towards either pole. In the finalstages, the equatorial birefringence remains unchanged, and the decrease is confinedto the region near the poles. This sequence of events is shown diagrammaticallyin Text-fig. 5, where the region of the spindle that shows a decrease in birefringenceis plotted against time. The region in question is shown as a vertical line stretchingthe appropriate distance, the scale is being measured in microns from the equator.The gradual movement of the region of decreasing birefringence from the equatorto the poles is obvious. These changes have been photographed in many dozens ofeggs, and analysed quantitatively in seven cases. The same sequence of eventsis always apparent.
The pattern of birefringence decrease during anaphase closely resembles themovements of the chromosomes. They also start at the equator, and move apartin two groups towards either pole. The next step, therefore, is clearly to find outwhether the region of decreasing birefringence actually corresponds to the positionof the chromosome groups. In the sea-urchin egg unfortunately, this is not easilydecided, for the chromosomes are invisible by ordinary light, by phase contrast,or by polarized light. They can, of course, be seen in fixed and stained specimens,but the birefringence of the spindle is then drastically altered.
29-2

436 M. M. SWANN
The problem was finally solved by putting single living eggs in a drop of sea wateron a slide, and following their development under the polarizing microscope withthe time-lapse camera. When the eggs reached particular stages they were fixed,dehydrated, and embedded in a drop of celloidin. The drops of celloidin werehardened, embedded in wax, and then sectioned and stained in the ordinary way.The position of the chromosomes in the spindle was then determined, and correlatedwith the appearance of the egg in polarized light just before fixation, and with theregion of birefringence decrease as measured from the time-lapse film.
About thirty single eggs were treated in this way, and the results leave no doubtthat the region of birefringence decrease does correspond to the position of thechromosome groups. A few of the results of this investigation are shown in PI. 10,where a diagrammatic representation of the position of the chromosomes in thespindle, determined from sections, is shown beneath the photographs of the eggjust before fixation. The approximate positions of the chromosomes, estimated fromthese data, have been inserted in the spindle retardation curves of Text-figs, i and 3.
The fact that the region of birefringence decrease is extensive, while the chromo-some groups are compact, suggests that the decrease is not due directly to thechromosomes, as it might be if they were large and possessed a sign of birefringenceopposite to the spindle material. Sea-urchin chromosomes in fact, appear to becompletely isotropic. The conclusion is inevitable that the decrease in birefringenceis due to structural changes in the spindle material. The fact that the decreaseoccurs only in the regions round the chromosomes, suggests that the structuralchanges are actually initiated by them.
ASTER CHANGES DURING ANAPHASE
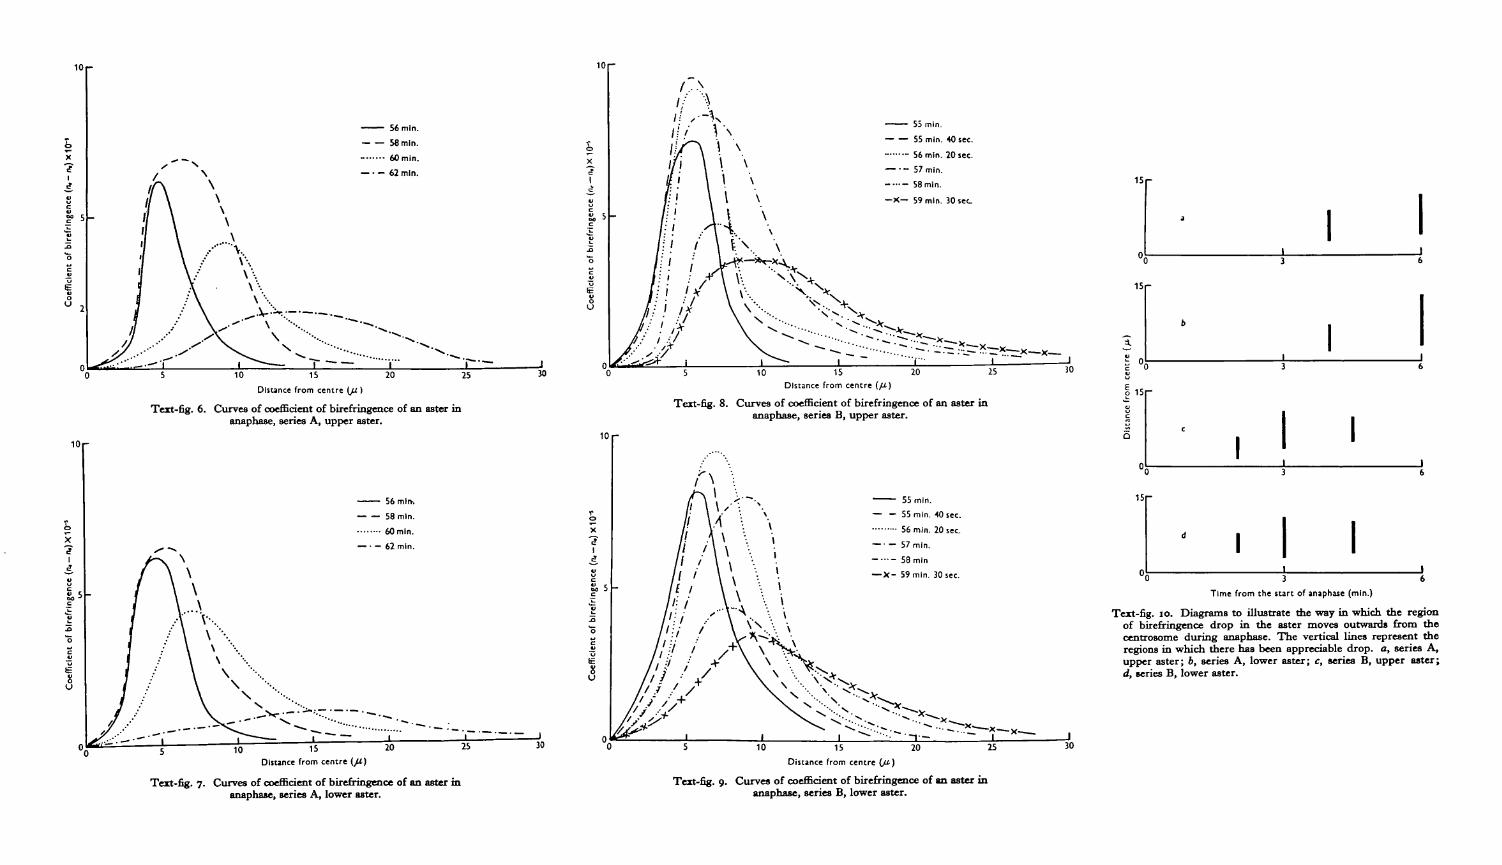
Curves for coefficient of birefringence in the asters of series A are given in Text-figs.6 and 7. The form of the curves at metaphase (56 min.) has already been discussed(Swann, 1951 a). At this stage the asters only extend out to about 15 fx. By 58 min.,however, there has been a marked increase in coefficient of birefringence in all butthe most central regions of the asters, as well as an increase in radius of about 3 fx.By contrast, the spindle at the same stage shows only a slight drop in the region ofthe equator (Text-fig. 1). By 60 min., however, the familiar decrease in birefrin-gence has begun, the main region of decrease being between 3 and dp. Further outhowever, beyond about 9 /x, there has been a slight increase in birefringence, and theasters have grown to about 21 p. By 62 min. there has been a further decrease inbirefringence, this time between 6 and 12 /x, and a further slight increase beyond15/4. The asters have grown to nearly 30/x in radius.
The anaphase changes in the spindle appear to consist mainly of a shifting patternof birefringence decrease. In the asters, on the other hand, there are clearly twoseparate processes at work. The first of these, which starts at the very beginning ofanaphase, is a gradual increase in the coefficient of birefringence of all but the inner-most regions of the asters. This leads to a steady growth in actual size. The secondprocess, which does not become apparent until at least 2 min. after the start ofanaphase, is a decrease in the coefficient of birefringence. Unlike the increase just
- 56 rnln. -- 58 rnin ..... 60 rnln.
D~stance from sp~ndle equator & )
Text-&. I. Curvea of retardation of a spindle in anaphase, series A. The amea hnve been superimposed at the equator. The approximate position of the chmmmomcs, estimated from hation data, in shown just above the baeolinc.
D~sunce from poles of splndle (,u )
Tat-fig. a. Curves of rctardntion of a spindle in anaphaae (aeries A). The awes have turn broken at thc equator and rmpuimposcd at either pole.
- 55 mln. - - 55 mln 40sec. -..- 56 rnln. 20 sec. --. 57 mln - 58 min.
Distance from spindle equator (p)
Text-fig. 3. Cur~es of retardation of a spindle in anaphaee, aeriea B. The curvca have been superimpscd at the equator. The approximate poaition of the chromcmmes, estimated from hation data, ie ahown just above the base-linc.
-- 56 min. 20 sac --. 57 min. -- 58 min. -x- 59 min. 30 sec
Distance from poles of spindle )
Text-&+ 4 C w e s of retardation of a spindle in annphaee, series B. The cllrpes have been broken at the equrdor and supcrimpad at either pole.
'0 3 6 Time from the start of anaphase (minutes)
Tat-fig. 5. Dingrams to illustrate the way in which the region of binfringencs drop movea from the equator to the poles of the spindle during amphase. The vertical linm represent the regiona in which there has been appreciable drop, averaged from both halves of the spindle. a, series A; b, series B; c and d, taken from two all stages, thc auva of which are not reproduced

- 56 mln.
-- 58 mln.
....... 60 mln.
-. - 62 mln.
Dlsunce from centre (y )
Text-fig. 6. C w e a of &cicnt of birefringence of an a&ar in anaphase, seriea A, upper aster.
- 56 mlrh
- - 58 mln.
........ 60 mln. -.- 62 mln.
6 .- X C
-.-.-. .-.-.-._._ 25 30
Dlsunce from centre w ) Tea-%. 7. C w e a of c~&cient of birrfringena of an astcr in
anaphase, aeries A, lower aster.
- 55 mln. -- 55 mln. 40 rec. - ...... 56 mln. 20 sec. -.- 57 mln. - ...- 58 mln.
-X- 59 mln. 30 sec
Dlrtance from centre ( j l )
Text-fig. 8. Curvea of &cient of birefringena of an aeter in amphase, aerier, B, upper aster.
- 55 mln.
- - 55 mln. 40 sec. ......... 56 mln. 20 sec -. - 57 mln. - ... - 58 mln
- X - 59 mln. 30 sec.
Distance from centre (p)
Tat-fig. 9. Curvcs of d a e n t of birefringence of an aster in maphase, seriea B, lower aster.
Time from the start of anaphase (mln.)
Text-fig. 10. Diagrams to ill-te the way in which the region of birefringence drop in the aster movea ou- from the antrosome during anaphase. The vertical lines repreeent the regione in which there has ken appreciable drop. a, seriea A, upper aster; b, Beriea A, lower aster; c, series B, upper aster; d, series B, lower aster.

Protoplasmic structure and mitosis 437
discussed, this decrease does not affect the whole aster at the same time. It startsfrom the centre and moves outwards. If affects not merely the more birefringentregions of the original metaphase asters, but also the birefringence built up in thefirst few minutes of anaphase. It does not appear to affect the rather weak birefrin-gence built up in the outer regions of the aster during anaphase, though there may ofcourse be a decrease in these regions that is masked by a more rapid increase.
The final state of affairs is an aster of about double the radius and one-third thecoefficient of birefringence of metaphase. The strength of birefringence is actuallyrather variable, and tends to be higher in two-cell than in one-cell stages. The finalcurve differs in various respects from the metaphase curve; its maximum is moreflat-topped, and occurs rather further out from the centre.
These changes can be followed in more detail in Text-figs. 8 and 9, taken fromseries B. The shift of the regions of birefringence decrease with time, is showndiagrammatically in Text-fig. 10, which should be compared with the correspondingdiagrams for the spindle (Text-fig. 5).
The most striking fact about the decrease of birefringence in the asters is that itdoes not begin until some 2 min. after decrease has begun in the spindle. Byexamining the various text-figures, however, it can be seen that this interval corres-ponds in fact to the time between the beginnings of birefringence decrease at theequator and at the poles of the spindle. The decrease of birefringence in the asterswould seem therefore to be simply a part of the same process that is going on in thespindle.
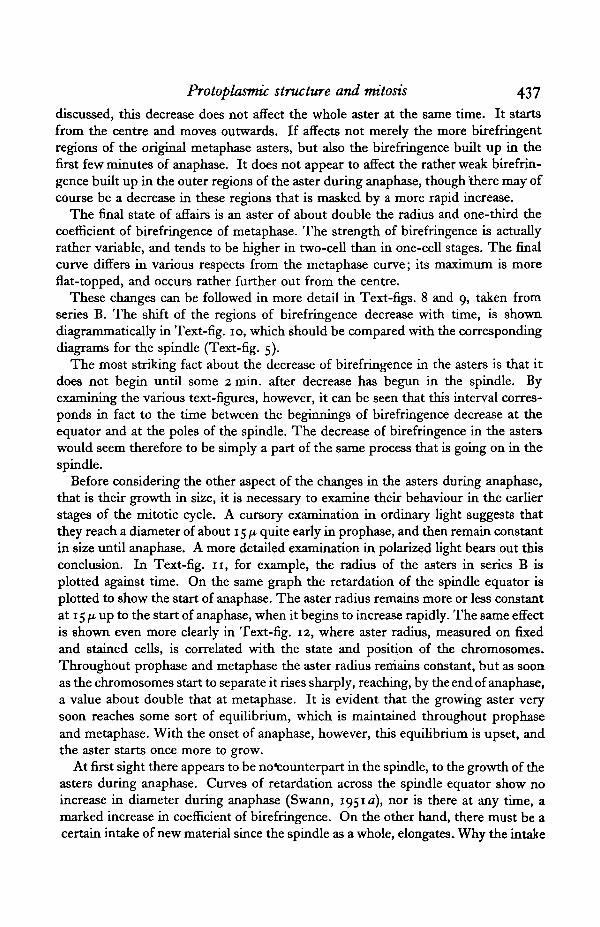
Before considering the other aspect of the changes in the asters during anaphase,that is their growth in size, it is necessary to examine their behaviour in the earlierstages of the mitotic cycle. A cursory examination in ordinary light suggests thatthey reach a diameter of about 15 /x quite early in prophase, and then remain constantin size until anaphase. A more detailed examination in polarized light bears out thisconclusion. In Text-fig. 11, for example, the radius of the asters in series B isplotted against time. On the same graph the retardation of the spindle equator isplotted to show the start of anaphase. The aster radius remains more or less constantat 15 /x up to the start of anaphase, when it begins to increase rapidly. The same effectis shown even more clearly in Text-fig. 12, where aster radius, measured on fixedand stained cells, is correlated with the state and position of the chromosomes.Throughout prophase and metaphase the aster radius reniains constant, but as soonas the chromosomes start to separate it rises sharply, reaching, by the end of anaphase,a value about double that at metaphase. It is evident that the growing aster verysoon reaches some sort of equilibrium, which is maintained throughout prophaseand metaphase. With the onset of anaphase, however, this equilibrium is upset, andthe aster starts once more to grow.
At first sight there appears to be no^counterpart in the spindle, to the growth of theasters during anaphase. Curves of retardation across the spindle equator show noincrease in diameter during anaphase (Swann, 1951a), nor is there at any time, amarked increase in coefficient of birefringence. On the other hand, there must be acertain intake of new material since the spindle as a whole, elongates. Why the intake
438 M. M. SWANN
of extra material should lead to elongation has been discussed elsewhere (Swann,1951 b), and need not concern us here. It is interesting, however, to find thatelongation, like aster growth, starts at the beginning of anaphase. In Text-fig, n ,the length of the spindle in series B is plotted against time. Although there is a slowelongation during prophase and metaphase, it is evident that the rate of elongationrises markedly at the beginning of anaphase. The same effect is seen more strikinglyin the cells of the chick, where spindles may remain static for many minutes, butelongate suddenly as the chromosomes start to move apart (Hughes & Swann, 1948).Similar effects have been noticed by Ris (1943, 1949) and Bonnevie (1947). Evidentlythe spindle, like the asters, is in a condition of equilibrium during metaphase, but
4 0 r
30r
20-
10-
50 55 60Time in minutes from fertilization
Fig. I I .
-
Prophase
• * • • • • » •
Metaphase
t
*
Anaphase
i i i
V
Telophase
0 5 10 15Chromosome separation (/x)
Fig. 12.
Text-fig. 11. The variation of aster radius (average for both asters), spindle length, and retardationof the spindle equator with time, from the data of series B. The sharp drop in retardation of thespindle equator at about 55 min. marks the beginning of anaphase. Retardation of spindleequator (A), short dashes; spindle length (/*), long dashes; aster radius (ji), continuous line.
Text-fig. 12. The relation between aster radius and the state and position of the chromosomes, takenfrom fixed and stained specimens. The spacing of the points in prophase, metaphase and telo-phase is arbitrary; in anaphase, aster radius is plotted against chromosome separation.
with the start of anaphase becomes capable of absorbing fresh material. Whereas,however, the aster simply increases in coefficient of birefringence, and grows indiameter, the spindle, because of its particular shape and structure, grows in length.
In short, while metaphase is a static period, there are two quite distinct types ofstructural change that affect the mitotic figure in anaphase. The first of these is adecrease of birefringence, which starts round the chromosomes as they leave themetaphase plate, moves with them to either spindle pole, and then spreads slowlyoutwards in the asters. The second change is a gradual growth that affects the wholemitotic figure at the same time, appearing in the spindle as an increase in length, andin the asters as an increase in size.
Protoplasmic structure and mitosis 439
THE SIGNIFICANCE OF THE BIREFRINGENCE CHANGESThe metaphase spindle and asters both show a fall in coefficient of birefringence withdistance from the centrosome. The significance of this was discussed in a preliminaryway in the first paper of the present series (Swann, 1951 a). It was argued that sincethere are no marked variations of density within the asters and spindle, the fall incoefficient of birefringence must be due either to changes in the proportion oforiented material, or to changes in molecular and micellar arrangement. The fall incoefficient of birefringence with distance, however, is very approximately an inversesquare. It may possibly be explained therefore by a structure of discrete fibrilsradiating from the centrosome, which, for geometrical reasons, would give an inversesquare fall in proportion of oriented material. It is also possible, however, that theaster and spindle are homogeneous structures, in which case the fall in coefficientof birefringence must be accounted for solely in terms of changes in moleculararrangement. Further discussion of these two structures is not possible without aconsideration of form and intrinsic birefringence, which raises a number of difficultproblems. The whole question was therefore left to a later paper.
In view of this uncertainty about the significance of the variation of coefficient ofbirefringence with distance, it is clearly useless to attempt a detailed interpretationof the changes in coefficient of birefringence with time. A preliminary discussion,however, is not perhaps without value.
The fact that, throughout anaphase, the asters are growing in diameter, must meanthat fresh material is being oriented. The proportion of oriented material, in otherwords, is increasing at 15 fx from the centre and beyond, from nil to some finite value.The coefficient of birefringence, however, is also increasing within the limits of theoriginal metaphase aster. This may be due to changing molecular and micellararrangements, but it is tempting to suppose that it also is due to an increase in theproportion of oriented material. This is borne out by the fact that the general shapeof the curve for coefficient of birefringence does not appear to be altered at 1 or 2 min.after the start of anaphase; it is simply shifted outwards. It is perhaps significantalso that the maximum value of the metaphase curve is not markedly exceededduring anaphase; a rather larger region of the aster merely attains the maximumvalue, suggesting perhaps that over this region all the available material is oriented.
The decrease in coefficient of birefringence, like the increase, might be due eitherto changes in the proportion of oriented material or to changes in molecular andmicellar arrangement. The inner regions of the aster, however, suffer as much as atenfold decrease in coefficient of birefringence, and the spindle even more. Yet theasters and spindle still retain their fibrillar appearance. It seems likely, therefore,that the decrease in coefficient of birefringence is due to molecular and micellarchanges rather than an extensive decrease in the proportion of oriented material.This is essentially the conclusion of Schmidt (1937,1939), who supposed the decreaseto be due to a contraction of the fibres. Contraction necessarily involves molecularand micellar rearrangements, in which the various participating elements move froma predominantly longitudinal to a more random or even predominantly transversearrangement. Such a change is bound to lead to a reduction in positive birefringence.
440 M. M. SWANN
THE CAUSE OF THE BIREFRINGENCE CHANGES
In an earlier section, the close correlation between the position of the chromosomesand the regions of decreasing birefringence was pointed out. It was shown that thedecrease could not be due directly to the chromosomes, which are small, andapparently isotropic. The region of decrease, on the other hand, is large, and spreadsout on either side of the chromosome groups; moreover, when the chromosomesreach the neighbourhood of the centrosome, the birefringence decrease spreads outinto the asters. It seems possible, therefore that the change is brought about indirectlyby the chromosomes themselves.
Very little is known of how such structural changes as have been described in thepresent paper might be brought about. There would seem to be essentially twopossible mechanisms. The changes might be the result of a self-propagating process,either physical or chemical, initiated by the chromosomes; or they might be causedby the release and diffusion from the chromosomes of substances, acting directly orindirectly on the protoplasm. In spite of the small amount of evidence available, itis possible to decide between these two alternatives with some certainty.
A self-propagating mechanism, no matter of what type, continues after it isinitiated, without regard to the original stimulus. Once started, for instance, anerve-action potential is unaffected by whether the original stimulus is repeated orremoved. The pattern of movement of a propagated change is therefore unaffectedby any subsequent movement of the stimulating mechanism. This, however, isconspicuously not the case with the pattern of birefringence decrease in the spindle.The region of decrease moves with the chromosome groups, whereas, if themechanism were a self-propagating one, it should spread outwards, if not concen-trically, at least without regard to the movements of the chromosomes.
We are led therefore to the idea that the decrease in birefringence is brought aboutby the release of a substance which, it may be supposed, diffuses away from thechromosomes, and produces its effect as it goes. A difficulty about such an explana-tion, however, is that the observed rates of movement are so slow. The spread of thedecrease in birefringence is not easily measured in the spindle, because of the com-plicated pattern of change, though it is clearly of the order of only a few microns perminute. In the asters the rate can be measured more exactly, and seems to be notmore than 5 or 6/x per minute. As an example of the expected rate of diffusion in asea-urchin egg, we can take the calculations of Rothschild (1949), although he wasconcerned with a slightly different problem, namely the time course of diffusion froma point on the periphery of the egg. From his curves it can be seen that a point inthe centre of the egg 50^. from the periphery, would reach 80% of the final concen-tration in 5 sec, for a diffusion constant of about 0-07 cm.2/day corresponding to amolecular weight of about 30,000.
This discrepancy might be overcome if the diffusing substance were of virus-likedimensions, though this seems improbable. A more likely explanation is that theoriented structure of the spindle and aster is retarding diffusion. Rothschild'scalculations were based on the assumption that the viscosity of cytoplasm is only alittle above that of water, and for the unfertilized sea-urchin egg this is known to be
Protoplasmic structure and mitosis 441
the case. In the spindle and asters, on the other hand, there is an oriented structure,and it has long been realized that the resistance of such structures to the passage ofmolecules rises very sharply as the molecule approaches the pore size of the gel. Ifthe diffusing substance in question consisted of relatively large molecules, diffusionmight well be enormously slowed down. Yet another possibility is that ordinarydiffusion is not operative, but that there is diffusion with a trap action. In such asystem, the molecules of diffusing substance are caught and bound by the proto-plasmic structure, so that the diffusion front does not advance until all the traps inits way are filled. Under these conditions, the apparent rate of diffusion is governedby the rate of release of the diffusing substance.
The increase in coefficient of birefringence during anaphase is a rather differentcase from the decrease discussed in the previous paragraphs, since it takes placesimultaneously throughout the mitotic figure, leading to spindle elongation and astergrowth. It would seem, therefore, that although the change in question is notcompleted at once, the whole cytoplasm is affected in some way in a short space oftime after the start of anaphase. This is borne out to some extent by birefringenceand light scattering changes in the cortex which also appear immediately after thestart of anaphase. These changes are described by Mitchison & Swann (1952).
As there is no sign of a gradually moving pattern of change in this case, it is notpossible to decide between a self-propagating mechanism and diffusion. Since, how-ever, we have already postulated a diffusion mechanism of some sort for the decreasein birefringence, it is perhaps simplest to think in terms of the release of a secondsubstance, controlling the growth of the spindle and asters, and possibly also thestructure of the cortex. Since this change spreads throughout the cell much morerapidly than the decrease in birefringence, the substance in question cannot possessa very large molecule, nor can it be subject to a trapped diffusion mechanism.
CONCLUSIONS
From the evidence of the present paper, a hypothesis can be constructed to accountfor a small part of mitosis. The essential facts are that a pattern of changes in bire-fringence can be observed in the mitotic figure during anaphase. One type of change,which can be related to the position of the chromosomes, takes the form of a pro-gressive decrease in coefficient of birefringence, probably due to molecular andmicellar re-arrangements. The second type of change, which cannot be related tothe position of the chromosomes, takes the form of an increase in coefficient ofbirefringence, probably due to the orientation of fresh material. The hypothesissuggests that these changes are brought about by the release of two different sub-stances from the chromosomes during anaphase. The interpretation of the bire-fringence changes, though an interesting problem, is not relevant to the hypothesis.
It is not proposed to examine this hypothesis in detail, since observations to bedescribed in later papers have also to be taken into account. There are, however, afew points of some interest that are relevant to the idea. The first of these is thebearing of the hypothesis on theories of anaphase movement. Since chromosomes
442 M. M. SWANN
normally all start to move at the same time, it has usually been supposed that theyfare controlled by some unspecified external agency. A few cases are known, however,where some chromosomes move apparently autonomously (Schrader, 1944). Thepresent hypothesis can perhaps explain such cases, since it supposes the chromosomesto be responsible for their own movement, by controlling the structural changes in thespindle. It should be added that the birefringence evidence suggests, as Schmidt (1937,1939) has already concluded, that the mechanism of movement is a contractile one.
A further interesting point is the parallel between this hypothesis, and thesuggestion put forward by Rothschild & Swann (1949) and Rothschild (1949) toaccount for the structural changes in the sea-urchin egg at fertilization. Theyobserved and measured a cortical change spreading round the egg from the point ofsperm entry, taking some 20 sec, and concluded that it could best be explained bysupposing the sperm head to release some active substance which diffused throughthe egg. The parallel between the release of substances from the sperm nucleus andthe chromosomes is obvious.
The hypothesis may also be relevant to the problem of cell division. Since thedecrease of birefringence spreads outwards at about 5 or 6/x per minute, it shouldtake about 10 min. to reach the cell surface. This is in fact about the time after thebeginning of anaphase at which cleavage begins. Moreover, since the chromosomesend up at either pole of the spindle, the change would be expected to reach thepoles of the cell first; and there is clear evidence, both from birefringence and darkground observations, that this is the case (Mitchison & Swann, 1952). Theseideas are expanded into a hypothesis of cell division by Swann (1952) and Mitchison
If the chromosomes do in fact release active substances, it is clearly of the greatestimportance to discover what they are. Since the ratio of total chromosome volumeto total cell volume in the sea-urchin egg is only about 1: 10*, and as only a part ofthe chromosomes could presumably consist of the substances in question, it ishardly to be expected that ordinary cytochemical methods would be sensitiveenough to detect substances being released. A number of such tests have in factbeen tried, but without success. The inference is that these hypothetical substancesmust be catalytic in nature, and the term ' Structural agents' has been suggested forthem (Swann, 1951c).
SUMMARY
1. The mitotic figure of the sea-urchin egg is most strongly birefringent atmetaphase. During anaphase this birefringence decreases considerably, but thespindle and asters both grow in size. These changes have been investigated quanti-tatively by constructing curves of retardation and coefficient of birefringence acrossthe mitotic figure, using techniques described in an earlier paper.
2. The decrease of birefringence in the spindle starts at the equator, and thenmoves, in the course of a few minutes, to either pole. Only when the decrease hasreached the spindle poles does it begin in the asters, where it moves outwards fromthe centres.
Protoplasmic structure and mitosis 443
3. These changes resemble the movements of the chromosomes, which also startat the equator in metaphase, and move in separate groups to the poles duringanaphase. By examining single eggs in anaphase up to the moment of fixation, andthen staining them to show the chromosomes, it is established that the regions of,decreasing birefringence actually correspond to the position of the chromosomes.
4. Since the chromosomes are too small to be the direct cause of the decrease inbirefringence, it is concluded that they are producing the decrease indirectly byinitiating a structural change in the spindle and asters.
5. The possible mechanisms for this change are discussed. It is concluded thatthe chromosomes must be releasing an active substance, for which the term'structural agent' is suggested.
6. The growth of the mitotic figure takes the form, in the spindle, of an increasein length, and in the asters, of an increase in size. It is accompanied by an increasein coefficient of birefringence, though this is to some extent masked by the decreasein birefringence referred to earlier.
7. The increase in coefficient of birefringence affects the whole mitotic figurefrom the very beginning of anaphase, and is not therefore relatable to the positionof the chromosomes. For this reason it might be due to a number of differentmechanisms, but as it starts at the same moment as the decrease in birefringence, itis tentatively assumed to be due to the release of a second 'structural agent'.
8. The increase in coefficient of birefringence is probably due to the orientationof new material. The decrease is more likely to be due to changes in molecular andmicellar arrangement; it would be consistent with a contractile mechanism inthe spindle.
9. The implications of these findings are discussed in a concluding section.
REFERENCESBONNEVIE, K. (1947). On the mechanics of mitosis. J. Morph. 8i, 399.HUGHES, A. F. & SWANN, M. M. (1948). Anaphase movements in the living cell. A study with
phase contrast and polarized light on chick tissue cultures. J. Exp. Biol. 35, 45.MITCHISON, J. M. (1952). Cell membranes and cell-division. Symp. Soc. Exp. Biol. 6 (in the Press).MITCHISON, J. M. & SWANN, M. M. (1952). In preparation.Ris, H. (1943). A quantitative study of anaphase movement in the aphid Tamalia. Biol. Bull.
Woods Hole, 85, 164.Ris, H. (1949). The anaphase movement of chromosomes in the spermatocytes of the grasshopper.
Biol. Bull. Woods Hole, 96, 90.ROTHSCHILD, LORD (1949). The fertilization reaction in the sea-urchin egg. A note on diffusion
considerations. J. Exp. Biol. 26, 177.ROTHSCHILD, LORD & SWANN, M. M. (1949). The fertilization reaction in the sea-urchin egg. A
propagated response to sperm attachment. J. Exp. Biol. 36, 164.SCHMIDT, W. J. (1937). Die Doppelbrechung von Karyoplasma, Metaplasma und Zytoplasma. Berlin.SCHMIDT, W. J. {1939). Doppelbrechung der Kemspindel und Zugfasertheorie der Chromosomen-
bewegung. Chromosoma, 1, 253.SCHHADER, F. (1944). Mitosis. New York.SWANN, M. M. (1951a). Protoplasmic structure and mitosis. I. The birefringence of the metaphase
spindle and asters of the living sea-urchin egg. J. Exp. Biol. 28, 417.SWANN, M. M. (19516). The Spindle, in Hughes' The Mitotic Cycle. London.SWANN, M. M. (1951c). Structural agents in mitosis. Int. Rev. Cytol. 1 (in the Press).SWANN, M. M. (1952). The nucleus in fertilisation, mitosis and cell division. Symp. Soc. Exp. Biol.
6 (in the Press).
444 M. M. SWANN
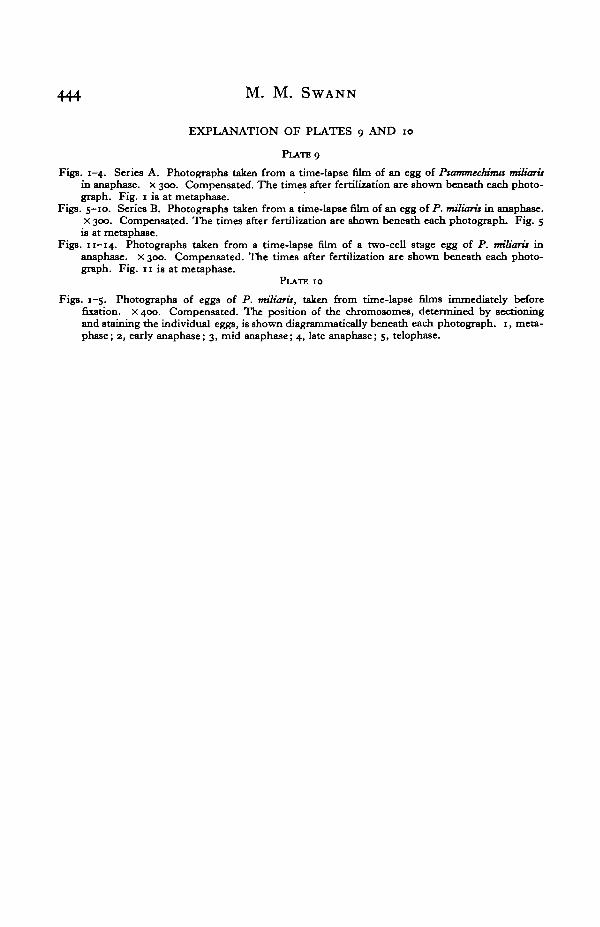
EXPLANATION OF PLATES 9 AND 10
PLATE 9
Figs. 1-4. Series A. Photographs taken from a time-lapse film of an egg of Psammeddma mitiarisin anaphase. x 300. Compensated. The times after fertilization are shown beneath each photo-graph. Fig. 1 is at metaphase.
Figs. 5-10. Series B. Photographs taken from a time-lapse film of an egg of P. miliaris in anaphase.x 300. Compensated. The times after fertilization are shown beneath each photograph. Fig. 5
is at metaphase.Figs. 11-14. Photographs taken from a time-lapse film of a two-cell stage egg of P. miliarU in
anaphase. x 300. Compensated. The times after fertilization are shown beneath each photo-graph. Fig. 11 is at metaphase.
PLATE 10
Figs. 1-5. Photographs of eggs of P. miliaris, taken from time-lapse films immediately beforefixation, x 400. Compensated. The position of the chromosomes, determined by sectioningand staining the individual eggs, is shown diagrammatically beneath each photograph. 1, meta-phase; 2, early anaphase; 3, mid anaphase; 4, late anaphase; 5, telophase.
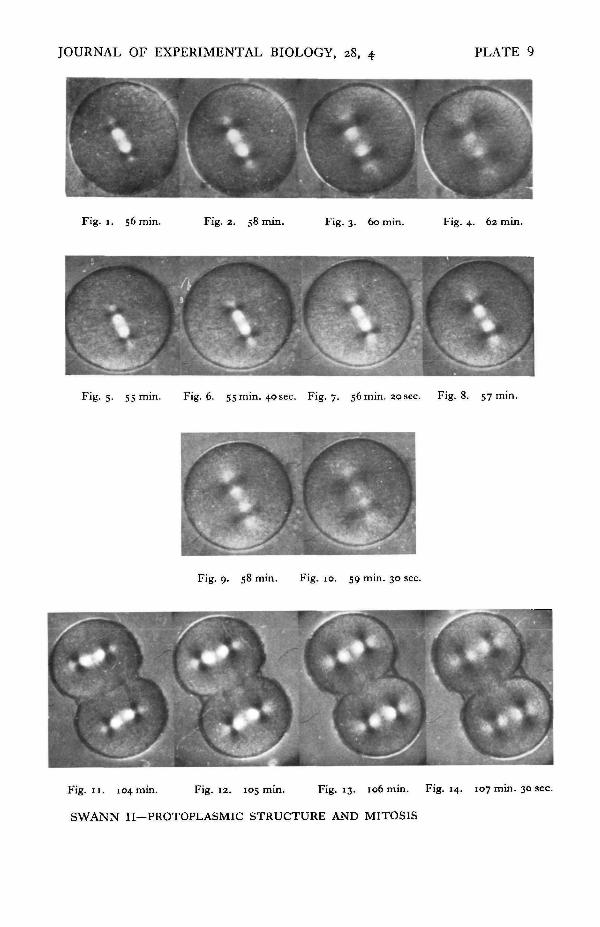
JOURNAL OF EXPERIMENTAL BIOLOGY, 28, 4 PLATE 9
Fig. 1, 56 min. Fig. 2. 58 min. Fig. 3. 60 min. Fig. 4. 62 min.
Fig. 5. 55 min. Fig. 6. 55 min. 40 sec. Fig. 7. 56 min. 20 sec. Fig. 8. 57 min.
Fig. 9. 58 min. Fig. 10. 59 min. 30 sec.
Fig. 11. 104 min. Fig. 12. 105 min. Fig. 13. 106 min. Fig. 14. 107 min. 30 sec.
SWANN II—PROTOPLASMIC STRUCTURE AND MITOSIS
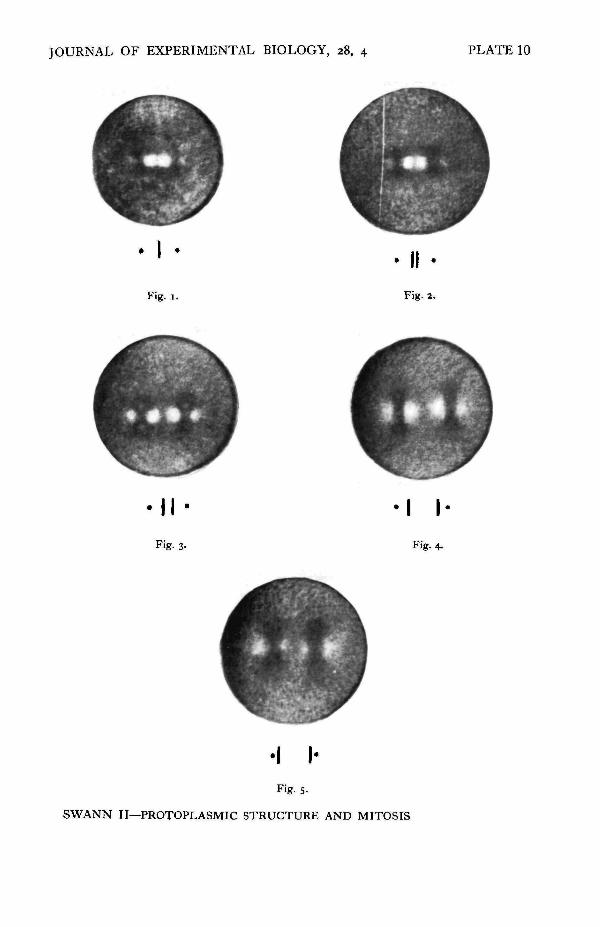
JOURNAL OF EXPERIMENTAL BIOLOGY, 28, 4 PLATE 10
Fig. 1.
II-Fig. 3-
•I !•
II •Fig. 2.
I I 'Fig. 4-
Fig- 5-
SWANN II—PROTOPLASMIC STRUCTURE AND MITOSIS