Embed Size (px)
Citation preview

METU Studies in Development, 28 (3-4), 2001, 399-430
Dimensions of employeesatisfaction: A state university
example*
Fatma Küsküİstanbul Technical University, Faculty of Management, Spor Cd., No.2, 80680, Maçka, İstanbul ,
Turkey
AbstractThe main purpose of this research is to explore the satisfaction level of the
academic staff of state universities. In this research, a state university in Istanbul, oneof the oldest and most institutionalised among state universities of Turkey, wasselected as an example. 191 academic staff members answered an originalquestionnaire. According to the results of the research, although satisfaction levels indifferent dimensions are not high, Professional Satisfaction and Institutional JobSatisfaction are the dimensions that most participants are satisfied with, followed byColleague Competition Level Satisfaction and Colleague Relations Satisfaction. Sincethese factors have positive effects on the general satisfaction levels of employees, theimprovements therein will cause an increase on the general satisfaction levels ofemployees. This research discloses findings on employee satisfaction –an essentialaspect in realising quality management understanding in state universities.
1. Introduction
Nowadays, new management patterns are arising as a result of social,economic and political changes and in recent years, the human factor hasemerged as the focal point of changes taking place in organisations. TotalQuality Management also seeks constant development by placing thehuman factor in the foreground. This approach maintaining that totalquality can be attained with the co-operation of all the employees is beingused to solve numerous problems in many industrial and serviceorganisations in the world as well as in Turkey.
* The Research Foundation of Istanbul Technical University supported this researchfinancially. Thanks to Haluk Levent for his help and support in collecting data, and to JaleAlguadiş and Feyza Kantur for their valuable help in editing this article. The helpful
comments from three anonymous reviewers on an earlier draft of this article were appreciated.

Fatma KÜSKÜ
Implementing Total Quality Management in organisations is onlypossible when the satisfaction of all parties participating in the productionprocess is maximised. This is referred to as “customer satisfaction” inTotal Quality Management. Attaining customer satisfaction, especially‘internal customer (employee) satisfaction’ which has become widespreadwith total quality (see Sitkin et al., 1994), can be accomplished withholders of successive processes responding to each other’s expectationsand desires in a customer-provider relationship.
The satisfaction level of employees is a concept reflecting the degreeto which the individual's needs and desires are met and the extent to whichthis is perceived by the other employees. Although different researchershave different definitions of employee satisfaction, it is usually perceivedas “the scope of the work and all the positive attitudes regarding the workenvironment” (Staples and Higgins, 1998) and can only be attained if theparties regard one another as customers they have to satisfy.
Especially in recent years, the fact that the level of satisfaction is asimportant for the employee as it is for the organisation is an issue oftenemphasised in studies on management and organisational behaviour.Finding significant and important relations between absenteeism (Dwyerand Ganster, 1991), employee turnover (Jenkins, 1993) and organisationalloyalty (Witt and Beokermen, 1991) in some studies conducted in this areahas led to a better understanding of the increasing importance of employeesatisfaction. Moreover, employee satisfaction has been emphasised tosuch a degree that a relation between employee satisfaction and lifesatisfaction has been queried in many studies (Chacko, 1983; Tait et al.,1989; Judge and Watanabe, 1993; Howard and Frink, 1996). With theunderstanding of the importance of employee satisfaction, numerous topmanagers have encouraged their organisations to make endeavours in thisdirection.
This research has been conducted to explore the satisfaction level ofthe academic staff who make up only one party1 of the production processin state universities (non-profit organisations with many responsibilities)and to see the differences of personal and situational factors onsatisfaction.
Although Total Quality Management is most often implemented inprofit-making industrial and service organisations, since the beginning of1990s, there has also been a growing interest in quality management inhigher education all over the world (e.g., Coate, 1993; Cowles andGilbreath, 1993; Williams 1993; Kanji and Tambi, 1999; Herguner andReeves, 2000; Mergen et al., 2000). Yet, quality in education appeared in
1 Although from the Total Quality Management aspect, the internal customers to besatisfied in higher education institutions are the students, administrators, academic staff andadministrative staff, only the academic staff was included in this study in order to limit thestudy. Further research is to be done to study other parties.
144

METU STUDIES IN DEVELOPMENT
the agenda in Turkey only in the late 1990s (e.g., Cafoğlu, 1996;Saatçioğlu, 1996; Basık, 1997).
In Turkey, higher education underwent a serious revision process inthe 1990s. One of the most obvious characteristics of this change was theestablishment of numerous new universities. While some of these werenew state universities in various cities throughout the country, anincreasing number of private universities were also established in bigcities. This rapid increase may be reflecting an important structuralmodification: university education is now being considered more as aprofit-making tool rather than a social responsibility, and universities aregradually being considered as institutions functioning according to marketconditions2. The consequence of this tendency has been competition inhigher education and the grouping and classification of universitiesaccording to certain quality criteria. This classification process has, inturn, led to efforts towards the implementation of quality management inhigher education institutions in Turkey3 as well as in other countries (seeBrennan and Shah, 2000).
No doubt, the evaluation of higher education institutions has manydimensions such as the quality of the education provided, the quality, thecontinuity and the quantity of scientific research, the awareness of socialresponsibility and the ability to fulfil this responsibility (Küskü andLevent, 1998). However, it is also obvious that institutions can onlyprogress based on the views, attitudes and perceptions of their humanresources (Luthans and Stajkovic, 1999). Therefore, just as it is with otherorganisations, concentrating on employees -one of the most valuableresources of universities- and carrying out studies related to theirsatisfaction have become essential.
Some researchers have studied different dimensions of employeesatisfaction among academic staff in different cultures since the beginningof the 1970’s. For instance, Flowers and Hughes (1973) developed thenotion of relationship between employee satisfaction and environmentalfactors, particularly in accounting for reasons that employees stay in theirjobs. Pearson and Seiler (1983) concentrated on the academics’ levels of
2 There may be the same trend in other settings. According to the results of a study(Gumport, 2000), over the past 25 years the dominant legitimating idea of public highereducation has changed from higher education as a social institution, an organized activity thatmaintains, reproduces, or adapts itself to implement values that have been widely held andfirmly structured by society, to higher education as an industry, producing a wide range ofgoods and services in a competitive marketplace.
3 Some universities have started to make some endeavours to increase the quality ofthe education in their universities in Turkey. For instance, as a result of these efforts SabancıUniversity (http://sabanciuniv.edu.tr/tarihce_genel.html) has been accepted for membership inEuropean Foundation Quality, and Sakarya University (http://www.sau.edu.tr/iso9002.html)obtained ISO 9002. Furthermore some universities strive to maintain a high standard ofeducation by international standards (e.g., several departments of METU(http://www.metu.edu.tr/ about/geninfo/php) and Boğaziçi University(http://www.boun.edu.tr) have been evaluated by some international accreditation boards.
145

Fatma KÜSKÜ
satisfaction with the environment in which they work and found out thatacademics were generally more satisfied than dissatisfied with their workenvironment, but that there were high levels of dissatisfaction withcompensation-related elements of the job (e.g., fringe benefits, pay,performance criteria). According to Moses’s (1986) research, academicstaff were dissatisfied with the undervaluing of teaching performance inthe criteria for being promoted. Further, Manger and Eikeland (1990)examined factors that influence academics’ intentions to leave theuniversity, and found out that, although salary and economic resources didnot appear to influence intentions to stay or go, general employeesatisfaction and relations with colleagues were the strong predictors ofintention to leave. More recently, Lacy and Sheehan (1997) investigatedthe impact of context elements, including working climate andatmosphere, on general levels of job satisfaction across eight nations(Australia, Germany, Hong Kong, Israel, Mexico, Sweden, UK, USA),and found out that university atmosphere, sense of community, andrelationship with colleagues are the greatest predictors of job satisfaction.Tang and Talpade (1999) focused on the sex differences in employeesatisfaction in a university in the USA and found out some significantdifferences between males and females in that males tended to have highersatisfaction with pay than females, whereas females tended to have highersatisfaction with their colleagues than males.
The results of this study will broaden findings of the previousresearches mentioned above on the issue of employee satisfaction - anessential aspect in realising total quality - and thus an important step willhave been taken towards adopting quality management understanding instate universities.
This study consists of two main sections. The first section analysesthe different dimensions of employee satisfaction according to findingsobtained from reviewing the relevant literature, while the second sectionpresents the findings and results of a study carried out to expose theeffects of these dimensions on general satisfaction in a Turkish stateuniversity.
2. Dimensions of employee satisfaction
In many studies, employee satisfaction is regarded as a function ofthe harmony between rewards given by the work environment and thedesire of the individual for these rewards (Scarpello and Vandenberg1992: 125). However, it is quite difficult to show this relation empirically.How can the employee satisfaction level in an organisation be measured?There are numerous views on the subject. The most often used andemphasised method in studies on the subject is to measure the differentdimensions of satisfaction separately and then to use these to determine ageneral satisfaction level (see Rice et al., 1991). And here the question
146

METU STUDIES IN DEVELOPMENT
“What are the dimensions that make up general employee satisfaction?”arises.
In the literature various scales have been developed to measure thedifferent dimensions of employee satisfaction. The Minnesota SatisfactionQuestionnaire prepared by Weis et al. (1967), the Job Descriptive Indexdeveloped by Smith et al. (1969) and the Job Diagnostic Survey byHackman and Oldham (1975) can be mentioned among the most oftenused. These scales have later been used in studies either exactly as theyare or by decreasing the number of items they contain or adapting some ofthe items to the subject of the study (e.g. Doran et al., 1991; Scarpello andVandenberg, 1992; Jenkins, 1993; Tang and Talpade, 1999).
A number of researchers working in different disciplines have usedthese basic scales mentioned above to group the satisfaction dimensionsrelated to the objectives of their research subjects in different ways. Themost often emphasised satisfaction dimensions in studies are explained inthis section.
Management Satisfaction: Many studies dealing with employeesatisfaction emphasise the importance of superiors on general satisfaction,especially because of their role in the employee’s performance and career(e.g. Wall and Payne, 1973; Hackman and Oldham, 1975; Scarpello andVandenberg, 1992; Wright and Bonett, 1992; Jenkins, 1993; Judge, 1993).In these studies, many dimensions of satisfaction with higher managementhave been investigated such as understanding of employees’ problems andneeds, considering employees’ suggestions when taking decisions,showing the necessary concern for employees’ problems, and beingaccessible by the employees. Nonetheless, these studies have mainly dealtwith first-degree superiors in whom the superior-subordinate relationshipis much more intensive. As it is rather difficult to determine the effect ofthe higher management group on employees, their effect on generalsatisfaction has often been a dimension that has been neglected. However,being satisfied with higher management is an important dimension of jobsatisfaction and work environment satisfaction. Therefore, both highermanagement and the department management, which directly affect theemployee, should be analysed in studies directed to determine employeesatisfaction level.
Colleague Satisfaction: People share the work environment withothers doing the same or similar kind of work. The success and interestshown by other employees in their own work usually strongly affect thesatisfaction that people feel in their work environment. As well asthoughts about colleagues’ qualifications, knowledge and skill, thefriendship and co-operation among those working in the same institution,which are the subdimensions of colleague satisfaction, have often beenemphasised by researchers (e.g. Wall and Payne, 1973; Manger andEikeland, 1990; Scarpello and Vandenberg, 1992; Wright and Bonett,
147

Fatma KÜSKÜ
1992; Jenkins, 1993; Judge, 1993; Lacy and Sheehan, 1997; Tang andTalpade, 1999). Colleague satisfaction should be dealt with as an elementused to determine general employee satisfaction both from the point ofview of competition and co-operation at work.
Other Work Group/Groups Satisfaction: Employees can besuccessful in their own jobs only if they can make the work environmentmore productive with the help of other employees who work in the sameorganisation but have different jobs and by giving support to the variousjobs done. The internal customer concept emphasised by total qualitymanagement also concentrates on the extent and importance of the effectthat people who work in the same environment but do different jobs haveon one another. Other work group/groups’ satisfaction should be analysedas a dimension of satisfaction since the strong bonds among employeesdoing different jobs is of major importance for people working in thesame organisation to be successful in their respective jobs. Beingcooperative, having initiative in every aspect of the work, having workdedication, having the capacity to develop suggestions related to the work,and being honest may be used as subdimensions of other workgroup/groups’ satisfaction.
Job Satisfaction: In some studies, job satisfaction and employeesatisfaction have been used as interchangeable terms (e.g. Hackman andOldham, 1975; Chacko, 1983; Eichar et al., 1991; Mathieu and Farr,1991; Witt and Nye, 1992; Lacy and Sheehan, 1997). But in many otherstudies, on the assumption that job satisfaction shows only satisfactionwith the work itself, it has been stressed as an important dimension ofemployee satisfaction and also debated extensively (e.g. Wall and Payne,1973; Mathieu, 1991; Wright and Bonett, 1992; Jenkins, 1993).
Physical Environment Satisfaction: No matter how motivated andefficient people are in their jobs, various physical characteristics of theenvironment they work in seriously affect the success and productivitythey would like to attain. Therefore, the conditions of the physicalenvironment (e.g. library conditions, laboratory and computer facilities,work area, canteen conditions) are also often emphasised in studiesdealing with employee satisfaction (e.g. Wall and Payne, 1973; Chacko,1983, Pearson and Seiler, 1983; Scarpello and Vandenberg, 1992).
Salary and Other Material Benefits Satisfaction: Salary and othermaterial benefits satisfaction appear as an important dimension ofsatisfaction in almost all studies exploring employee satisfaction (e.g.Wall and Payne, 1973; Hackman and Oldham, 1975; Chacko, 1983;McFarlin and Rice, 1992; Witt and Nye, 1992; Jenkins, 1993; Judge,1993; Tang and Talpade, 1999). However, the point that must be kept inmind here is the relationship between satisfaction and people’s financialneeds because many consider that financial pressure seriously influences
148

METU STUDIES IN DEVELOPMENT
employee behaviour and attitude and thereby the general satisfaction level(Brett et al., 1995, p. 261).
The section hereafter presents the findings obtained from the analysesof the dimensions thought to have an effect on general employeesatisfaction in an organisation.
3. Scope and method of the research 3.1. Choice of organisation
Although this research was mainly conducted to expose the problemsof those working in state universities in general, only one state universityin Istanbul, one of the oldest and most institutionalised among stateuniversities, was selected as an example. Since the conditions and workenvironment of state universities founded before 1980s in Turkey arenearly the same, the data obtained from the academic staff working at thisinstitution may help make generalisations encompassing academic staffworking at other state universities4. Moreover, as this study will containthe academic staff's evaluations and perceptions of the work environment,it may act as a guide for precautions to be taken and managementstrategies to be designed to increase efficiency and effectiveness in theuniversity.
3.2. Data collection
The subjective standpoint commonly used in research dealingespecially with social sciences rather than objective criteria was used tocollect data in this study. This was done because determining the level ofsatisfaction the employees derive from the environment they work in andfinding out the elements affecting this satisfaction is possible only whenthey are based on the employees’ ideas, perceptions and attitudes.
Since there are some cultural differences and the conditions and thework environment of state universities are not the same as those in othercountries, an original questionnaire was used for this research. In order tocollect data more easily, the questionnaire was developed in Turkishfollowing the detailed information gathered reviewing the relevantliterature and interviewing some of the staff. It was then pretested amongpeople working in a faculty (Management) of the institution. It wasfinalised after making some changes to facilitate understanding.
4 There may be some differences between old universities and new universities. Forexample, old universities can make longer-range plans compared to the new ones. In additionnew universities are concerned with building their image, which is consistent with their newstatutes (see Kanji and Tambi, 1999). Because of these reasons, the conditions of the old stateuniversities founded before 1980s and of the young state universities founded after 1980s arenot the same, especially with regard to to their academic staff and work environments.Therefore, the generalization from this research can be made only for the state universitiesfounded before 1980s in Turkey.
149

Fatma KÜSKÜ
3.3. Sample plan
The whole population, i.e. all the academic staff working in thefaculties of that university, was included in the scope of the research. Theobjective was to attain a high level of relevance and reliability. Thenumber of the academic staff in the mentioned institution was 1415.However, only 202 of the questionnaires were answered and since somehad missing data, they were not included in the sample. Only 191questionnaires were used in the analyses. According to these figures, therate of reply was 14.28 percent and the sample proportion was 13.50percent.
3.4. Scales used in the research
Scales commonly used in this type of research were used todetermine both the general satisfaction level and the satisfactiondimensions that affect this satisfaction level. The items in the scale weredeveloped according to the 10-point Likert scale (1: Strongly Disagree,10: Strongly Agree). The scales were used after being pretested forcontent relevance and reliability. The items of the scales are in AppendixA and the way they were developed is explained below:
General Satisfaction: The main objective of this research is todetermine the employee satisfaction level. In addition to satisfactiondimensions developed through the use of the relevant literature, a scalewas developed to determine the general satisfaction level. Thus, it wouldbe possible to expose in what way and to what extent satisfactiondimensions influence general satisfaction level.
In numerous researches, general satisfaction is included in theanalysis as only one item. However, since a scale consisting of one itemcreates some reliability problems (Nunnally, 1978; Churchill, 1979; Sethiand King, 1991), measuring general satisfaction level in this researchthrough a scale consisting of more than one item was considered to bemore significant.
According to many studies, as the level of satisfaction derived fromthe work environment and other job related conditions increases,employee loyalty and the level of identification with the organisationincrease (Witt and Boekermen, 1991; Mathieu and Farr, 1991; Becker andBillings, 1993; Riggs and Knight, 1994). Although there are studies inwhich such effects were not determined (Curry et al., 1986), it is possibleto assume that there are important correlations between the generalsatisfaction level of employees and organisational loyalty to facilitatestudies dealing with satisfaction. Therefore, when developing a scaleaiming at determining the general employee satisfaction level, using itemsthat will include their organisational loyalty becomes unavoidable. Withthis assumption in mind, a ‘General Satisfaction’ scale consisting of 9items, including organizational loyalty was developed. Five of the items
150

METU STUDIES IN DEVELOPMENT
(2-6)5 of the scale were adapted to this research from the research ofJenkins (1993), the ninth item was inspired by the studies of Eichar andcolleagues (1991) and Witt and Nye (1992) and the remaining items wereoriginal.
Management Satisfaction (University and Faculty ManagementSatisfaction): The importance of the higher management group isundeniable in giving support and facilitating the work of employees evenin higher education institutions where especially the academic staff isquite independent in the work they do. Therefore, two different scaleswere developed in this study to query the effect of the top administrationboth of the university (the rectorate) and of the faculties on generalsatisfaction.
A scale consisting of 5 items was used to determine the degree ofuniversity management satisfaction. The second item in the scale wasinspired by the studies of Scandura and Graen (1984).
A scale with more items (8) was developed to determine facultyadministration satisfaction since they have a more direct effect on thestaff. The second and third items were inspired by the studies of Scanduraand Graen (1984) just like in the scale concerning the universitymanagement.
Colleague (Other Academic Staff) Satisfaction: For the academicstaff, other academic members have been designated as ‘colleagues’, andthe expectations, opinions and attitudes of the staff concerning this grouphave been queried. The scale contains 10 items to determine the ideas,opinions and attitudes of the staff concerning their colleagues in the samegroup, doing the same kind of work. The fourth and fifth items in thescale have been adapted from the study of Turban and Jones (1988) whilethe others are original items developed to suit the higher education systemin Turkey.
Other Work Group Satisfaction: Other work group/groups’satisfaction is important for the success of people working in the sameorganisation due to the close link between the groups. The satisfactionthat the academic staff derives from the administrative staff (clerks andservice personnel) was included in the scope of this research and 10 itemswere developed with this objective in mind. The second, third and fourthitems in the scale were inspired from the study of Beehr and colleagues(1994) and the ninth from that of Judge and Watanabe (1993).
5 The scales or the items used in the scales, which were used or adapted from otherresearches, were translated into Turkish by a Turkish professional translator and by a bilingualTurkish management lecturer. In order to maintain translation equivalence, a secondprofessional translator back translated them into English. The author and the bilingual Turkishlecturer resolved a few discrepancies between the original items and their back-translation(See, Sekaran, 1983).
151

Fatma KÜSKÜ
Job Satisfaction: A scale consisting of 8 items was developed todetermine the degree of satisfaction employees derive from their job in theorganisation, from their responsibilities and duties.
Physical Environment (Organisational Conditions) Satisfaction: Ascale consisting of 14 items was developed to determine the level ofsatisfaction employees derive from the various aspects of the physicalenvironment - work environment, toilets, laboratories, libraries, canteens -in the institution.
Salary Satisfaction: Since salary and other material aspects are not aprerogative of the state institution itself but of the economic and politicalpolicies of the Turkish State, this dimension of satisfaction may beexcluded from satisfaction studies concerning higher educationinstitutions. However, salaries paid to employees are a factor thatfacilitates the job that the academic staff are doing and therefore, have theeffect of increasing general organisational satisfaction. Therefore, thisstudy aims at measuring opinion about salary as a dimension ofsatisfaction with a scale of 3 items.
4. Independent variables used in the research
Various personal (demographic and socio-economic) variables weredetermined to expose some significant relationships with the satisfactiondimensions being tested. The frequent emphasis on the importance ofpersonal and situational elements on satisfaction (Scarpello andVandenberg, 1992; Tang and Talpade, 1999) points out that especially inattitude assessment studies, this type of variables cannot be neglected.Some variables used in this study and their significance are given below:
Age and Seniority: One of the regular findings in job literature is thepositive relation between age and satisfaction. Older employees are saidto have a high level of organisational satisfaction compared to youngerones (Eichar et al., 1991; Judge and Watanabe, 1993; Beehr et al., 1994).According to the initial debates concerning age and employee satisfaction,young people have higher expectations from their jobs; however, mostoften they cannot find opportunities to satisfy these expectations and are,therefore, disillusioned. The natural result of this disillusion isdissatisfaction with the work environment. Similar relations can beexpected concerning the seniority of employees. Therefore, employees’seniority in position and seniority in organisation were included in thestudy alongside age.
Gender: Although the relation between gender and job satisfactionhas been the focal point of many studies, it has not, so far, been reallyclarified (Witt and Nye, 1992). While significant differences were foundin some studies in the relation between gender and general satisfactionlevel (Forgionne and Peters, 1982; Pavesic and Brymer, 1990; Lacy and
152

METU STUDIES IN DEVELOPMENT
Sheehan, 1997; Staples and Higgins, 1998; Tang and Talpade, 1999),others have not been able to determine important and significantdifferences (Smith and Plant, 1982). This implies that the effects ofgender on satisfaction are liable to change according to the organisationbeing studied, the work done and the work environment.
Academic Position in Institution: Since higher-level jobs tend to bemore complex and have better working conditions, pay, supervision,autonomy, and responsibility, the level at which an individual workswithin the organisation might also exert some influence on the satisfactionof employees. Therefore, most researchers have found out that employeesatisfaction increases as the level of the job increases within anorganisation hierarchy (e.g. Howard and Frink, 1996; Robie et al., 1998).However, some researchers have found negligible associations betweenemployee satisfaction and job level (e.g. Bretz et al., 1994). And also ithas been reported that employee satisfaction decreases as job levelincreases (e.g. Mosholder et al., 1981).
The academic position held could have significant effects onemployee satisfaction. Since those who have become professors are lessapprehensive while doing their work and are able to create a relativelymore independent working environment for themselves, their satisfactionlevel is likely to be higher than that of the other academic staff. On theother hand, those with lower academic positions feel the pressure of bothYÖK (Board of Higher Education) and the criteria that the universitiesthemselves have set in the competitive atmosphere of today's world, andtherefore, their satisfaction level tends to be lower than that of professors.Therefore, academic position in the institution has been included in thestudy as an important variable.
Administrative Responsibility: Since it is more likely thatadministrative employees might be informed of or involved in planningand implementing the changes within the organisation (Howard and Frink,1996), it was assumed that having administrative responsibilities in theorganisation would lead to higher satisfaction with the organisationcompared to those without administrative responsibilities. Thus, havingadministrative responsibilities was also subjected to analysis.
Experience in Other Organisations: Previous satisfaction mightpredict current satisfaction (Howard and Frink, 1996). Therefore,assuming that the satisfaction level of those who have worked in otherorganisations and have joined this organisation after some negativeexperiences would be relatively higher, the study also investigates theemployees' prior experience.
Intention to Leave: Many studies (e.g. Manger and Eikeland, 1990;Jenkins, 1993; Brett et al., 1995) have brought up the fact that there is anegative relation between the various dimensions of employeesatisfaction, personnel turnover and intention to leave. In other words, as
153

Fatma KÜSKÜ
the employee satisfaction level rises, employee's intention to leave reducesand as a result employee turnover is less. Furthermore, some studiesemphasise the indirect relation between satisfaction and employeeturnover rate (Jenkins, 1993; Brett et al., 1995). According to the negativerelation between intention to leave and employee satisfaction, those whoare not satisfied with the organisation they work in are more likely tochange their jobs. In other words, intention to leave comes up as a resultof dissatisfaction or a low satisfaction level. Therefore, the study queriedwhether the academic staff was intending to leave, and also whether thosewho did “were actively looking for a job” and “for what kind oforganisation they were intending to leave their present jobs”.
The above were included as independent variables in the statisticalanalyses with the assumption that they could influence the differentsatisfaction dimensions of the academic staff working in the institution.
5. Findings of the study 5.1. General characteristics of the research participants
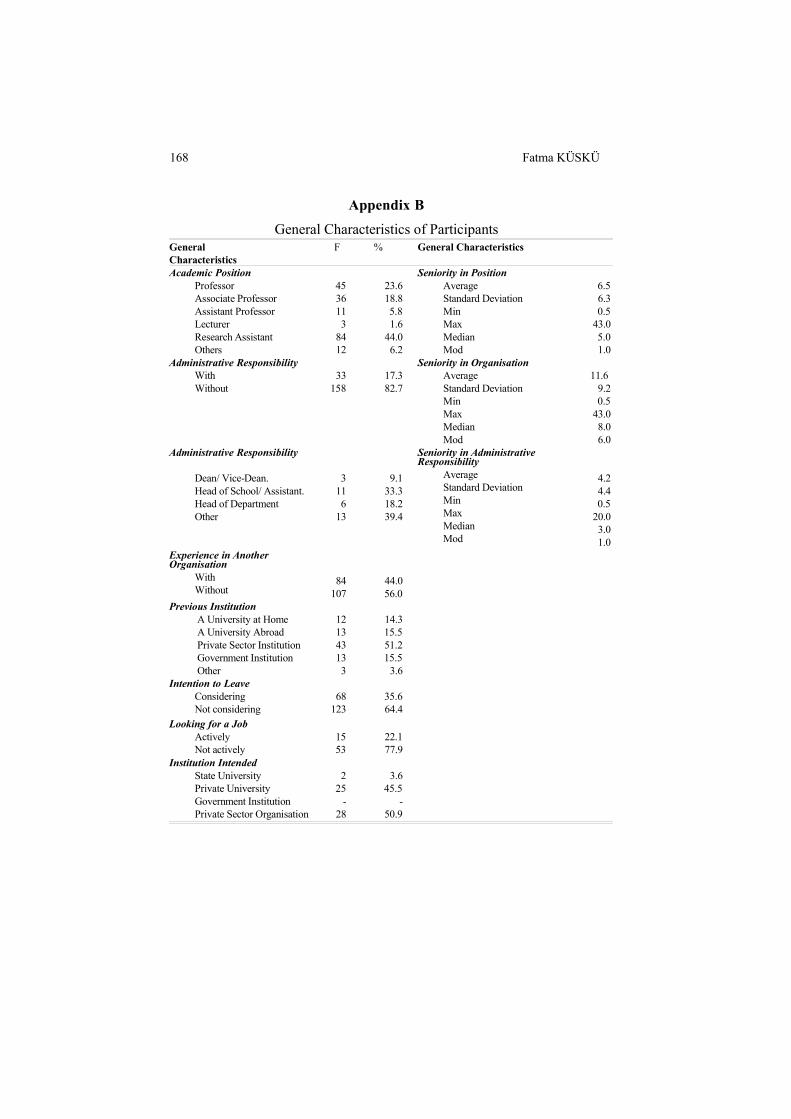
Appendix B contains findings concerning independent variables,which have causal effects on satisfaction level.
191 academic members of a state university participated in this studyanalysing Employee Satisfaction in State Universities. The average age ofparticipants was 37.5 and approximately two thirds (62.3%) were men.Most of the participants were those working as Research Assistants(44.0%), followed by Professors (23.6%) and Associate Professors(18.8%). A significant number of the participants (17.3%) had variousadministrative responsibilities – Dean (Head of Faculty) / Assistant Dean,Head of School / Assistant Head of School, Head of Department - inaddition to their academic ones.
Almost half (44.4%) of the participants had previously worked inanother organisation. More than half (51.2%) had worked in the ‘privatesector’, and a significant number (29.8%) in a university at home orabroad. Most of those who had previously worked in a ‘private sector’enterprise declared the “desire to pursue an academic career” as their mostimportant reason for leaving their previous jobs.
More than one third (35.6%) of the participants indicated that theyintended to leave the institution in the near future. But only 22.1 % ofthose intending to leave indicated that they were actively looking for anew job. While half (50.9%) of those intending to leave indicated thatthey wanted to continue in a ‘private sector organisation’, almost half(45.5%) said they would like to transfer to a ‘private university’.
154

METU STUDIES IN DEVELOPMENT
5.2. Explanatory statistics related to scales
Factor analysis6 was done for each scale developed on the assumptionthat they affect employee satisfaction (Stewart, 1981; Sethi and King,1991). The aim of factor analysis is to provide more significant andsummarised data based on the relations between items. Following factoranalyses, the variables (items) in each sub-factor were subjected to contentanalysis and the sub-satisfaction dimensions were labelled.
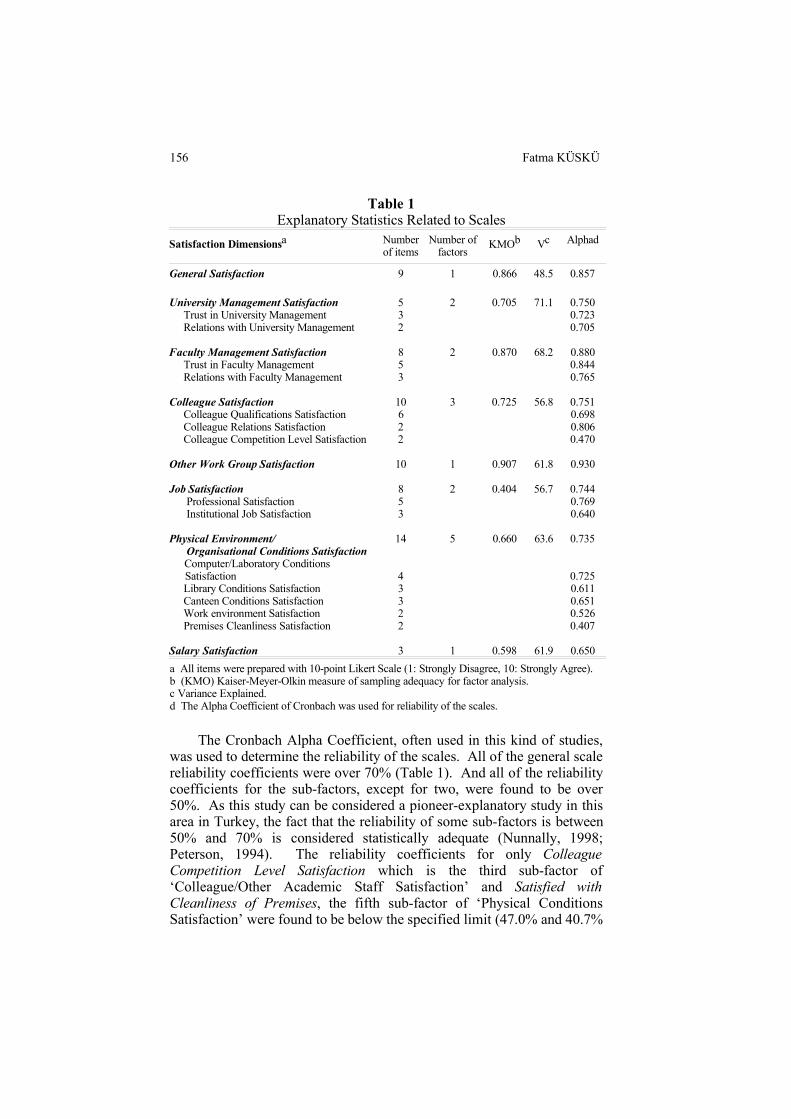
Since all the scales used were developed through the use of therelevant literature, their ‘content relevance’ is considered to be appropriate(Gerbing and Anderson, 1988; Bagozzi et al., 1991; Ahire et al., 1996).Explanatory statistics concerning the scales are given in Table 1.
When factor analysis is applied according to the basic componentsmethod, ‘Satisfaction derived from University and Faculty Management’dimensions present two different sub-factors. After the items in each sub-factor were examined from the content point of view and interpreted in thelight of findings in ‘employee satisfaction’ literature, the first factors werelabelled Trust in University/ Faculty Management and the second factorsRelations with University/ Faculty Management.
The dimension used to demonstrate ‘Other Academic Staff(Colleague) Satisfaction’ consists of three sub-factors. As a result ofexamination, these were labelled Colleague Qualifications Satisfaction,Colleague Relations Satisfaction and Colleague Competition LevelSatisfaction.
‘Job Satisfaction’ consists of two sub-factors, namely ProfessionalSatisfaction and Job Satisfaction.
‘Physical Environment/ Organisational Conditions Satisfaction’consists of five sub-factors namely, Computer and Laboratory ConditionsSatisfaction, Library Conditions Satisfaction, Canteen ConditionsSatisfaction, Work Environment Satisfaction and Satisfied withCleanliness of Premises.
Other Work Group Satisfaction, Salary and Material BenefitsSatisfaction and General Satisfaction consist of only one factor each.
6 The results of the analysis can be obtained from the researcher if desired.
155
Fatma KÜSKÜ
Table 1Explanatory Statistics Related to Scales
Satisfaction Dimensionsa Numberof items
Number offactors
KMOb Vc Alphad
General Satisfaction 9 1 0.866 48.5 0.857
University Management Satisfaction Trust in University Management Relations with University Management
532
2 0.705 71.1 0.7500.7230.705
Faculty Management Satisfaction Trust in Faculty Management Relations with Faculty Management
853
2 0.870 68.2 0.8800.8440.765
Colleague Satisfaction Colleague Qualifications Satisfaction Colleague Relations Satisfaction Colleague Competition Level Satisfaction
10622
3 0.725 56.8 0.7510.6980.8060.470
Other Work Group Satisfaction 10 1 0.907 61.8 0.930
Job Satisfaction Professional Satisfaction Institutional Job Satisfaction
853
2 0.404 56.7 0.7440.7690.640
Physical Environment/ Organisational Conditions Satisfaction
Computer/Laboratory ConditionsSatisfaction
Library Conditions Satisfaction Canteen Conditions Satisfaction Work environment Satisfaction Premises Cleanliness Satisfaction
14
43322
5 0.660 63.6 0.735
0.7250.6110.6510.5260.407
Salary Satisfaction 3 1 0.598 61.9 0.650
a All items were prepared with 10-point Likert Scale (1: Strongly Disagree, 10: Strongly Agree).b (KMO) Kaiser-Meyer-Olkin measure of sampling adequacy for factor analysis.c Variance Explained.d The Alpha Coefficient of Cronbach was used for reliability of the scales.
The Cronbach Alpha Coefficient, often used in this kind of studies,was used to determine the reliability of the scales. All of the general scalereliability coefficients were over 70% (Table 1). And all of the reliabilitycoefficients for the sub-factors, except for two, were found to be over50%. As this study can be considered a pioneer-explanatory study in thisarea in Turkey, the fact that the reliability of some sub-factors is between50% and 70% is considered statistically adequate (Nunnally, 1998;Peterson, 1994). The reliability coefficients for only ColleagueCompetition Level Satisfaction which is the third sub-factor of‘Colleague/Other Academic Staff Satisfaction’ and Satisfied withCleanliness of Premises, the fifth sub-factor of ‘Physical ConditionsSatisfaction’ were found to be below the specified limit (47.0% and 40.7%
156

METU STUDIES IN DEVELOPMENT
respectively). Therefore, one must be careful while commenting on thesetwo factors.
The Kaiser-Meyer-Olkin (KMO) measure of sampling adequacy forfactor analysis of the determined scales were found to be within acceptablelimits (Table 1) except for the ‘Job Satisfaction’ scale (0.404) (Stewart,1981; Black and Porter, 1996).
The variance percentages of all scales developed were found to beover 55% (Table 1). This shows that only a small percentage of the totalvariance of the developed scales can be explained by other variables.
5.3. Effects of the independent variables on satisfaction
The t test7 conducted has shown that the opinions of the academicstaff working in the institution do not reflect serious differences accordingto gender. A statistically significant relation is found only between SalarySatisfaction level and gender. According to this finding, women's salarysatisfaction level is slightly lower than that of men’s8.
There are no statistically significant relations between the age of theacademic staff and satisfaction dimensions in this research. However, asthe age of employees declines, it is observed that they are less satisfiedwith only Relations with Faculty Management and Institutional JobSatisfaction. Therefore, their ‘General Satisfaction’ level is found to belower9. This can be suggestive of the high expectations of youngacademics compared to older ones.
Views on certain satisfaction aspects are observed to differ accordingto the academic staff’s academic position in the institution. According tothe least significance test, which was made after analysis of variance10, theOther Work Group (Administrative Staff) Satisfaction level of ResearchAssistants is lower than that of Professors11.
There are no significant relations between the seniority of the staffand satisfaction aspects. However, according to the one-way varianceanalyses, there are some statistically significant relations betweenseniority and some aspects of satisfaction. For instance, the ColleagueQualifications Satisfaction level of those with a 6-10 year institutionalseniority is less and lower than those with more seniority. This may beinterpreted as a result of the fact that people who have not been long withthe institution have not had the chance to really know their colleagues, and
7 t test is used to accurately describe the shape of the sampling distribution for meansto compare two groups (Runyon et al., 1996).
8 t= -2.47, p=0.014; mean for women = 6.48, mean for men = 6.19.9 Mean for age less than 30 = 6.88, mean for age 30-39 = 6.95, mean for age 40-49 =
7.57, mean for age 50-59 = 7.51, mean for age 60 and more = 8.35.10 Analysis is used as a test of means for two or more groups (Runyon et al., 1996).11 F=2.67, p=0.106; mean for professors = 5.93, mean for research assistants = 5.64.
157

Fatma KÜSKÜ
that senior members generally know the people in their professions andtherefore are more satisfied with their colleagues in their own institutions,whereas it may show that the expectation level of those who have anaverage seniority is higher. Similar to this relation, people with moreseniority trust the Faculty Management more12, their Other GroupSatisfaction level is higher13, and so is their Institutional Job Satisfactionlevel14 and as a result, they are more satisfied with the institution comparedto employees with less seniority15.
Those who have a certain administrative responsibility within theinstitution are more satisfied with the Working Environment16, have moreInstitutional Job Satisfaction17 and their General Satisfaction18 level ishigher.
Those who have had previous experience in another organisation areless satisfied with the competition level of their colleagues19 and thecleanliness of the premises20. However, the satisfaction level of those whohave joined this institution after working in another organisation is higherwith respect to Colleague Relations21, Relations with FacultyManagement22, Working Environment23, and Institutional Job24 andtherefore, their general satisfaction25 is higher.
There are also statistically significant and important relationsbetween the specified satisfaction dimensions and the participants’intention to leave. Accordingly, those whose level of Trust in UniversityManagement26 and whose Trust in Faculty Management27 is low, and thosewhose satisfaction level concerning Relations with University
12 Mean for seniority 5 years and less = 5.61, mean for seniority more than 5 years = 6.23.13 Mean for seniority 5 years and less = 5.57, mean for seniority more than 5 years = 6.42.14 Mean for seniority 5 years and less = 5.11, mean for seniority more than 5 years = 6.17.15 Mean for seniority 5 years and less = 6.86, mean for seniority more than 5 years = 7.68.16 t=2.59, p=0.011; mean for with administrative responsibility = 6.95, mean for
without administrative responsibility = 6.16.17 t=3.17, p=0.002; mean for with administrative responsibility = 6.48, mean for
administrative responsibility without = 5.23.18 t=2.44, p=0.016; mean for administrative responsibility within = 7.76, mean for
administrative responsibility without = 7.05.19 t=-2.25, p=0.026; mean for experienced = 6.94, mean for without experience = 7.31.20 t=-2.72, p=0.007; mean for experienced = 5.57, mean for without experience = 6.18.21 t=3.11, p=0.00222 t=2.42, p=0.01723 t=2.59, p=0.01124 t=3.17, p=0.00225 t=2.44, p=0.01626 t=-3.38, p=0.001; mean for consider leaving = 4.72, mean consider not leaving = 5.73.27 t=3.14, p=0.002; mean for consider leaving = 5.16, mean consider not leaving = 6.30.
158
METU STUDIES IN DEVELOPMENT
Management28 is low show a stronger desire to leave. Further, those whoare not very happy with their Colleagues’ Competition Level29, those whoare not Professionally Satisfied30 and are not satisfied by Institutional Job31,and whose general satisfaction level is therefore low32, want to leave.There are similar relations between satisfaction dimensions and activelylooking for a new job.
5.4. Effects of satisfaction dimensions on general satisfaction
The employees’ perception concerning general satisfaction is theresult of the compound effect of all satisfaction dimensions. A multipleregression analysis was conducted to determine both this compound effectand the effects of each satisfaction dimension on general satisfaction (fordetails on the possibility of using factor scores as independent variables inmultiple regression analyses, see Lastovicka and Thamodaran, 1991).Thus, attempts were made to determine the basic satisfaction factors thataffect ‘general satisfaction’ as well as the degree and direction of it.
The stepwise regression method and the satisfaction scores given tosub-satisfaction factors were used as independent variables, and wereadded to the function with the general satisfaction level which is adependent variable. The equation and definitions related to this methodwhere the least square estimation was used are given below:
Yi = α0 + ∑βi * Xi + ε
In this equation, Yi denotes the General Satisfaction Score, Xi theSub-Satisfaction Dimension (Factor) Score, α0 the Constant Coefficient,i the Coefficient showing the Degree of Importance, ε the Error Term.
In the equation given above, the intensity of the effects of sub-satisfaction factors, in other words, the standardised beta values which arethe coefficients showing the importance of the sub-factors within thefunction have been labelled ‘Calculated Importance’. These coefficientsshow the degree of increase that will be achieved on general satisfaction ifan improvement of one unit is realised. In other words, the higher thisvalue is, the more the said sub-satisfaction's relative importance is ongeneral satisfaction.
Table 2 shows the ‘Calculated Importance’ (beta coefficients) valuesof factor dimensions found as a result of factor analyses and the averagesatisfaction degrees specified by employees for the items included in thesedimensions. The satisfaction level calculated as the average of the scores
28 t=-2.24, p=0.027; mean for consider leaving = 4.19, mean consider not leaving = 5.14.29 t=-2.65, p=0.009; mean for consider leaving = 6.70, mean consider not leaving = 7.60.30 t=-2.17, p=0.031; mean for consider leaving = 7.92, mean consider not leaving = 8.58.31 t=-4.49, p=0.000; mean for consider leaving = 4.70, mean consider not leaving = 5.86.32 t=8.22, p=0.000; mean for consider leaving = 6.06, mean consider not leaving = 7.08.
159

Fatma KÜSKÜ
given to the items included in the scales were labelled ‘IndicatedImportance’ as they directly affect general satisfaction.
According to the equations obtained considering the regressionanalysis (R2 = 0.609, Standard Error = 0.619), Trust in UniversityManagement, the sub-dimensions of Colleague Satisfaction, and the sub-dimensions of Job Satisfaction are affecting the General Satisfaction.
When calculated importance values are analysed, it is perceived thatInstitutional Job Satisfaction (0.512) and Professional Satisfaction (0.339)are the two most important dimensions affecting general satisfaction.Other satisfaction dimensions which have important effects on GeneralSatisfaction are Colleagues Competition Level Satisfaction (0.165),Colleagues Qualifications Satisfaction (0.139) and Trust in UniversityManagement (0.133). However, the Colleague Relations Satisfaction has anegative effect on General Satisfaction.
The specified relations show that improvements related toProfessional Satisfaction and Institutional Job Satisfaction should be madeto increase the general satisfaction level of academic staff.
6. Results and suggestions
Higher education in Turkey has entered a process of serious changesince 1990. As a result of some political and economic decisions, thenumber of both state and private universities increased rapidly and so didcompetition in higher education. Increase in competition brought alongefforts and attempts to improve the quality of education offered by theuniversities and to attain a privileged place among competitors. Therefore,nowadays, an important transformation can be observed in Turkishuniversities. This transformation may affect universities positivelyprovided that appropriate strategies are adopted. This will in turn bepossible by getting to know the existing human resources and finding outtheir feelings, opinions and attitudes.
160

METU STUDIES IN DEVELOPMENT
Table 2Effects of Satisfaction Dimensions on General Satisfaction
V a r i a b l e s (Satisfaction Dimensions) CIa pb ISc
University Management Satisfaction Trust in University Management Relations with University Management
0.133 0.017 5.37 - - 4.80
Faculty Management Satisfaction Trust in Faculty Management Relations with Faculty Management
- - 5.90 - - 5.83
Colleague Satisfaction Colleague Qualifications Satisfaction Colleague Relations Satisfaction Colleague Competition Level Satisfaction
-0.128 0.016 4.920.139 0.014 6.840.165 0.002 7.28
Other Work Group Satisfaction - - 5,97
Job satisfaction Professional Satisfaction Institutional Job Satisfaction
0.339 0.00 8.340.512 0.00 5.45
Physical Environment/Organisational Conditions Satisfaction Computer and Laboratory Conditions Satisfaction Library Conditions Satisfaction Canteen Conditions Satisfaction Work environment Satisfaction Premises Cleanliness Satisfaction
- - 4.48- - 5.46- - 5.54- - 6.30- - 5.91
Salary Satisfaction - - 2.62
ConstantMultiple RR2Adjusted R2Standard Error
FSignificance
0.0390.7810.6090.5940.619
38.7300.000
a (CI) Calculated Importance (Standardised 9 coefficients)b (p) Represents a level of significance of 5% for Calculated Importance.c (IS) Indicated Importance: The average of the scores given to the items included in the scales.
The study conducted was based on the assumption that one of themost important elements that determine the quality of the products andservices of an organisation, and its competitiveness is its employees.Therefore, the aim was to determine the level of satisfaction and theelements that affect this level for the academic staff of a state university.
According to the results of the research, each satisfaction dimension,which was believed to have an effect on satisfaction in university, could beexplained with more than one sub-factor. The sub-factors determined as a
161

Fatma KÜSKÜ
result of content analyses were: Trust in University Management, Relationswith University Management, Trust in Faculty Management, Relations withFaculty Management, Colleague Qualifications Satisfaction, ColleagueRelations Satisfaction, Colleague Competition Level Satisfaction, OtherWork Group Satisfaction, Professional Satisfaction, Institutional JobSatisfaction, Computer and Laboratory Conditions Satisfaction, LibraryConditions Satisfaction, Canteen Conditions Satisfaction, WorkEnvironment Satisfaction, Premises Cleanliness Satisfaction, SalarySatisfaction.
Job Satisfaction is the dimension that most participants are satisfiedwith (8.34), followed by Colleague Competition Level Satisfaction (7.28)and Colleague Qualifications Satisfaction (6.84) (Table 2). The satisfactionlevel concerning all the sub-factors except the above is observed to be 5-6,which reflects ‘undecidedness’. From the satisfaction dimensions point ofviews, this situation makes clear that employees are not very satisfied, but atthe same time, they do not have too many negative feelings, either.Therefore, this shows that improvements concerning these factors will havepositive effects on the general satisfaction level of employees.
According to the degree of importance determined by regressionanalyses, although satisfaction levels of different dimensions are not high, itis observed that the two factors that most seriously affect generalsatisfaction are Job Satisfaction and Professional Satisfaction. Since thesefactors have positive effects on general satisfaction levels of employees, theimprovements concerning these factors will cause increases on it. Thismeans that, from the relative importance point of view, priority should begiven to making improvements concerning these two factors.
Views on certain satisfaction aspects are observed to differ accordingto some organisational and situational variables as in many other studies.
This study has supported the findings (e.g. Howard and Frink, 1996;Robie et al., 1998) that some dimensions of employee satisfactionincrease as the level of job increases within an organisation hierarchy. Forinstance, the Other Work Group (Administrative Staff) Satisfaction level ofresearch assistants is lower than that of Professors. This result may beconsidered normal in the sample university conditions because those whoare professors mostly communicate with the administrative staff throughthe research assistants who help them to facilitate some administrative andacademic work such as the organisation of implementing the exams. Sincethe research assistants are transmitting some necessary informationbetween two groups, most of the educational staff, especially professors,do not need to communicate with the administrative staff directly. Theresearch assistants are needed to get involved and solve the problems withthe administrative staff so this gives them an opportunity to know themmore closely. Therefore, their satisfaction level may be lower than theprofessors’ in the same institution.
162
METU STUDIES IN DEVELOPMENT
As parallel with this result, it was found out that those who have acertain administrative responsibility within the institution are moresatisfied with the Working Environment, Institutional Job Satisfaction, andtheir General Satisfaction level is higher. These findings supported thoseof Howard and Frink (1996).
On the other hand, this research has presented that the opinions of theacademic staff working in the institution do not reflect serious differencesaccording to gender, age and seniority. There are only a few exceptions.For instance, a statistically significant relation is found only betweenSalary Satisfaction level and gender. According to this finding, women'ssalary satisfaction level is slightly lower than that of men’s. This resultseems to support the previous findings of the researches as well as that ofTang and Talpade (1999), who examined the sex differences in employeesatisfaction in a university in the USA and found out that males tended tohave higher satisfaction with pay than females.
Although one of the constant findings in job literature (Eichar et al.,1991; Judge and Watanabe, 1993; Beehr et al, 1994) is the positiverelation between age and satisfaction, this research could not findstatistically significant relations between the age of the academic staff andsatisfaction dimensions. However, as the age of employees declines, it isobserved that they are less satisfied with only Relations with FacultyManagement and Institutional Job Satisfaction. Therefore, their GeneralSatisfaction level is found to be lower. This can be suggestive of thehigher expectations of young academics compared to older ones.
As with all studies, the design of the current study is subject tolimitations. There are three basic limitations in the research: i) Period ofresearch: A change of top administration had taken place a short timebefore the collection of the research data. Every change in administrationnaturally brings about some changes in the existing status and in someadministrative strategies of the organisation. And usually, these changesare met with some resistance by the employees (Agocs, 1997). The factthat the field study of this research was done at such a period brings forththe risk that those who are not pleased by the changes and show resistancewould reflect their opinions and attitudes in their replies to the questionsof the study. Therefore, special attention should be paid while interpretingthe findings of the analyses. ii) Sample: The fact that only 191 peoplereplied and were included in the scope of the study although, at the time,the number of academic staff in the institution was 1415, necessitatescaution when making generalisations based on the findings. iii) Makinggeneralisations: At the beginning of the research, the intention was tomake some generalisations for state universities based on this universityexample. However, although it was thought that this institution couldreflect other state universities due to its long past and characteristics, whenconsidering that numerous new universities were established after 1990 as
163

Fatma KÜSKÜ
a result of various economic and political preferences, it would beincorrect to make generalisations using the findings of this study for allstate universities because of the peculiarities of the characteristics andculture of each organisation. Therefore, the generalisations made from thefindings would be more appropriate for the state universities establishedbefore the university boom of the early 1990s.
In spite of these limitations, this study has a notable strength. Itsprimary strength is that it had tapped a large literature on satisfaction acrossseveral disciplines, and had combined this with recent research on employeesatisfaction. The approach of the study has both theoretical and empiricalgrounding, and provides a good starting point for future study.
In conclusion, it should not be forgotten that employees would be moreproductive as long as they are satisfied with their jobs and the environmentthey work in. Therefore, instruments other than economic ones becomemajor factors encouraging productivity and efficiency in employees ininstitutions like universities where the economic satisfaction level is ratherlow in return for the work done and the efforts made. As a result,improvements concerning factors other than economic ones become veryimportant.
164

METU STUDIES IN DEVELOPMENT
Appendix A
Scales Used in the Study
General Satisfaction
1. I am generally satisfied working in this institution.2. I think I belong to this institution.3. On the whole, I think this institution is one of the best universities.4. I am proud when speaking about the university I work in.5. I advise other people to work in this institution.6. I would rather work in another state university.7. I would rather work in a private university.8. I whole-heartedly think that my future is in this institution.9. My family is happy that I work in this institution.
University Management (Administration) Satisfaction
1. I am very happy with those who have administrative positions at our university.2. The administrators at our university do not understand our problems and needs.3. Our university administrators generally do not consider our suggestions when
taking decisions.4. Our university administrators have the experience, knowledge and ability to help
the ITU reach its goals and objectives.5. We can easily reach the top administrators of the university when necessary.
Faculty Management (Administration) Satisfaction
1. I am generally satisfied with the administrators working in our faculty.2. Administrators of our faculty do not understand our problems and needs.3. Our faculty administrators generally do not consider our suggestions when
taking decisions.4. Our faculty administrators are generally hard to work with.5. I believe that my work gets the attention it deserves from my faculty
administrators.6. Our faculty administrators do not show the necessary interest in our problems.7. Our faculty administrators have the experience, knowledge and ability to help
the faculty reach its goals and objectives.8. We can easily reach the top administrators of the faculty when necessary.
Colleague Satisfaction
1. I am generally satisfied of my colleagues.2. I believe that the friendship relations in our institution are better than those in
other institutions.3. The co-operation among those working in our department is not sufficient.4. I believe that the co-operation among the academic staff in our department is
adequate.5. I do not believe that the academic staff in our department fulfils their
responsibilities to the best of their ability.6. I believe that the academic staff in our department devotes the adequate time to
their academic responsibilities.
165
Fatma KÜSKÜ
7. I do not think that the academic staff in our department devotes adequate time todevelop themselves.
8. I do not believe that the knowledge and skill of the academic staff in ourdepartment is adequate for the work they do.
9. I do not believe that the academic staff in our department has the qualificationsto compete with the staff of private universities.
10. I believe that the academic staff in our department has the qualifications tocompete with the staff of other state universities.
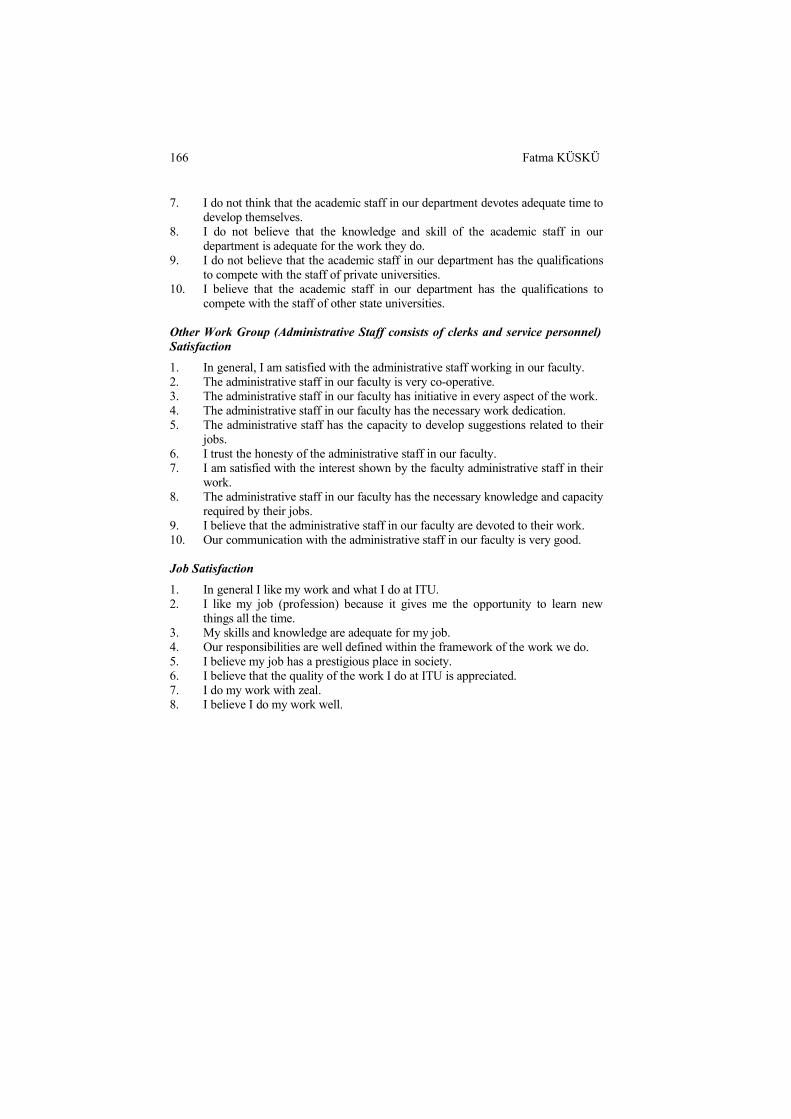
Other Work Group (Administrative Staff consists of clerks and service personnel)Satisfaction
1. In general, I am satisfied with the administrative staff working in our faculty.2. The administrative staff in our faculty is very co-operative.3. The administrative staff in our faculty has initiative in every aspect of the work.4. The administrative staff in our faculty has the necessary work dedication. 5. The administrative staff has the capacity to develop suggestions related to their
jobs.6. I trust the honesty of the administrative staff in our faculty.7. I am satisfied with the interest shown by the faculty administrative staff in their
work. 8. The administrative staff in our faculty has the necessary knowledge and capacity
required by their jobs.9. I believe that the administrative staff in our faculty are devoted to their work.10. Our communication with the administrative staff in our faculty is very good.
Job Satisfaction
1. In general I like my work and what I do at ITU.2. I like my job (profession) because it gives me the opportunity to learn new
things all the time.3. My skills and knowledge are adequate for my job.4. Our responsibilities are well defined within the framework of the work we do.5. I believe my job has a prestigious place in society.6. I believe that the quality of the work I do at ITU is appreciated.7. I do my work with zeal.8. I believe I do my work well.
166

METU STUDIES IN DEVELOPMENT
Physical Environment (Organisational Conditions) Satisfaction
1. The computer facilities in our faculty are adequate for our needs.2. We can use the computers in our faculty whenever we want.3. The laboratory facilities in our faculty are adequate for our needs.4. We can use the laboratory facilities in our faculty whenever we want.5. The periodicals and books in our faculty are adequate for us to pursue or work.6. The library hours are adequate.7. I think that the librarians have the knowledge and skills required to do their
work.8. The work environment in our faculty is safe.9. Our work area in the faculties is adequate in size, comfort and provides the
necessary work environment.10. Our canteen is clean and neat.11. The quality of the food in the canteen is good.12. I think that those who work in the canteen have the necessary skills and
meticulousness required.13. I am satisfied with the temperature of the work environment in winter and
summer.14. Our faculty is always clean.
Salary Satisfaction
1. Generally speaking, I am satisfied with my salary and other material benefits atITU.
2. I think that my salary is low in relation to the work I do.3. My salary is adequate for the work I do.
167
Fatma KÜSKÜ
Appendix B
General Characteristics of ParticipantsGeneral Characteristics
F % General Characteristics
Academic Position Professor Associate Professor Assistant Professor Lecturer Research Assistant Others
4536113
8412
23.618.85.81.6
44.06.2
Seniority in Position Average Standard Deviation Min Max Median Mod
6.56.30.5
43.05.01.0
Administrative Responsibility With Without
33158
17.382.7
Seniority in Organisation Average Standard Deviation Min Max Median Mod
11.6 9.20.5
43.08.06.0
Administrative Responsibility
Dean/ Vice-Dean. Head of School/ Assistant. Head of Department Other
3116
13
9.133.318.239.4
Seniority in AdministrativeResponsibility Average Standard Deviation Min Max Median Mod
4.24.40.5
20.03.01.0
Experience in AnotherOrganisation With Without
84107
44.056.0
Previous Institution A University at Home A University Abroad Private Sector Institution Government Institution Other
121343133
14.315.551.215.5
3.6Intention to Leave Considering Not considering
68123
35.664.4
Looking for a Job Actively Not actively
1553
22.177.9
Institution Intended State University Private University Government Institution Private Sector Organisation
225
-28
3.645.5
-50.9
168
METU STUDIES IN DEVELOPMENT
ReferencesAGOCS, C. (1997), “Institutionalised Resistance to Organisational Change: Denial,
Inaction and Repression”, Journal of Business Ethics, 16, 917-931. AHIRE, S. L., GOLHAR, D.Y. and WALLER, M. A. (1996), “Development and Validation
of TQM Implementation Constructs”, Decision Sciences, 27(1), 23-56.BASIK, F. O. (1997), “Eğitimde Toplam Kalitenin Yararları”, Önce Kalite Dergisi Eki-
Ödüllü Kalite Makaleleri, Ocak, 50-67. BAGOZZI, R. P.; YI, Y and PHILLIPS, L.W. (1991), “Assessing Construct Validity in
Organisational Research”, Administrative Science Quarterly, 36, 421-458.BECKER, T.E. and BILLINGS, R.S. (1993), “Profiles of Commitment: An Empirical Test”,
Journal of Organisational Behaviour, 14, 177-190. BEEHR, T. A., WEISBRODT, D.M. and ZAGUMNY, M.J. (1994), “Satisfaction With
Subordinates: A Neglected Research Issue Concerning Supervisors”,Journal of Applied Social Psychology, 24 (18), 1665-1684.
BLACK, S. A. and PORTER, L.J. (1996), “Identification of the Critical factors of TQM”,Decision Sciences, 27(1), 1-21.
BRENNAN, J. and SHAH, T. (2000), “Quality Assessment and Institutional Change:Experiences from 14 Countries”, Higher Education, 40, 331-349.
BRETT, F. J., CRON, W.L. and SLOCUM, JR. J.W. (1995), “Economic Dependency onWork: A Moderator of the Relationship Between OrganisationalCommitment and Performance”, Academy of Management Journal, 38 (1),261-271.
BRETZ, R. D., JR., BOUDREAU, J.W., and JUDGE, T.A. (1994), “Job Search Behaviors ofEmployeed Managers”, Personnel Psychology, 47, 275-301.
CAFOĞLU, Z. (1996), Eğitimde Toplam Kalite Yönetimi, Kalite Derneği, İstanbul.CHACKO, T. I. (1983), “Job and Life Satisfactions: A Causal Analysis of Their
Relationships”, Academy of Management Journal, 26 (1), 163-169.CHURCHILL, G.A., JR. (1979), “A Paradigm for Developing Better Measures of
Marketing Constructs”, Journal of Marketing Research, 16, 64-73 COATE, E. (1993), “The Introduction of Total Quality Management at Oregon State
University”, Higher Education, 25, 303-320.COWLES, D. and GILBREATH, G. (1993), Total Quality Management at Virginia
Commonwealth University: An Urban University Struggles with the Realitiesof TQM”, Higher Education, 25, 281-302.
CURRY, J.P., WAKEFIELD, D.S., PRICE, J.L. and MUELLER, C.W. (1986), “On the CausalOrdering of Job Satisfaction and Organisational Commitment”, Academy ofManagement Journal, 29, 847-858.
DORAN, L.I., STONE, V.K., BRIEF, A.P. and GEORGE, J.M. (1991), “Behavioral Intentionsas Predictors of Job Attitudes: The Role of Economic Choice”, Journal ofApplied Psychology, 76 (1), 40-45.
DWYER, D.J. and GANSTER, D.C. (1991), “The Effects of Job Demands and Control onEmployee Attendance and Satisfaction”, Journal of OrganisationalBehaviour, 12, 595-608.
EICHAR, D.M., NORLAND, S., BRADY, E.M. AND FORTINSKI, R.H. (1991), “The JobSatisfaction of Older Workers”, Journal of Organisational Behaviour, 12,609-620.
FLOWERS, V.S. and HUGHES, C.L. (1973), “Why Employee Stay”, Harvard BusinessReview, 51 (4), 49-60.
169

Fatma KÜSKÜ
FORGIONNE, G.A. and PETERS, V.E. (1982), “Differences in Job Motivation andSatisfaction Among Women and Men Managers”, Human Relations, 35,101-118.
GERBING, D. and ANDERSON, J. (1988), “An Updated Paradigm for Scale DevelopmentIncorporating Unidimensionality and its Assessment”, Journal of MarketingResearch, 25, 186-192.
GUMPORT, P.J. (2000), “Academic Restructuring: Organisational Change andInstitutional Imperatives”, Higher Education, 39, 67-91.
HACKMAN, J.R. and OLDHAM, G.R. (1975), Development of the Job Diagnostic Survey”,Journal of Applied Psychology, 60 (2), 159-170.
HERGUNER, G. and REEVES, N.B.R. (2000), “Going Against the National Cultural Grain:A Longitudional Case Study of Organisational Culture in Turkish HigherEducation”, Total Quality Management, 11(1), 45-56.
HOWARD, J.L. and FRINK, D.D. (1996), “The Effects of Organisational Restructure onEmployee Satisfaction”, Group and Organisation Management, 21 (3),278-303.
JENKINS, J. M. (1993), “Self-monitoring and Turnover: The Impact of Personality onIntent to Leave”, Journal of Organisational Behaviour, 14, 83-91.
JUDGE, T. A. (1993), “Does Affective Disposition Moderate the Relationship BetweenJob Satisfaction and Voluntary Turnover”, Journal of Applied Psychology,78 (3), 395-401.
JUDGE, T.A. and WATANABE, S. (1993), “Another Look at the Job Satisfaction-LifeSatisfaction Relationship”, Journal of Applied Psychology, 78 (6), 939-948.
KANJI, G.K. and TAMBI, A.M.B.A. (1999), “Total Quality Management in UK HigherEducation Institutions”, Total Quality Management, 10 (1), 129-153.
KÜSKÜ, F. and LEVENT, H. (1998), Devlet Üniversitelerinde Çalışan Tatmini: İ.T.Ü.Örneği, İstanbul Teknik Üniversitesi Araştırma Projesi.
LACY, F.J. and SHEEHAN, B.A. (1997), “Job Satisfaction Among Academic Staff: AnInternational Perspective”, Higher Education, 34(3), 305-322.
LASTOVICKA, J.L. and THAMODARAN, K. (1991), “Common Factor Score Estimates inMultiple Regression Problems”, Journal of Marketing Research, 28, 105-112.
LUTHANS, F. and STAJKOVIC, A.D. (1999), “Reinforce for Performance: The Need to GoBeyond Pay and Even Rewards”, The Academy of Management Executive,13 (2), 49-57.
MANGER, T. and EIKELAND, O. (1990), “Factors Predicting Staff’s Intentions to Leave inthe University”, Higher Education, 19, 281-291.
MATHIEU, J.E. (1991), “A Cross Level Nonrecursive Model of the Antecedents ofOrganisational Commitment and Satisfaction”, Journal of AppliedPsychology, 76 (5), 607-618.
MATHIEU, J.E. and FARR, J.L. (1991), “Further Evidence for the Discriminant Validityof Measures of Organisational Commitment, Job Involvement, and JobSatisfaction”, Journal of Applied Psychology, 76, 127-133.
MCFARLIN, D.B. and RICE, R.W. (1992), “The Role of Facet Importance as aModerator in Job Satisfaction Processes”, Journal of OrganisationalBehaviour, 13, 41-54.
MERGEN, E.; GRANT, D. and WIDRICK, S.M. (2000), “Quality Management Applied toHigher Education”, Total Quality Management, 11(3), 345-352.
170

METU STUDIES IN DEVELOPMENT
MOSES, I. (1986), “Promotion of Academic Staff”, Higher Education, 12, 35-47.MOSSHOLDER, K.W., BEDEIAN, A.G., and ARMENAKIS, A.A. (1981), “Role Perceptions,
Satisfaction, and Performance: Moderating Effects of Self–esteem andOrganisational Level”, Organisational Behaviour and HumanPerformance, 28, 224-234.
NUNNALLY, J., (1978), Psychometric Theory, New York: McGraw-Hill.PAVESIC, D.V. and BRYMER, R.A. (1990), “Job Satisfaction: What’s Happening to the
Young Managers?”, The Cornell H.R.A. Quarterly, February, 90-96.PEARSON, D.A. and SEILER, R.E. (1983), “Environmental Satisfiers in Academe”,
Higher Education, 12, 35-47.PETERSON, R.A. (1994), “A Meta-analysis of Cronbach's Coefficient Alpha”, Journal
of Consumer Research, 21, 381-391. RICE, R.W., GENTILE, D.A. and MCFARLIN, D.B. (1991), “Facet Importance and Job
Satisfaction”, Journal of Applied Psychology, 76 (1), 31-39. RIGGS, M.L. and KNIGHT, P. (1994), “The Impact of Group Success- Failure on
Motivational Beliefs and Attitudes: A Causal Model”, Journal of AppliedPsychology, 79 (5), 755-766.
ROBIE, C.; RYAN, A.M., SCHMIEDER, R.A., PARRA, L.F., and SMITH, P.C. (1998), “TheRelation Between Job Level and Job Satisfaction”, Group and OrganisationManagement, 23 (4), 470-495.
RUNYON, R.P., HABER, A., PITTENGER, D.J. and COLEMAN, K.A. (1996), Fundamentals ofBehavioural Statistics, Eighth Edition, New York: McGraw Hill.
SAATÇIOĞLU, Ö. (1996), “Orta Doğu Teknik Üniversitesi’nde Toplam Kalite YönetimiNasıl Geliştirilebilir”, 5. Ulusal Kalite Kongresi-Tebliğler, 406-416,
SCANDURA, T.A. and GRAEN, G.B. (1984), “Moderating Effects of Initial Leader –Member Exchange Status on the Effects of a Leadership intervention”,Journal of Applied Psychology, 79 (5), 755-766.
SCARPELLO, V. and VANDENBERG, R. (1992), “Generalising the Importance ofOccupational and Career Views to Job Satisfaction Attitudes”, Journal ofOrganisational Behaviour, 71, 579-584.
SEKARAN, U. (1983), “Methodological and Theoretical Issues and Advancements inCross-Cultural Research. Journal of International Business Studies, 14(Fall), 61-73.
SETHI, V. and KING, W.R. (1991), “Construct Measurement in Information SystemsResearch: An Illustration in Strategic Systems”, Decision Systems, 22, 455-473.
SITKIN, S.B.; SUTCLIFFE, K.M., and SCHROEDER, R.G. (1994), “Distinguishing Controlfrom Learning in Total Quality Management: A Contingency Perspective”,Academy of Management Review, 19,537-564.
SMITH, P.C., KENDALL, L.M. and HULIN, C.L. (1969), The Measurement of Satisfactionin Work and Retirement, Chicago: Rand McNally.
SMITH, D.B. and PLANT, W.T. (1982), “Sex Differences in the Job Satisfaction ofUniversity Professors”, Journal of Applied Psychology, 67, 249-251.
STAPLES, D.S. and HIGGINS, C.A. (1998), “A Study of the Impact of Factor ImportanceWeightings on Job Satisfaction Measures”, Journal of Business andPsychology, 13 (2), 211-232.
STEWART, D.W. (1981), “The Application and Misapplication of Factor Analysis inMarketing Research”, Journal of Marketing Research, 18(February), 51-62.
171
Fatma KÜSKÜ
TAIT, M.; PADGETT, M.Y. and BALDWIN, T.T. (1989), “Job and Life Satisfaction: AReexamination of the Strength of the Relationship and Gender Effects as aFunction of the Date of the Study, Journal of Applied Psychology, 74, 502-507.
TANG, T.LI-PING and TALPADE, M. (1999), “Sex Differences in Satisfaction With Payand Co-workers: Faculty and Staff at a Public Institution”, Public PersonnelManagement, 28 (3), 345-349.
TURBAN, D.B. and JONES, A.P. (1988), “Supervisor- Subordinate Similarity: Types,Effects, and Mechanism”, Journal of Applied Psychology, 73 (2), 228-234.
WALL, T.D. and PAYNE, R. (1973), “Are Deficiency Scores Deficient”, Journal ofApplied Psychology, 58 (3), 322-326.
WEIS, D.J., DAWIS, R.W., ENGLAND, G.W., and LOFQUIST, L.H. (1967), Manual for theMinnesota Satisfaction Questionnaire, Minneapolis: Industrial RelationCenter, University of Minnesota.
WILLIAMS, G. (1993), “Total Quality Management in Higher Education: Panacea orPlacebo”, Higher Education, 25, 227-229.
WITT, L.A. and BEOKERMEN, M.N. (1991), “Satisfaction With Initial Work Assignmentand Organisational Commitment”, Journal of Applied Social Psychology,21 (21), 1783-1792.
WITT, L.A. and NYE, L.G. (1992), “Gender and the Relationship Between PerceivedFairness of Pay or Promotion and Job Satisfaction”, Journal of AppliedPsychology, 77 (6), 910-917.
WRIGHT, T.A. and BONETT, D.G. (1992), “The Effect of Turnover on Work Satisfactionand Mental Health: Support for a Situational Perspective”, Journal ofOrganisational Behaviour, 13, 603-615.
172

METU STUDIES IN DEVELOPMENT
Özet
Çalışan memnuniyetinin boyutları: Bir devlet üniversitesi örneği
Bu araştırmanın temel amacı, devlet üniversitelerinde çalışan akademik personelinmemnuniyet düzeyini açıklamaktır. Bu araştırmada Türkiye’deki devlet üniversitelerininen eskilerinden ve en kurumsallaşmışlarından biri örnek olarak incelendi. Özgün bir soruformunun yanıtlanması yöntemi ile gerçekleştirilen araştırmaya 191 akademik personelkatıldı. Araştırmanın bulgularına göre, çeşitli boyutlardaki memnuniyet düzeyleri pekyüksek bulunmamakla beraber, katılımcılar en çok “Mesleklerinden” ve “KurumdaYaptıkları İşten” memnuniyet duymakta; bunları “Meslektaşların Rekabet SeviyesindenMemnuniyet” ve “Meslektaşla İlişkilerden Memnuniyet” izlemektedir. Bu boyutlar genelmemnuniyet düzeyi üzerinde olumlu etkilere sahip olduğundan, bu memnuniyetboyutlarındaki iyileştirmeler çalışanların genel memnuniyetlerinin artmasına yolaçacaktır. Bu araştırma ile, toplam kalite yönetiminin sağlanmasının önemli bir boyutuolan çalışanların memnuniyeti konusunda önemli bulgular elde edilmiş olup, böylecedevlet üniversitelerinde kalite yönetimi anlayışının benimsenmesine yönelik hazırlıklaraçısından önemli bir adım atılmış bulunmaktadır.
173