Embed Size (px)
Citation preview

1
Chronology of recent events2
On 4 September 1999 the results of the referendum of30 August were announced by UNAMET. Twenty-twopercent of the East Timorese registered to vote ac-cepted the Indonesian Government’s autonomy proposaland 78% were against it. A period of general violencefollowed until INTERFET troops were deployed in Dilion 20 September. The ICRC delegates were forced toleave East Timor on 6 September. On 14 Septembermost of the UNAMET staff had to evacuate their com-pound, taking with them the 1,300 refugees who hadfled there in the face of paramilitary attacks. Only 12staff members remained in the former Australian Em-bassy. On their arrival in Darwin, they reported that Diliwas totally destroyed and looted, with only the wallsleft standing. Two ICRC delegates returned the sameday.
The first peacekeeping units, numbering 1,190, arrivedin Dili. Within 24 hours a total of 2,300 were deployed.The ICRC was allowed to carry out a limited survey inDili town on 20 September, under the protection of the
TNI Army. The Dili General Hospital was intact but mostof the equipment had been looted or damaged. On thesame day, three engineers and technicians arrived, to-gether with other ICRC staff. On the 22nd, the ICRC de-cided to take over responsibility for the management ofthe hospital and established its headquarters on thepremises. On the same day, the engineers began theirinitial survey of the Dili water supply system.
Background
The city of Dili is located on an E-W coastal plain withthree major rivers flowing through it from the Guguleu-Milimanu mountain range. The older part of the town islocated on the eastern side. The main expansion of thetown has taken place to the west, where land has beenreclaimed from the Bemori river delta and in the airportarea, where some housing projects have been put up.
Figure 1 is a topographic map of the city3showing theurban areas and the limits of the districts. This maphas been used to generate the 3D model shown belowand to georeference the recent mosaic obtained from
Dili (East Timor)Re-establishing the water supply after the
events of September 1999
1 ICRC engineers involved in this context. Special thanks to Graham Jackson (UNTAET), to Paul Naylor (OXFAM), Peter Ruff (INTERFET), Edoardo X., P. Ribeiro and Joaquim MC. (WAET)2 For the chronology prior to the events see East Timor, The Price of Freedom, J.G. Taylor, Pluto press, 19993 Topographic map of Dili. Ministry of Interior, 1986
P. Jansen, J. Jones, P. kilchenmann, V. Meilhaut, D. Schmid, M. Weiersmueller1
Figure 1Topographic map of the town of Dili

2
aerial digital images.The newly built areas are easilyrecognised by comparing the boundaries of the urbanarea of the 1986 map with the recent digital aerial image.Figure 2 shows the new urbanised areas of western Dili,drawn over the georeferenced mosaic obtained from thegeomatic division of the Australian Army. Population es-timates for 1996, 1998 and according to a recent censuscarried out by UN OCHA/WFP in November 1999 andFebruary 2000 are given above in table I4 .
General situation of the water supplybefore the events6
The rivers are almost dry throughout the year and waterflows visibly toward the sea only during the rainy sea-son. Rivers and alluvial plains are fed by rainfall fromNovember to March with, on average, between 1,200and 1,500 mm/year. Rainfall is less in the northern ar-eas, with averages between 500 to 1,000 mm/y, increas-ing in the mountains to 2,000 mm/y. Rainfall patternswere affected by the El Niño phenomenon in 1997/98when a severe drought was observed.
The city of Dili is supplied from several sources: threewater treatment plants (WTP) collecting water from in-takes located uphill on the rivers Bemori, Bemos andBenemauk and from several boreholes scatteredthroughout the city which pump groundwater from thealluvial aquifers. Shallow wells equipped with handpumps are also used to tap into semi-confined aqui-fers. Figure 3 on the following page shows a 3D modelof the physiography, computed from the 50 m elevationiso-lines of the 1:50000 topographic maps of the city,where the main rivers are easily located.
District Population No. of connections
Comoro 21,200 249 Fatuhada/Kp.Alor 7,600 1,170 Bairo Pite 15,900 613 Colmera/Motael/ Vilaverde
15,800 588
Caicoli/Lecidere 5,700 77 Lahane/Timur/ Barat/Mascarenhas
17,400 439
Becora/Santa Cruz/Santana/Dili
36,900 855
Total 112,500 3,991
Table 1Population estimates, number of customers for several Dilisuburbs
Population5 1998: 156,488Population Feb. 2000: 138,777
Figure 2Expansion of the town since 1986
4 www.reliefweb.int5 Master plan water supply for Kota Dili, BPAM Dili6 Most of the data available on the situation prevailing before the events of September 1999were obtained from AUSAID reports and more detailed information can be found in thereferences listed in the footnotes.

3
The productivity of the main WTP is affected by theflow of the rivers and decreases significantly during thedry season. The boreholes are less affected by changesin rainfall and their productivity can be considered con-stant throughout the year, the rate of pumping of thedifferent bores representing only a small proportion ofthe natural and artificial discharge onto the coastal plain7.Besides the usual operating costs (chemicals, fast-running spares, etc.) only the unreliable power supplyis responsible for the decrease in productivity.
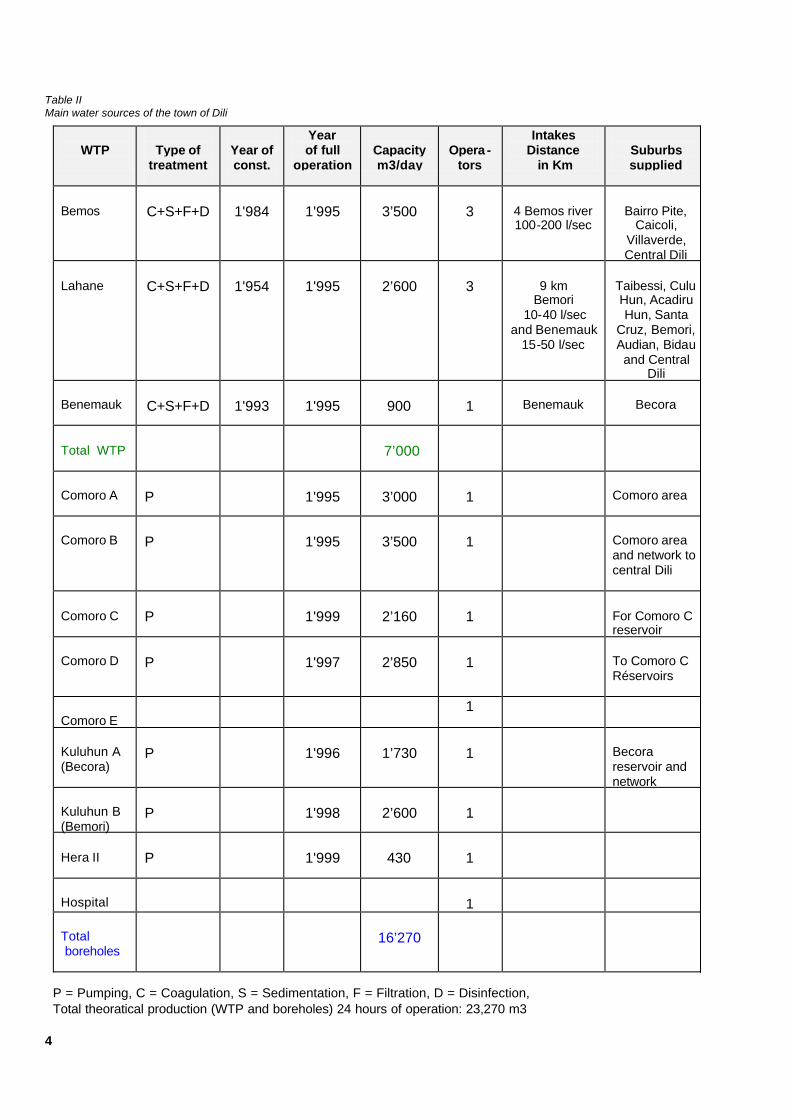
The water treatment plants treat the water in a conven-tional way: from the intake at the river the raw waterreaches the stations through steel transmission lines.To remove turbidity, coagulants are then added, the wa-ter is mixed and flocs are sedimented using upflow in-clined lamellar plates. The water is then filtered throughrapid sand filtration units, disinfected with the additionof chlorine and stored. Several dosing pumps add alu-minium sulphate and chlorine and filters are cleanedwith a backwash pump and air blowers. Two stations(Benemauk and Bemos) are compactly designed steelunits and Lahane is a conventional concrete one. Allthese stations were completely refurbished and recom-missioned in 1995 with funds from the Autralian Devel-opment Project. Table II on the following pagesummarises the main water sources of the town andalso shows the daily productivity in m3 of each unit,the year it became fully operational and the main areassupplied by the network.
The total theoretical capacity of all these facilities is up
to 23,000 m3/day. However, total production varies dur-ing the year and may change drastically during the dryseason. Data regarding monthly productivity of the dif-ferent sources are available from January to September19988 and suggest that this figure was never reached,even during the good months, such as January, when“only” 500,000 m3 were produced, representing an av-erage of roughly 16,000 m3/day. For the three WTPs,productivity is partially affected by rainfall. Most rainfallis received during the north-eastern monsoon from No-vember to March, in the wet season. According to datacollected from 1992 to 1995, given in figure 5, rainfall inDili varies from 840 mm/y to almost 2,000 mm/y and isclose to zero between May and the end of October.Heavy rainfall may also decrease production as land-slides can break the transmission lines for several daysat a time. A lack of chemicals can also result in aninterruption of the treatment process as turbidity in-creases significantly during heavy rains, with a conse-quent decrease in production.
Boreholes are not affected by variations in rainfall, asthe aquifer can tolerate a long-term withdrawal withinthe defined pumping capacities9. Most of the boreholessupply elevated storage reservoirs. To increase opera-tional efficiency and to supply the constantly expand-ing Comoro area, a new reservoir was built in 1994 witha capacity of 1,000 m3, served by the new Comoro Cwell. Comoro A and Comoro B were also connected toa newly rehabilitated storage reservoir of 1,000 m3 lo-cated at Bemos WTP, to improve distribution throughthe network and to increase pressure throughout thecity. Almost all the pumping stations were also rehabili-tated under the Australian project.
Figure 3Topographic 3D model of the city showing the main rivers and the location of the main water production facilities
7 Hydrogeology of Dili and Suai, ETWSS Project, L.W. Drury, Australian InternationalDevelopment Assistance Bureau and Government of Indonesia, September 19938 ETWSS Project: Dili water supply
9 Hydrogeology of Dili and Suai, ETWSS Project, L.W. Drury, Australian InternationalDevelopment Assistance Bureau and Government of Indonesia, September 1993
4
Table IIMain water sources of the town of Dili
WTP
Type of
treatment
Year of const.
Year of full
operation
Capacity m3/day
Opera -
tors
Intakes Distance in Km
Suburbs supplied
Bemos
C+S+F+D
1'984
1'995
3’500
3
4 Bemos river 100-200 l/sec
Bairro Pite,
Caicoli, Villaverde, Central Dili
Lahane
C+S+F+D
1'954
1'995
2’600
3
9 km
Bemori 10-40 l/sec
and Benemauk 15-50 l/sec
Taibessi, Culu Hun, Acadiru Hun, Santa
Cruz, Bemori, Audian, Bidau and Central
Dili Benemauk
C+S+F+D
1'993
1'995
900
1
Benemauk
Becora
Total WTP
7’000
Comoro A
P
1'995
3’000
1
Comoro area
Comoro B
P
1'995
3’500
1
Comoro area and network to central Dili
Comoro C
P
1'999
2’160
1
For Comoro C reservoir
Comoro D
P
1'997
2’850
1
To Comoro C Réservoirs
Comoro E
1
Kuluhun A (Becora)
P
1'996
1’730
1
Becora reservoir and network
Kuluhun B (Bemori)
P
1'998
2’600
1
Hera II
P
1'999
430
1
Hospital
1
Total boreholes
16’270
P = Pumping, C = Coagulation, S = Sedimentation, F = Filtration, D = Disinfection,Total theoratical production (WTP and boreholes) 24 hours of operation: 23,270 m3

5
Figure 4Dili urban water supply 1998 water production m3/month (Adapted from ETWSS project)
Figure 5Rainfall patterns in Dili
6
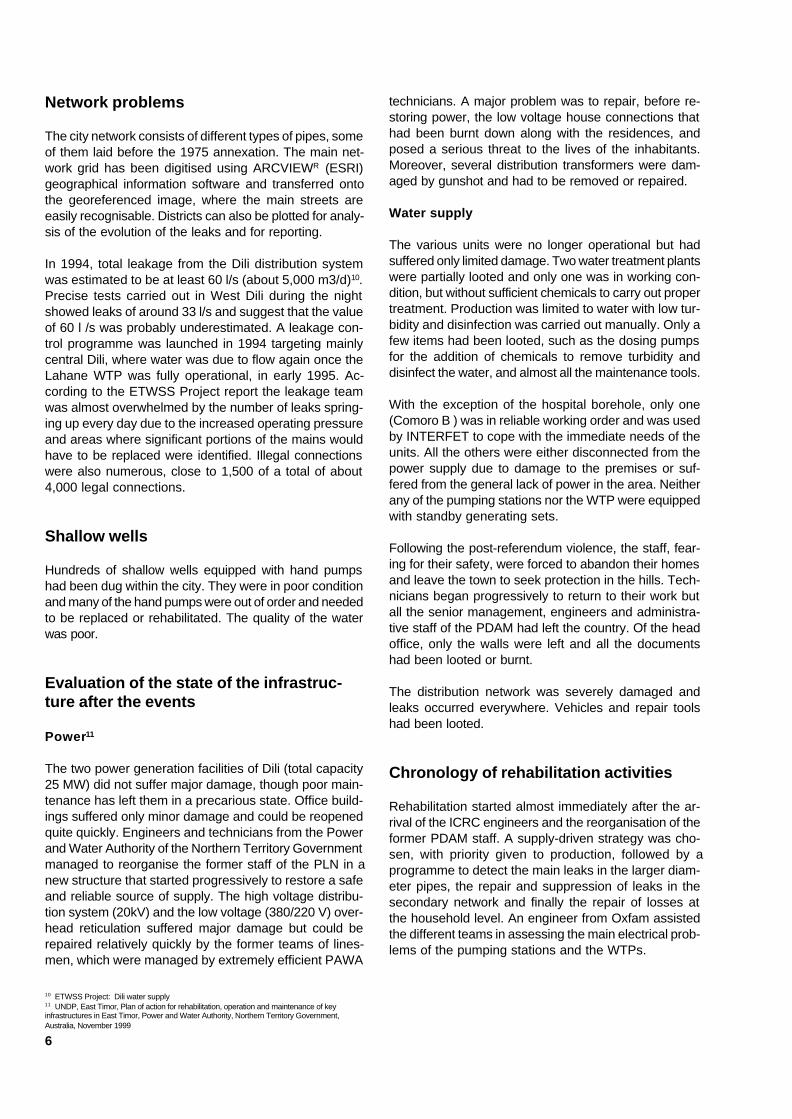
Network problems
The city network consists of different types of pipes, someof them laid before the 1975 annexation. The main net-work grid has been digitised using ARCVIEWR (ESRI)geographical information software and transferred ontothe georeferenced image, where the main streets areeasily recognisable. Districts can also be plotted for analy-sis of the evolution of the leaks and for reporting.
In 1994, total leakage from the Dili distribution systemwas estimated to be at least 60 l/s (about 5,000 m3/d)10.Precise tests carried out in West Dili during the nightshowed leaks of around 33 l/s and suggest that the valueof 60 l /s was probably underestimated. A leakage con-trol programme was launched in 1994 targeting mainlycentral Dili, where water was due to flow again once theLahane WTP was fully operational, in early 1995. Ac-cording to the ETWSS Project report the leakage teamwas almost overwhelmed by the number of leaks spring-ing up every day due to the increased operating pressureand areas where significant portions of the mains wouldhave to be replaced were identified. Illegal connectionswere also numerous, close to 1,500 of a total of about4,000 legal connections.
Shallow wells
Hundreds of shallow wells equipped with hand pumpshad been dug within the city. They were in poor conditionand many of the hand pumps were out of order and neededto be replaced or rehabilitated. The quality of the waterwas poor.
Evaluation of the state of the infrastruc-ture after the events
Power11
The two power generation facilities of Dili (total capacity25 MW) did not suffer major damage, though poor main-tenance has left them in a precarious state. Office build-ings suffered only minor damage and could be reopenedquite quickly. Engineers and technicians from the Powerand Water Authority of the Northern Territory Governmentmanaged to reorganise the former staff of the PLN in anew structure that started progressively to restore a safeand reliable source of supply. The high voltage distribu-tion system (20kV) and the low voltage (380/220 V) over-head reticulation suffered major damage but could berepaired relatively quickly by the former teams of lines-men, which were managed by extremely efficient PAWA
technicians. A major problem was to repair, before re-storing power, the low voltage house connections thathad been burnt down along with the residences, andposed a serious threat to the lives of the inhabitants.Moreover, several distribution transformers were dam-aged by gunshot and had to be removed or repaired.
Water supply
The various units were no longer operational but hadsuffered only limited damage. Two water treatment plantswere partially looted and only one was in working con-dition, but without sufficient chemicals to carry out propertreatment. Production was limited to water with low tur-bidity and disinfection was carried out manually. Only afew items had been looted, such as the dosing pumpsfor the addition of chemicals to remove turbidity anddisinfect the water, and almost all the maintenance tools.
With the exception of the hospital borehole, only one(Comoro B ) was in reliable working order and was usedby INTERFET to cope with the immediate needs of theunits. All the others were either disconnected from thepower supply due to damage to the premises or suf-fered from the general lack of power in the area. Neitherany of the pumping stations nor the WTP were equippedwith standby generating sets.
Following the post-referendum violence, the staff, fear-ing for their safety, were forced to abandon their homesand leave the town to seek protection in the hills. Tech-nicians began progressively to return to their work butall the senior management, engineers and administra-tive staff of the PDAM had left the country. Of the headoffice, only the walls were left and all the documentshad been looted or burnt.
The distribution network was severely damaged andleaks occurred everywhere. Vehicles and repair toolshad been looted.
Chronology of rehabilitation activities
Rehabilitation started almost immediately after the ar-rival of the ICRC engineers and the reorganisation of theformer PDAM staff. A supply-driven strategy was cho-sen, with priority given to production, followed by aprogramme to detect the main leaks in the larger diam-eter pipes, the repair and suppression of leaks in thesecondary network and finally the repair of losses atthe household level. An engineer from Oxfam assistedthe different teams in assessing the main electrical prob-lems of the pumping stations and the WTPs.
10 ETWSS Project: Dili water supply11 UNDP, East Timor, Plan of action for rehabilitation, operation and maintenance of keyinfrastructures in East Timor, Power and Water Authority, Northern Territory Government,Australia, November 1999

7
Between weeks 38 and 48, most of the water facilitieswere again operational, with only a few producing lessthan their design capacity. Figure 6 shows the chronol-ogy of the activities carried out to restore the watersupply to the city.
At the end of November, with the continuos support ofthe ICRC and, to some extent, of other NGOs, thereorganised water utility (PDAM) was in a stronger po-sition than it had been prior the events, in terms ofwater production.
Impressive achievements were made possible by therapid reorganisation of former PDAM technical person-nel through the establishment of a new temporaryorganisational structure, and the provision of continu-ous administrative and financial support to this struc-ture. The role of the engineers was mainly to set priori-ties regarding the tasks to be carried out, together withall the actors and particularly with the INTERFET liai-son officer, the electrical engineers of the Northern Ter-ritories and other NGOs, and to co-ordinate the effortsof all the participants. Two vehicles were made avail-able to PDAM teams, as were radio facilities that en-abled better co-ordination of the planned activities.
In early December, key flowmeters were installed andthe existing ones repaired, making it possible to quan-tify the improvements and to measure the performanceof the supply strategy that had been adopted. Data col-lection forms were introduced and daily water produc-tion recorded as an indicator of the performance of theutility. One motorbike was put at the disposal of PDAMfor this specific purpose.
Thirty MT of aluminium sulfate and 7 MT of HTH (hightitle hypochlorite) were procured to ensure adequate sup-plies for the continued operation of the Lahane, Bemosand Benemauk WTPs.
In order to re-establish customer contact PDAM be-gan, in early December, to inform the population aboutthe ongoing maintenance of the municipal water sys-tem by using loudhailers in localities directly affectedby maintenance work. At the same time, light rehabili-tation of the former PDAM offices was carried out toprovide at least a focal point to discuss issues of watersupply, leaks etc. with customers. The pump houseswere also repaired to allow attendants to carry out theirduties normally.
Figure 6Chronology of the rehabilitation of Dili’s water supply

8
In mid December, leak detection became more system-atic with the repair teams operating on a zone-by-zonebasis using motorbikes to improve co-ordination and fa-cilitate intervention on the network.
All the relevant documents held by the ICRC concerningthe water supply system of Dili were handed over toUNTAET, as well as the two motorbikes. The two pick-ups were returned to the ICRC.
At the end of January 2000, after lengthy negotiations,INTERFET agreed to return the Comoro B borehole forthe sole use of the public service and to shift its tankertrucks to Comoro E, which can only be used for thatpurpose. This will solve the current shortages in theFatuhada district of Dili.
With the arrival in Dili (week 48) of the UNTAET water co-ordinator, the issue of the hand-over of the ICRC’s re-sponsibility in the management and support of the PDAMwas raised. At the end of the year, PDAM was in a posi-tion to maintain the current standards of service provi-sion in a reasonably autonomous manner and the trans-fer of responsibilities was feasible. For organisational rea-sons the hand-over could not take place before the endof February, when UNTAET took over the payment of sala-ries.
Three 100 kVA stand-by gensets were installed by theICRC at the two Comoro borehole pumping stations (Band D) and one at Kuluhun B, to be used in case ofpower failure, and officially handed over to the water util-ity. The 50 kVA gensets belonging to PDAM were due tobe repaired and installed as back-up gensets at the twomain WTPs, to operate the dosing pumps and the back-wash pumps in case of power failure.
A letter of agreement was signed at the beginning of Marchbetween WAET (Water East Timor, the new designationof PDAM) and the ICRC. All the equipment procured (dos-ing pumps, tools, etc.) and the 21 MT of chemicals stillin the ICRC warehouses were transferred to the newlyrehabilitated WAET warehouse.
March 2000: end of ICRC involvement in the rehabilita-tion of the urban water supply.
Performance of the different waterfacilities
Water treatment stations
At the beginning of December most of the facilities wereequipped with metering systems and the operators weretrained to collect data and report them using the appro-priate forms. Of particular interest were the quantitiesproduced per day or per week in order to monitor theresults of the adopted supply strategy and to identifythe origin of any problems that might arise. Compari-son with previous data would allow the future manage-ment of the utility to take appropriate measures to im-prove production and define the future strategy.
In the next figure (figure 7) we have plotted the dailyproduction of the three WTS and in figure 9 the produc-tion of the main boreholes in operation from Decemberto end of February. Daily production records are of para-mount importance during this initial phase as they mayexplain why the outcomes were lower than expected.The causes of lower production could be a lack of power,problems in the main transmission lines because ofdamage, lack of chemicals to treat the water, or othercauses. Of particular interest is the decrease in pro-duction due to power failures. Information regarding theirfrequency and duration will allow the management todecide whether it is necessary to install stand-bygensets and to plan fuel consumption. Other informa-tion will help determine the amount of chemicals to pur-chase, which is essential to the continuity of distribu-tion.
For instance, production was almost down to zero atBemos during week 50. A landslide did occur 8 km up-stream from the plant and a 20 m section of the 10-inchmain steel transmission linking the intake works to theplant was damaged and had to be replaced. PDAM staffwere able to repair the damage and restore the normaldelivery of about 80 l/s of raw water to the plant withintwo days. In the meantime, the boreholes were able tomeet demand temporarily. The figures also show thatheavy rain can result in reduced production. Heavy rainincreases the turbidity of the water and alum must beadded to remove the suspended particles. Operatorsare instructed to start the dosing pumps when turbidityis higher than 20 NTU (nephelometric turbidity unit), aschlorination may be ineffective. If there is a power fail-ure the pumps cannot be operated and production mustbe stopped to avoid further problems in the distributionmains. The turbidity of the water is measured three timesa day in most of the plants and at least at Lahane WTP,where the operator is very well trained.

9
Figure 7 a, bDaily production at Lahane, Bemos and Benemauk WTPs in m3 from December to February

10
Figure 7 cDaily production at Lahane, Bemos and Benemauk WTPs in m3 from December to February
Evolution of NTU turbidityLahane WTP
0100
200300
400500
600
700
800
900
1000
01-12-
99
08-12-
99
15-12-
99
22-12-
99
29-12-
99
05-01-
00
12-01-
00
19-01-
00
26-01-
00
NTU
uni
ts
NTU 7 h NTU 12 h NTU 17 h
periods of aluminum sulfate adjonction
Figure 8Evolution of the turbidity of the raw water feeding Lahane WTS, due to rainfall

11
Data for December 1999 and January 2000 are reportedin figure 8 where the increase in turbidity due to theheavy rains is easily observed.
Peaks of turbidity levels higher than 100 NTU requiringthe use of alum were observed during roughly half ofthe month. Most of them resulted in only slight de-creases in production as power was fairly constantduring this month, chemicals were available and thedosing pumps were working. Significant drops in pro-duction are generally due to a combination of lack ofpower and heavy rains, but reports are not preciseenough to identify the origins of the problem. Only whenthe transmission line suffered heavy damage could theorigin of the drop be clearly identified.
Boreholes
The contribution of the different boreholes depends onthe productivity of the well and on the type of pumpinstalled. Production data from the beginning of thepumping operations are lacking. Results of the hydro-logical study carried out by Drury in 199312 showed thatthe aquifer could sustain pumping rates of up to 40 l/sec and even higher. Spare pumps were ordered beforethe events and were luckily found in the PDAM ware-house. New pumps were installed at Comoro A where
the old pump had failed due to normal wear just beforethe events, and at Kuluhun B. Most of the operationalcapacity of the boreholes was in fact resumed betweenweeks 38 and 44. Lacking data for the beginning of theoperation, we may assume that they were operating atfull capacity, i.e. at design capacity.
Data collected at Kuluhun A in November show that thiswas not really the case, the mean daily production of720 m3 ( 8.3 l/sec) being much lower than the normalcapacity of the well (20 l/sec). The results are presentedin figure 9. According to the data sheet, the boreholewas operated for 17 hours during the first 3 weeks,reaching 24 hours a day during the last week (meanproduction up to 14 l/sec), probably with some powerfailures, which would explain the “poor” results.
The quality of the water pumped from the undergroundis not affected by rainfall, at least as far as turbidity isconcerned. Treatment is less important as comparedto surface water. If disinfection through the addition ofchlorine is in principle recommended, particularly in anetwork where negative pressure may occur, disinfec-tion can be temporarily bypassed. In fact, the dosingpumps had been stolen from all the boreholes and dis-infection could not be carried out. However, this wouldnot affect production figures.
12 L.W. Drury, Hydrogeology of Dili and Suai, op.cit.
Figure 9Daily production at Kuluhn A borehole during November 1999
Kuluhun A daily production
0
200
400
600
800
1000
1200
1400
01.11
.00
03.11
.00
05.11
.00
07.11
.00
09.11
.00
11.11
.00
13.11
.00
15.11
.00
17.11
.00
19.11
.00
21.11
.00
23.11
.00
25.11
.00
27.11
.00
29.11
.00
m3 m3
24 h/day electricity ?
17 hours/day

12
Productivity then only depends on the reliability of thepower supply and on technical problems. Daily produc-tion of the different boreholes, from the data sheets col-lected at the beginning of December, is reported in figure10.
All the boreholes reached their design capacities andwere operating quite regularly. Any drops in productionwere due to power failures. Some of these failures werereported in the data sheets, as for Comoro B on 28January. Other drops are not reported very preciselybut are certainly also due to problems of power distribu-tion, but their importance in the overall production isminor.
Figure 10Daily production at Comoro A and B
Comoro B boreholeDaily production
0
1000
2000
3000
4000
5000
6000
01.12.
99
08.12.
99
15.12
.99
22.12.
99
29.12.
99
05.01
.00
12.01.
00
19.01.
00
26.01.
00
days
m3

13
Figure 10Daily production at Kuluhun A,B boreholes from December to February

14
Of particular interest at Comoro B are the amounts deliv-ered to INTERFET. This borehole was immediately op-erational and was used to cover the needs of the inter-vention force, which took control of the pumping stationand installed emergency equipment designed to treatwater in any condition. Despite the impressive set-up andthe queue of tanker trucks at the filling station, the quan-tities used by the army were quite small compared to thecapacity of the borehole. Out of a mean daily productionof about 4,500 m3 barely 500 m3/day were used, whichstill represented 25 tankers of 20 m3 each. At the end ofJanuary the borehole at Comoro E was ready to cover
these needs and INTERFET eventually shifted all itsequipment to the new location, leaving the full produc-tion of Comoro B for public purposes. By the end ofJanuary the consumption of the army was down to about100 m3/day, at least as far as tanking was concerned.
The production of the WTPs in April is given in figure 12.It is striking to notice that daily mean production de-creased slightly, from 3,074 to 2,978, for Lahane de-spite being affected by the rains, particularly at the endof the month, but dropped more significantly for Bemos,from 1,893 to 1,378 m3/day, also due to frequent rains,but certainly also because of power cuts.
INTERFET uses at Comoro B
0
1000
2000
3000
4000
5000
6000
01-01-
00
03-01-
00
05-01-
00
07-01-
00
09-01-
00
11-01-
00
13-01-
00
15-01-
00
17-01-
00
19-01-
00
21-01-
00
23-01-
00
25-01-
00
27-01-
00
29-01-
00
days
m3
Used by INTERFETTotal production power failure
12 hours
Figure 11Daily production at Comoro B and amounts used by INTERFET
Figure 12April 2000 daily production in m3 for Lahane WTP

15
The same cannot be said for the boreholes, as theyare less affected by rain. On the contrary, data showthat their production increased, probably because ofthe use of the standby gensets installed at Comoro
B,D and at Kuluhun B. At this last borehole there are nodata for about 17 days but it is not known if any waterwas produced or if they are lacking because the meterwas out of order.
Figure 12April 2000 daily production in m3 for Bemos WTP
Figure 13Daily production at Comoro A, B, and D

16
Interventions in the distribution network
A leak detection and suppression team was set up assoon as the network was put under pressure. Logisticsand tools were made available to carry out repairs onthe main transmission lines and to cap all the in-housedamaged connections. From the very beginning twoteams were established to cover East and West Dili.An impressive job was done to suppress all the leaksin the empty houses, due not only to damage but alsoto taps left running when the inhabitants were forced toflee to safety. Table III gives the type and number ofinterventions of the two teams.
About 542 house connections were suppressed fromthe time of the constitution of the teams until the be-ginning of December. Data for December are lackingbut the number of connections capped decreased to72 in January and probably decreased further in thefollowing months. At the very beginning of the opera-tion priority had to be given to the larger diameter pipesand to those near the ground surface. Leaks or dam-ages to the main distribution lines decreased from 77
in November to 60 in December and finally to 15 in Janu-ary. Leaks in the secondary distribution network de-creased from 35 to 18 but went up to 42 in January,probably due to an increase in the operating pressureof the network in some areas. It is anticipated that therewill continue to be a great deal of this type of activity infollowing months, particularly in some sectors wherewater will start to flow at higher pressure.
By the end of January, 444 metres had been removed.This last activity will continue in the following months.This is in accordance with the UNTAET’s intention tore-introduce nominal charges for utility services asquickly as possible, with new contracts and, certainly,disconnection in the event of non-payment. The first stepis then to disconnect, revise and re-establish a newconnection with a new contract and billing procedure.The latter is of main concern to UNTAET as it would bedifficult to introduce any billing system too soon, bear-ing in mind the poor economic situation of the majorityof the population and the lack of the usual high con-sumption customers, such as breweries, soda and softdrinks manufacturers, industries, etc., which generally
Figure 13Daily production at Kuluhun A and B in April 2000

17
bear most of the taxes. Expatriates, NGOs, hotels,institutions, etc. will probably be the main service pay-ers, but some sort of charges to all the customers willhave to be re-introduced soon, first to cover operatingcosts and, in the longer term, to allow WAET (WaterEast Timor) to become self-sufficient.
Water quality
Systematic control of water quality began only at theend of January. Oxfam took over this specific responsi-bility and trained several operators to measure residualchlorine and carry out bacteriological tests using a DelAgua portable incubator. As interest grew in the waterquality issue and to avoid any misinterpretation,UNTAET started to collect samples at a few samplingpoints at the end of February, checking residual chlo-rine and bacteriology at the WTPs’ storage reservoirs.Results were then published under the sole responsi-bility of UNTAET.
Chlorination was carried out using dosing pumps, ormanually in case of power failure. Consumption of HTHin Lahane was consistent with the residual chlorine mea-sured in the storage reservoir at the station. Figure 14
shows the consumption of HTH at Lahane for the first24 days of January. A total of 100 kg of HTH 70% wasused to disinfect 95,710 m3 of treated water with turbid-ity levels lower than 5 NTU.
If we disregard the chlorine demand this quantity corre-sponds to roughly 0.8 mg/l. Residual chlorine measuredat the station was between 0.6 and 0.8 mg/l and con-sistent with the dosage. However, punctual measure-ments carried out on 26 February at different samplingpoints in the town highlighted several problems. At BemosWTP the operator had to switch from automatic chlori-nation to manual, with water flowing without added chlo-rine for several hours, with consequent low levels of re-sidual chlorine – down to zero for the whole easternnetwork. Lahane WTP had to stop production due toproblems in the transmission lines. Resumption of pro-duction and chlorination showed a correct level of re-sidual chlorine at the WTP storage reservoir and alongone distribution line, with levels decreasing from 0.9 to0.2 mg/l, but almost no residual chlorine at collectionpoints downtown. At Benemauk manual chlorination alsohad a limited effect as residual chlorine was down to0.2 at the bridge collection point, disappearing a fewhundreds metres further down the main distribution line.The situation will certainly improve soon, when the dos-ing pumps and standby gensets will make it possibleto maintain regular disinfection.
At the beginning of May, the quantities of Aluminiumsulfate and HTH handed over to WAET (ex-PDAM) weresufficient to operate all the WTPs and boreholes for atleast three months, leaving UNTAET enough time toset up its own supply chain.
Shallow wells
In early December 1999, UNICEF completed a surveyof the shallow well situation in Dili. Eight hundred andfifty wells were surveyed in the district and a plan wasprepared to install new pumps and repair the existingones. The rehabilitation work was carried out by a teamof local technicians, with the assistance of internationalNGOs (Christian Children Fund and ACF – Actionagainst hunger) and by local NGOs. ICRC handed over150 hand pumps (Dragon of Singapore origin) to UNICEFand again later to ACF to avoid duplication of programmesand because its involvement in Dili was due to end.According to UNICEF, by mid March 493 hand pumpswere installed and a further 60 were ready by beginningof April.13
November 1999
December 1999
January 2000
Suppression of connection at empty houses
321 Dili East 221 Dili West
--
52
Leaks repaired
35
18
42
Distribution lines repaired
77
69
15
New connections
1 1 2
Removal of meters
-- -- 444
Table IIIType and number of interventions in the distribution network
1 5 9 13 17 21 25 29
days
2
2.5
3
3.5
4
4.5
5
5.5
Kg
of H
TH
/day
Chlorine HTH Kg/day
calculated on quantities used for batch preparation
Consumption of Chlorine as HTH (70% of av. Cl)
Figure 14Consumption of HTH (High title hypochlorite) in January atLahane WTP
13 UNICEF update 7.4.2000, Water and environmental sanitation. http://www.reliefweb.int/East Timor

18
Evolution of bloody and watery diarrhoeaWHO Weekly epidemiological bulletin
Dili (East Timor)
0
100
200
300
400
500
600
1 3 5 7 9 11
13
15
17
19
21
23
25
27
29
weeks
nb.
of c
ases
Series1 bloody diarrhoea Watery diarrhoea
Outbreaks of water-related diseases
Epidemiological data collected by WHO14 at the begin-ning of week 13 (reported in figure 15) showed an out-break of water-related diseases between week 14 (3-9.4.2000) and week 20 (15-21.5.2000), with the numberof cases increasing from about 100/week up to about500/week for watery diarrhoea and from a few to about100/week for bloody diarrhoea. The lack of previous datamakes it difficult to draw any conclusions as to the ori-gins of the outbreak, which was probably linked to theonset of the dry season.
Transitional organisation of former PDAMpersonnel
During the events all the middle and top management leftEast Timor. Out of 83 people only 45 remained in Dili, buthad to seek safety in the surrounding hills. As soon thesituation became more stable a few of them were locatedin the hills and convinced to return to town. In the follow-ing days other members of the technical staff reportedspontaneously to the former PDAM offices. The extent ofthe looting and the damages to the premises were con-siderable, with the exception of the main store, whichwas found intact. They were reorganised in a temporarystructure. A new simplified salary scale, based on theformer one, was set up and responsibilities defined ac-cording to individual ability. The ICRC agreed to cover thesalaries and manage the structure until a UN body wasable to take over. Of the former utility’s staff, only opera-tors and technicians were left, along with some unskilledworkers. Three main sectors of the system were definedin the new temporary structure:
Number of people• production at WTP, 14electrical installation and borehole 7operation• distribution, 16logistical support and warehousing 4• Several unskilled workers on atemporary basis
The organisational chart of the utility before the eventsis shown in figure 16. Some of the administrative posi-tions are not precisely defined but the entire left-handsection of the organisational chart, as well as all thedirectors, had left. When water distribution was resumed,only part of the technical staff (right side) could be lo-cated. By the end of September, almost all the formertechnicians and operators had been integrated into thenew structure, with the exception of the planning andpublic relations sections. Forty-three people were re-ported on the payroll in October for a total amount ofabout 18,580,000 IR (11,000 USD at an exchange rateof 1 USD = 7000 Indian Rupees) and the payment ofsalaries continued until end of February, when UNTAETwas organised to take over.
The temporary structure was quite simple, somewhatsimilar to the former one in order to avoid tensions amongpeople and facilitate the work of the new body takingover this activity. The definition of technical responsibili-ties and particularly those related to management wouldotherwise be quite difficult. The temporary job descrip-tion of the technical operators would certainly helpUNTAET at the beginning of the hand-over, but the en-tire management and administrative sections would haveto be rebuilt, with a large part devoted to the setting upof reporting and administrative procedures and, ofcourse, training.
The situation of the water supply in Diliat the end of April 2000
Despite the extensive destruction of the buildings anddespite the generalised looting observed in Dili duringthe events of September 1999, physical damage to thewater supply system can now be considered relativelyminor. ICRC engineers, in close co-ordination withINTERFET, Oxfam and with the technical personnel ofthe former water utility, were able to restore water pro-duction in a relatively short time, distributing water fromsome of the main sources already in early October 1999.The network was then progressively put under pressureas further facilities were restarted. At the same time, animpressive job was done by the teams repairing trans-mission lines and leaks, decreasing the losses due torunning taps, leakage and damaged pipelines. Lossesinto the ground could not be assessed but it is reason-able to assume that they were similar to what was ob-
Figure 15Evolution of bloody diarrhoea in Dili district
14 WHO Weekly epidemiological bulletin for East Timor, www.reliefweb.int/section East Timor

19
served before the events and probably over 50%. Theselosses are due to poor maintenance of an ageing net-work which will have to be replaced, particularly whereold materials were used.
Table IV gives a comparison between total productionprior to the events and that measured in December,January and April 2000. Even if the respective produc-tion rates in m3/day for 1998 are gross estimates (+/-100 m3/day) it is worthwhile to note that the levels ob-tained after the events are slightly higher than thoseextrapolated from monthly productions reported byETWSSP15.
A mean daily production of about 17,000 m3 can beobtained, with an important part produced by the bore-holes, equalling roughly 2/3 of the total production. Atthe end of March production at the boreholes was al-most unaffected by the frequent power failures as sev-eral of them were equipped with standby gensets, mak-ing it possible to switch over from the network when-ever the power was cut. Recent data show that theywere running at least 4-5 days/month, i.e. roughly 100hours and even more, maintaining production rates at“normal” levels. The evolution of the relative proportion
of the production of the boreholes compared to that ofthe WTPs is given in the next figure (figure 17) wherethe technical achievements during those early monthsare clearly visible.
Figure 16Organisational chart of the Water utility Adapted from BPAM Dili, Maret 1996
15 See quoted reference ....
janv
.98
aug.
98
dec.
99
janv
.00
apr.
00
WTP0
2000400060008000
100001200014000
mean m3/day
Production before and after the eventsBoreholes versus WTP
WTP Boreholes
Figure 17Comparison between the production of the boreholes andWTPs

20
Future challenges
With the present technical set-up and a minimum of man-agement it appears that it will be quite easy to maintainthese levels of productivity throughout the year. Despitethese achievements, obtained with the assistance of for-eign engineers, the technical level of the operators andtechnicians will have to be improved by means of trainingcourses and the appointment of several engineers ca-pable of managing the operation of the entire system andof planning future developments.
As previously outlined, the main task of UNTAET will beto rebuild the managerial section of the new water utilityand to try to achieve some sort of financial sustainability.This may take years as everything will have to be set up.The success of the supply-driven part of the overall op-eration was quite easy to achieve as is demonstrated bythe above-mentioned results. The difficult part of the op-eration is now beginning, as a demand-driven approachwill have to be adopted with programmes involving thepublic – and this may take quite a long time, certainlyyears.
The work carried out before the events in the frameworkof the ETWSS Project will have to be resumed andstrengthened but the context has changed. People willnot immediately be in a position to pay important chargesfor water (as well for electricity) as their economic situa-tion is precarious and will remain so for a while. Newapproaches will have to be tested and explained, as hasbeen done in other countries in similar situations16.
Lessons learnt
Luckily, damages to the water infrastructures were rela-tively minor. At the same time, the effects of the im-pressive work carried out before the events (funded byAUSAID) were not completely lost and the technicalstaff was in position to resume the majority of the nor-mal tasks needed to operate the systems. Access torelevant documents describing the system in detail,obtained from the previous co-operation between PDAMand AUSAID, facilitated the different interventions astechnical specifications about the stations, the bore-holes, the distribution systems and the capacities ofthe aquifer were readily available and did not have to beredone.
Having ensured a fairly reliable production covering theimmediate needs of the population, there was less pres-sure on the engineers and technicians and time couldbe devoted to a smooth hand-over. The relatively earlypresence at the rehabilitation stage of an organised body(UNTAET) to take over the management of the utilitymade the transition easier, five months after the events.Knowing that UNTAET was due to take over, care hadbeen taken to avoid setting up procedures that wouldcreate difficulties for the organisation in charge of thetemporary management of the utility and responsiblefor its future set-up and eventual sustainability.
If nobody had been ready to take over, the involvementof the ICRC or of any other actors more focused ontechnically oriented activities would have had to shifttowards the creation or strengthening of the institutionalmanagement of the utility and steps would have had tobe taken to prepare for such challenges.
Table IVMean daily production of the WTPs and boreholes before and after the events
Stations/ Boreholes
January 1998 mean m3/day
August 1998 mean
m3/day
December 1999 mean
m3/day
January 2000 mean
m3/day
April 2000 mean
m3/day
Lahane 1'000 1'666 3'180 3’074 2'978 Bemos 6'500 4'500 4'077 1'893 1'378
Comoro A
2'000 2'000 1'857 1'855 1'959
Comoro B 2'600 3'100 4'513 4'507 4'673 Comoro D 2'000 2'300 N.A. 2'253 2'733 Kuluhun A 1'300 1'000 1'128 1'131 961 Kuluhun B N.A. N.A. 2'257 2'707 855*
Total 15'400 14'566 17’0121 17’420 15’770** Data for 1998 from East Timor Water and Sanitation Project, April 1999 and WAET
(Water East Timor)
1 If Benemauk is included (1421 m3/d) total production reaches 18433 m3 Data for 1998 are from ETWS Project report (+/- 100 m3/day).* First 7 days the mean daily production was 2660 m3 and then technical problems occurred until 24th of the month** Including 233 m3 at Comoro E used for INTERFET needs
16 Lyonnaise des eaux, Water supply for low income communities