Embed Size (px)
Citation preview

Digitization of heritage collections as indicator of
innovation
by
Karol J. Borowiecki and Trilce Navarrete
Discussion Papers on Business and Economics
No. 14/2015
FURTHER INFORMATION
Department of Business and Economics
Faculty of Business and Social Sciences
University of Southern Denmark
Campusvej 55, DK-5230 Odense M
Denmark
E-mail: [email protected] / http://www.sdu.dk/ivoe
1
Digitization of heritage collections as indicator of innovation
By Karol J. Borowiecki and Trilce Navarrete
Karol Jan Borowiecki: Department of Business and Economics, University of Southern Denmark, Odense, Denmark. E-mail: [email protected] (corresponding author).
Trilce Navarrete: Department of Business and Economics, University of Southern Denmark, Odense, Denmark. E-mail: [email protected].
28th August 2015
Abstract
Heritage institutions house cultural and research content, which is the key source to stimulate innovation. Despite the potential, heritage collections are mostly inaccessible via digital mediums. We analyze the macro, meso and micro conditions of heritage organizations across Europe to identify the key determinants that foster innovation as reflected by the share of collection digitization and online publication. We find that organizations respond positively to an environment of high consumer digital literacy and sustainable resource allocation that enables slack, skilled staff and long-term strategic planning. Innovation is thus, in fact, enhanced by digital literacy from both producers as well as consumers.
JEL classification: O31, Z1
Key words: innovation; digitization; heritage collections; cultural institution

2
1. Introduction
It has been estimated that cultural and research content held in European memory institutions has a market value of €27 billion. This represents “the biggest single information content resource for the creation of value-added information content and services” (Jancic, 2015:4). It has been also estimated that 17% of heritage collections have been digitized (Stroeker and Vogels, 2014). Memory institutions have not been able to fully adopt the digital technology in order to become part of the information economy (Navarrete, 2014a). This innovation gap has received little attention while the social expectation of heritage content positioned within the information economy grows. Research has focused on the creative industries and their ability to innovate yet little is understood about the keepers of large information repositories made up of heritage collections.
Heritage organizations, particularly libraries, archives and museums, are the keepers of most cultural and research content. They are generally non-profit organizations driven by goals related to providing access to collections in order to facilitate knowledge creation (Bakhshi and Throsby, 2012). Increasing and improving access to collections is an important driver for these organizations to adopt new technologies. Digitization and publication of collections online can potentially allow access to content across the globe, and as such, liberate this untapped knowledge potential.
Since the 1990s, the European Commission has funded a number of projects to connect and give access to heritage materials in order to stimulate an innovative information society. Since the early 2000s, digitization of heritage collections became part of the key strategies that would contribute to the knowledge economy enabled by “unrestricted, sustainable and reliable digital access to Europe’s cultural and scientific knowledge” (OCW, 2004; Navarrete, 2014a:163). In 2007, a specific complementary Competitiveness and Innovation Program (CIP) was formed to fund the Information and Communication Policy Support Program, or ICT-PSP. Most recently, the Horizon 2020 framework (running from 2014 to 2020) aims at creating a genuine single market for knowledge, research and innovation. Content of memory institutions, including archives, libraries and museums, is essential in feeding a rich and diverse information infrastructure. All sectors benefit from the availability of creative content to innovate, as content creation and diffusion fuels adoption of new ideas across all sectors, expanding beyond the creative industries (Lee and Rodriguez-Pose, 2014). It could be argued that a content rich environment, fuelled by collections held in heritage organizations, support the formation of what Lee and Rodriguez-Pose (2014) refer to as genuine breeding grounds, key to creative cities and fundamental to drive innovation in all sectors.
To date, however, there is little known about the extent to which heritage organizations are able to innovate, or at least to adopt digital technology and increase access to collections. We argue that digitization and the publication of heritage collections online can be considered as a first indication of the organization’s ability to innovate in the creation of new heritage information services, expand audience reach or create new value for collections. We use data from the last ENUMERATE survey about the state of digital heritage in Europe,

3
gathered in 2013 from about 1,400 institutions in over 30 countries. We analyse this dataset for the first time quantitatively by running a number of regressions and by considering all domains involved (archives, libraries and museums). A previous qualitative analysis using an older dataset and focused only on Dutch museums finds a slow growth of digital collections and their publication due to a national policy that focuses on innovation but misses to support organizational change or skill development (Navarrete, 2014b). We contribute to the understanding of innovation by correlating institutional performance, including the presence of a digitization policy and skilled staff, with macro and meso indicators.
Using the level of digitization of collections as indication of innovation, we identify the organizations that are further in the adoption of digital technology and the potential determinants that support (or hinder) such behaviour. The key question is what determines an organization’s ability to innovate in order to meet the needs of the consumer in the information economy? In this way we hope to shed light on (digital) cultural consumption and to give policy recommendations that may assist facilitating an innovation environment for European heritage organizations. Furthermore, this research improves our understanding of heritage access across the European Member States and illuminates the extent of organizational innovation through the adoption of digital technologies.
Following the suggestion of Castañer and Campos (2002), we analyze the heritage institutions from a macro, meso and micro perspective. Among the most important positive determinants for innovation we find the level of digital literacy and level of education at national level (macro level), a historic familiarity with imaging (meso level) and the presence of a policy to guide digitization (micro level).
The remaining of this article is organized as follows. Section two presents the concept of innovation in organizations and introduces the macro, meso and micro framework of analysis. In section three we present the data and in section four the results. A discussion on the findings takes place in section five, to close with conclusions and policy implications in section six.
2. Innovation in organizations
According to Schumpeter (1947:153), organizations can “introduce technological novelties into the production of ‘old’ commodities” in order to improve their position in the market. Adoption of a new technology leads to innovation in the production process presenting first a widening pattern, in which many new firms enter the market with a similar use of technology, followed by a deepening pattern, in which a few large-budget institutions take a monopolistic role once technological change becomes predictable (Malerba and Orsenigo, 1995). Regarding the adoption of technological change, heritage institutions presented a widening innovation pattern in the 1990s when computers were adopted for collection management and again in the early 2000s when many organizations explored the use of the Internet. Navarrete (2014a) argues that heritage institutions have yet to fully adopt a digital work practice to enable them to innovate in the provision of heritage information services, to allow (re)use of

4
content. Innovation in the provision of information services was found in government institutions that responded to external stakeholders, while response to internal stakeholders was linked to innovation in information management processes (Wang and Feeney, 2014).
Innovation as result of adoption of technology by firms has been measured through inputs (e.g. R&D expenditure) and outputs (e.g. patents, innovative output) (Acs and Audretsch, 2005). Castañer and Campos (2002) argue that innovation output within cultural organizations can be observed in the creation of new content as well as in the form in which content is presented. More specifically, Bakhshi and Throsby (2012) identify innovation in audience reach, in art form development, in value creation and in business management and governance.
Innovation in form, or the provision of new heritage information services (the way in which consumers are able to interact with the content), can be observed in libraries, archives and museum institutions. Innovation takes place in the presentation of content, as collections are published online on the institutional website, various portals or other social media platforms (i.e. Flickr, Facebook, Wikipedia).1 This leads to innovation in audience reach, as institutions seek to position their collections where the users are, including the development of services online and onsite (e.g. interpretation materials using smart phones). Damanpour (1987) stresses the key role of consumers as endogenous factors in such service innovation by heritage organizations because, he argues, success is “contingent upon the joint efforts of the organization and its clients” (p.677). Innovation also takes place in the creation of new content, as new images are created (e.g. megapixel, 3D visualizations) and objects are placed within new contexts (e.g. thematic online exhibitions). This in turn leads to innovation in value creation, as heritage institutions reposition themselves in the online market of information and explore new business models to finance their activities (innovation in business management).
We consider digitization of collections and online publication, an indicator of the innovation potential in heritage institutions. That is, organizations that are able to adopt digital technology to change work practice internally, reflected by the level of digitized collections, will be able to innovate in the provision of heritage information services, starting with online publication of their content.
2.1 Macro analysis
According to Castañer and Campos (2002), the ability of a heritage organization to innovate can be analysed from a macro, meso or micro perspective. A macro approach considers the national context, including the availability of a national policy, regulations or general socio-economic conditions. Wealth (measured as GDP), population size and level of human capital (measured in the level of educational attainment) have been found to be determinants for innovation (Heilbrun, 2001; Pierce, 2000). Castañer and Campos (2002) question the level of education of consumers as a stimulus for innovation by heritage
1 Refer to Navarrete and Borowiecki (2015) for an investigation of how online publication of heritage content transforms patterns of traditional consumption.

5
organizations, and concert halls specifically, because, they argue, the general public has little influence on the programming, albeit their argument is not backed up quantitatively. Dimaggio and Stenberg (1985) find the role of patrons, instead of the general consumer, to influence innovation.
The role of consumers as trigger for innovation may increase in an online information market as producers respond to growing information literacy and increased online consumption. European archives, libraries and museums are increasingly joining alternative online publication spaces to reach the public (Stroeker and Vogels, 2014) - possibly in response to an increase in digital literacy of societies. In 2014, for instance, 64% of the population in Europe had access to the Internet via mobile broadband and 75% of the population used the Internet (ITU, 2014).
Geographic concentrations of innovation have been linked to the spillover found when knowledge is created and shared. That is, higher concentration of innovative activity is found in specific geographic locations where also the concentration of the stock of knowledge is greater (Acs and Audretsch, 2005; Borowiecki, 2013).
2.2 Meso analysis
Analysis of innovation can also consider a meso perspective. Dopfer (2012) argues for a mesoeconomic approach to capture the transitional change between the innovative idea of an entrepreneur (micro level) and its diffusion and implementation at the macro level. Following Schumpeter (1942) and his proposition that innovation is driven by an entrepreneur with a following of individuals, Dopfer proposes meso as a structure component and as a process component for analysis. A meso approach, he argues, can be used to refer to instances found within specific industries, sectors or technologies. Baumol (1968) discusses the role of the entrepreneur and further lays the ground for the development of a sector analysis, namely of the economics of culture with focus on the performing arts, as specific sector within the economy.
Castañer and Campos (2002) focus on the performing arts sector and identify source of funding as comparative determinant among organizations within the sector for the meso analysis.2 We chose, instead, to consider funding source as part of the micro level analysis, since our data allows us to disentangle funding sources at the institution level. The meso perspective is reflected by the three distinct domains: archives, libraries and museums. This is motivated by the fundamental differences across these domains, including characteristics in collection type, share of digitization and position in the market. All domains innovate in the way collections can be consumed, widening audiences, and creating additional value, though each domain has specialized in their approach to present content and to engage consumers. Appendix A provides an overview of some of these differences and outlines some recent trends for archives, libraries and museums.
2 On the issue of funding heritage institutions, and cultural consumption more in general, refer to Borowiecki and Navarrete (2015).

6
2.3 Micro analysis
A micro level of analysis on the ability to innovate considers size, age, and administrative and power structures of the organization (Castañer and Campos, 2002). Innovation and size of institution have been associated positively, where organizations with little restraint of resources have a greater ability to innovate (Castañer, 2014; Damanpour, 1987), particularly when holding a monopolistic position (Schumpeter, 1947). Innovation require a high fixed cost and it is a risky investment; therefore the success of innovation depend on economies of scale and scope for R&D, and benefits are related to the organization’s market power (Acs and Audretsch, 2005). Firms with organizational slack can absorb failure, can bear cost of adopting innovations, and can “explore new ideas in advance of an actual need” (Rosner, 1968:615). In certain industries, including those related to information technology and services, small enterprises have a greater ability to innovate because of their flexible, non-bureaucratic management structures, which place innovation at the core (Acs and Audretsch, 2005).
Technical complexity of an organization, reflected by specialized staff, has been found as positive determinant for technical innovation (Damanpour, 1987). However, organizations may also allocate resources to outsource specialized knowledge.
Empirical research on heritage organizations structures has identified the presence of multiple key goals, which can conflict when resources are limited or priorities are not clear. Theatres, for instance, may have a management with a managerial or an artistic background, the former being less inclined to innovate than the later (DiMaggio and Stenberg, 1985). Archives, libraries and museums also present multiple organizational goals related to giving access, preserving the collection and developing further value through research (Brokerhof, 2006).
3. Data
The European Commission ICT Policy Support Program funded ENUMERATE, a project to gather and analyse data on the state of digital heritage across Europe.3 We use results from the second survey that cover 2013 (ENUMERATE Core Survey II full dataset) including responses from 1,370 institutions from 35 countries. Digitization refers to collection objects that have been documented in a digital database and include a digital image. This dataset is the core of the micro and meso level analyses. Data on socio-demographic patterns in European countries – the core of our macro level variables, originate from the Eurostat statistics for 2013, the same year as the ENUMERATE dataset. We use GDP per capita, population size, and educational attainment (mid to high level of education for 15 to 64 years old) as macro indicators. We further use the Individual Use of Internet in 2013 variable for the macro analysis, obtained from ITU (2014). . Table 1 shows a summary. A total of 1,148 institutions report the
3 ENUMERATE: A European Survey for Statistical Intelligence on Digitization, Digital Preservation and Online Access to Cultural Heritage was funded under the CIP-ICT-PSP Program of Statistics on Culture, with a budget of €321,000 and coordinated in the UK. In 2014, ENUMERATE became part of Europeana (www.enumerate.eu).

7
share of digitization, which is equal on average to 17.3%. The available meso indicators are restricted to the domain of an institution.4
Some of the geographic differences with regard to digitization intensity found across European countries are visualized in Figure 1 (the darker the country, the higher the digitization of collections share). Malta reported the highest share of digitization, followed by Cyprus, Luxembourg, Macedonia, Greece, Austria, Spain, the Netherlands and the UK. France reported the lowest share of digitization.5
Multiple regression analysis was used to determine the relationships between share of digitization as dependent variable against several independent variables organized into macro, meso and micro groups. The data Appendix B provides a detailed list and description of the variables used.
4. Results
In this section we present the regression results. We developed models around three distinct themes: level of digitization, digitization policy and use of collections. The themes emerged from the preliminary analysis as key differentiation factors for the share of digitization and hence for the ability of European heritage institutions to innovate.
4.1 Level of digitization
For the first model (see Table 2), we regress the share of digitization as a function of sets of potential correlates. Column 1 presents a simple estimation, where the independent variables include digitization strategy, institutional budget (second order polynomial to allow for non-linear effects), total full-time employees (FTE), sector indicators and region controls (not reported). We extend the model by the share of specialized FTE in column 2, funding sources in column 3 and macro indicators in column 4. Column 5 provides the strongest and preferred specification where country and type of institution controls are included instead of the region controls or macro-level variables.
Throughout all specifications the most robust association is found with the digitization strategy variable. Heritage institutions that have a policy strategy for
4 Ideally, one would measure the meso dimension with the demand for a given institution or sector. For example, the number of users per country may play as indication of the 'need' of a certain sector offline. This type of information is however not consistently available for the large number of types of institutions and countries covered here. The European Bureau of Library, Information and Documentation Associations (EBLIDA) publishes yearly data on libraries while the European Group on Museum Statistics (EGMUS) publishes data on museums. Unfortunately, no comparable dataset is available from the archive. Therefore, we restrict our approach to controls for the sector and extend it in some cases to the specific type of institution. 5 It is important to note that the response rate per country varied. Response per country: Austria 36, Belgium 29, Bosnia and Herzegovina 1, Bulgaria 1, Cyprus 13, Czech Republic 34, Denmark 16, Estonia 16, Finland 59, France 2, Germany 279, Greece 10, Hungary 44, Iceland 38, Ireland 15, Italy 25, Latvia 4, Liechtenstein 1, Lithuania 61, Luxembourg 15, Malta 2, Monaco 1, Netherlands 143, Poland 23, Portugal 44, Republic of Macedonia 1, Republic of Moldova 1, Romania 1, Slovak Republic 4, Slovenia 57, Spain 180, Sweden 125, Switzerland 23, United Kingdom 55. By including later country fixed effects in some regressions, we account econometrically for the international differences in the response rates.

8
digital activities have digitized between 6.3 and 6.9 percent of their collections more. Alternatively, since we look here at correlation-coefficients only, it could be the case that institutions that digitise more, have the incentive to define a digitization strategy; this direction of the effect is however less likely and cannot be repeated (i.e. once the digitization strategy is defined, introducing another strategy is not possible).
Similar strong correlations are found with the budget variables: wealthier institutions digitize more, however at a decreasing rate. The size of the workforce is negatively related with digitization share if one accounts for the share of specialized employees. The association with FTE is however rather small. These two coefficients compared indicate that size of institution is possibly less important than the slack available to innovate.
The correlation coefficient for the share of specialized workers is positive and quite large, albeit outside the usual confidence intervals. There is no statistically significant difference between archives and libraries, while museums digitize about 11.5 percent more.6 The set of variables on the funding source do not deliver any significant correlations (not reported), implying that funding source may have a minimal impact on the digitization intensity.
Institutions in countries with greater population are found to digitize less. The correlation is however positive for the share of population with mid- or high-educational attainment. This may suggest that countries with a higher level of education are more capable of adopting the digital technology and hence innovate. Wealth of a country and average personal access to the Internet do not exhibit any significant relation to the share of heritage digitization.
Countries were grouped in regions for the first model. West and South Europe are the regions with the highest share of the collections digitized, followed by the South East region, the British Isles, and the Nordic countries. The East region reported the lowest share of digitization.
Finally, we perform a range of robustness check, including tests where we control for countries participating as partners in the ENUMERATE consortium (i.e., Austria, Belgium, France, Germany, Hungary, the Netherlands, Slovenia, Spain, and the UK). One could worry that the ENUMERATE partners are particularly well connected to cultural institutions in their countries that exhibit unusually high digitization rates. The results shown in Appendix C (Table C.2) indicate that this is not the case.
4.2 Digitization policy and costs
The previously disclosed remarkably strong association with the presence of a digitization strategy is interesting and raises the question on the role of internal policies in general. In a second set of models, we shed light on the correlates of three different policy types, the cost of digitization and success of online publication. The institutions surveyed reported whether they have implemented
6 The set of controls for type of institution indicate that art museums have by far the highest share of digitization while national libraries are on the other side of the spectrum. These coefficients are presented in detail in Table C.1 in Appendix C.

9
a general digitization strategy, a policy of use of digital collections, and a digitization preservation strategy to ensure long-term access to the digital heritage materials.7 Figure 2 shows a histogram of digitization success (left vertical axis) and gives an overview of the relation between digitization of collections and the implementation of various policies (right vertical axis). The histogram suggests a right-skewed distribution: about 12% of institutions have not digitized anything, around 4% of institutions have digitized ca. 15% of their collections and the share of digitization decreases across the density graph. The presence of any of the three policies has the opposite relationship with digitization practise. Approximately three out of ten institutions that have digitized very little (or nothing) have one of these policies. The presence of a policy is more likely in institutions that digitize a lot, reaching around 60% of institutions. It is interesting to observe that a significant share of institutions that do not digitize (much) have a digitization policy, while there exist also a meaningful share of institutions that digitize heavily that do not have any policy. This may suggest that having a digitization policy is not a necessity for digitization success, however it may be highly beneficial. Furthermore, interesting differences across the three policies are detected: The least volatile of the three is found to be the digitization preservation strategy; much steeper are the policy use and digitization strategy indicators and the suggested association with share of digitization is much more explicit. These results suggest that policy is a reasonably strong correlate of digitization, and may be seen as indication of a mature digital work practice, hence an indicator of higher ability to innovate.
The association between the policy variables is exploited further in more robust models that include many of the previously introduced control variables. The results are shown in column 1 of Table 3. As disclosed in Figure 2, the association between digitization strategy and digital preservation strategy or policy use are positive and significant. Positive coefficients are found also for the share of digitization or the share of employees specialized on digitization. We further explore the cost dimension related to digitization of new content. Institutions reported on the percentage of incidental costs, that are related to the initial creation or acquisition of a digital collection, as opposed to structural costs used for ongoing maintenance of the digital collection. In column 2 of Table 3 we conduct the analysis by regressing incidental cost on our set of control variables. We find strong negative coefficients for both the policy on use of digital materials and on the preservation strategy. This suggests that institutions with a clear strategy or policy use are more advanced in their adoption of a digital work practice. This result is reinforced by the negative coefficient found on the specialized FTE. Employment of specialized employees is shown to decrease the cost of digitization. Museums in general report the lowest share of incidental costs followed by archives (full set of coefficients reported in Table C.3 in
7 Institutions were asked whether they had a written policy endorsed by the management of the organization that a) set a strategy for digitization; b) set conditions for specific types of use of the digital heritage collections; and c) set a strategy for the digital preservation and permanent access to the digital collections. These three documents form the Information Plan which roughly establish how will ICT support the organizational mission and goals, how will digitization be realized (i.e. selection and prioritization, production format), what services will be provided (i.e. access policy, licensing, crowdsourcing), and how will these services be ensured in the long-term (sustainability).

10
Appendix C). This may be a reflection of the large incidental funds available to libraries to digitize their collections (e.g. through Google), reported at 34% higher than museums and 30% higher than archives.
Finally, we turn to an analysis of the online publication activity. The variable provided by ENUMERATE is expressed as the share of online disseminated material (e.g. publication through own website, portal, an aggregator, Wikipedia, social media or other channels). A descriptive overview of the online publication rates in Europe is presented in Figure 3, while column 3 in Table 3 report the correlates for online publication. The significant (and positive) associations disclosed are with the share of digitization and, perhaps more interestingly, with personal Internet use in a country. Societies that exhibit higher Internet access rates per capita can possibly also better use the online resources published by heritage institutions – this may create a strong incentive for the institutions to publish online.8
4.3 Use of collections
Next, we move our focus to the user of digital material and develop a model where we explore the relationship between digitization and type of user of the digital collections. The used data provides information on the institutional level of importance of a certain type of users – the implemented scale is between one (the least important) and ten (the most important). The categories of users are grouped by ENUMERATE into academic research, creative reuse, educational use, commemorative use, personal enjoyment, preservation, commercial use and other type of use. Table 4 summarises the findings (full set of coefficients is reported in Table C.4 in Appendix C).
Analysis of the type of use shows that the academic researcher has a significant positive relation to the presence of a digitization strategy, as well as to higher education libraries and large organizations publishing collections. A negative coefficient is found in relation to Internet access. This may suggests that academic use of digital collections is directly linked to large universities who serve, also, as providers of Internet. Academic use is of lower importance for audio-visual archives, film institutes, entnographic museums and public libraries, again possibly supporting the link to digitization projects in large universities. Also countries with a larger population report a lower academic use. Surprisingly, there is a negative coefficient found on the level of education share and academic use of collections. One possibility is that the overall educational attainment found in a country does not necessary reflect the societies’ involvement in academic activity; however, this may be pointing to additional unobserved variables.
Regarding the macro indicators, GDP per capita result in a significant negative coefficient for creative, preservation and commercial use of heritage collections, while the coefficient is significantly positive for educational use. This may
8 Museums reported the lowest share of online publication of digital materials followed by archives. Regional differences were found where South Europe reported the highest publication of collections, followed by East, South East and West Europe. Central Europe seems to lay behind publication of collections online. See Table C.3 in Appendix C for details.
11
suggest that wealthy countries support the educational mandate of heritage institutions but have yet to discover potential alternative uses, perhaps due to unobservable causes (e.g. licensing and copyright issues). A general negative relation is found between the population size and use of heritage collections. This complements the result from model 1 where higher populated countries are found to exhibit a lower digitization share, which may suggest a general lower digital activity.
Regarding the type of materials used by the various user groups we find that archives are strongly associated with commemorative and preservation use, while there is a negative relation to personal enjoyment and commercial use. Libraries value higher academic research, preservation and commemorative use, but not commercial or personal enjoyment use. Museum collections are also linked to preservation and commemorative use, though natural and science collections have a negative coefficient on commemorative use. It is not surprising that historic use is associated to art, history and ethnographic museum collections only. There is also a negative relation to commercial use, which may indicate that efforts to privatize museums (or perhaps to operate them efficiently), are not particularly successful in Europe. Audiovisual and film collections are associated with commercial use but not with academic use. Performing arts collections are associated with academic research and educational use but also with preservation use.
Linking funding source and type of use reveals certain patterns of digitization related projects. Internal funds are highly associated with preservation use, while national and regional public funds are associated to academic research, creative use, commemorative use, personal enjoyment and commercial use. Private and public partnerships are associated with personal enjoyment and result in a significant negative coefficient for commercial use. This is surprising as private funds are positively associated to commercial use, as are funds raised through sale of digital products.
5. Discussion
5.1 Discussion macro perspective
From our results on the three models we can conclude that macro determinants are related to the innovation ability of heritage institutions. The most important positive determinants to foster innovation are level of education of a country (model 1) and personal access to the Internet (model 2). The later takes place, however, indirectly: a greater digital literacy in a country has a strong positive relation to the share of collections published online. This would suggest that the innovation potential of heritage institutions currently depends more on the national educational development and culture to adopt the digital and less on the wealth of a country. After all, digitization technology is available and is not necessary very costly; what is possibly of greater importance is the willingness (and possibly ability) of a society to implement and use digital heritage material. Countries with a higher GDP report a higher allocation of incidental costs towards digital activities, which may indicate a transition to the digital work practice. This tends to result in a lower presence of a policy (results from our model 2 on digitization policy) and therefore we expect a lower total digitization
12
output. From our model 1 on level of digitization, however, there is no significant relationship between GDP and level of digitization. This may suggest that wealthier countries are starting to support the switch to a digital work practice in heritage institutions, though results are not yet visible, since contents have been identified as highly valuable. This supports the claim that heritage institutions have yet to become digital (Navarrete, 2014a).
A positive significant relation was found between countries with a higher GDP per capita and educational use of heritage collections, while a negative relationship was found for preservation, creative and commercial use. This could suggest that wealthier countries favour an arm’s length policy towards digitization of heritage institutions, which has thus far hindered innovation (reflected in a lower digitization share and lower online publication) as institutions lack structural funds, a digital strategy and attention for preservation. This is not to suggest that public funding encourages innovation but it does point to the need for structural funds to build a digital information infrastructure to serve as springboard from which heritage institutions can innovate.
Having funds available towards digital activities is thus not enough to innovate: resources must be properly allocated towards sustainable solutions, as further suggested from our model 3. We find that digitization of collections funded by national and private governments are not used for preservation but are used for creative and commercial use, suggesting a funding priority for projects that foster further independence from government funds to satisfy an immediate market. Private-public initiatives, on the other hand, appear to strongly disfavour commercial use of digitized collections but do support personal enjoyment suggesting a preference for a heritage rich information environment. Favouring creative reuse and personal enjoyment use of collections indicates an environment conductive of creative industries, prevalent in Nordic Europe and the British Isles.
Countries with a larger population appear less able to support digital literacy and innovation. That is, not only is the share of digitized collections smaller but there is also a lower use of the available materials. Innovation is also somewhat affected by education level. Countries with a higher level of education report a significantly higher share of digitization (model 1) and at the same time a significant but slightly lower presence of a digitization strategy (model 2).
Finally, countries with a higher personal use of the Internet appear more conducive to innovation as the share of the digitized collections published online is found to be significantly higher. It can be expected that as the level of Internet literacy becomes increasingly part of the general level of education, the combined new human capital indicator will influence innovation. Further, as online markets blur boundaries between producer and consumer, it can be expected that heritage institutions will increasingly benefit from an environment with a higher human capital (measured by level of educational attainment and Internet literacy) and this may translate into a particularly rich contextualization of heritage collections online.
5.2 Discussion meso perspective

13
Our results from the three models indicate that the three heritage sector domains (archives, libraries and museums) have distinct approaches towards adopting a digital work practice and hence innovation. This may be due to the fundamental difference in the type of collections and organizational goals, but may also relate to the different historical developmental paths of the domains.
Archives reported the lowest share of digitization and of publication of their holdings. This result may be explained by the complex institutional nature, which is identified as the gap between e-government policies and practice (Barata, 2004), as well as by an increased availability of genealogy Internet sites that provide alternative data rich information services (Yakel, 2004). Archives, in contrast to libraries and museums, do not have a history of guiding policy based on benchmarked use of collections, but are based instead on providing access and therefore do not account for share of collection used. This may change with the growing awareness of personalized access to information rights and through international coordinated efforts to gather data. Collections from the national archives are strongly related to preservation and commemorative use, presumably linked to official and government-related activities. Though archival collections have started to innovate in content publication platforms such as social media (e.g. Flickr), statistics reflect still a limited market share.
Libraries report by far the largest share of online publication of collections, from what they have digitized (available as surrogate), and yet this constitutes a relatively small share of their vast collections. The share digitized is expected nonetheless to increase, given the involvement of libraries in mass digitization projects, which focus on the scanning of books, with online publication as part of the digitization process. Library collections are strongly associated with preservation use, suggesting that the general use of collections involves older material in the public domain.
Museums, particularly of art and history, have a long tradition of working with images. It is therefore not surprising that art museums rank the highest in digitization share. This is because digitization is defined as a digital record of an object with an image. Libraries, though they may have a more comprehensive digital catalogue of their holdings, rarely have all their objects digitized (available as digital surrogate).
One important finding is that, even though art museums report the highest share of digitization and presence of a digitization strategy, they inversely reported the lowest share of online publication. This indicates the presence of unobserved variables that inhibit dissemination on the Internet. One inhibiting factor may be related to issues of copyright, cost related to license clearance or a lack of understanding of the online legal framework.
Another challenge, encountered in some countries, may relate to the fear of museums losing income from visitor entrance fees. However, the fear of cannibalisation after publishing collections online is being increasingly challenged empirically. For example, Bakhshi and Throsby (2014) show that digital publication (live broadcasting of theatre to digital cinema) does not substitute for traditional performance.

14
5.3 Discussion micro perspective
The key determinants for innovation at micro level were found to be slack, specialized staff and the presence of a digitization policy.
Organizations with a large budget were found to have a greater share of digitization yet not when they have a particularly large staff. This supports the expectation that larger institutions may be inflexible or too bureaucratic to allow innovation (Acs and Audretsch, 1990). Our result is in line with previous findings that differentiate general size of an institution and its unused resources that can be positioned towards other activities, to influence innovation. Specialized staff was found to directly influence the share of digitization, supporting previous findings that identified technical complexity of an organization as a positive determinant for innovation (Damanpour, 1987). Specialized staff had further a negative relation to incidental costs reflecting maturity in their adoption of a digital work practice and ability to innovate.
Unlike expected, adoption of digital technology in heritage institutions across Europe is still in the widening pattern, as described by Malerba and Orsenigo (1996). That is, we do not observe large institutions having a higher portion of their collections digitized, which would indicate a deepening pattern with concentration of innovative activities. Instead, we observe there are many organizations still adopting the technology and gradually changing their work practice. This is in line with Stroeker and Vogels (2014) who report 53% of institutions being involved with costs related to the adoption of a digital work practice.
Organizations with a digitization strategy were found to have a larger share of their collections digitized. It can be argued that technical complexity is reflected in an organization’s ability to develop multiple specialized digital policies. We could then argue that organizations that have a long-term strategy for digital collection use, or a preservation policy, have a higher understanding of the digital work practice and hence higher ability to innovate. In our analysis we identify organizational interest to serve multiple user groups, which may reflect the presence of multiple organizational goals. While film institutes report a higher commercial use of their collections, performing arts collections are used educationally, archives and libraries focus on preservation while museums of art report the highest creative use. This indicates that institutions have a different understanding of the potential of adopting a digital work practice, as found by Navarrete (2014a), and therefore they focus their efforts on innovation solutions to serve a specific user group. The extent to which these alternative organizational goals compete for resources is not clear from our data - we can only observe a choice in innovation strategy.
6. Conclusions
Adoption of a digital work practice has become the essential first step for organizations wanting to innovate in the current information economy. Much attention has been given to the great force of the creative industry as drivers for innovation. Little is known, however, about the keepers and providers of the vast heritage and scientific holdings that serve to feed innovation. These heritage

15
institutions, mostly publicly funded, appear to lag behind the digital transformation resulting in a great social loss.
Using data from the European ENUMERATE project, we analyze the extent to which heritage organizations have adopted a digital work practice, reflected in the share of collections digitized and published online, as indication of their ability to innovate. We have analyzed the digitization of heritage collections across a large sample of European organizations from a macro, meso and micro perspective. Such analysis may server to inform the needs of institutions (micro level) from specific domains (meso level) within a national policy (macro level).
We find that there is a gap between the macro environment and the heritage sector to foster innovation. While the macro trend to foster digitization supports an independence of funds to satisfy an immediate market, micro determinants that enhance digitization rely on structural funds to develop long-term strategies. We also find domain characteristics of behaviour that, if shared, could benefit the entire heritage sector. While museums have a large share of digitized collections, libraries have a higher online publication. Though it is not possible to argue for causality, it is clear that online availability of information enhances literacy, reuse and innovation.
We therefore argue for a revision of the national and institutional approaches to digitization where more attention is to be given to building a common infrastructure, across domains, from which all organizations can innovate. This requires sustainable funding to allow organizations to plan, to develop slack, and to hire or train skilled staff able to develop sustainable policies to guide a digital work practice. A higher dissemination of content would reap on the investment towards digitization and would only enrich our information society. Heritage organizations are eager to serve a digital literacy demand.
The extent to which these external factors can be identified as direct cause of innovation is impossible to determine. Our limited dataset and analysis can only serve as indication of the current digital heritage environment. However, we do find strong correlations that indicate the presence of national environments that foster, or hinder, the innovation ability of heritage institutions.
Perhaps the most important confrontation found during our research was the unavailability of data on the subject. To date, the heritage sector relies on domain associations for the gathering, analysis and dissemination of statistics about the make up of organizations, such as IFLA and EGMUS. The ENUMERATE efforts are limited to the institutional response by country which, unfortunately, appear to lack a deep understanding of the benefits of such data availability for strategic analyses across European countries. We can only hope that further efforts to gather, analyze and disseminate data would increase awareness of the great advancements towards building a rich information environment in the Europe Union and increase response rate in the future.
Bakhshi and Throsby (2012) encourage to share and publicise experiment findings to feed a learning culture, so that organizations learn from past efforts and together advance the sector. They also propose new public funding approaches to favour innovative projects. Our results suggest that institutions are still adopting the digital work practice and could benefit from sharing the

16
learning experience. Further, the current funding system does not seem to favour sustainable solutions to enable sector-wide innovation.
From our limited dataset we have drawn some results but have further identified multiple future questions. We were not able to find a relation between the wealth of a country (GDP per capita) and the level of digital output, a more detailed analysis could consider the size of the heritage budget or endowments available per country. Another research dimension could further explore innovation in urban areas, where a higher concentration of innovation and creativity is expected, or the age of the institution, where younger organizations are expected to innovate more. Our results rely on a macro approach as the ENUMERATE data does not provide what type of agglomeration the institution is located in, neither it lists whether other institutions are located in proximity, enabling so potentially learning effects. Equally, since heritage institutions are generally long standing organizations, their age has not been captured. Further, applying our macro, meso and micro approach to analyse the innovation potential in other industries may refine understanding of the heritage sector. It can be expected that the current conditions are conductive towards innovation in other sectors, reflecting the distinct characteristics of the heritage sector.
Acknowledgments We are grateful to Marco de Niet and David Fricker, and participants at an invited talk at the University of the Basque Country for valuable comments. This project is part of the FP7 EU funded project RICHES: Renewal, Innovation and Change: Heritage and European Society taking place from 2013 until 2016.

17
References
Acs, Zoltan and David Audretsch (2005) ‘Entrepreneurship and innovation’ prepared for the 2005 Summer Institute of the Entrepreneurship, Growth and Public Policy Division of the Max Planck Institute of Economics. May 2005.
Acs, Zoltan, Pontus Braunerhjelm, David Audretsch, and Bo Carlsson (2009) ‘The knowledge spillover theory of entrepreneurship’ in Small Business Economics. 32(1):15-30.
Bakhshi, Hasan and David Throsby (2014) ‘Digital complements or substitutes? A quasi-field experiment from the Royal National Theatre’ in Journal of Cultural Economics. 38(1):1-8.
Bakhshi, Hasan and David Throsby (2012) ‘New technologies in cultural institutions: theory, evidence and policy implications’ in International Journal of Cultural Policy. 18(2):205-222.
Barata, Kimberly (2004) ‘Archives in the digital age’ in Journal of the Society of Archivists. 25(1):63-70.
Baumol, William (1968) ‘Entrepreneurship in economic theory’ in American Economic Review. 58(2):64-71.
Benhamou, Francoise (2015) ‘Fair use and fair competition for digitized cultural goods: the case of eBooks’ in Journal of Cultural Economics. 39(2):123-131.
Borowiecki, Karol J. (2013) ‘Geographic clustering and productivity: an instrumental variable approach for classical composers’ in Journal of Urban Economics. 73(1):94-110.
Borowiecki, Karol J. and Trilce Navarrete (2015) ‘Fiscal and Economic Aspects of Book Consumption in the European Union’ in ACEI Working Paper. AWP-2-2015.
Brokerhof, Agnes W. (2006) ‘Collection Risk Management – The Next Frontier’ in CMA Cultural Property Protection. Conference proceedings, Ottowa: CMA.
Camarero, Carmen, Ma. Jose Garrido and Eva Vicente (2011) ‘How cultural organizations’ size and funding influence innovation and performance: the case of museums’ in Journal of Cultural Economics. 35(4):247-266.
Damanpour, Fariborz (1987) ‘The Adoption of Technological, Administrative, and Ancillary Innovations: Impact of Organizational Factors’ in Journal of Management. 13(4):675-688.
Dimaggio, Paul and Kristen Stenberg (1985) ‘Why do some theatres innovate more than others? An empirical analysis’ in Poetics. 14(1-2):107-122.
Ell, Paul and Lorna Hughes (2013) ‘E-Infrastructure in the Humanities’ in International Journal of Humanities and Arts Computing. 7(1-2):24-40.
Jancic, Maja Bogataj, et al. (2015) LAPSI Policy Recommendation N.5 The Proposed Inclusion of Cultural and Research Institutions in the Scope of PSI Directive. Brussels: EC.
Castañer, Xavier (2014) ‘Cultural Innovation by Cultural Organizations’ in Ginsburgh, Victor and David Throsby (eds.) Handbook of Economics of Art and Culture. North-Holland: Elsevier, pp.263-276.

18
Castañer, Xavier and Lorenzo Campos (2002) ‘The Determinants of Artistic Innovation: Bringing in the Role of Organizations’ in Journal of Cultural Economics. 26(1):29-52.
Connaway, Lynn, et al. (2011) ‘”If it is too inconvenient I’m not going after it:” Convenience as a critical factor in information-seeking behaviours’ in Library & Information Science Research. 33(3):179-190.
Dopfer, Kurt (2012) ‘The origins of meso economics. Schumpeter’s legacy and beyond’ in Journal of Evolutionary Economics. 22(1):130-160.
ENUMERATE (2014) ‘ENUMERATE Core Survey 2 (2014) full dataset’. Accessed on 7 December 2014 at http://enumeratedataplatform.digibis.com/.
Heilbrun, James (2001) ‘Empirical Evidence of a Decline in Repertory Diversity among American Opera Companies 1991/92 to 1997/98’ in Journal of Cultural Economics. 25(1):63-72.
Horsman, Peter (1999) ‘Archiefsystemen en kwaliteit’ in Horsman, Peter, Eric Ketelaar and Theo Thomassen (eds.) Naar een paradigma in de archivistiek. Jaarboek 1999. ‘s-Gravenhage: Stichting Archiefpublicaties, pp.85-105.
ITU (International Telecommunications Union) (2014) Measuring the Information Society Report. Geneva: ITU.
Lee, Neil and Andres Rodriguez-Pose (2014) ‘Innovation in Creative Cities: Evidence from British Small Firms’ in Industry and Innovation. 21(6):494-512.
Loran, Margarida (2005) ‘Use of Websites to Increase Access and Develop Audiences in Museums: Experiences in British National Museums’ in Digithum. No.7. Consulted on 1 March 2015 from http://www.uoc.edu/digithum/7/dt/eng/loran.pdf.
Malerba, Franco and Luigi Orsenigo (1995) ‘Schumpeterian patterns of innovation’ in Cambridge Journal of Economics. 19(1):47-65.
Marty, Paul (2007) ‘Information Representation’ in Museum Informatics: People, Information, and Technology in Museums. New York: Routledge, pp. 29-34.
Marty, Paul (2008) ‘Museum websites and museum visitors: digital museum resources and their use’ in Museum Management and Curatorship. 23(1):81-99.
Marty, Paul (2011) ‘My lost museum: User expectations and motivations for creating personal digital collections on museum websites’ in Library & Information Science Research. 33(3):211-219.
Navarrete, Trilce (2014a) A History of Digitization: Dutch Museums. PhD dissertation. University of Amsterdam.
Navarrete, Trilce (2014b) ‘Becoming Digital: A Dutch Heritage Perspective’ in Journal of Arts and Management, Law and Society. 44(3):153-168.
Navarrete, Trilce (2015) ‘Benefits of collaborative digitization projects in Europe’ in Les Cahiers du numerique. 11(1):41-56.
Navarrete, Trilce and Karol J. Borowiecki (2015) ‘Change in access after digitization: ethnographic collections in Wikipedia’ in ACEI Working Paper. AWP-2015.

19
Pierce, Lamar (2000) ‘Programmatic Risk-Taking by American Opera Companies’ in Journal of Cultural Economics. 24(1):45-63.
Rosner, Martin (1968) ‘Economic Determinants of Organizational Innovation’ in Administrative Science Quarterly. 12(4):614-625.
Saracevic, Tefko (2000) ‘Digital library evaluation: Toward evolution of concepts’ in Library Trends. 49(2):350-369.
Schumpeter, Joseph A. (1942) Capitalism, socialism and democracy. New York: Harper & Brothers.
Schumpeter, Joseph A. (1947) ‘The Creative Response in Economic History’ in Journal of Economic History. 7(2):149-159.
Stroeker, Natascha and Rene Vogels (2014) Survey Report on Digitization in European Cultural Heriaga Institutions 2014. Zoetermeer: Panteia.
Skov, Mette and Peter Ingwersen (2008) ‘Exploring information seeking behaviour in a digital museum context’ in IIiX ’08 Proceedings of the second international symposium on Information interaction in context. New York: ACM, pp. 110-115.
Skov, Mette and Peter Ingwersen (2014) ‘Museum Web Search behaviour of special interest visitors’ in Library & Information Science Research. 36(2):91-98.
Verhoeven, Deb (2012) ‘New cinema history and the computational turn’ in WCCA 2012, World Congress of Communication and the Arts Conference Proceedings. COPEC, Science and Education Research Council. Accessed on 5 March 2015 at http://dro.deakin.edu.au/view/DU:30044939.
Yakel, Elizabeth (2004) ‘Seeking information, seeking connections, seeking meaning: genealogists and family historians’ in Information Research. 10(1). Paper 205.
Zhang, Junte and Jaap Kamps (2010) ‘A Search Log-Based Approach to Evaluation’ in M. Lalmas et al. (eds.) Research and Advanced Technology for Digital Libraries, LNCS 6273, pp. 248-260. Berlin: Springer.

20
Tables Table 1. Summary of micro and meso indicators (%)
Variable Obs Mean Std. Dev. Variable Obs Mean Std. Dev.
A. Micro-level B. Meso-level
share digitized 1148 17.29 23.55 archive 1369 0.24 0.43
digitization strategy 1179 0.38 0.49 museum 1369 0.40 0.49 digital preservation strategy 833 0.28 0.45 other 1369 0.04 0.20
policy use 838 0.36 0.48 library 1369 0.32 0.47
publication online 748 42.73 39.82
budget 1369 3.99 1.84 C. Macro-level
budget squared 1369 19.31 14.28 GDP per capita 1364 29161.1 12132.5
FTE 1369 67.10 265.29 population (logged) 1365 16.59 1.43
FTE specialized 764 0.33 1.36 educational attainment 1364 72.50 11.72
Funding source: Internet access 1369 79.49 11.53
internal budgets 793 0.88 0.32 Regions:
crowdfunding 793 0.02 0.14 Nordic 1369 0.17 0.38
national grant/subsidy 793 0.40 0.49 West 1369 0.14 0.35
regional grant/subsidy 793 0.22 0.42 British Isles 1369 0.05 0.22
private funds 793 0.12 0.32 South 1369 0.20 0.40 public private partnership 793 0.09 0.29 East 1369 0.15 0.35
sales of digital items 793 0.10 0.30 South-east 1369 0.04 0.20
other 793 0.07 0.26 Data source: ENUMERATE for the year 2013.

21
Table 2. Level of digitization
(1) (2) (3) (4) (5)
Digitized Digitized Digitized Digitized Digitized
VARIABLES Baseline Baseline plus
FTE specialized Baseline plus fund sources
Baseline plus fund
sources plus macro
By country and type
Digitization strategy 6.941*** 6.275*** 6.433*** 6.673*** 6.798***
(1.595) (1.771) (1.827) (1.839) (2.073)
Budget 5.205** 4.674** 4.402** 4.699** 4.667*
(1.928) (2.156) (2.102) (2.160) (2.392)
Budget2
-0.670*** -0.628** -0.577** -0.627** -0.653**
(0.238) (0.264) (0.257) (0.264) (0.298)
FTE -0.000919 -0.00404*** -0.00416*** -0.00390*** -0.00337**
(0.00252) (0.000822) (0.000846) (0.000865) (0.00131)
FTE specialized 1.201 1.277 1.210 1.312
(0.884) (0.907) (0.928) (0.858)
Archives -2.260 -2.260 -2.224 -2.139
(2.441) (2.441) (2.224) (2.229)
Museums 11.54*** 11.54*** 11.45*** 11.45***
(2.754) (2.754) (2.680) (2.755)
Other 13.15*** 13.15*** 13.49*** 12.65***
(3.607) (3.607) (3.529) (3.646)
GDP per capita -3.61e-05
(7.72e-05) Population, logged -1.689**
(0.661)
Education level 0.259**
(0.120)
Internet access -0.0238
(0.145)
Region controls yes yes yes yes Funding controls yes yes Type of institution controls yes Country controls yes
Observations 721 721 721 717 721
R-squared 0.149 0.149 0.152 0.157 0.209
Note: Robust standard errors in parentheses. Some of the specifications include region controls (dummy variables for different parts of Europe), funding controls (dummy variables for source of funding of the institution), type of institution controls and country controls. See Data Appendix B for further details on the included control variables. ***/**/* indicate estimates that are significantly different from zero at 99/95/90 percent confidence.

22
Table 3. Digitization policy and digitization of collections
(1) (2) (3)
VARIABLES Digitization
strategy Incidental cost Online
publication
Digitization strategy 1.368 4.029
(2.340) (3.324)
Digital preservation strategy 0.367*** -6.879**
(0.0559) (2.684)
Policy use 0.290*** -6.572**
(0.0517) (2.680)
Collections digitized 0.00161** -0.0494 0.305***
(0.000607) (0.0564) (0.0622)
Internet access 0.00450 0.102 0.541**
(0.00267) (0.185) (0.248)
Budget 0.00450 1.641 -3.350
(0.0359) (3.513) (3.284)
Budget2
0.00290 -0.317 0.613
(0.00444) (0.394) (0.387)
FTE 3.32e-05 -0.000867 0.00522
(5.56e-05) (0.00219) (0.00466)
FTE specialized 0.0190* -2.012** -0.205
(0.00939) (0.759) (0.522)
Macro-level controls yes yes Yes
Domain controls yes yes Yes
Funding controls yes yes Yes
Region controls yes yes Yes
Observations 668 668 630
R-squared 0.395 0.087 0.277
Note: See Table 2. The macro-level controls include here GDP per capita, population (logged) and educational attainment.

23
Table 4. Users of digital heritage collections (1) (2) (3) (4) (5) (6) (7) (8)
VARIABLES Academic research
Creative reuse Educational use
Comme-morative
Personal enjoyment Preservation Commercial Other Use
Digitization strategy 0.453*** 0.552* 0.200 0.252 0.228 0.245 0.0156 0.773***
(0.126) (0.281) (0.179) (0.412) (0.199) (0.189) (0.176) (0.277)
Budget -0.221 -0.296 0.237 0.0842 -0.0912 -0.0641 0.300 0.363
(0.162) (0.234) (0.261) (0.309) (0.372) (0.300) (0.243) (0.336)
Budget2
0.0393* 0.0427 -0.0162 -0.0180 0.0117 0.0158 -0.0214 -0.0372
(0.0213) (0.0298) (0.0313) (0.0356) (0.0444) (0.0392) (0.0295) (0.0425)
FTE 0.000167** -0.000349 0.000494*** -0.000239 -0.000247 -5.18e-05 -0.000157 6.38e-06
(6.97e-05) (0.000219) (0.000104) (0.000221) (0.000343) (0.000258) (0.000161) (0.000227) FTE specialized -0.0834 -0.00499 -0.0572 -0.101** -0.0660 -0.0390 -0.00919 0.218***
(0.0846) (0.0705) (0.0968) (0.0451) (0.114) (0.0412) (0.0960) (0.0615)
GDP -5.63e-06 -3.51e-05*** 1.95e-05*** -1.53e-05 -1.17e-05 -3.01e-05**
-3.21e-05*** -3.61e-05**
(1.02e-05) (1.12e-05) (6.72e-06) (1.28e-05) (1.87e-05) (1.23e-05) (1.13e-05) (1.56e-05) Population size -0.119** -0.249** -0.174*** -0.197* 0.0241 -0.139 -0.00708 -0.0413
(0.0578) (0.0920) (0.0478) (0.103) (0.122) (0.0903) (0.0712) (0.130) Education level -0.0293*** 0.000196 -0.00677 0.0461** -0.00952 -0.0215 -0.0297 0.0138
(0.00948) (0.0195) (0.00656) (0.0211) (0.0337) (0.0177) (0.0179) (0.0324) Internet access -0.0297** -0.0105 -0.00813 -0.0104 0.0375 -0.0195 0.0296 0.0397
(0.0136) (0.0286) (0.0126) (0.0233) (0.0330) (0.0173) (0.0180) (0.0277) Type of institution controls yes yes Yes yes yes yes Yes yes Funding controls yes yes Yes yes yes yes Yes yes Region controls yes yes Yes yes yes yes Yes yes
Observations 725 725 725 725 725 725 725 725
R-squared 0.148 0.116 0.188 0.146 0.150 0.116 0.213 0.089
Note: See Table 2.

24
Figures
Figure 1. Share of digitization of collections per country
Figure 2. Digitization policy by share of digitization
[.5,9.66886](9.66886,17.2587](17.2587,20.2308](20.2308,35]No data
.2.3
.4.5
.6
Sha
re o
f In
stitu
tio
ns h
avin
g a
polic
y/s
tra
tegy
0
.05
.1
Sha
re o
f In
stitu
tio
ns h
avin
g d
igitiz
ed
0 20 40 60 80 100Percentage Digitized
Digitized Digitization Strategy
Digital Preservation Strategy Policy Use

25
Figure 3. Publication of collections online per country
[1,33.71429](33.71429,42.77778](42.77778,53.16667](53.16667,100]No data

26
Appendices (for online publication)
Appendix A: Characteristics of archives, libraries and museums
Archival collections are linked to government structures of information creation and provision undergoing a major transformation driven by e-government programs. The goal of e-government policies is to provide sustainable, transparent and trustworthy access to information services from the user’s perspective (Barata, 2004; Yakel 2004). Legal measures, including the Freedom of Information Acts and Data Protection Acts, have been designed to further ensure transparent, authentic and secure access to information (Barata, 2004).
Recordkeeping systems strive to provide an absolute quality of products and services throughout the archival processes, which include activities related to capture, organization, description, selection, disposal, archiving and giving access to information (Horsman, 1999). These processes have gained complexity as archives by adopting a digital work practice to include digitized and born digital documents. Barata (2004) identify though a growing gap between governmental goals and institutional practice brought by an institutional inability to adopt a digital work practice that would satisfy the quality required.
Archival collections, and to a certain extent libraries, are increasingly used for tracing family history. Genealogists search for discrete facts and dates, which require a specific information service able to allow remote access of large collections of birth certificates, army registers or marriage contracts (Yakel, 2004). A number of genealogical societies and Internet sites have developed to respond to this specific consumer need because governmental archives are not always able to provide such specific searching service.
Digitization of library collections, largely comprised of books that can be scanned, has generally taken place within universities and national libraries. Digitization of books has had a particular trajectory after Google launched the mass digitization program in 2004, the Google Library Project, which accounts by now for over 15 million digital books (Benhamou, 2015). Another related initiative is the Open-Access Text Archive project launched by the Internet Archive in 2007, responsible for scanning over 2.1 million books and for giving online access to over 6 million full-text books (https://archive.org/).
Technical innovation of digitization in libraries has centred on giving optimal full-text search access to large collections of books across institutions by building networked infrastructures with improved usability and functionality (Saracevic, 2000). Increasingly, the notion of a digital library has grown to represent a collection of digital material independently of form or origin.
Museums have a long history of working with collection surrogates, or representations of objects, because of the difficulties brought by accessing, searching or manipulating the individual objects within large collections (Marty, 2007). Given the prominence of 3D objects in museum collections, the items are generally photographed rather than scanned. For example, the Google Art Project has made available over 45,000 objects in high resolution (gigapixel imaging). The buildings are also treated as objects and can be viewed in the Virtual Gallery Tour using Google’s indoor street view technology, currently

27
covering more than 60 museums. Digitization in museums has benefited from technical innovation on imaging and 3D visualizations.
Appendix B: Control variables
The following controls were established in order to isolate the effects of the independent variables:
Macro variables:
Demographics: GDP, size of population, level of education, and personal use of the Internet.
Region: Central (baseline), Nordic, West, British Isles, South, East, and South East. Regional controls are largely based on the United Nations statistical divisions for Europe with some additional disaggregation to enable a more detailed exploitation of the underlying database. We distinguish the following regions of Europe: Central (Austria, Germany, Liechtenstein, Switzerland), Nordic (Demark, Finland, Iceland, Sweden), British Isles (Ireland, United Kingdom), South (Cyprus, Greece, Italy, Malta, Portugal, Spain), East (Bulgaria, Czech Republic, Estonia, Hungary, Latvia, Lithuania, Moldova, Poland, Romania, Slovakia) and South East (Slovenia, Bosnia and Herzegovina, Macedonia).
Country: Austria, Belgium, Bosnia Herzegovina, Bulgaria, Check Republic, Cyprus, Denmark, Estonia, Finland, France, Germany, Greece, Hungary, Iceland, Ireland, Italy, Latvia, Liechtenstein, Lithuania, Luxembourg, Macedonia, Malta, Monaco, Moldova, Poland, Portugal, Netherlands, Romania, Slovakia, Slovenia, Spain, Sweden, Switzerland, UK (baseline).
Meso variables:
Domain: archive, library, museum. Or type of institution (used in some robustness specifications): audio visual archive, film institute, higher education library, monument care, performing arts, history museum, art museum, ethnography museum, nature museum, science museum, national archive, national library, other archive, other type of institution, public library, or special library.
Micro variables:
Digital publication: online publication on own website or any other platform.
Policy: digitization strategy, policy of use of digital collections, digitization preservation strategy.
Organization type: total budget, digital activities budget, FTE, specialized FTE.
Funding source: internal funding, crowdfunding, national public, regional public, private fund, public/private partnerships, sales digital, and other.
Domain: archive, library (baseline), and museum. Type of collection: audio visual archive, film institute, higher education
library, monument care, performing arts, museum of art (baseline), museum of history, museum of ethnography, museum of nature, museum

28
of science, national archive, national library, other archive, other type of institution, public library, and special library.
Type of user: academic research, creative reuse, educational use, commemorative use, personal enjoyment, preservation, commercial, and other.

29
Appendix C: Additional Tables
Table C.1 Level of digitization – Reporting all coefficients
(1) (2) (3) (4) (5)
Digitized Digitized Digitized Digitized Digitized
VARIABLES baseline baseline plus
ftedigital_share baseline plus fund sources
baseline plus fund sources plus
macro plus itu by country
and type
digitizationstrategy 6.941*** 6.275*** 6.433*** 6.673*** 6.798***
(1.595) (1.771) (1.827) (1.839) (2.073)
budget 5.205** 4.674** 4.402** 4.699** 4.667*
(1.928) (2.156) (2.102) (2.160) (2.392)
budget_2 -0.670*** -0.628** -0.577** -0.627** -0.653**
(0.238) (0.264) (0.257) (0.264) (0.298)
fte -
0.000919 -0.00404*** -0.00416*** -0.00390*** -0.00337**
(0.00252) (0.000822) (0.000846) (0.000865) (0.00131)
ftedigital_share 1.201 1.277 1.210 1.312
(0.884) (0.907) (0.928) (0.858)
t_audio_visual_archive -10.91
(8.774)
t_film_institute -19.46***
(7.048)
t_higher_educ_library -22.36***
(8.079)
t_monument_care -20.07**
(8.885)
t_performing_arts -24.53*
(13.35)
t_museum_history -8.007
(5.018)
t_museum_ethnography -19.59***
(6.702)
t_museum_nature -14.10
(10.80)
t_museum_science -11.25
(9.579)
t_national_archive -27.72***
(7.426)
t_national_library -26.10***
(7.588)
t_other_archive -24.05**
(9.159)
t_other_type_of_institution -16.39**
(7.584)
t_public_library -18.46**
(7.456)
t_special_library -21.23**
(7.805)
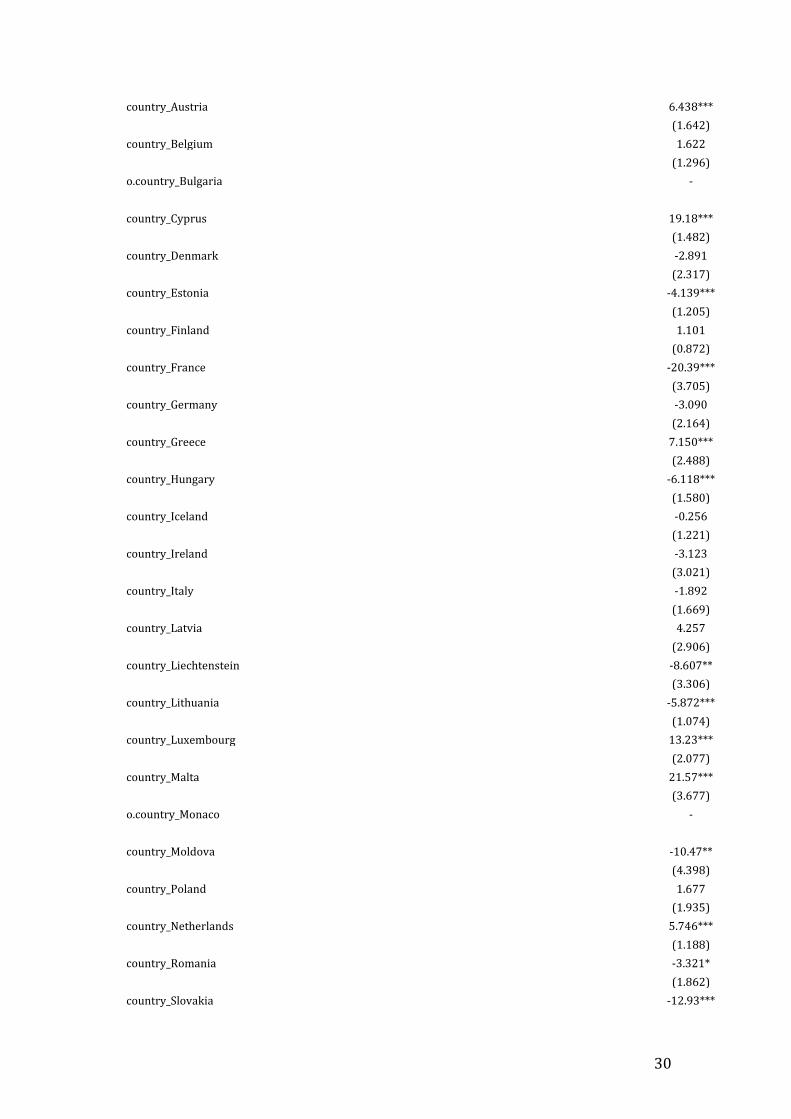
30
country_Austria 6.438***
(1.642)
country_Belgium 1.622
(1.296)
o.country_Bulgaria -
country_Cyprus 19.18***
(1.482)
country_Denmark -2.891
(2.317)
country_Estonia -4.139***
(1.205)
country_Finland 1.101
(0.872)
country_France -20.39***
(3.705)
country_Germany -3.090
(2.164)
country_Greece 7.150***
(2.488)
country_Hungary -6.118***
(1.580)
country_Iceland -0.256
(1.221)
country_Ireland -3.123
(3.021)
country_Italy -1.892
(1.669)
country_Latvia 4.257
(2.906)
country_Liechtenstein -8.607**
(3.306)
country_Lithuania -5.872***
(1.074)
country_Luxembourg 13.23***
(2.077)
country_Malta 21.57***
(3.677)
o.country_Monaco -
country_Moldova -10.47**
(4.398)
country_Poland 1.677
(1.935)
country_Netherlands 5.746***
(1.188)
country_Romania -3.321*
(1.862)
country_Slovakia -12.93***

31
(3.319)
country_Slovenia 2.131*
(1.226)
country_Spain 6.184***
(1.323)
country_Sweden -0.833
(0.716)
country_Switzerland -2.294
(2.250)
country_BosniaHerz -2.849
(4.245)
country_Czech -7.804***
(1.533)
country_Macedonia 9.623**
(4.616)
country_Portugal -1.233
(1.929)
s_archive -1.091 -2.260 -2.224 -2.139
(2.249) (2.441) (2.224) (2.229)
s_museum 10.97*** 11.54*** 11.45*** 11.45***
(2.238) (2.754) (2.680) (2.755)
s_other 8.776** 13.15*** 13.49*** 12.65***
(3.493) (3.607) (3.529) (3.646)
fund_internal 2.184 2.219
(1.415) (1.475)
fund_crowdfunding -1.526 -1.912
(5.023) (4.926)
fund_nationalpublic -0.578 -0.484
(1.526) (1.577)
fund_regionalpublic 0.129 0.617
(1.587) (1.575)
fund_privatefund -1.127 -1.121
(1.335) (1.351)
fund_ppp -1.866 -2.040
(2.827) (2.867)
fund_salesdigital -1.593 -1.740
(3.899) (3.953)
fund_other -1.825 -2.044
(2.483) (2.461)
gdp_pc -3.61e-05
(7.72e-05)
lpop -1.689**
(0.661)
educ_15_64_mid_high 0.259**
(0.120)
itu -0.0238
(0.145)
Europe_Nordic 3.294 2.843 3.262 1.256
(2.216) (2.290) (2.271) (3.454)

32
Europe_West 8.460*** 8.521*** 8.533*** 9.314***
(2.048) (2.275) (2.306) (3.261)
Europe_British_Isles 1.716 2.860 2.561 2.835
(1.992) (2.078) (2.308) (2.698)
Europe_South 6.770*** 7.778*** 7.895*** 12.87**
(1.885) (2.129) (2.077) (4.995)
Europe_East -2.453 -2.329 -2.270 -7.175
(1.923) (2.371) (2.466) (4.387)
Europe_South_East 4.163** 5.190** 5.101** -1.274
(1.955) (2.173) (2.303) (4.501)
Constant -1.046 1.556 0.320 12.28 25.99***
(2.756) (3.726) (3.868) (20.68) (7.966)
Observations 1,085 721 721 717 721
R-squared 0.135 0.149 0.152 0.157 0.209 Robust standard errors in parentheses
*** p<0.01, ** p<0.05, * p<0.1

33
Table C.2 Robustness of the ENUMERATE sample
(1) (2) (3)
Baseline Controlling for enumerate
countries Controlling for number of institutions per 1m citizen
VARIABLES Digitized Digitized Digitized
enumerate 6.460**
(3.106)
tot_inst_per_pop -0.0149
(0.0472)
digitizationstrategy 6.508*** 6.721*** 6.489***
(1.784) (1.761) (1.802)
budget 5.024** 5.030** 5.032**
(2.202) (2.215) (2.202)
budget_2 -0.685** -0.680** -0.687**
(0.269) (0.270) (0.269)
fte -0.00376*** -0.00380*** -0.00375***
(0.000842) (0.000880) (0.000846)
ftedigital_share 1.138 1.194 1.137
(0.896) (0.915) (0.896)
gdp_pc -2.76e-05 9.53e-05 -3.52e-05
(7.67e-05) (7.08e-05) (9.07e-05)
lpop -1.646** -2.483*** -1.780
(0.710) (0.822) (1.074)
educ_15_64_mid_high 0.253** 0.305*** 0.241
(0.123) (0.0779) (0.145)
itu -0.00650 -0.224 0.00466
(0.163) (0.165) (0.179)
s_archive -2.265 -2.194 -2.265
(2.473) (2.513) (2.475)
s_museum 11.50*** 11.36*** 11.47***
(2.828) (2.810) (2.823)
s_other 12.26*** 11.80*** 12.27***
(3.749) (3.774) (3.753)
Europe_Nordic 0.710 6.779* 0.556
(3.499) (3.502) (3.815)
Europe_West 9.153*** 9.901*** 8.859**
(3.260) (2.617) (3.929)
Europe_British_Isles 3.139 5.210** 2.933
(2.471) (1.881) (2.814)
Europe_South 12.99** 13.82*** 12.68**
(5.178) (3.277) (5.652)
Europe_East -6.762 -3.739 -6.975
(4.278) (3.737) (4.575)
Europe_South_East -0.611 -4.582 -0.666
(4.473) (4.401) (4.494)
Constant 11.63 29.64 14.36
(21.58) (19.21) (27.22)
Observations 717 717 717
R-squared 0.154 0.157 0.154
Robust standard errors in parentheses
*** p<0.01, ** p<0.05, * p<0.1

34
Table C.3 Digitization policy and digitization of collections - Reporting all coefficients
(1) (2) (3)
VARIABLES Digitization
strategy Incidental
cost Online
publication
digitizationstrategy 1.368 4.029
(2.340) (3.324)
digitalpreservationstrategy 0.367*** -6.879**
(0.0559) (2.684)
policyuse 0.290*** -6.572**
(0.0517) (2.680)
digitized 0.00161** -0.0494 0.305***
(0.000607) (0.0564) (0.0622)
gdp_pc -3.03e-06 0.000300** -6.07e-05
(2.70e-06) (0.000109) (0.000204)
lpop 0.000804 0.189 1.113
(0.0150) (0.614) (1.384)
educ_15_64_mid_high -0.00619** 0.148 -0.0793
(0.00278) (0.124) (0.280)
itu 0.00450 0.102 0.541**
(0.00267) (0.185) (0.248)
budget 0.00450 1.641 -3.350
(0.0359) (3.513) (3.284)
budget_2 0.00290 -0.317 0.613
(0.00444) (0.394) (0.387)
fte 3.32e-05 -0.000867 0.00522
(5.56e-05) (0.00219) (0.00466)
ftedigital_share 0.0190* -2.012** -0.205
(0.00939) (0.759) (0.522)
s_archive -0.0494 -6.095* -31.01***
(0.0331) (3.081) (3.758)
s_museum -0.0560 -7.901** -42.33***
(0.0380) (3.402) (3.986)
s_other -0.0204 -3.879 -34.15***
(0.0829) (6.485) (8.111)
fund_internal 0.0530 3.927 7.351
(0.0564) (5.562) (4.463)
fund_crowdfunding 0.134* 3.683 -2.680
(0.0701) (5.731) (11.18)
fund_nationalpublic -0.0413 4.394 4.631
(0.0277) (2.919) (2.752)
fund_regionalpublic -0.0145 -1.441 -0.330
(0.0488) (2.205) (3.913)
fund_privatefund 0.0529 2.819 5.787
(0.0585) (3.628) (4.654)
fund_ppp -0.0812 0.306 -6.457*
(0.0500) (2.411) (3.540)
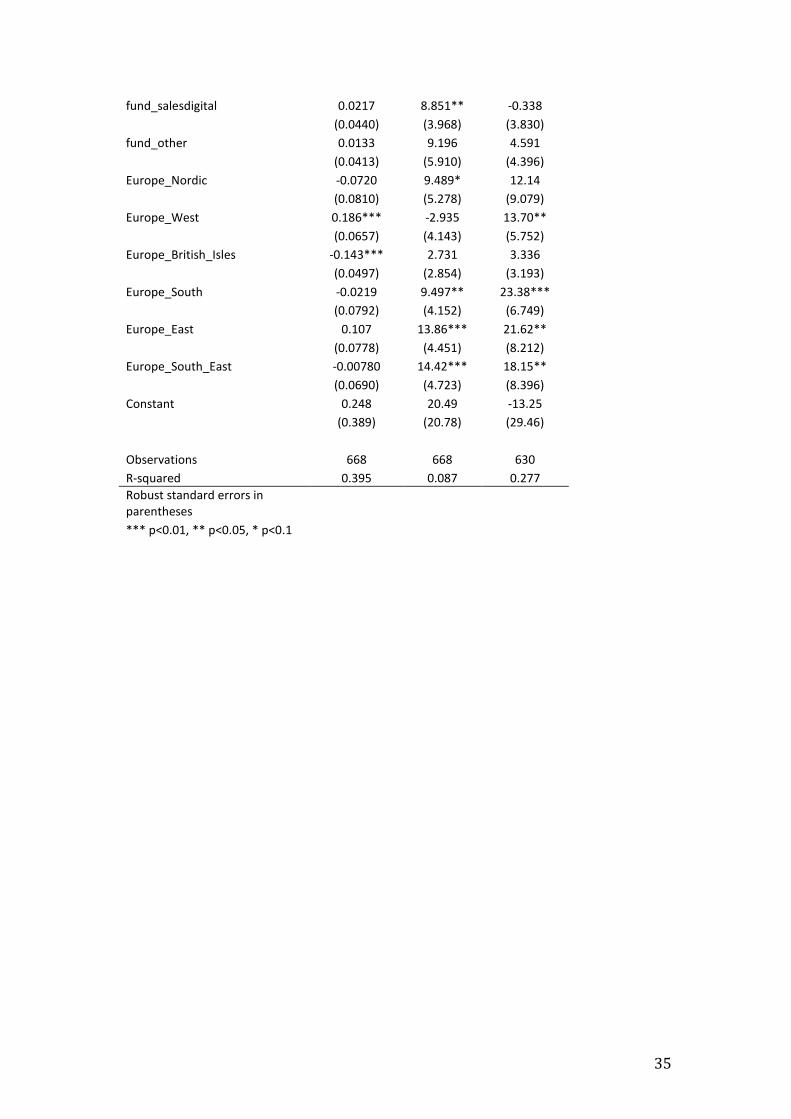
35
fund_salesdigital 0.0217 8.851** -0.338
(0.0440) (3.968) (3.830)
fund_other 0.0133 9.196 4.591
(0.0413) (5.910) (4.396)
Europe_Nordic -0.0720 9.489* 12.14
(0.0810) (5.278) (9.079)
Europe_West 0.186*** -2.935 13.70**
(0.0657) (4.143) (5.752)
Europe_British_Isles -0.143*** 2.731 3.336
(0.0497) (2.854) (3.193)
Europe_South -0.0219 9.497** 23.38***
(0.0792) (4.152) (6.749)
Europe_East 0.107 13.86*** 21.62**
(0.0778) (4.451) (8.212)
Europe_South_East -0.00780 14.42*** 18.15**
(0.0690) (4.723) (8.396)
Constant 0.248 20.49 -13.25
(0.389) (20.78) (29.46)
Observations 668 668 630
R-squared 0.395 0.087 0.277
Robust standard errors in parentheses
*** p<0.01, ** p<0.05, * p<0.1

36
Table C.4 Users of digital heritage collections - Reporting all coefficients
(1) (2) (3) (4) (5) (6) (7) (8)
VARIABLES Academic research
Creative reuse
Educational use Commemorative
Personal enjoyment Preservation Commercial Other Use
digitizationstrategy 0.453*** 0.552* 0.200 0.252 0.228 0.245 0.0156 0.773***
(0.126) (0.281) (0.179) (0.412) (0.199) (0.189) (0.176) (0.277)
budget -0.221 -0.296 0.237 0.0842 -0.0912 -0.0641 0.300 0.363
(0.162) (0.234) (0.261) (0.309) (0.372) (0.300) (0.243) (0.336)
budget_2 0.0393* 0.0427 -0.0162 -0.0180 0.0117 0.0158 -0.0214 -0.0372
(0.0213) (0.0298) (0.0313) (0.0356) (0.0444) (0.0392) (0.0295) (0.0425)
fte 0.000167** -0.000349 0.000494*** -0.000239 -0.000247 -5.18e-05 -0.000157 6.38e-06
(6.97e-05) (0.000219) (0.000104) (0.000221) (0.000343) (0.000258) (0.000161) (0.000227)
ftedigital_share -0.0834 -0.00499 -0.0572 -0.101** -0.0660 -0.0390 -0.00919 0.218***
(0.0846) (0.0705) (0.0968) (0.0451) (0.114) (0.0412) (0.0960) (0.0615)
gdp_pc -5.63e-06 -3.51e-05*** 1.95e-05*** -1.53e-05 -1.17e-05 -3.01e-05**
-3.21e-05***
-3.61e-05**
(1.02e-05) (1.12e-05) (6.72e-06) (1.28e-05) (1.87e-05) (1.23e-05) (1.13e-05) (1.56e-05)
lpop -0.119** -0.249** -0.174*** -0.197* 0.0241 -0.139 -0.00708 -0.0413
(0.0578) (0.0920) (0.0478) (0.103) (0.122) (0.0903) (0.0712) (0.130)
educ_15_64_mid_high -0.0293*** 0.000196 -0.00677 0.0461** -0.00952 -0.0215 -0.0297 0.0138
(0.00948) (0.0195) (0.00656) (0.0211) (0.0337) (0.0177) (0.0179) (0.0324)
itu -0.0297** -0.0105 -0.00813 -0.0104 0.0375 -0.0195 0.0296 0.0397
(0.0136) (0.0286) (0.0126) (0.0233) (0.0330) (0.0173) (0.0180) (0.0277)
t_audio_visual_archive -1.435** -0.389 -0.640 0.770 0.419 0.824 0.322 0.409
(0.568) (0.786) (0.830) (0.622) (0.652) (0.887) (0.934) (1.318)
t_film_institute -0.00421 -0.807 -1.387 -1.326 0.425 -1.054 0.972** -2.516***
(0.327) (2.395) (0.873) (1.152) (1.177) (2.253) (0.445) (0.755)
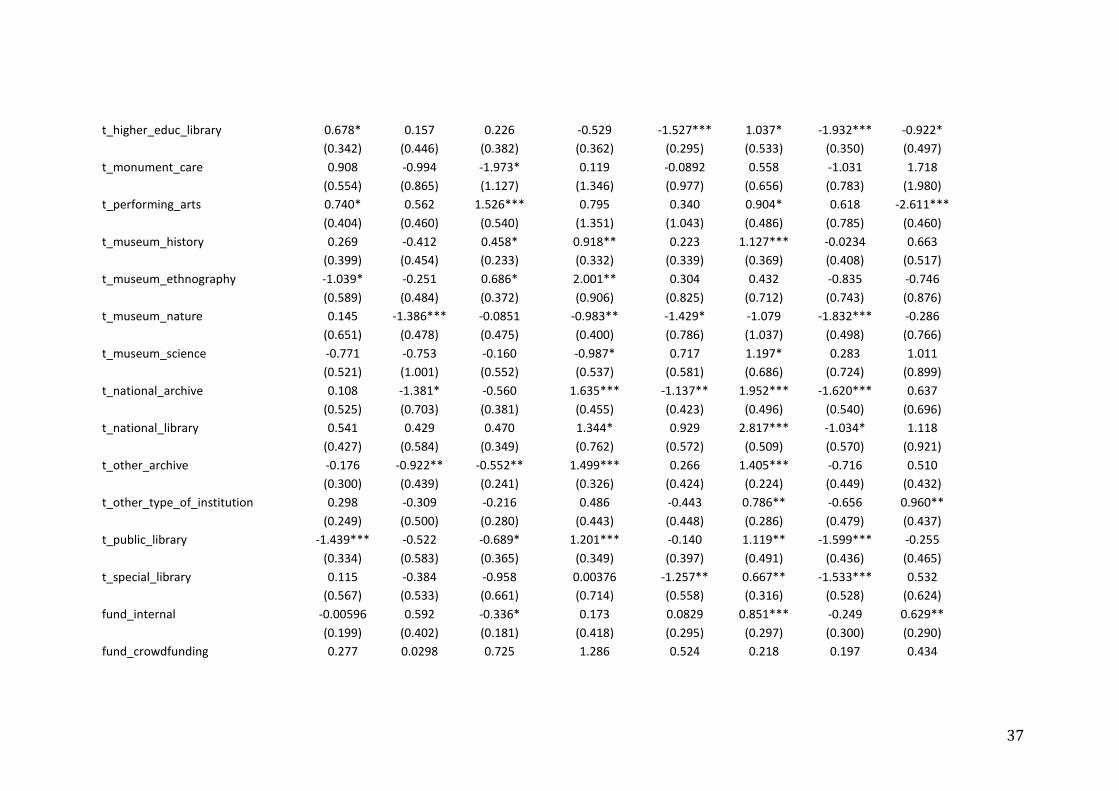
37
t_higher_educ_library 0.678* 0.157 0.226 -0.529 -1.527*** 1.037* -1.932*** -0.922*
(0.342) (0.446) (0.382) (0.362) (0.295) (0.533) (0.350) (0.497)
t_monument_care 0.908 -0.994 -1.973* 0.119 -0.0892 0.558 -1.031 1.718
(0.554) (0.865) (1.127) (1.346) (0.977) (0.656) (0.783) (1.980)
t_performing_arts 0.740* 0.562 1.526*** 0.795 0.340 0.904* 0.618 -2.611***
(0.404) (0.460) (0.540) (1.351) (1.043) (0.486) (0.785) (0.460)
t_museum_history 0.269 -0.412 0.458* 0.918** 0.223 1.127*** -0.0234 0.663
(0.399) (0.454) (0.233) (0.332) (0.339) (0.369) (0.408) (0.517)
t_museum_ethnography -1.039* -0.251 0.686* 2.001** 0.304 0.432 -0.835 -0.746
(0.589) (0.484) (0.372) (0.906) (0.825) (0.712) (0.743) (0.876)
t_museum_nature 0.145 -1.386*** -0.0851 -0.983** -1.429* -1.079 -1.832*** -0.286
(0.651) (0.478) (0.475) (0.400) (0.786) (1.037) (0.498) (0.766)
t_museum_science -0.771 -0.753 -0.160 -0.987* 0.717 1.197* 0.283 1.011
(0.521) (1.001) (0.552) (0.537) (0.581) (0.686) (0.724) (0.899)
t_national_archive 0.108 -1.381* -0.560 1.635*** -1.137** 1.952*** -1.620*** 0.637
(0.525) (0.703) (0.381) (0.455) (0.423) (0.496) (0.540) (0.696)
t_national_library 0.541 0.429 0.470 1.344* 0.929 2.817*** -1.034* 1.118
(0.427) (0.584) (0.349) (0.762) (0.572) (0.509) (0.570) (0.921)
t_other_archive -0.176 -0.922** -0.552** 1.499*** 0.266 1.405*** -0.716 0.510
(0.300) (0.439) (0.241) (0.326) (0.424) (0.224) (0.449) (0.432)
t_other_type_of_institution 0.298 -0.309 -0.216 0.486 -0.443 0.786** -0.656 0.960**
(0.249) (0.500) (0.280) (0.443) (0.448) (0.286) (0.479) (0.437)
t_public_library -1.439*** -0.522 -0.689* 1.201*** -0.140 1.119** -1.599*** -0.255
(0.334) (0.583) (0.365) (0.349) (0.397) (0.491) (0.436) (0.465)
t_special_library 0.115 -0.384 -0.958 0.00376 -1.257** 0.667** -1.533*** 0.532
(0.567) (0.533) (0.661) (0.714) (0.558) (0.316) (0.528) (0.624)
fund_internal -0.00596 0.592 -0.336* 0.173 0.0829 0.851*** -0.249 0.629**
(0.199) (0.402) (0.181) (0.418) (0.295) (0.297) (0.300) (0.290)
fund_crowdfunding 0.277 0.0298 0.725 1.286 0.524 0.218 0.197 0.434

38
(0.240) (0.513) (0.574) (0.857) (0.527) (0.289) (0.449) (0.822)
fund_nationalpublic 0.301* 0.414* -0.0623 -0.124 -0.0106 0.122 0.126 0.0237
(0.154) (0.242) (0.173) (0.218) (0.181) (0.195) (0.173) (0.278)
fund_regionalpublic -0.214 0.483** 0.223 0.667*** 0.604*** -0.0469 0.392** 0.00839
(0.156) (0.224) (0.237) (0.221) (0.211) (0.285) (0.186) (0.393)
fund_privatefund -0.260 -0.110 -0.0906 0.438 -0.0929 -0.0257 0.534* -0.233
(0.268) (0.338) (0.252) (0.345) (0.383) (0.338) (0.273) (0.409)
fund_ppp 0.0850 0.0193 0.315 0.0980 0.765** -0.326 -0.491** 0.324
(0.392) (0.366) (0.230) (0.467) (0.320) (0.372) (0.237) (0.525)
fund_salesdigital 0.0684 0.313 0.360 0.122 -0.0426 0.484 2.197*** 0.709*
(0.215) (0.346) (0.279) (0.342) (0.381) (0.315) (0.357) (0.407)
fund_other 0.0503 -0.473 -0.283 -0.308 0.0173 0.371 -0.0629 0.966*
(0.261) (0.284) (0.237) (0.324) (0.383) (0.340) (0.312) (0.501)
Europe_Nordic -0.648** 1.160*** 0.650*** 0.862** 0.848 0.0588 -0.0802 0.316
(0.242) (0.356) (0.213) (0.350) (0.657) (0.412) (0.408) (0.562)
Europe_West -0.888*** 0.762 -0.344 0.526 0.686 0.573 -0.109 -0.431
(0.295) (0.542) (0.252) (0.380) (0.723) (0.359) (0.332) (0.625)
Europe_British_Isles -0.146 0.900*** 1.556*** 0.983*** 2.322*** -1.176*** 2.054*** 0.745*
(0.387) (0.191) (0.339) (0.206) (0.603) (0.288) (0.605) (0.382)
Europe_South -0.963** 0.544 0.923** 1.794** 0.901 -1.227** 0.294 1.412
(0.393) (0.705) (0.353) (0.729) (1.403) (0.507) (0.524) (0.977)
Europe_East -0.979** -0.0717 1.643*** 0.895 0.00663 -1.036** 0.258 -0.278
(0.402) (0.705) (0.406) (0.669) (1.113) (0.456) (0.514) (0.758)
Europe_South_East -0.459 0.517 1.544*** 0.134 1.792* 0.169 0.431 0.525
(0.333) (0.654) (0.372) (0.548) (0.983) (0.426) (0.448) (0.837)
Constant 15.80*** 10.70*** 10.47*** 3.699 3.308 12.10*** 3.737* -1.334
(1.623) (2.723) (1.661) (2.635) (5.902) (2.585) (2.087) (3.794)
Observations 725 725 725 725 725 725 725 725

39
R-squared 0.148 0.116 0.188 0.146 0.150 0.116 0.213 0.089
Robust standard errors in parentheses
*** p<0.01, ** p<0.05, * p<0.1