Embed Size (px)
Citation preview

DIGGING DEEPER:EEEE EEEEEEEEEEEAN IN DEPTH EXAMINATION OF THEEGLOBAL CLIMATE 500 INDEX SEP 2015/
PREFACE
This report digs deeper into the performance of the leaders across the five ratings criteria, following the April 2015 AODP Global Climate 500 Index. It reveals the highest ranked asset owners across these criteria, sectors and regions as well as the largest laggards by fund size.
Our insights provide a fuller picture of the areas in which asset owners are the most proactive, as well as the variety of tools and strategies used to improve climate risk management.
This level of detail provides the funds with a better understanding of their relative strengths and weaknesses in each area compared to peers, allowing them to create plans and strategies to catch up or move further forward.
There are numerous options that can be taken by asset owners to raise their game – regardless of current rankings – ahead of the 2016 AODP Global Climate 500, which will be launched late September 2015.
The 2015 AODP 500 was compiled by assessing the world’s largest 500 asset owners including pension funds, sovereign wealth funds, insurance companies, foundations and endowments. Funds are rated from AAA through to D grade, with an extra X category being added for those funds at the bottom that appear to be doing absolutely nothing to manage climate risk.
ACKNOWLEDGEMENTS
REPORT WRITTEN AND PRODUCED BY:
JULIAN POULTER, LEANNE BOUVET CPA, OLIVER WAGG AND JOSHUA SHEPPARD
THE ASSET OWNERS DISCLOSURE PROJECT GIVES SPECIAL THANKS TO THE FOLLOWING PEOPLE IN PRODUCING THIS REPORT:
VICTORIA BRYANT, LUKE FAY, ROBERT SCHWARZ, HUGUES LETOURNEAU, MARK MCCAW, PAVEL KIRJANAS, SERENA RITCHIE, MARCUS MORLEY, ELLIOT LAVERS, GINA SAHOTA, OLIVIER CASSARO, TRACY NGUYEN, NOZUKO MKETO, DANIEL GOCHER, AADESH GOSRANI, ANDREA BARBERIS, RACHEL MADEIROS-MHENDE
THE ONGOING SUPPORT OF AODP’S FUNDERS IS ACKNOWLEDGED. A FULL LIST CAN BE FOUND ON OUR WEBSITE.
THE VIEWS IN THIS REPORT REMAIN THOSE OF AODP.
DIGGINGDEEPER

The AODP is an independent global not-for-profit organisation that recognises the specific financial risk attributes of climate change. While rigorously challenging the asset owners we rate, AODP’s ultimate goal is to press for improved accountability to beneficiaries and support investors to become climate risk mitigation leaders.
We want to change the short-term investment behaviour of the world’s largest insurance companies, pension, sovereign wealth and mutual funds. We want to drive them to manage the long-term risks of climate change through active engagement with fossil fuel and other high-carbon companies and redirect their vast capital towards lower carbon investments.
The AODP has proven that pressure to disclose encourages change in the behaviour of large investors who know that many of their practices are focused on the short term. We drive accountability by challenging reputations through rating the funds and outing hypocrisy, but ultimately being collaborative. Leaders are encouraged to go further, average asset owners are driven to become leaders and life becomes uncomfortable for laggard funds that do not wish to embrace the inevitable transition to a low-carbon economy.
The AODP has a board of senior leaders with investment, risk-management, business, trade union, political, academic and environmental backgrounds, including John Hewson, Bob Litterman, Sharon Burrow and John Connor.
ABOUT AODP
02
KNOWNUNKNOWN
CONTENTS
PREFACE ABOUT AODP 02/EXECUTIVE SUMMARY 03/INSIGHTS AND ANALYSIS 05/CRITERIA 14DATA 21APPENDIX 36NOTES 41

EXECUTIVE SUMMARY
04
The investment world is still a long way from the transparency and risk management practices that are required to avoid a ‘carbon crash’.
Our leaders have their particular strengths, employing a variety of methods, emphasising that there are a number of ways to approach the management of climate risk. Although our leaders are moving at a swifter pace than their peers, there is room for improvement within some of the categories in even the highest rated asset owners.
We have no data on $13.3 trillion managed by the laggard funds, with these asset owners so opaque that basic policies for company governance were not publicly available. Even where some of these documents were available, there is a lack of transparency regarding decarbonisation targets, the filing and supporting of shareholder resolutions, and engagement efforts with companies.
To fund the transition to a low-carbon economy, an estimated $10 trillion or 15 percent of total capital owned by long-term institutional investors needs to be invested in low-carbon assets.
There are standout funds showing leadership in this area: the average for asset owners providing low-carbon investment data is 3.3 percent of portfolio assets under management. However 457 asset owners lack any information on low-carbon investment within their portfolios.
The 10 largest laggards alone invest five times more than the 9 AAA-rated funds. Only $3.7 trillion is under the management of funds rated A or higher, just 11 percent of total index AUM. If just a few of these laggards took positive action on climate change risk and invested more in low-carbon initiatives, the impact they would have would be significant.
Finally, in what may be the key to understanding asset owners’ poor performance, few incentivise their internal and external agents to manage climate change risk. This is particularly concerning in the pension fund industry, where the liability time horizon is decades into the future. It is little wonder that the vast majority of asset owners are failing to manage this systemic risk given that their management is not directly incentivised to do so.
ASSET OWNERS FIND MANY WAYS TO INNOVATE IN PUSH TO DECARBONISE PORTFOLIOS

06
INSIGHTS AND ANALYSIS
LEADERS’ PERFORMANCE ACROSS THE FIVE CRITERIA
TABLE 01 / THE LEADERS: HIGHEST RANKED FOR OVERALL LONG TERM CLIMATE RISK MANAGEMENT PRACTICES
2015 RATING
2015 OVERALL RANKING
ASSET OWNER NAME TRANSPARENCY RISK MANAGEMENT LOW CARBON INVESTMENT
ACTIVE OWNERSHIP INVESTMENT CHAIN ALIGNMENT
AAA 1 Local Government Super 1 1 1 10 1
AAA 2 Kommunal Landspensjonskasse KLP 5 4 4 8 8
AAA 3 CalPERS 1 9 10 2 4
AAA 4 ABP 21 2 9 5 26
AAA 5 Environment Agency Pension Fund 10 5 3 11 6
AAA 6 New York State Common Retirement Fund (NYSCRF) 37 11 7 1 13
AAA 7 AustralianSuper 1 8 18 12 2
AAA 8 Pensioenfonds Zorg en Welzijn (PFZW) 24 6 5 8 17
AAA 9 Fjärde AP-Fonden (AP4) 31 3 14 16 13
AA 10 General Board of Pension and Health Benefits of the United Methodist Church 7 14 88 7 3
AA 11 Andra AP-Fonden (AP2) 11 7 22 25 8
AA 12 Aviva plc - Insurance 1 33 26 6 16
AA 13 First State Super 8 10 38 29 10
AA 14 California State Teachers' Retirement System (CalSTRS) 21 12 15 19 11
AA 15 VicSuper 8 18 6 32 26
AA 16 Universities Superannuation Scheme 31 21 11 19 12
A 17 CareSuper 5 35 12 27 24
A 18 PKA A/S 59 25 2 17 38
A 19 New York City Employees Retirement System (NYCERS) 59 30 38 3 20
A 20 Teachers' Retirement System of the City of New York (TRS) 59 38 38 4 20
A 21 United Nations Joint Staff Pension Fund 84 12 16 36 20
A 22 Government Pension Fund - Global (GPFG Norway) 42 15 7 49 26
A 23 ERAFP (Etablissement de retraite additionnelle de la Fonction Publique) 11 28 58 19 13
A 24 Allianz SE 59 22 18 45 5

INSIGHTS AND ANALYSIS FIGURE 01 / 2015 AODP GLOBAL CLIMATE 500 INDEX AAA-RATED LEADERS CATEGORY PERFORMANCE RANK
Local Government Super
Kommunal Landspensjonskasse KLP
CalPERS
ABP
Environment Agency Pension Fund
New York State Common Retirement Fund (NYSCRF)
AustralianSuper
Pensioenfonds Zorg en Welzijn (PFZW)
Fjärde AP-Fonden (APF)
TRANSPARENCY
RANK
INVESTMENT CHAIN ALIGNMENT
ACTIVE OWNERSHIP
RISK MANAGEMENT
LOW CARBON INVESTMENT
1
6
11
16
21
26
31
36
08
LEADERS’ PERFORMANCE ACROSS THE FIVE CRITERIA
The leaders rated A and above cover 11 percent of total index AUM, at $3.7 trillion. The ten largest leaders manage $3.2 trillion.
All AODP 500 leaders have their strengths, performing well across multiple criteria, especially in risk management.
However only three perform consistently in the top ten across all five categories – Australia’s Local Government Super, The Netherland’s KLP and US’s CalPERS, with the UK’s Environment Agency Pension fund very close.

INSIGHTS AND ANALYSIS
10
CRITERIA LEADERBOARDS
TABLE 02 / 2015 AODP GLOBAL CLIMATE 500 CRITERIA LEADERBOARDS
RANK TRANSPARENCY RISK MANAGEMENT LOW-CARBON INVESTMENT ACTIVE OWNERSHIP INVESTMENT CHAIN ALIGNMENT
/01/ Local Government Super (AAA)
Local Government Super (AAA)
Local Government Super (AAA)
New York State Common Retirement Fund (NYSCRF) (AAA)
Local Government Super (AAA)
/02/ CalPERS (AAA)
ABP (AAA)
PKA A/S (A)
CalPERS (AAA)
AustralianSuper (AAA)
/03/ AustralianSuper (AAA)
Fjärde AP-Fonden (AP4) (AAA)
Environment Agency Pension Fund (AAA)
New York City Employees Retirement System (NYCERS) (A)
General Board of Pension and Health Benefits of the United Methodist
Church (AA)
/04/ Aviva plc - Insurance (AA)
Kommunal Landspensjonskasse KLP (AAA)
Kommunal Landspensjonskasse KLP (AAA)
Teachers' Retirement System of the City of New York (TRS) (A)
CalPERS (AAA)
/05/ Kommunal Landspensjonskasse KLP (AAA)
Environment Agency Pension Fund (AAA)
Pensioenfonds Zorg en Welzijn (PFZW) (AAA)
ABP AAA)
Allianz SE (A)
/06/ CareSuper (A)
Pensioenfonds Zorg en Welzijn (PFZW) (AAA)
VicSuper (AA)
Aviva plc - Insurance (AA)
Environment Agency Pension Fund (AAA)
/07/General Board of Pension and Health
Benefits of the United Methodist Church (AA)
Andra AP-Fonden (AP2) (AA)
New York State Common Retirement Fund (NYSCRF) (AAA)
General Board of Pension and Health Benefits of the United Methodist
Church (AA)
BT Financial Group (BBB)
/08/ First State Super (AA)
AustralianSuper (AAA)
Government Pension Fund - Global (GPFG Norway) (A)
Kommunal Landspensjonskasse KLP (AAA)
Kommunal Landspensjonskasse KLP (AAA)
/09/ VicSuper (AA)
CalPERS (AAA)
ABP (AAA)
Pensioenfonds Zorg en Welzijn (PFZW) (AAA)
Andra AP-Fonden (AP2) (AA)
/10/ Environment Agency Pension Fund (AAA)
First State Super (AA)
CalPERS (AAA)
Local Government Super (AAA)
First State Super (AA)

12
INSIGHTS AND ANALYSIS FIGURE 02 / A LARGE GAP BETWEEN LEADERS AND LAGGARDS ACROSS ALL RATINGS CRITERIA
ASSET OWNER RANKING
CR
ITER
IA S
CO
RE
1 10 100
0
50
100
150
200
250
LOW CARBON INVESTMENTTRANSPARENCYCRITERIA SCORES RISK MANAGEMENT ACTIVE OWNERSHIP INVESTMENT CHAIN ALIGNMENT

01 / TRANSPARENCY
TABLE 03 / PROXY VOTING TRANSPARENCY
CRITERIA
Transparency illustrates how an asset owner is communicating with its members and how much information it is releasing publicly on their investment strategy and decision-making process.
Seventy-five percent of the leadership group make their voting record publicly available, and this number gradually declines further down the ratings table. Specifically on climate change-related shareholder resolutions, 78 percent of our AAA rated leaders intend to support climate change-related resolutions in the current round of AGMs.
2015 RATING GROUP
PROXY VOTING RECORD PUB-LICLY AVAILABLE
% OF ASSET OWNERS NUMBER IN RATING GROUP
AAA 8 89% 9
AA 7 100% 7
A 3 38% 8
BBB 5 56% 9
BB 7 78% 9
B 2 25% 8
CCC 6 67% 9
CC 3 33% 9
C 2 22% 9
D 23 12% 191
X 0 0% 232
TOTAL 66 13% 500
AODP GLOBAL CLIMATE 500 2015 CRITERIA
14

CRITERIA
02 / RISK MANAGEMENT
Risk management covers how asset owners manage climate change-related risks at the portfolio level and also how they drive fund managers to manage climate risk at the fund and company levels.
This category is a clear differentiator between the leaders and laggards. More than half of the AAA-rated leaders calculate portfolio emissions, and 78 percent assess potential stranded assets in their fossil fuel holdings, and take clear action to mitigate these risks. This compares with just 7 percent and 4 percent respectively for all rated funds.
FIGURE 03 / ASSET OWNERS ASSESSING STRANDED ASSET EXPOSURE FOR FOSSIL FUEL HOLDINGS
16
The range of climate change-related portfolio risk mitigation actions used by funds shows there are many ways to approach this, with a large number of funds using bespoke methods.
FIGURE 04 / CLIMATE CHANGE RELATED PORTFOLIO RISK MITIGATION
Fund manager mandate guidance
An overlay on our core portfolio
Underweighting of specific stocks exposed to carbon risk
Underweighting of specific sectors exposed to carbon risk
Use of carbon optimised equity indexes
Divestment of certain sectors (eg Fossil Fuel Mining companies)
Negative screens (or positive inclusion criteria) on all investments
Negative screens (or positive inclusion criteria) on selected investment options
Hedging allocation of low carbon assets to hedge against high carbon stranded assets
Investment in adaptation assets
Investment in green bonds
Other
NUMBER OF ASSET OWNERS
500 10 20 30 40
LEADERS /
OTHER /
A+
Yes. We have examined the risks and are implementing investment strategies to reduce the risks.
Yes. We have examined the risks and will mitigate our risk through our engagement / proxy voting strategy.
Yes. We have examined the risks but do not intend to take action.
NUMBER OF ASSET OWNERS
100 1 2 3 4 5 6 7 8 9

CRITERIA
03 / LOW-CARBON INVESTMENT
The low-carbon investment criteria assess which funds are investing specifically in low-carbon assets and how. That is, whether or not asset owners are hedging their portfolio against climate change risk by allocating money to low-carbon investments that can expect to be revalued higher as progress towards a low-carbon economy accelerates. Low-carbon investments include investments in renewable energy, agri-business, water and energy efficiency-related assets as well as the service industries supplying to all these sectors.
When it comes to investing in low-carbon assets, 13 percent of asset owners make a specific allocation for climate change-related investments as part of an overall hedging strategy. Again, the leaders pull away from the pack here, with 46 percent of those rated A and above use this tool to reduce the overall exposure to the impacts of climate risk.
There is no evidence to suggest that the 457 funds without information on their portfolio low carbon investment do anything additional to invest in or measure their low-carbon investment beyond the benchmark level that would be held by passive investment. Of the 43 asset owners providing information on their low-carbon investment, the average proportion of their portfolios held in low-carbon assets is 3.3 percent of assets under management.
/ Two funds hold more than 25 percent in low-carbon investment: Kommunal Landspensjonskasse (KLP) (38.7 percent) and Environment Agency Pension Fund (24.4 percent).
FIGURE 05 / ASSET OWNERS LOW CARBON INVESTMENT (% OF TOTAL AUM)
AAA AA A BBB BB B CCC CC C D50%-100%
25%-50%
15%-25%
5%-15%
3%-5%
0%-2%
2%-3%
NUMBER OF ASSET OWNERS
0 5 10 15 20 25 30
18
04 / ACTIVE OWNERSHIP
Active ownership measures how involved an asset owner is with companies it invests in. When an asset owner buys shares in any company it is able to influence the company itself.
Asset owners have a duty to their members to ensure that their investee companies factor long-term climate change risks and other important long-term decisions into their strategy. If they fail to do so they are risking their members’ savings and retirement.
Successful engagement with investee companies and industry is very low – only 4 percent of asset owners have disclosed achievements obtained through actively engaging on climate change related issues. The AAA-rated funds stand out here – with 67 percent citing notable achievements from engagement activities on issues such as stranded asset risk assessment and disclosure, carbon reduction targets and
acknowledging the risks of climate change. While not all engagement leads to success, this proves that a fund can use its influence to effect positive change.
/ It appears that asset owners are engaging more with governments and policymakers rather than the companies that they own, and when they engage they prefer to do so collaboratively.
Twelve percent of asset owners disclose activities in this area. Again our leaders show growing effectiveness in this type of activity – raising awareness and generating discussion pushing for change at a higher level.
FIGURE 06 / ENGAGEMENT WITH POLICYMAKERS AND REGULATORS ON CLIMAGE CHANGE
Yes, lobbying for climate policy through a collaborative industry group
Yes, media articles or comments by executives
Yes, speeches by an executive at industry conferences
Yes, meetings with policy makers
Yes, meetings with regulators
Other
NUMBER OF ASSET OWNERS
450 5 10 15 20 25 30 35 40

CRITERIA
05 / INVESTMENT CHAIN ALIGNMENT
Investment chain alignment means that the actions of asset owners, their advisors and fund managers are consistent with the best interests of the beneficiaries.
Climate change is providing asset owners with a new challenge for driving change in their fund managers. One of the key barriers to this change has been incentive alignment - pension funds members typically have an investment horizon of 40 years whereas fund managers that invest on their behalf are rewarded for performance over a much shorter period of time. Asset owners that rate highly in this area are credited for taking responsibility for their assets and providing a superior service to their members.
Providing long-term incentives or risk penalties to reduce portfolio climate risk exposure is a key tool for seven of nine of the AAA-rated leaders. In the full leadership group, 38 percent of funds use this to incentivise climate risk management performance through the investment chain. Again a large gap between leaders and laggards – only 2.6 percent of the 500 apply this technique to managing climate risk.
FIGURE 07 / NUMBER OF ASSET OWNERS USING LONG TERM INCENTIVES OR RISK PENALTIES TO REDUCE EXPOSURE TO CLIMATE CHANGE RISKS
Fund Executives
Fund / organisation trustees
Investment / portfolio managers
Asset consultant
Other: portfolio managers, executive management, external fund / investment managers
NUMBER OF ASSET OWNERS
90 1 2 3 4 5 6 7 8

THE TEN LARGEST LAGGARDS
TABLE 04 / 2015 AODP GLOBAL CLIMATE 500 TOP TEN LARGEST LAGGARDS (BY AUM)
RANK ASSET OWNER NAME REGION
/01/GOVERNMENT PENSION INVESTMENT FUND (JAPAN)
/02/ JAPAN POST INSURANCE
/03/ ABU DHABI INVESTMENT AUTHORITY
/04/ SAMA FOREIGN HOLDINGS
/05/ SAFE INVESTMENT COMPANY
/06/ KUWAIT INVESTMENT AUTHORITY
/07/ ZENKYOREN
/08/ THRIFT SAVINGS PLAN (TSP)
/09/HONG KONG MONETARY AUTHORITY INVESTMENT PORTFOLIO
/10/ QATAR INVESTMENT AUTHORITY
DATA
22
The ten largest laggard asset owners manage a total of $6.3 trillion or 18 percent of the total assets under management.
This is nearly double the total AUM of the leaders and five times that of our top ten.
Naturally all are rated ‘X’ in the AODP index, the level at which AODP could find nothing at all about how they are managing climate risk.
To put it simply, for every $1 invested by the top ten asset owners, there is $5 invested by the largest laggards.
SECTOR LEADERBOARDS
TABLE 05 / 2015 AODP GLOBAL CLIMATE 500 SECTOR LEADERS
DATA
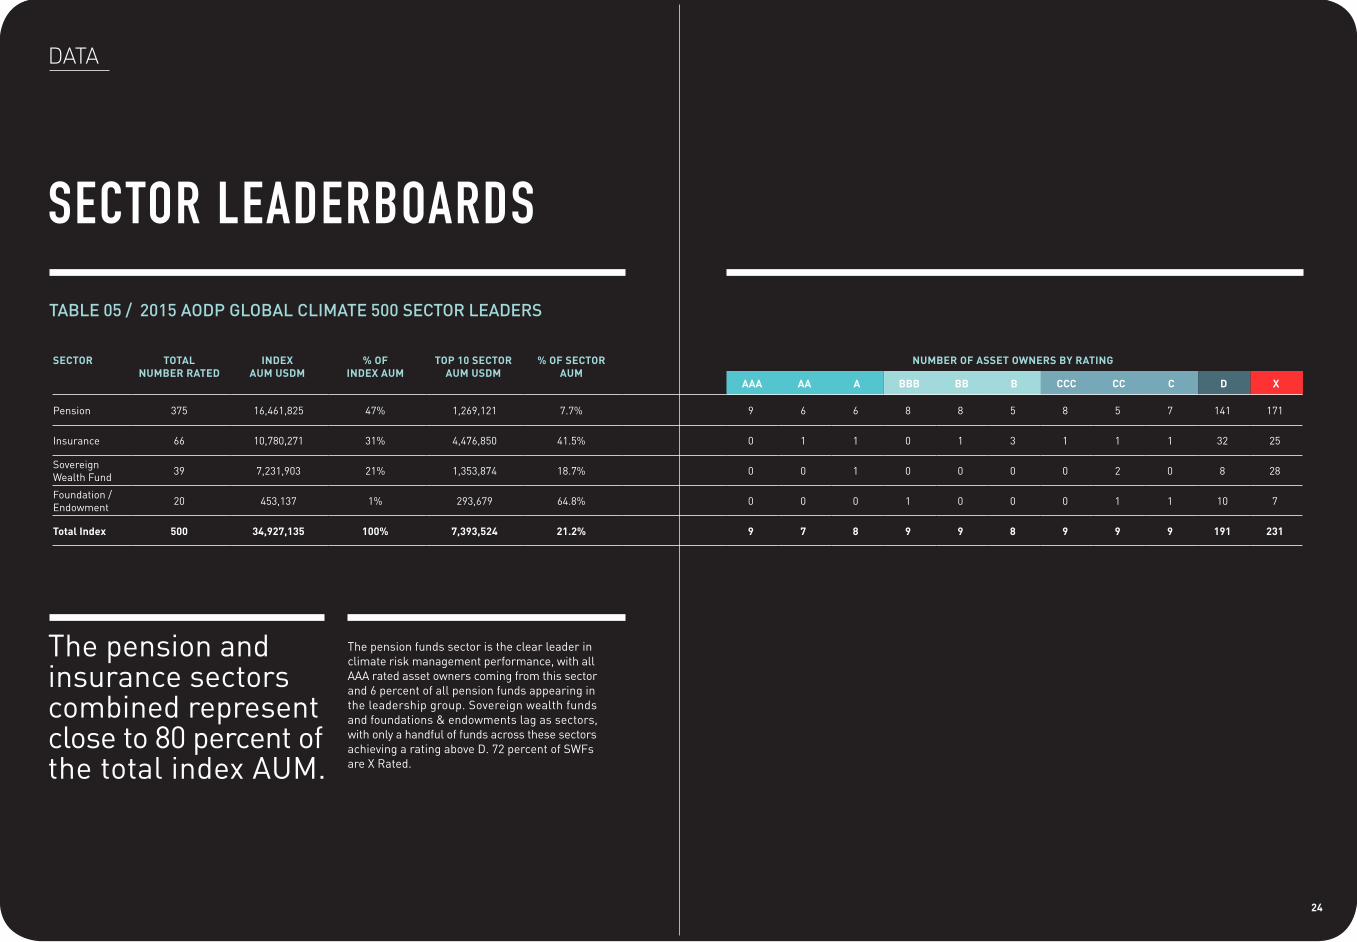
The pension and insurance sectors combined represent close to 80 percent of the total index AUM.
The pension funds sector is the clear leader in climate risk management performance, with all AAA rated asset owners coming from this sector and 6 percent of all pension funds appearing in the leadership group. Sovereign wealth funds and foundations & endowments lag as sectors, with only a handful of funds across these sectors achieving a rating above D. 72 percent of SWFs are X Rated.
06
SECTOR TOTAL NUMBER RATED
INDEX AUM USDM
% OF INDEX AUM
TOP 10 SECTOR AUM USDM
% OF SECTOR AUM
NUMBER OF ASSET OWNERS BY RATING
AAA AA A BBB BB B CCC CC C D X
Pension 375 16,461,825 47% 1,269,121 7.7% 9 6 6 8 8 5 8 5 7 141 171
Insurance 66 10,780,271 31% 4,476,850 41.5% 0 1 1 0 1 3 1 1 1 32 25
Sovereign Wealth Fund 39 7,231,903 21% 1,353,874 18.7% 0 0 1 0 0 0 0 2 0 8 28
Foundation / Endowment 20 453,137 1% 293,679 64.8% 0 0 0 1 0 0 0 1 1 10 7
Total Index 500 34,927,135 100% 7,393,524 21.2% 9 7 8 9 9 8 9 9 9 191 231
24
SECTOR LEADERBOARDS
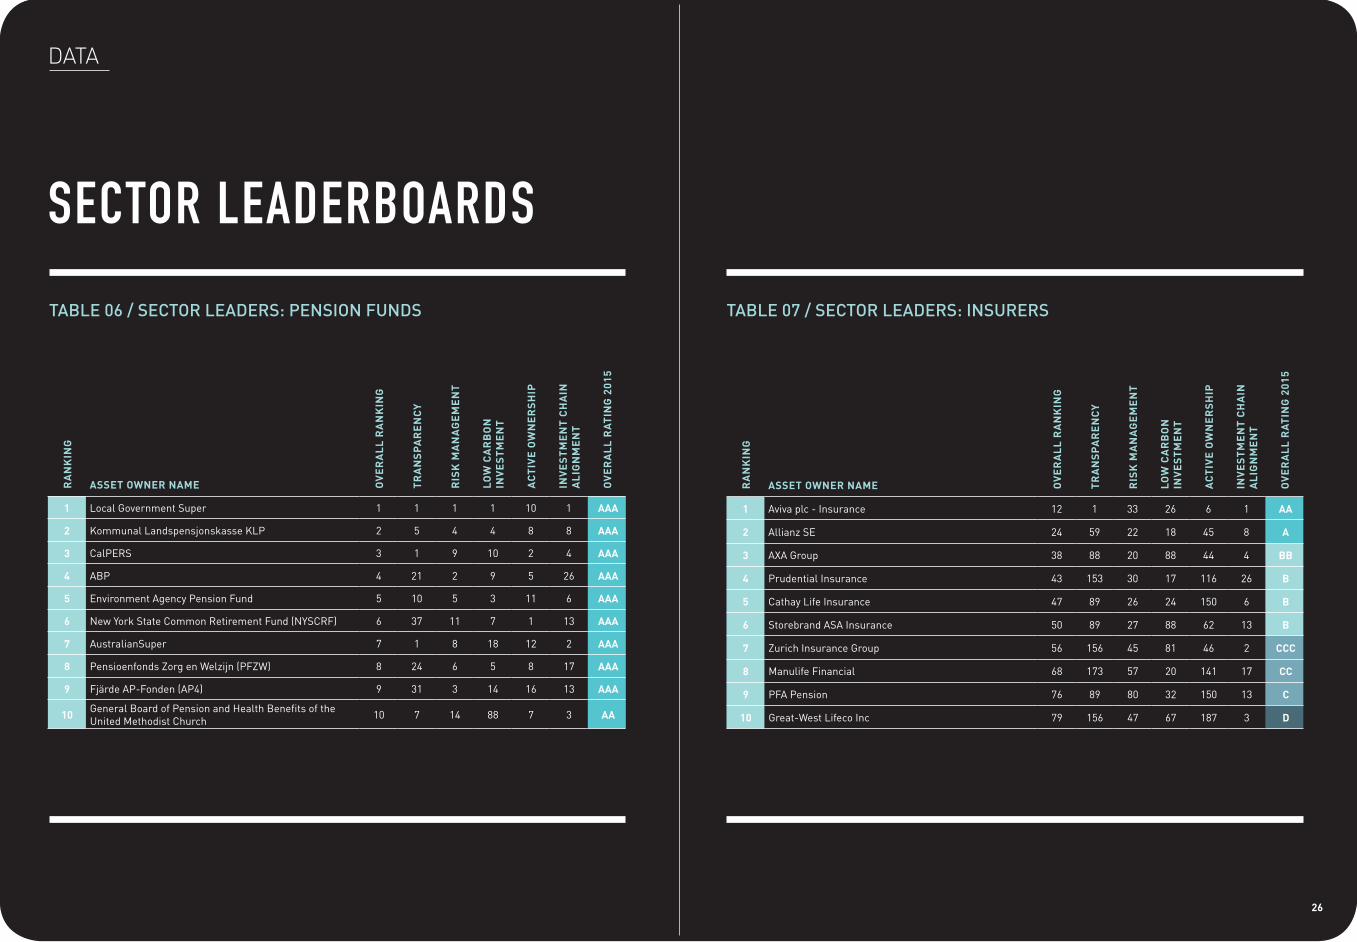
TABLE 06 / SECTOR LEADERS: PENSION FUNDS
DATAR
AN
KIN
G
ASSET OWNER NAME OV
ER
AL
L R
AN
KIN
G
TR
AN
SP
AR
EN
CY
RIS
K M
AN
AG
EM
EN
T
LOW
CA
RB
ON
IN
VE
ST
ME
NT
AC
TIV
E O
WN
ER
SH
IP
INV
ES
TM
EN
T C
HA
IN
AL
IGN
ME
NT
OV
ER
AL
L R
AT
ING
201
5
1 Local Government Super 1 1 1 1 10 1 AAA
2 Kommunal Landspensjonskasse KLP 2 5 4 4 8 8 AAA
3 CalPERS 3 1 9 10 2 4 AAA
4 ABP 4 21 2 9 5 26 AAA
5 Environment Agency Pension Fund 5 10 5 3 11 6 AAA
6 New York State Common Retirement Fund (NYSCRF) 6 37 11 7 1 13 AAA
7 AustralianSuper 7 1 8 18 12 2 AAA
8 Pensioenfonds Zorg en Welzijn (PFZW) 8 24 6 5 8 17 AAA
9 Fjärde AP-Fonden (AP4) 9 31 3 14 16 13 AAA
10 General Board of Pension and Health Benefits of the United Methodist Church 10 7 14 88 7 3 AA
06
TABLE 07 / SECTOR LEADERS: INSURERS
RA
NK
ING
ASSET OWNER NAME OV
ER
AL
L R
AN
KIN
G
TR
AN
SP
AR
EN
CY
RIS
K M
AN
AG
EM
EN
T
LOW
CA
RB
ON
IN
VE
ST
ME
NT
AC
TIV
E O
WN
ER
SH
IP
INV
ES
TM
EN
T C
HA
IN
AL
IGN
ME
NT
OV
ER
AL
L R
AT
ING
201
5
1 Aviva plc - Insurance 12 1 33 26 6 1 AA
2 Allianz SE 24 59 22 18 45 8 A
3 AXA Group 38 88 20 88 44 4 BB
4 Prudential Insurance 43 153 30 17 116 26 B
5 Cathay Life Insurance 47 89 26 24 150 6 B
6 Storebrand ASA Insurance 50 89 27 88 62 13 B
7 Zurich Insurance Group 56 156 45 81 46 2 CCC
8 Manulife Financial 68 173 57 20 141 17 CC
9 PFA Pension 76 89 80 32 150 13 C
10 Great-West Lifeco Inc 79 156 47 67 187 3 D
26

SECTOR LEADERBOARDS
TABLE 08 / SECTOR LEADERS: SOVEREIGN WEALTH FUNDS
DATAR
AN
KIN
G
ASSET OWNER NAME OV
ER
AL
L R
AN
KIN
G
TR
AN
SP
AR
EN
CY
RIS
K M
AN
AG
EM
EN
T
LOW
CA
RB
ON
IN
VE
ST
ME
NT
AC
TIV
E O
WN
ER
SH
IP
INV
ES
TM
EN
T C
HA
IN
AL
IGN
ME
NT
OV
ER
AL
L R
AT
ING
201
5
1 Government Pension Fund - Global (GPFG Norway) 22 42 15 7 49 26 A
2 New Zealand Superannuation Fund 59 89 72 36 52 70 CC
3 Caisse des Dépôts 65 156 60 51 53 70 CC
4 Government Pension Fund Norway (GPFN) 96 153 65 88 116 70 D
5 Future Fund 97 115 113 88 116 43 D
6 Ireland Strategic Investment Fund (ISIF) (previously National Pensions Reserve Fund) 112 43 145 88 116 114 D
7 Retail Employees Superannuation Trust (REST) 114 65 145 88 150 84 D
8 State Oil Fund of the Republic of Azerbaijan 117 176 67 51 229 114 D
9 Korea Investment Corporation 181 115 145 88 229 114 D
10 New Mexico State Investment Council 210 176 145 88 150 114 D
28
TABLE 09 / SECTOR LEADERS: FOUNDATIONS AND ENDOWMENTS
RA
NK
ING
ASSET OWNER NAME OV
ER
AL
L R
AN
KIN
G
TR
AN
SP
AR
EN
CY
RIS
K M
AN
AG
EM
EN
T
LOW
CA
RB
ON
IN
VE
ST
ME
NT
AC
TIV
E O
WN
ER
SH
IP
INV
ES
TM
EN
T C
HA
IN
AL
IGN
ME
NT
OV
ER
AL
L R
AT
ING
201
5
1 University of California Endowment 25 16 30 86 14 17 BBB
2 Yale University Endowment Fund 63 76 58 88 49 60 CC
3 Stanford University Endowment Fund 73 81 61 88 77 70 C
4 Harvard University Endowment Fund 82 176 70 67 96 48 D
5 Columbia University Endowment Fund 104 84 80 88 77 114 D
6 William and Flora Hewlett Foundation 149 176 92 88 104 100 D
7 University of Texas Endowment Fund 181 115 145 88 229 114 D
8 Ford Foundation 181 115 145 88 229 114 D
9 Stichting INGKA Foundation 181 176 145 88 150 100 D
10 Li Ka Shing Foundation 204 176 145 78 229 114 D

REGION LEADERBOARDS
TABLE 10 / 2015 AODP GLOBAL CLIMATE 500 REGION LEADERS
DATA
Europe has the highest number of top performing asset owners.
Eight percent of European-based funds achieved a rating of A or above, with the top ten representing 20 percent of total Regional AUM. 36% of asset owners are rated X.
At the other end of the scale is Middle East and Africa. No asset owners in this region made it to the leaders category, and 80 percent are rated X.
30
REGION TOTAL NUMBER RATED
TOTAL REGIONAL AUM USDM
TOP 10 REGIONAL AUM USDM
AUM COVERAGE NUMBER OF ASSET OWNERS BY RATING
AAA AA A BBB BB B CCC CC C D X
Europe 151 10,697,335 2,157,649 20% 5 3 4 1 4 2 5 4 7 61 55
Americas 241 11,172,943 1,540,120 14% 2 2 3 5 2 4 3 4 2 92 121
Asia-Pacific 88 10,277,227 249,979 2% 2 2 1 2 3 2 1 1 0 35 39
Middle East & Africa 20 2,779,630 148,751 5% 0 0 0 1 0 0 0 0 0 3 16
Total Disclosers 500 34,927,135 4,096,499 12% 9 7 8 9 9 8 9 9 9 191 231
REGION LEADERBOARDS
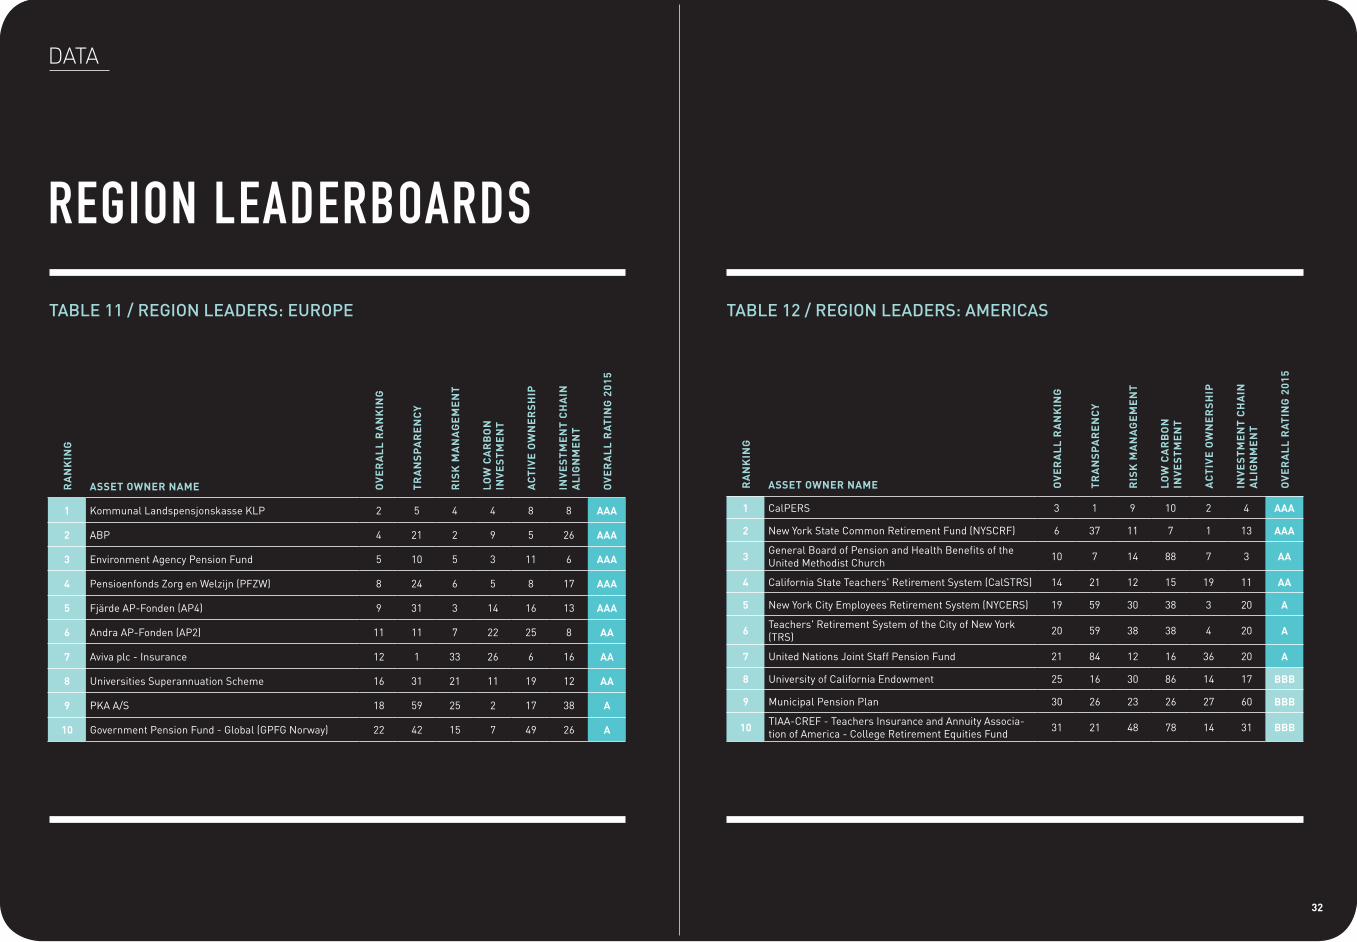
TABLE 11 / REGION LEADERS: EUROPE
DATAR
AN
KIN
G
ASSET OWNER NAME OV
ER
AL
L R
AN
KIN
G
TR
AN
SP
AR
EN
CY
RIS
K M
AN
AG
EM
EN
T
LOW
CA
RB
ON
IN
VE
ST
ME
NT
AC
TIV
E O
WN
ER
SH
IP
INV
ES
TM
EN
T C
HA
IN
AL
IGN
ME
NT
OV
ER
AL
L R
AT
ING
201
5
1 Kommunal Landspensjonskasse KLP 2 5 4 4 8 8 AAA
2 ABP 4 21 2 9 5 26 AAA
3 Environment Agency Pension Fund 5 10 5 3 11 6 AAA
4 Pensioenfonds Zorg en Welzijn (PFZW) 8 24 6 5 8 17 AAA
5 Fjärde AP-Fonden (AP4) 9 31 3 14 16 13 AAA
6 Andra AP-Fonden (AP2) 11 11 7 22 25 8 AA
7 Aviva plc - Insurance 12 1 33 26 6 16 AA
8 Universities Superannuation Scheme 16 31 21 11 19 12 AA
9 PKA A/S 18 59 25 2 17 38 A
10 Government Pension Fund - Global (GPFG Norway) 22 42 15 7 49 26 A
TABLE 12 / REGION LEADERS: AMERICAS
RA
NK
ING
ASSET OWNER NAME OV
ER
AL
L R
AN
KIN
G
TR
AN
SP
AR
EN
CY
RIS
K M
AN
AG
EM
EN
T
LOW
CA
RB
ON
IN
VE
ST
ME
NT
AC
TIV
E O
WN
ER
SH
IP
INV
ES
TM
EN
T C
HA
IN
AL
IGN
ME
NT
OV
ER
AL
L R
AT
ING
201
5
1 CalPERS 3 1 9 10 2 4 AAA
2 New York State Common Retirement Fund (NYSCRF) 6 37 11 7 1 13 AAA
3 General Board of Pension and Health Benefits of the United Methodist Church 10 7 14 88 7 3 AA
4 California State Teachers' Retirement System (CalSTRS) 14 21 12 15 19 11 AA
5 New York City Employees Retirement System (NYCERS) 19 59 30 38 3 20 A
6 Teachers' Retirement System of the City of New York (TRS) 20 59 38 38 4 20 A
7 United Nations Joint Staff Pension Fund 21 84 12 16 36 20 A
8 University of California Endowment 25 16 30 86 14 17 BBB
9 Municipal Pension Plan 30 26 23 26 27 60 BBB
10 TIAA-CREF - Teachers Insurance and Annuity Associa-tion of America - College Retirement Equities Fund 31 21 48 78 14 31 BBB
32

REGION LEADERBOARDS
TABLE 13 / REGION LEADERS: ASIA PACIFIC
DATAR
AN
KIN
G
ASSET OWNER NAME OV
ER
AL
L R
AN
KIN
G
TR
AN
SP
AR
EN
CY
RIS
K M
AN
AG
EM
EN
T
LOW
CA
RB
ON
IN
VE
ST
ME
NT
AC
TIV
E O
WN
ER
SH
IP
INV
ES
TM
EN
T C
HA
IN
AL
IGN
ME
NT
OV
ER
AL
L R
AT
ING
201
5
1 Local Government Super 1 1 1 1 10 1 AAA
2 AustralianSuper 7 1 8 18 12 2 AAA
3 First State Super 13 8 10 38 29 10 AA
4 VicSuper 15 8 18 6 32 26 AA
5 CareSuper 17 5 35 12 27 24 A
6 BT Financial Group 27 18 29 88 34 7 BBB
7 HESTA 29 29 17 51 26 29 BBB
8 Cbus Super 38 31 37 31 43 51 BB
9 Equip Super 40 15 41 36 75 57 BB
10 UniSuper 42 39 46 28 68 37 BB
06
TABLE 14 / REGION LEADERS: MIDDLE EAST AND AFRICA
RA
NK
ING
ASSET OWNER NAME OV
ER
AL
L R
AN
KIN
G
TR
AN
SP
AR
EN
CY
RIS
K M
AN
AG
EM
EN
T
LOW
CA
RB
ON
IN
VE
ST
ME
NT
AC
TIV
E O
WN
ER
SH
IP
INV
ES
TM
EN
T C
HA
IN
AL
IGN
ME
NT
OV
ER
AL
L R
AT
ING
201
5
1 Government Employees Pension Fund (GEPF) 25 20 18 32 42 20 BBB
2 Sanlam Life Insurance Limited 109 105 104 88 141 57 D
3 Transnet Retirement Fund 232 176 145 88 187 114 D
4 Bahrain Mumtalakat Holding Company (Mumtalakat) 232 176 145 88 187 114 D
Remainder of Asset Owners are rated X X
34
APPENDIX: RATINGS CRITERIA IN DETAIL
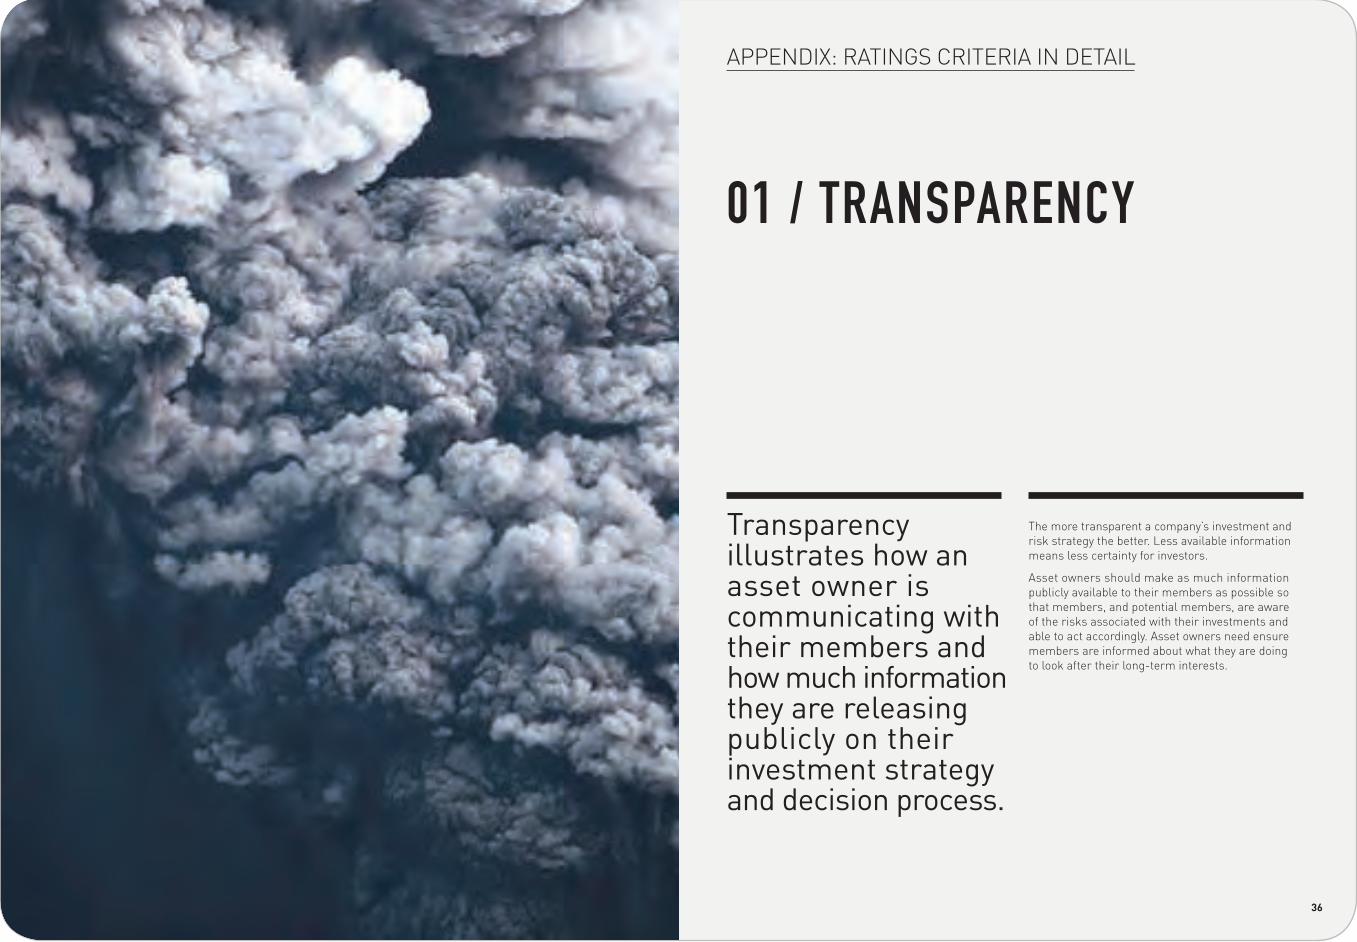
Transparency illustrates how an asset owner is communicating with their members and how much information they are releasing publicly on their investment strategy and decision process.
The more transparent a company’s investment and risk strategy the better. Less available information means less certainty for investors.
Asset owners should make as much information publicly available to their members as possible so that members, and potential members, are aware of the risks associated with their investments and able to act accordingly. Asset owners need ensure members are informed about what they are doing to look after their long-term interests.
01 / TRANSPARENCY
36

Low-carbon investments include investments in renewable energy, agri-business, water and energy efficiency-related assets as well as the service industries supplying to all these sectors.
The low-carbon investment criteria assess which funds are investing in low-carbon assets. That is, whether or not asset owners are hedging their portfolio against climate change risk by allocating money to low-carbon investments. Hedging the climate risk of a portfolio means asset owners have a diversified range of assets that will not all be affected by any rapid re-pricing of carbon. By holding a significant portion of their portfolio in high-carbon assets they are putting themselves at a huge as carbon regulation increases.
Within a typical diversified portfolio, the portion of carbon-exposed assets could be well over 50% and, with tightening carbon regulation, the majority of these are likely to be replaced by low-carbon equivalents. If the high-carbon assets are replaced at the end of their scheduled life then there is little net cost involved.
However, they will most likely have to be sold or closed well before the end of their scheduled life, many of them having lives of 25 years or more. For asset owners to avoid exposure to this situation they need to ensure a healthy balance of low-carbon assets building up in the portfolio which will benefit from tightening carbon regulation.
03 / LOW-CARBON INVESTMENT
APPENDIX: RATINGS CRITERIA IN DETAIL
38
Risk management covers how asset owners manage climate change-related risks at the portfolio level and also how they drive their fund managers to manage climate risk at the fund and company levels.
Asset owners need to assess long-term risks and take an evidence-based view of possible and likely future carbon regulation and physical impacts and factor these into investment decisions.
A robust risk management approach is imperative in order to manage the long-term risks associated with climate change. High-carbon assets are commonly capital-intensive and very long-lived. Whether you are developing a coal mine or building a power station, smelting plant or a building, these are assets that last 25 years, often more. Climate change regulation and, in some instances, physical impacts will affect a significant portion of these high-carbon, long-term assets and this therefore poses a huge risk to asset owners whose investment portfolios contain exposure to them.
02 / RISK MANAGEMENT
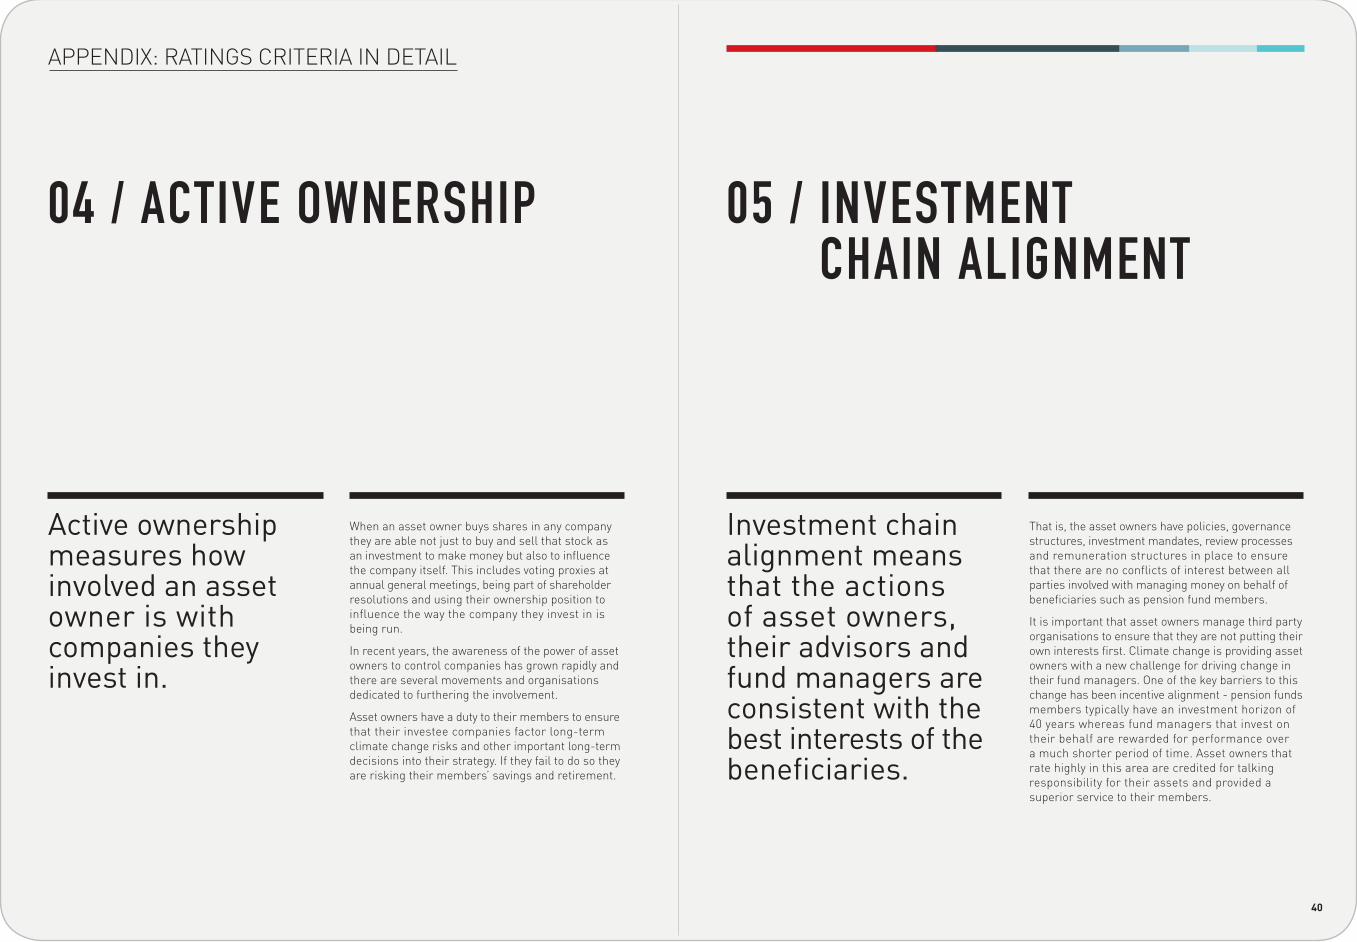
Investment chain alignment means that the actions of asset owners, their advisors and fund managers are consistent with the best interests of the beneficiaries.
That is, the asset owners have policies, governance structures, investment mandates, review processes and remuneration structures in place to ensure that there are no conflicts of interest between all parties involved with managing money on behalf of beneficiaries such as pension fund members.
It is important that asset owners manage third party organisations to ensure that they are not putting their own interests first. Climate change is providing asset owners with a new challenge for driving change in their fund managers. One of the key barriers to this change has been incentive alignment - pension funds members typically have an investment horizon of 40 years whereas fund managers that invest on their behalf are rewarded for performance over a much shorter period of time. Asset owners that rate highly in this area are credited for talking responsibility for their assets and provided a superior service to their members.
05 / INVESTMENT CHAIN ALIGNMENT
APPENDIX: RATINGS CRITERIA IN DETAIL
Active ownership measures how involved an asset owner is with companies they invest in.
When an asset owner buys shares in any company they are able not just to buy and sell that stock as an investment to make money but also to influence the company itself. This includes voting proxies at annual general meetings, being part of shareholder resolutions and using their ownership position to influence the way the company they invest in is being run.
In recent years, the awareness of the power of asset owners to control companies has grown rapidly and there are several movements and organisations dedicated to furthering the involvement.
Asset owners have a duty to their members to ensure that their investee companies factor long-term climate change risks and other important long-term decisions into their strategy. If they fail to do so they are risking their members’ savings and retirement.
04 / ACTIVE OWNERSHIP
40

RANKING
W W W. A O D P R O J E C T. N E T
The AODP survey also ranks each asset owner on the basis of its score.
COPIES OF THE AODP 2015 SURVEY AND THE SURVEY METHODOLOGY AREAVAILABLE ON THE AODP WEBSITE
RATINGOnce the asset owners are ranked, a comparative rating is awarded to each asset owner. The AODP rating system is a unique feature of the AODP survey. The larger survey meant that the benchmarks for all categories in the AODP rating system were raised for the 2015 survey.
42
NOTES
THE AODP RATINGS METHODOLOGY
LOW-CARBON INVESTMENT
The Asset Owners Disclosure Project (AODP) 2015 Global Climate 500 Index is built from data acquired directly from the largest asset owners which are invited to respond to the survey and by a research team using publicly available information.
The AODP research team use the collected data to score and rank the funds according to the AODP ratings methodology which uses multiple data sets across five main aspects of an asset owner’s climate change performance:
1. TRANSPARENCY2. RISK MANAGEMENT3. LOW-CARBON INVESTMENT4. ACTIVE OWNERSHIP5. INCENTIVE CHAIN ALIGNMENT
Using all available data, the AODP ratings team then rated the 500 largest of the 1000 asset owners invited to respond to the survey. In 2015, the 500 asset owners surveyed comprised:
/ 375 PENSION OR SUPERANNUATION FUNDS;/ 66 INSURANCE COMPANIES; / 39 SOVEREIGN WEALTH FUNDS; / 20 ENDOWMENTS, TRUSTS OR FOUNDATIONS

WWW.AODPROJECT.NET


![INDEX 2015/ [aodproject.net]aodproject.net/.../AODP-GLOBAL-CLIMATE-INDEX-2015-view.pdfincluding pension funds, sovereign wealth funds, insurance companies, foundations and endowments](https://img.dokumen.tips/doc/110x75/5f0cdefc7e708231d4378b3b/index-2015-including-pension-funds-sovereign-wealth-funds-insurance-companies.jpg)