Embed Size (px)
Citation preview

Review
Dietary Nitrates, Nitrites, and Nitrosamines Intakeand the Risk of Gastric Cancer: A Meta-Analysis
Peng Song 1,†, Lei Wu 2,† and Wenxian Guan 1,*
Received: 22 September 2015; Accepted: 16 November 2015; Published: 1 December 2015
1 Department of General Surgery, Nanjing Drum Tower Hospital, The Affiliated Hospital of NanjingUniversity Medical School, Nanjing 210008, China; [email protected]
2 Department of Laboratory Medicine, The First Affiliated Hospital of Nanjing Medical University,Nanjing 210029, China; [email protected]
* Correspondence: [email protected]; Tel.: +25-681-82098† These authors contributed equally to this work.
Abstract: The potential associations between dietary consumption of nitrates, nitrites, andnitrosamines and gastric cancer risk have been investigated by several studies, but yieldedinconclusive results. We conducted a meta-analysis to provide a quantitative assessment of theirrelationships. Relevant articles were identified by a systematic literature searching of PubMedand Embase databases prior to August 2015. Random-effects models were employed to pool therelative risks. A total of 22 articles consisting of 49 studies—19 studies for nitrates, 19 studiesfor nitrites, and 11 studies for N-nitrosodimethylamine (NDMA)—were included. The summaryrelative risk of stomach cancer for the highest categories, compared with the lowest, was 0.80 (95%confidence interval (CI), 0.69–0.93) for dietary nitrates intake, 1.31 (95% CI, 1.13–1.52) for nitrites, and1.34 (95% CI, 1.02–1.76) for NDMA (p for heterogeneity was 0.015, 0.013 and <0.001, respectively).The study type was found as the main source of heterogeneity for nitrates and nitrites. Theheterogeneity for NDMA could not be eliminated completely through stratified analysis. Althoughsignificant associations were all observed in case-control studies, the cohort studies still showeda slight trend. The dose-response analysis indicated similar results as well. High nitrates intakewas associated with a weak but statistically significant reduced risk of gastric cancer. Whereasincreased consumption of nitrites and NDMA seemed to be risk factors for cancer. Due to the lackof uniformity for exposure assessment across studies, further prospective researches are warrantedto verify these findings.
Keywords: diet; nitrates; nitrites; nitrosamines; gastric cancer
1. Introduction
Over recent decades, the incidence and mortality rate of gastric cancer showed a modest declineglobally. In 2012, an estimated almost one million new stomach cancer cases and 700,000 deathsoccurred, making it the fifth most common malignancy and the third leading cause of cancer relateddeaths worldwide [1]. Nearly half of the world’s new cases occurred in Eastern Asia, especially China.Geographic differences were observed in gastric cancer incidence, indicating that some modifiablefactors (e.g., diet) could play a critical role in the etiology of this malignancy [2,3]. Therefore, it is anurgent demand to identify risk factors that can have a marked impact on this disease.
The typical diet in most countries contains nitrates, nitrites, and nitrosamines. Nitrates andnitrites occur naturally in fruit and vegetables, which are regarded as an important part of a healthydiet due to the powerful evidence of beneficial health effects against cancer [4,5]. In the same time,nitrates and nitrites are often used as food additives in processed meats such as ham, bacon, sausages,
Nutrients 2015, 7, 9872–9895; doi:10.3390/nu7125505 www.mdpi.com/journal/nutrients
Nutrients 2015, 7, 9872–9895
and hot dogs, to retard microbial spoilage, and preserve meat products recognizable appearance andflavor as well. A high consumption of processed meats is linked to an increased gastric cancer risk,and many people consider nitrates/nitrites as the main reason for that [6]. Nitrosamines are producedby chemical reactions of nitrates, nitrites and other proteins. N-nitrosodimethylamine (NDMA) isone of the most frequently occurring nitrosamines in our dietary foods [7,8]. NDMA is a potentcarcinogen, capable of inducing malignant tumors in various animal species in a variety of tissues,including liver, lung, and stomach [9,10].
So far, numerous epidemiologic studies have been published which attempted to assess thepotential risk of gastric cancer about the dietary nitrates, nitrites, and nitrosamines intake, butyielded discrepant findings. It would be of interest to evaluate, on the basis of current epidemiologicdata, whether consumption of nitrates, nitrites, and NDMA had an effect on gastric carcinogenesis.To clarify their relations, we systematically reviewed all the available evidence and conducted ameta-analysis.
2. Methods
2.1. Literature Search and Selection
We searched PubMed and Embase databases through August 2015 using the following searchterms: (1) nitrate AND (gastric cancer OR stomach cancer); (2) nitrite AND (gastric cancer ORstomach cancer); and (3) (nitrosamine OR N-nitrosodimethylamine OR NDMA) AND (gastric cancerOR stomach cancer). The manual search was supplemented by scrutinizing the reference lists fromthose retrieved articles to identify any relevant studies.
For inclusion, the study must meet the following criteria: (1) cohort or case-control design;(2) exposure of interest was dietary nitrates, nitrites, and NDMA intake; (3) the endpoint of interestwas gastric cancer; (4) risk estimates with corresponding 95% confidence intervals (95% CIs) wereprovided; (5) published in English. When study populations were overlapped or duplicated in somestudies, we chose the most complete and suitable research. Three authors evaluated the retrievedliterature and any discrepancy was resolved through discussion.
2.2. Data Extraction and Quality Assessment
Two investigators using a standardized form to extract the following characteristicsindependently: first author’s name, publication year, population information, study location andperiod, sample size, follow-up years, nitrates and nitrites and NDMA intake assessment, and relativerisk (RR)/hazard ratio (HR)/odds ratio (OR) with 95% CI from the most fully adjusted model foreach category.
Quality of the included studies was assessed using Newcastle-Ottawa Scale (NOS) with a scoreranging from 0 to 9 [11]. Each study was evaluated based on three aspects: selection, comparability,and assessment of outcome or ascertainment of exposure. Studies with score ě 7 were defined asbeing of high quality.
2.3. Statistical Analysis
RR was used to measure the association between the dietary nitrates, nitrites, and NDMAintake and the risk of stomach cancer. Because the absolute risk of gastric cancer was low, ORand HR approximated the RR [12]. Considering the variations within-study and between-study,a random-effects model was employed to calculate the summary RR by pooling each study riskestimate. Statistical heterogeneity among studies was assessed with the χ2-based Q and I2 index. Ifthree or more studies were available for the same characteristic, subgroup analyses were conducted.
For the dose-response analysis, we used the method proposed by Orsini et al. to calculate the risktrend [13]. This method required the number of case and control subjects, or cases and person-years,and median level of dietary nitrates or nitrites or NDMA intake for at least three quantitative exposure
9873
Nutrients 2015, 7, 9872–9895
categories. The median or mean consumption of each category was assigned to the correspondingdose of consumption. We assumed that open-ended category had the same amplitude as the aheador behind category. Potential nonlinear association was assessed using restricted cubic splines withfour knots at percentiles 5%, 35%, 65%, and 95% of the distribution. If linear dose-response regressionwith no heterogeneity was detected, we used it directly.
Meta-regression was employed to explore the possible heterogeneity, and study design,geographic area, and publication year were examined in the model. We also undertook sensitivityanalysis to evaluate whether a single study could affect the overall outcome. Publication bias wasassessed by funnel plot, with Egger’s regression asymmetry test and Begg’s adjusted rank correlationtest, and the Duval and Tweedie “trim and fill” method was performed if bias was detected [14]. Allanalyses were completed using STATA version 12.0 (Stata, College Station, TX, USA). A two-sidedp < 0.05 was considered statistically significant.
2.4. Disease Assessment and Dietary Assessment
As indicated above, the scope of this meta-analysis was the association between dietarynitrates/nitrites/NDMA intake and stomach cancer. The cases should be confirmed with reliablemedical records such as surgical, pathology reports or linkage of authoritative tumor registries. Themethods of exposure ascertainment will be extracted, which could vary considerably by the followingfactors: estimates from various food items and based on different food composition databases.
3. Results
3.1. Literature Search and Quality Assessment
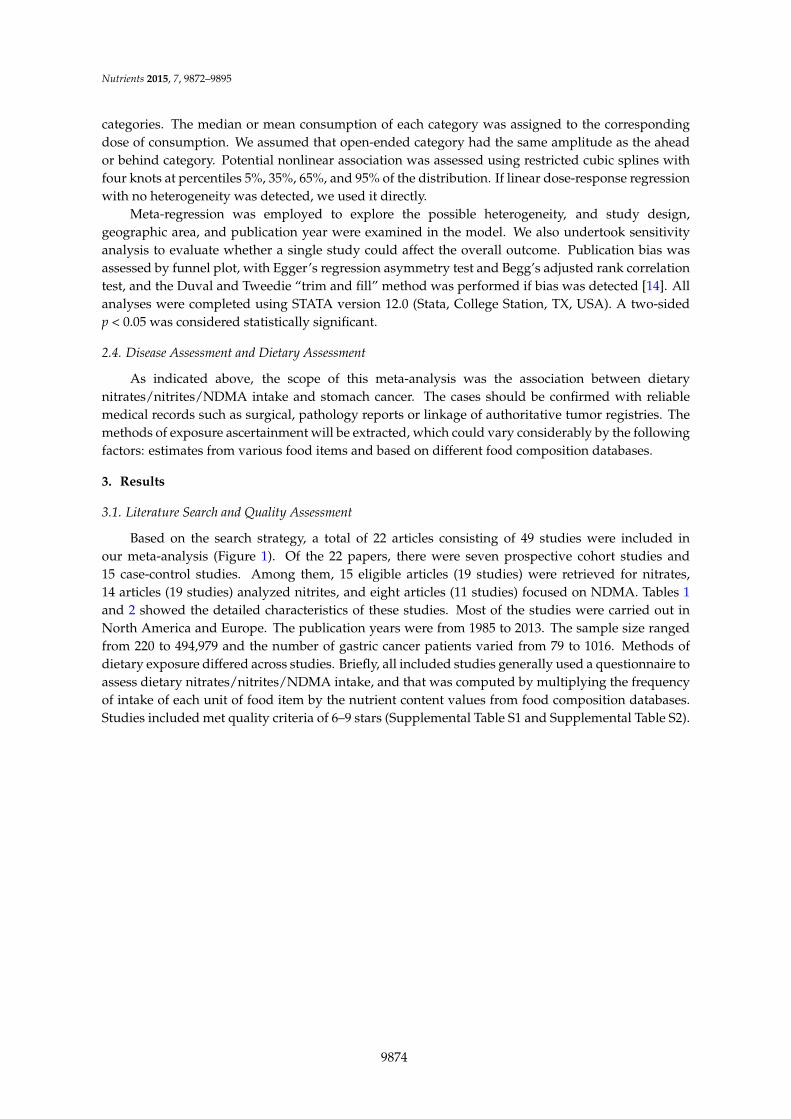
Based on the search strategy, a total of 22 articles consisting of 49 studies were included inour meta-analysis (Figure 1). Of the 22 papers, there were seven prospective cohort studies and15 case-control studies. Among them, 15 eligible articles (19 studies) were retrieved for nitrates,14 articles (19 studies) analyzed nitrites, and eight articles (11 studies) focused on NDMA. Tables 1and 2 showed the detailed characteristics of these studies. Most of the studies were carried out inNorth America and Europe. The publication years were from 1985 to 2013. The sample size rangedfrom 220 to 494,979 and the number of gastric cancer patients varied from 79 to 1016. Methods ofdietary exposure differed across studies. Briefly, all included studies generally used a questionnaire toassess dietary nitrates/nitrites/NDMA intake, and that was computed by multiplying the frequencyof intake of each unit of food item by the nutrient content values from food composition databases.Studies included met quality criteria of 6–9 stars (Supplemental Table S1 and Supplemental Table S2).
9874

Nutrients 2015, 7, 9872–9895
Table 1. Characteristics of prospective cohort studies in the meta-analysis.
FirstAuthor,Year,Location
CohortSize
Follow-up(Years)
No. of Cases(Age/Definition) Intake Assessment Analytical
CategoryDefinition/NutrientContent Values
ConsumptionCategories
Adjusted RR(95% CI) Adjusted Variables
Galanis,1998 [15],Hawaii
5610menand6297women
14.8
108 (NA/form HawaiiTumor Registry, a memberof the Surveillance,Epidemiology, and EndResults (SEER) programof the National CancerInstitute)
short questionnarire(weekly frequencyof intake of 13 foodsand food groups,and the dailyfrequency of intakeof 6 beverages)
Nitratestimes/week
combined frequency ofintake of dried fish, pickledvegetables and processedmeats/based on previouspublished literature
0–3 1.0 (Referent)Age, years ofeducation, Japaneseplace of birth, gender.Analyses among menwere also adjusted forcigarette smoking andalcohol intake status
4–7 1.30 (0.80–2.00)
ě8 0.90 (0.50–1.40)
VanLoon,1998 [16],theNetherlands
1688menand1812women
6.3
282 (mean: 63.0 years, SD:4.1/exclude casesself-reported, in situcarcinoma, or withoutmicroscopicallyconfirmed diagnosis)
150-itemsemiquantitativeFFQ
Nitratesmg/day
derived from vegetables(considered loss duringpreparation) and drinkingwater/from State Institutefor Quality Control ofAgricultural Products solelyon the intake of curedmeat/from TNO Nutritionand Food Research Institute
59.8 1.0 (Referent)
Age, sex, smoking,education, coffeeconsumption, intakeof vitamin C andbeta-carotene, familyhistory of stomachcancer, prevalence ofstomach disorders,use of refrigerator orfreezer
84.7 1.25 (0.84–1.86)
104.4 0.74 (0.47–1.15)
127.3 0.92 (0.59–1.44)
179.8 0.90 (0.53–1.55)
Nitritesmg/day
0.01 1.0 (Referent)
0.04 1.20 (0.78–1.86)
0.09 1.18 (0.77–1.82)
0.16 0.88 (0.56–1.37)
0.35 1.44 (0.95–2.18)
9875

Nutrients 2015, 7, 9872–9895
Table 1. Cont.
FirstAuthor,Year,Location
CohortSize
Follow-up(Years)
No. of Cases(Age/Definition) Intake Assessment Analytical
CategoryDefinition/Nutrient ContentValues
ConsumptionCategories
Adjusted RR(95% CI) Adjusted Variables
Knekt,1999 [17],Finnish
9985menandwomen
24
68 (15–49 years: 18 cases,50–59 years: 28, cases,60–99 years: 22cases/through thenationwide FinnishCancer Registry)
pre-formedqeustionnaire
NitratesQuartiles
derived from vegetables(91.9%)/based on foods tablesin Finland and other countriesin northern Europe
Q1 1.0 (Referent)
Age, sex,municipality,smoking andenergy intake
Q2 1.01 (0.56–1.84)
Q3 0.52 (0.25–1.08)
Q4 0.56 (0.27–1.18)
NitritesQuartiles
derived mainly from curedmeats and sausages(94.2%)/based on foods tablesin Finland and other countriesin northern Europe
Q1 1.0 (Referent)
Q2 1.10 (0.58–2.11)
Q3 1.88 (1.01–3.49)
Q4 0.71 (0.28–1.78)
NDMAQuartiles
derived from smoked and saltedfish (51.9%), cured meats andsusages(48.1%)/based on foodstables in Finland and othercountries in northern Europe
Q1 1.0 (Referent)
Q2 1.03 (0.55–1.95)
Q3 0.78 (0.39–1.56)
Q4 0.75 (0.37–1.51)
Jakszyn,2006 [8],European
153,447menand368,010women
6.6314 (mean: 59.2 years, SD:7.48/confirmed by apanel of pathologists)
country-specificvalidatedquestionnaires
NDMATertiles
matched food items on thecountry-specific questionnaireswith a food database ofpotential carcinogens/based oncountry-specific values
T1T2T3
1.0 (Referent) Full cohort analysis:stratified center andage. Sex, height,weight, educationlevel, tobaccosmoking, cigarettesmoking intensity,work and leisurephysical activity,citrus andnon-citrus fruitsintake, vegetablesintake, energyintake and nitrites
0.87 (0.64–1.20)
0.99 (0.69–1.41)
Cardia
1.0 (Referent)
0.74 (0.41–1.34)
0.68 (0.34–1.37)
Non-cardia
1.0 (Referent)
1.04 (0.66–1.63)
1.09 (0.65–1.81)
9876

Nutrients 2015, 7, 9872–9895
Table 1. Cont.
FirstAuthor,Year,Location
CohortSize
Follow-up(Years)
No. of Cases(Age/Definition) Intake Assessment Analytical
CategoryDefinition/NutrientContent Values
ConsumptionCategories
Adjusted RR(95% CI) Adjusted Variables
Larsson,2006 [18],Sweden
61,433women 18
156 (NA/through linkageof the study populationwith the national andregional Swedish Cancerregisters)
67-item FFQ (before1997) 97-item FFQ(after 1997)
NDMAµg/day
estimated by matchingquestionnaire fooditems/based on foods tableson the Swedish market
<0.041 1.0 (Referent) Age, education,body mass index,intakes of totalenergy, alcohol,fruits andvegetables
0.041–0.078 1.03 (0.61–1.77)0.079–0.120 1.66 (1.00–2.75)0.121–0.193 1.60 (0.93–2.76)ě0.194 1.96 (1.08–3.58)
Cross,2011 [19],USA
295,305menand199,674women
10532 (NA/throughprobabilistic linkage withstate cancer registries)
124-item FFQ
Nitratesµg/1000kcals
derived from processedmeats/using a database ofmeasured values from tentypes of processed meats inUS
24.266.9112.7174.5298.0
Cardia
Age, education, sex,BMI, ethnicity,smoking, alcoholdrinking, physicalactivity daily intakeof fruits ,vegetables,saturated fat andcalories
1.0 (Referent)1.17 (0.77–1.77)0.64 (0.40–1.02)0.94 (0.61–1.45)0.81 (0.52–1.25)Non-cardia1.0 (Referent)0.90 (0.60–1.35)0.89 (0.59–1.33)0.91 (0.61–1.37)1.04 (0.69–1.55)
Nitritesµg/1000kcals
processed meats/using adatabase of measuredvalues from ten types ofprocessed meats in US
12.134.661.4102.9199.2
Cardia1.0 (Referent)0.72 (0.47–1.11)0.88 (0.58–1.32)0.87 (0.58–1.31)0.71 (0.47–1.08)Non-cardia1.0 (Referent)0.77 (0.51–1.15)0.79 (0.53–1.18)1.04 (0.71–1.52)0.93 (0.63–1.37)
9877

Nutrients 2015, 7, 9872–9895
Table 1. Cont.
FirstAuthor,Year,Location
CohortSize
Follow-up(Years)
No. of Cases(Age/Definition)
IntakeAssessment
AnalyticalCategory
Definition/NutrientContent Values
ConsumptionCategories
Adjusted RR(95% CI) Adjusted Variables
Keszei,2013 [20],theNetherlands
120,852menandwomen
16.3
663 (Women, Cardia,mean: 62.6 years, SD: 4.2;Women, Non-cardia,mean: 62.6 years, SD: 4.3;Men, Cardia, mean: 61.4years, SD: 4.1; Men,Non-cardia, mean: 62.4years, SD: 4.0/throughlinkage to the
questionnaireincluding 150items on food
NitratesTertiles(mg/day)
derived from summingdietary intake (consideredloss during preparation)and nitrate fromwater/based on databank ofthe State Institute forQuality Control ofAgricultural Products
T1: women66.4; men,68.1T2: women,98.5; men100.8T3: women142.7; men146.2
Women, Cardia
Age, smoking status,years of cigarettesmoking, number ofcigarettes smoked perday, total energyintake, BMI, alcoholicintake, vegetableintake, fruit intake,level of education,and nonoccupationalphysical activity
1.0 (Referent)1.01 (0.30–3.42)1.61 (0.32–8.06)Women,Non-cardia1.0 (Referent)0.73 (0.47–1.11)0.78 (0.44–1.39)Men, Cardia1.0 (Referent)1.06 (0.68–1.65)1.01 (0.57–1.77)Men,Non-cardia1.0 (Referent)1.23 (0.90–1.68)1.05 (0.70–1.59)
Netherlands CancerRegistry and theNationwide Network andRegistry of Histo- andCytopathology in theNetherlands)
NitritesTertiles(mg/day)
processed meat/based onanalyses conducted by theNational Public HealthInstitute in 1984
T1: women,0.02; men0.03T2: women,0.08; men0.12T3: women,0.20; men0.28
Women, Cardia
Age, smoking status,years of cigarettesmoking, number ofcigarettes smoked perday, total energyintake, BMI, alcoholicintake, vegetableintake, fruit intake,level of education,and nonoccupationalphysical activity
1.0 (Referent)0.97 (0.36–2.58)0.62 (0.20–1.90)Women,Non-cardia1.0 (Referent)0.94 (0.62–1.41)1.08 (0.71–1.63)Men, Cardia1.0 (Referent)0.80 (0.51–1.27)1.18 (0.75–1.86)Men,Non-cardia1.0 (Referent)1.10 (0.80–1.50)1.23 (0.89–1.70)
9878
Nutrients 2015, 7, 9872–9895
Table 1. Cont.
FirstAuthor,Year,Location
CohortSize
Follow-up(Years)
No. of Cases(Age/Definition)
IntakeAssessment
AnalyticalCategory
Definition/NutrientContent Values
ConsumptionCategories
Adjusted RR(95% CI) Adjusted Variables
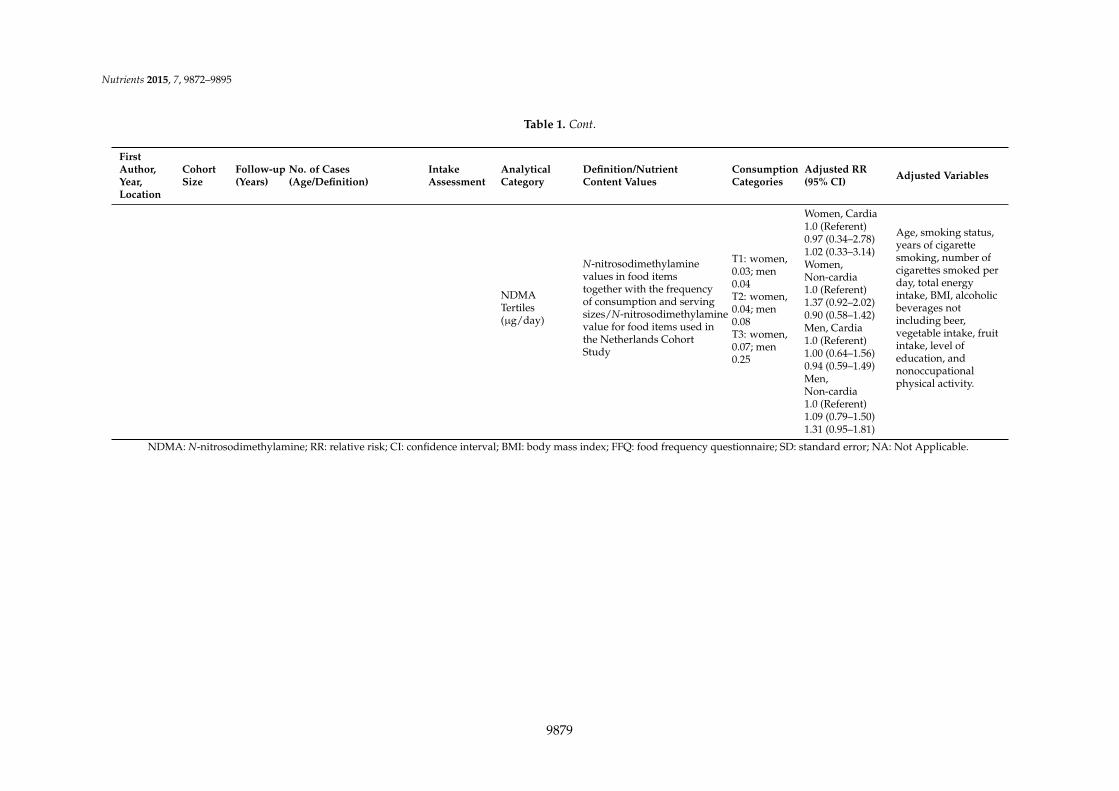
NDMATertiles(µg/day)
N-nitrosodimethylaminevalues in food itemstogether with the frequencyof consumption and servingsizes/N-nitrosodimethylaminevalue for food items used inthe Netherlands CohortStudy
T1: women,0.03; men0.04T2: women,0.04; men0.08T3: women,0.07; men0.25
Women, Cardia
Age, smoking status,years of cigarettesmoking, number ofcigarettes smoked perday, total energyintake, BMI, alcoholicbeverages notincluding beer,vegetable intake, fruitintake, level ofeducation, andnonoccupationalphysical activity.
1.0 (Referent)0.97 (0.34–2.78)1.02 (0.33–3.14)Women,Non-cardia1.0 (Referent)1.37 (0.92–2.02)0.90 (0.58–1.42)Men, Cardia1.0 (Referent)1.00 (0.64–1.56)0.94 (0.59–1.49)Men,Non-cardia1.0 (Referent)1.09 (0.79–1.50)1.31 (0.95–1.81)
NDMA: N-nitrosodimethylamine; RR: relative risk; CI: confidence interval; BMI: body mass index; FFQ: food frequency questionnaire; SD: standard error; NA: Not Applicable.
9879

Nutrients 2015, 7, 9872–9895
Table 2. Characteristics of case-control studies in the meta-analysis.
First Author,Year, Location
No. of Cases(Age/Definition)
No. and Typeof Controls
StudyPeriod
IntakeAssessment
AnalyticalCategory
Definition/NutrientContent Values
ConsumptionCategories
Adjusted OR(95% CI)
AdjustedVariables
Risch, 1985 [21],Canada
246 (35–79 years/byprovince-widetumor registries, andsurgical, pathology,and medical records)
246population-based
1979–1982diet frequentquestionnaire
Nitratesmg/day
estimated by matchingFFQ food items/foodcomposition tables weremodified and extendedto Canadian items
NA
1.0 (Referent)
NA0.66 (0.54–0.81)
Nitritesmg/day
1.0 (Referent)
1.71 (1.24–2.37)
Buiatti, 1990[22], Italy
1016 (ď75years/histologicconfirmation)
1159population-based
1985–1987146-itemquestionnaire
Nitratesmg/day
estimated by matchingquestionnaire fooditems/using severalItalian sources
53 1.0 (Referent)
Non-dietaryvariables andkilocalories
81 0.90 (0.70–1.10)
103 0.90 (0.60–1.10)
130 0.70 (0.50–0.90)
193 0.90 (0.70–1.20)
Nitritesmg/day
2.1 1.0 (Referent)
2.8 1.00 (0.80–1.40)
3.4 1.20 (0.90–1.70)
4.1 1.40 (1.00–2.00)
5.9 1.90 (1.30–2.70)
Boeing, 1991[23], Germany
143 (32–80 years/histologicallyconfirmed)
579 hospital-based
1985–198874-itemstandardizedquestionnaire
NitratesQuintiles
estimated by matchingquestionnaire fooditems/German FederalAgency of Nutrition
Q1 1.0 (Referent)
Age, sex, andhospital
Q2 0.93 (0.53–1.64)
Q3 0.61 (0.32–1.19)
Q4 0.61 (0.30–1.27)
Q5 1.26 (0.59–2.70)
Hansson, 1994[24], Sweden
338 (40–79years/histologicallyconfirmed)
679population-based
1989–1992 45-item FFQNitratesmg/day
estimated by matchingFFQ food items(considered loss incooked dishes)/basedon data from severalSwedish sources
23 1.0 (Referent) Age, gender,ascorbic acid,β-carotene. andα-tocopherol
34 0.85 (0.57–1.25)
45 0.99 (0.65–1.52)
69 0.97 (0.60–1.59)
9880

Nutrients 2015, 7, 9872–9895
Table 2. Cont.
First Author,Year, Location
No. of Cases(Age/Definition)
No. and Typeof Controls
StudyPeriod
IntakeAssessment
AnalyticalCategory
Definition/NutrientContent Values
ConsumptionCategories
Adjusted OR(95% CI)
AdjustedVariables
La Vecchia,1994 [25], Italy
723 (19–74years/histologicallyconfirmed)
2024hospital-based 1985–1992
29-itemstandardquestionnaire
Nitratesmg/die
estimated by matchingquestionnaire fooditems/based on Italiantables of foodcomposition
62.95 1.0 (Referent)
Age, sex,education,family historyof gastriccancer, bodymass index, andtotal energyintake
80.70 0.64 (0.49–0.83)
96.33 0.50 (0.38–0.67)
116.88 0.52 (0.39–0.70)
>116.88 0.43 (0.32–0.59)
Nitritesmg/die
1.91 1.0 (Referent)
2.41 0.98 (0.72–1.33)
2.94 0.99 (0.72–1.36)
3.64 1.15 (0.84–1.59)
>3.64 1.35 (0.96–1.88)
Pobel, 1995 [26],France
92 (mean: 66.6 years,SD:10.4/histologicallyconfirmed)
128hospital-based 1985–1988
diet historyquestionnaire
NitratesTertiles derived from dairy
products, meat andeggs, fish, flourproducts, fruit,vegetables,beverages/using acomposition table basedon literature data
T1 1.0 (Referent)
Age, sex,occupation andtotal calorieintake
T2 0.49 (0.24–1.01)
T3 0.76 (0.38–1.50)
NitritesTertiles
T1 1.0 (Referent)
T2 0.83 (0.41–1.67)
T3 0.88 (0.44–1.79)
NDMATertiles
T1 1.0 (Referent)
T2 4.13(0.93–18.27)
T3 7.00(1.85–26.46)
9881

Nutrients 2015, 7, 9872–9895
Table 2. Cont.
FirstAuthor,Year,Location
No. of Cases(Age/Definition)
No. andType ofControls
StudyPeriod
IntakeAssessment
AnalyticalCategory
Definition/Nutrient ContentValues
ConsumptionCategories
Adjusted OR(95% CI) Adjusted Variables
La Vecchia,1995 [27],Italy
746 (19–74years/histologicallyconfirmed)
2053hospital-based
1985–199329-itemstructuredquestionnaire
NDMAµg/day
estimated by matchingquestionnaire fooditems/based Italian survey onselected foods or from otherpublished data
ď0.13 1.0 (Referent)Age, sex, education, familyhistory of gastric cancer,combined food score index,intake of β-carotene, vitamin C,total calories, nitrite and nitrateintake
0.13–0.19 1.11 (0.90–1.40)
>0.19 1.37 (1.10–1.70)
De Stefani,1998 [28],Uruguay
340 (25–84 years/microscopicallyconfirmed)
698hospital-based
1993–1996 FFQNDMAµg/day
derived from fried, broiled, orsalted meat/according toprevious literature data
ď0.14 1.0 (Referent)
Age, sex, residence, urban/ruralstatus, tobacco duration, totalalcohol consumption
0.15–0.18 2.07 (1.36–3.18)
0.19–0.26 3.23 (2.13–4.89)
ě0.27 3.62 (2.38–5.51)
Palli, 2001[29], Italy
382 (<50 years, 30cases; 50–64 years,130 cases;> 64 years, 222cases/histologicallyconfirmed)
561population-based
1985–1987181-itemFFQ
Nitratesmg/day
estimated by matching FFQfood items/based on Italianfood composition tablesestimated by matching FFQfood items/based on Italianfood composition tables
62.6 1.0 (Referent)
Age, sex, social class, familyhistory of gastric cancer, area ofrural residence, BMI, totalenergy and the residuals of eachnutrient of interest.
93.2 0.70 (0.50–1.00)
132.9 0.60 (0.40–0.90)
Nitritesmg/day
2.5 1.0 (Referent)
3.5 1.40 (1.00–2.00)
5.4 1.40 (1.00–2.00)
NDMA
0.12 1.0 (Referent)
0.20 1.10 (0.80–1.60)
0.33 1.10 (0.80–1.50)
9882
Nutrients 2015, 7, 9872–9895
Table 2. Cont.
FirstAuthor,Year,Location
No. of Cases(Age/Definition)
No. andType ofControls
StudyPeriod
IntakeAssessment
AnalyticalCategory
Definition/NutrientContent Values
ConsumptionCategories
Adjusted OR(95% CI) Adjusted Variables
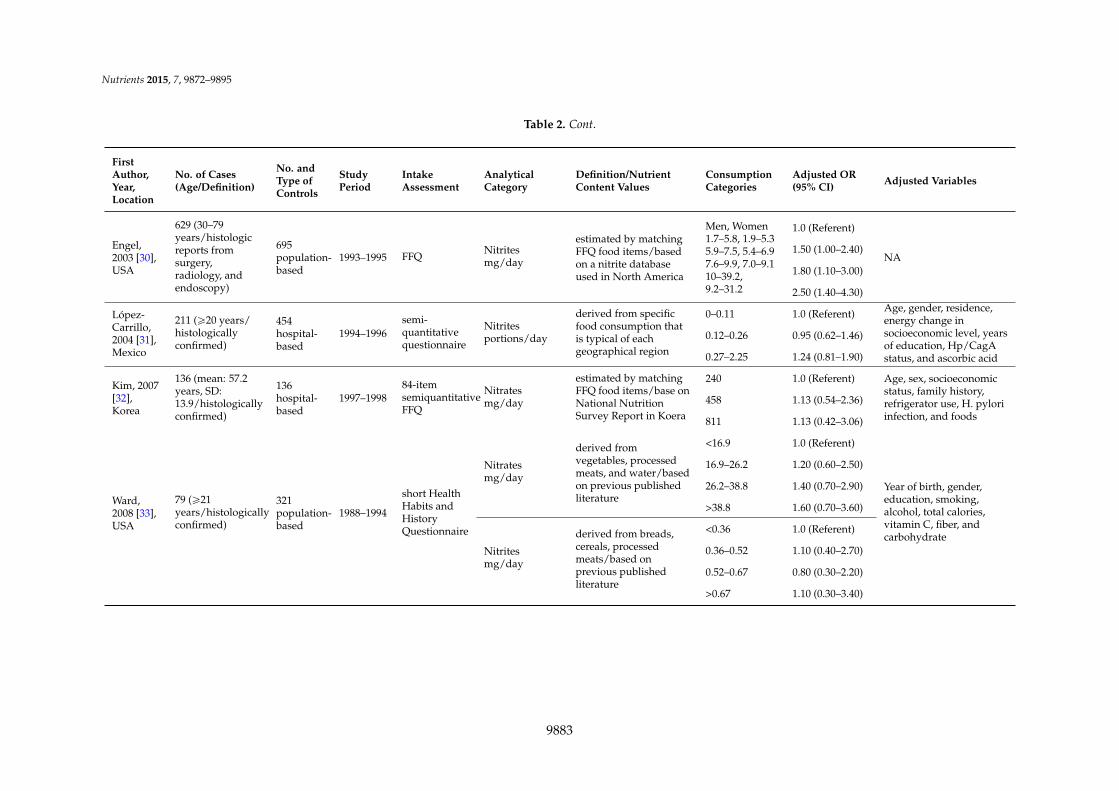
Engel,2003 [30],USA
629 (30–79years/histologicreports fromsurgery,radiology, andendoscopy)
695population-based
1993–1995 FFQNitritesmg/day
estimated by matchingFFQ food items/basedon a nitrite databaseused in North America
Men, Women1.7–5.8, 1.9–5.35.9–7.5, 5.4–6.97.6–9.9, 7.0–9.110–39.2,9.2–31.2
1.0 (Referent)
NA1.50 (1.00–2.40)
1.80 (1.10–3.00)
2.50 (1.40–4.30)
López-Carrillo,2004 [31],Mexico
211 (ě20 years/histologicallyconfirmed)
454hospital-based
1994–1996semi-quantitativequestionnaire
Nitritesportions/day
derived from specificfood consumption thatis typical of eachgeographical region
0–0.11 1.0 (Referent) Age, gender, residence,energy change insocioeconomic level, yearsof education, Hp/CagAstatus, and ascorbic acid
0.12–0.26 0.95 (0.62–1.46)
0.27–2.25 1.24 (0.81–1.90)
Kim, 2007[32],Korea
136 (mean: 57.2years, SD:13.9/histologicallyconfirmed)
136hospital-based
1997–199884-itemsemiquantitativeFFQ
Nitratesmg/day
estimated by matchingFFQ food items/base onNational NutritionSurvey Report in Koera
240 1.0 (Referent) Age, sex, socioeconomicstatus, family history,refrigerator use, H. pyloriinfection, and foods
458 1.13 (0.54–2.36)
811 1.13 (0.42–3.06)
Ward,2008 [33],USA
79 (ě21years/histologicallyconfirmed)
321population-based
1988–1994
short HealthHabits andHistoryQuestionnaire
Nitratesmg/day
derived fromvegetables, processedmeats, and water/basedon previous publishedliterature
<16.9 1.0 (Referent)
Year of birth, gender,education, smoking,alcohol, total calories,vitamin C, fiber, andcarbohydrate
16.9–26.2 1.20 (0.60–2.50)
26.2–38.8 1.40 (0.70–2.90)
>38.8 1.60 (0.70–3.60)
Nitritesmg/day
derived from breads,cereals, processedmeats/based onprevious publishedliterature
<0.36 1.0 (Referent)
0.36–0.52 1.10 (0.40–2.70)
0.52–0.67 0.80 (0.30–2.20)
>0.67 1.10 (0.30–3.40)
9883
Nutrients 2015, 7, 9872–9895
Table 2. Cont.
First Author,Year, Location
No. of Cases(Age/Definition)
No. and Typeof Controls
StudyPeriod
IntakeAssessment
AnalyticalCategory
Definition/NutrientContent Values
ConsumptionCategories
Adjusted OR(95% CI) Adjusted Variables
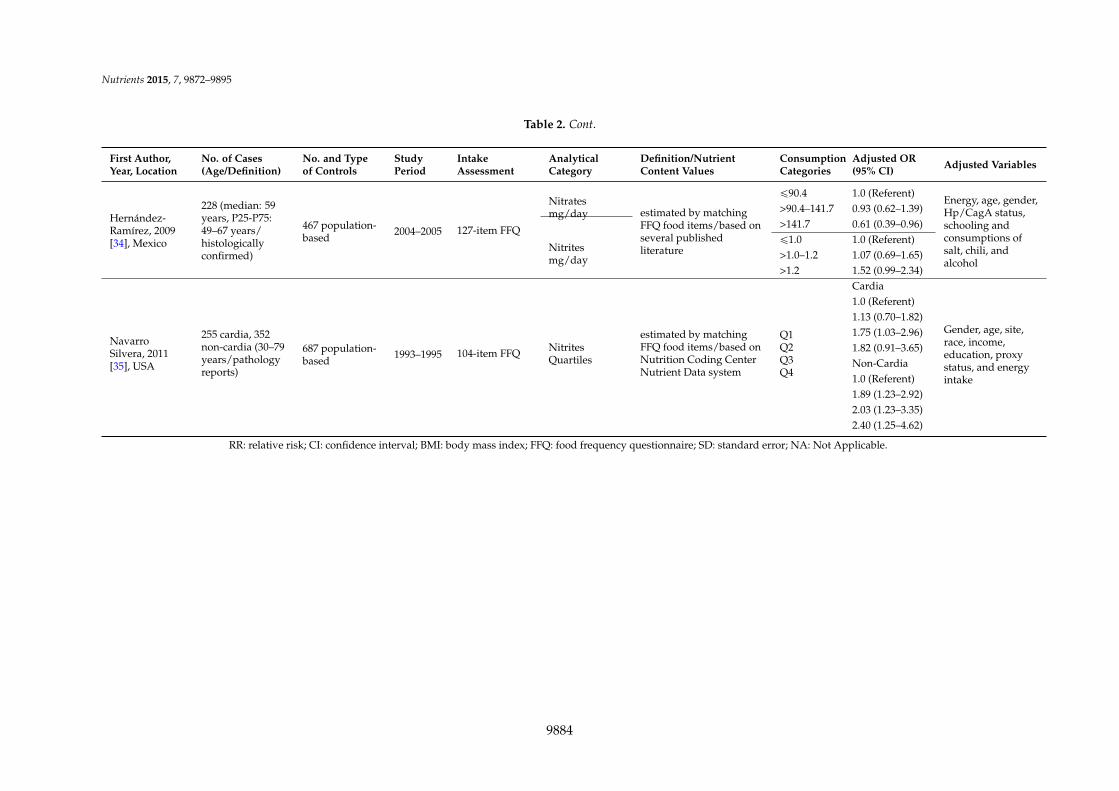
Hernández-Ramírez, 2009[34], Mexico
228 (median: 59years, P25-P75:49–67 years/histologicallyconfirmed)
467 population-based
2004–2005 127-item FFQ
Nitratesmg/day estimated by matching
FFQ food items/based onseveral publishedliterature
ď90.4 1.0 (Referent)Energy, age, gender,Hp/CagA status,schooling andconsumptions ofsalt, chili, andalcohol
>90.4–141.7 0.93 (0.62–1.39)>141.7 0.61 (0.39–0.96)
Nitritesmg/day
ď1.0 1.0 (Referent)>1.0–1.2 1.07 (0.69–1.65)>1.2 1.52 (0.99–2.34)
NavarroSilvera, 2011[35], USA
255 cardia, 352non-cardia (30–79years/pathologyreports)
687 population-based
1993–1995 104-item FFQ NitritesQuartiles
estimated by matchingFFQ food items/based onNutrition Coding CenterNutrient Data system
Q1Q2Q3Q4
Cardia
Gender, age, site,race, income,education, proxystatus, and energyintake
1.0 (Referent)1.13 (0.70–1.82)1.75 (1.03–2.96)1.82 (0.91–3.65)Non-Cardia1.0 (Referent)1.89 (1.23–2.92)2.03 (1.23–3.35)2.40 (1.25–4.62)
RR: relative risk; CI: confidence interval; BMI: body mass index; FFQ: food frequency questionnaire; SD: standard error; NA: Not Applicable.
9884

Nutrients 2015, 7, 9872–9895Nutrients 2015, 7 7, page–page
11
Figure 1. Flowchart of literature search and articles identified.
3.2. Dietary Nitrates, Nitrites, and NDMA Intake and the Risk of Gastric Cancer
There were nine cohort studies and 10 case‐control studies of the relationship between the
nitrates intake and gastric cancer risk [15–17,19–26,29,32–34]. Comparing the highest versus the lowest
categories, the summary RR was 0.80 (95% CI, 0.69–0.93; Figure 2A) with significant heterogeneity (I2
= 46.1%, p = 0.015). To explore the heterogeneity, we conducted subgroup analysis according to some
key characteristics. In stratified analysis by study design, significant inverse association was observed
in population‐based case‐control studies (RR, 0.76; 95% CI, 0.62–0.94) with acceptable heterogeneity
(I2 = 47.8%, p = 0.088). Stratifying by geographic area, the RR was 0.79 (95% CI, 0.64–0.98) in Europe.
Besides, the associations between nitrates intake and risk of stomach cancer were similar in these
subgroups (publication year < 2000, sample size < 2000, quality score < 7 stars; Table 3).
In pooled analysis of eight cohort studies and 10 case‐control studies for nitrites [16,17,19–
22,25,26,29–31,33–35], a significant association was observed. Overall, individuals with highest
nitrites consumption, compared with the lowest, increased the risk of gastric cancer (pooled RR, 1.31;
95% CI, 1.13–1.52, Figure 2B). In the subgroup analysis by study design, the association was detected
in both population‐based case‐control studies (RR, 1.72; 95% CI, 1.47–2.02) and hospital‐based case‐
control studies (RR, 1.25; 95% CI, 1.09–1.44) with no heterogeneity. The risk for developing gastric
cancer was significantly higher in Europe (RR: 1.30; 95% CI, 1.12–1.50). The risk effect of nitrites was
also found in subgroups (publication year, before and after 2000; sample size < 2000; quality score < 7
stars; Table 3).
A total seven cohort studies and four case‐control studies were pooled together to assess the
association between NDMA consumption and stomach cancer risk [17,18,20,26–29,36]. The pooled
RR for high versus low intake was 1.34 (95% CI, 1.02–1.76), with obvious evidence of heterogeneity (I2
= 75.8%, p < 0.001; Figure 2C). Study design, geographic area, cancer type, publication years, and
sample size in association of NDMA consumption and gastric cancer were assessed separately. These
RR estimates obtained from these subgroups showed no significant association (Table 3).
Additionally, a slight association was observed in high quality studies (score ≥ 7 stars; RR, 1.30; 95%
CI, 0.97–1.75).
Figure 1. Flowchart of literature search and articles identified.
3.2. Dietary Nitrates, Nitrites, and NDMA Intake and the Risk of Gastric Cancer
There were nine cohort studies and 10 case-control studies of the relationship between thenitrates intake and gastric cancer risk [15–17,19–26,29,32–34]. Comparing the highest versus the lowestcategories, the summary RR was 0.80 (95% CI, 0.69–0.93; Figure 2A) with significant heterogeneity(I2 = 46.1%, p = 0.015). To explore the heterogeneity, we conducted subgroup analysis accordingto some key characteristics. In stratified analysis by study design, significant inverse associationwas observed in population-based case-control studies (RR, 0.76; 95% CI, 0.62–0.94) with acceptableheterogeneity (I2 = 47.8%, p = 0.088). Stratifying by geographic area, the RR was 0.79 (95% CI,0.64–0.98) in Europe. Besides, the associations between nitrates intake and risk of stomach cancerwere similar in these subgroups (publication year < 2000, sample size < 2000, quality score < 7 stars;Table 3).
In pooled analysis of eight cohort studies and 10 case-control studies fornitrites [16,17,19–22,25,26,29–31,33–35], a significant association was observed. Overall, individualswith highest nitrites consumption, compared with the lowest, increased the risk of gastric cancer(pooled RR, 1.31; 95% CI, 1.13–1.52, Figure 2B). In the subgroup analysis by study design, theassociation was detected in both population-based case-control studies (RR, 1.72; 95% CI, 1.47–2.02)and hospital-based case-control studies (RR, 1.25; 95% CI, 1.09–1.44) with no heterogeneity. The riskfor developing gastric cancer was significantly higher in Europe (RR: 1.30; 95% CI, 1.12–1.50). Therisk effect of nitrites was also found in subgroups (publication year, before and after 2000; samplesize < 2000; quality score < 7 stars; Table 3).
A total seven cohort studies and four case-control studies were pooled together to assess theassociation between NDMA consumption and stomach cancer risk [17,18,20,26–29,36]. The pooledRR for high versus low intake was 1.34 (95% CI, 1.02–1.76), with obvious evidence of heterogeneity(I2 = 75.8%, p < 0.001; Figure 2C). Study design, geographic area, cancer type, publication years,and sample size in association of NDMA consumption and gastric cancer were assessed separately.These RR estimates obtained from these subgroups showed no significant association (Table 3).Additionally, a slight association was observed in high quality studies (score ě 7 stars; RR, 1.30;95% CI, 0.97–1.75).
9885

Nutrients 2015, 7, 9872–9895
Nutrients 2015, 7, page–page
12
(A)
(B)
Figure 2. Cont. Figure 2. Cont.
9886

Nutrients 2015, 7, 9872–9895
Nutrients 2015, 7, page–page
13
(C)
Figure 2. Dietary nitrates, nitrites and NDMA intake and the risk of gastric cancer for the highest
versus lowest categories. (A) nitrates; (B) nitrites; (C) NDMA. (C, cardia; N, non-cardia; M, male; W,
women).
Figure 2. Dietary nitrates, nitrites and NDMA intake and the risk of gastric cancer for the highestversus lowest categories. (A) nitrates; (B) nitrites; (C) NDMA. (C, cardia; N, non-cardia; M, male;W, women).
9887

Nutrients 2015, 7, 9872–9895
Table 3. Stratified analysis of the association between nitrates, nitrites, and NDMA intake and stomach cancer risk.
VariableNitrates Nitrites NDMA
n a RR (95% CI)Heterogeneity Test
n a RR (95% CI)Heterogeneity Test
n a RR (95% CI)Heterogeneity Test
Q p b I2% Q p b I2% Q p b I2%
Total 19 0.80 (0.69–0.93) 31.39 0.015 46.1 19 1.31 (1.13–1.52) 33.87 0.013 46.9 11 1.34 (1.02–1.76) 41.35 <0.001 75.8StudydesignCohort 9 0.91 (0.77–1.09) 3.71 0.882 0.0 8 1.04 (0.87–1.25) 8.71 0.274 19.7 7 1.09 (0.89–1.33) 7.4 0.258 18.9
Case-controlPopulation
based 6 0.76 (0.62–0.94) 9.58 0.088 47.8 8 1.72 (1.47–2.02) 5.21 0.634 0.0 1 1.10 (0.80–1.50) NA NA NA
Hospitalbased 4 0.75 (0.42–1.35) 9.91 0.019 69.7 3 1.25 (1.09–1.44) 1.16 0.559 0.0 3 2.81 (1.16–6.80) 20.54 <0.001 90.3
Geographicarea
Europe 12 0.79 (0.64–0.98) 24.03 0.013 54.2 10 1.30 (1.12–1.50) 10.14 0.339 11.3 10 1.18 (0.97–1.43) 16.89 0.050 46.7North
America 5 0.80 (0.62–1.04) 8.22 0.084 51.3 9 1.41 (1.06–1.87) 23.62 0.003 66.1 0 NA NA NA NA
Other 2 0.94 (0.60–1.49) 0.16 0.690 0.0 0 NA NA NA NA 1 3.62 (2.38–5.51) NA NA NACancer type
cardia 3 0.90 (0.64–1.27) 0.88 0.644 0.0 4 1.01 (0.65–1.58) 6.64 0.084 54.8 3 0.87 (0.60–1.25) 0.66 0.718 0.0non-cardia 3 0.99 (0.76–1.28) 0.79 0.672 0.0 4 1.22 (0.90–1.65) 6.21 0.102 51.7 3 1.14 (0.90–1.44) 1.81 0.404 0.0Publication
year<2000 9 0.75 (0.60–0.93) 19.56 0.012 59.1 6 1.46 (1.17–1.81) 7.38 0.194 32.3 4 2.02 (0.96–4.24) 25.62 <0.001 88.3ě2000 10 0.86 (0.72–1.03) 10.59 0.305 15.0 13 1.26 (1.05–1.53) 23.40 0.025 48.7 7 1.12 (0.95–1.31) 6.22 0.399 3.6
Sample size<2000 8 0.76 (0.62–0.94) 9.99 0.189 29.9 9 1.56 (1.31–1.87) 9.26 0.321 13.6 3 2.69 (0.95–7.60) 24.06 <0.001 91.7ě2000 11 0.82 (0.66–1.01) 22.50 0.013 55.6 10 1.15 (0.95–1.40) 17.85 0.037 49.6 8 1.16 (0.97–1.39) 9.84 0.198 28.9
Qualityscore
<7 stars 7 0.70 (0.54–0.90) 16.83 0.010 64.3 6 1.58 (1.11–1.49) 7.76 0.170 35.6 2 2.47 (0.41–14.91) 7.04 0.008 85.8ě7 stars 12 0.90 (0.77–1.04) 8.59 0.660 0.0 13 1.18 (0.99–1.40) 18.12 0.112 33.8 9 1.30 (0.97–1.75) 34.01 <0.001 76.5
RR: relative risk; CI: confidence interval; NA: Not Applicable. a Number of comparisons; bp Value of Q-test for heterogeneity test.
9888

Nutrients 2015, 7, 9872–9895
3.3. Dose-Response Analysis
Four articles (7 studies) were eligible for the dose-response analysis of dietary nitrates intakeand gastric cancer risk [16,20,25,32]. A nonlinear association was detected (pnon´linearity = 0.001,Figure 3A), with a significantly decreased risk at the nitrates intake level ranged from about 66.4 to220 mg/day. After evaluating the dose-response pattern for nitrites (2 articles/5 studies) [16,20], someevidence of a linear association of gastric cancer was found (plinearity = 0.041, Figure 3B). Accordingly,the summary RR for 0.1 mg/day increment of nitrites consumption was 1.07 (95% CI, 1.00–1.15)without heterogeneity (p = 0.876). Four papers (seven studies) were included in the dose-responseanalysis for NDMA [18,20,27,28]. We observed a nonlinear trend toward gastric cancer risk withincreasing NDMA intake (pnon´linearity < 0.001), following an increase in the risk of NDMA intake upto 0.12 µg/day (Figure 3C).
Nutrients 2015, 7 7, page–page
17
3.3. Dose‐Response Analysis
Four articles (7 studies) were eligible for the dose‐response analysis of dietary nitrates intake
and gastric cancer risk [16,20,25,32]. A nonlinear association was detected (pnon‐linearity = 0.001, Figure
3A), with a significantly decreased risk at the nitrates intake level ranged from about 66.4 to 220
mg/day. After evaluating the dose‐response pattern for nitrites (2 articles/5 studies) [16,20], some
evidence of a linear association of gastric cancer was found (plinearity = 0.041, Figure 3B). Accordingly,
the summary RR for 0.1 mg/day increment of nitrites consumption was 1.07 (95% CI, 1.00–1.15)
without heterogeneity (p = 0.876). Four papers (seven studies) were included in the dose‐response
analysis for NDMA [18,20,27,28]. We observed a nonlinear trend toward gastric cancer risk with
increasing NDMA intake (pnon‐linearity < 0.001), following an increase in the risk of NDMA intake up to
0.12 μg/day (Figure 3C).
(A)
(B)
(C)
Figure 3. Dose‐response analysis of dietary nitrates, nitrites and NDMA intake and the risk of gastric
cancer. (A) the median value of the lowest reference interval (66.4 mg/day) was used to estimate all
relative risks for nitrates; (B) the median value of the lowest reference interval (0.02 mg/day) was used
to estimate all relative risks for nitrites; (C) the minimum value of the lowest reference interval (0.02
μg/day) was used to estimate all relative risks for NDMA. The solid line represents estimated RRs
and dashed lines are their 95% CIs. The dotted line represents the null hypothesis of no association.
Figure 3. Dose-response analysis of dietary nitrates, nitrites and NDMA intake and the risk of gastriccancer. (A) the median value of the lowest reference interval (66.4 mg/day) was used to estimateall relative risks for nitrates; (B) the median value of the lowest reference interval (0.02 mg/day)was used to estimate all relative risks for nitrites; (C) the minimum value of the lowest referenceinterval (0.02 µg/day) was used to estimate all relative risks for NDMA. The solid line representsestimated RRs and dashed lines are their 95% CIs. The dotted line represents the null hypothesis ofno association.
9889

Nutrients 2015, 7, 9872–9895
3.4. Meta-Regression
As shown in Table 4, study design seemed to influence the overall heterogeneity mostly for theassociation of nitrates intake and gastric cancer risk. In univariate meta-regression analysis, studydesign alone could explain 58.14% (0.025/0.043) of the estimated between-study variance (τ2). Whenall the variables (study design, geographic area, and publication year) in the meta-regression model,the τ2 was reduced from 0.041 to 0.009 for nitrites, and from 0.139 to 0.026 for NDMA. Moreover,we found that study type was the main source of heterogeneity for nitrites, which interpreted 89.1%(0.041/0.046) of the τ2. Although geographic area could explain 92.1% (0.128/0.139) of the τ2 forNDMA, the subgroups stratifying by this variable still had non-negligible heterogeneity.
Table 4. Meta-regression analysis.
VariableNitrates Nitrites NDMA
Coefficient p Value 95% CI Coefficient p Value 95% CI Coefficient p Value 95% CI
Studydesign ´0.154 0.184 ´0.390
to 0.082 0.406 0.011 0.106 to0.705 0.200 0.363 ´0.286
to 0.686Geographic
area 0.023 0.846 ´0.225to 0.271 ´0.030 0.831 ´0.326
to 0.265 0.912 0.057 ´0.035to 1.860
Publicationyear 0.063 0.696 ´0.275
to 0.400 ´0.029 0.845 ´0.343to 0.285 0.097 0.807 ´0.806
to 0.999
CI: confidence interval.
3.5. Sensitivity Analysis
We confirmed the associations between dietary nitrates, nitrites, and NDMA intake and gastriccancer risk were relatively stable using sensitivity analysis. After removing one study at a time,the ranges of pooled RRs were 0.67–0.97, 1.10–1.57, and 0.97–1.89 for nitrates, nitrites, and NDMA,respectively (Supplementary Figure S1). As shown in Supplementary Figure S1A, the studyconducted by La Vecchia et al. seemed to cause the heterogeneity [25]. This phenomenon was verifiedthrough the Galbraith plot (Supplementary Figure S2). Exclusion of this study, the heterogeneity wasnot detected (I2 = 8.8%, p = 0.349), and the summary RRs were 0.82 (95% CI, 0.73–0.92) in the overallstudy and 0.79 (95% CI, 0.66–0.95) in the case-control study. Supplementary Figure S1C displayed thatone study performed by De Stefani et al. influenced the overall pooled estimates for the associationbetween NDMA intake and gastric cancer [28]. After this study was removed, the overall RR was1.18 (95% CI, 0.97–1.43), with moderate heterogeneity (I2 = 46.7%, p = 0.050).
3.6. Publication Bias
As shown in Figure 4, these funnel plots did not reveal obvious signs of asymmetry. Moreover,the Egger and Begg test provided statistical evidence of bias for nitrates (Egger, p = 0.047; Begg,p = 0.327), nitrites (Egger, p = 0.542; Begg, p = 0.576), and NDMA (Egger, p = 0.821; Begg, p = 1.000).Adjusting the possible publication bias for nitrates using “trim and fill” method did not influence theconclusion (RR: 0.745; 95% CI, 0.646–0.860; Figure 4A).
9890

Nutrients 2015, 7, 9872–9895
Nutrients 2015, 7, page–page
19
(A)
(B)
(C)
Figure 4. Funnel plot of nitrates, nitrites and NDMA consumption and gastric cancer risk. (A) Base
on trim and fill method, hypothetical dummy studies indicated by squares are added to the genuine
studies for nitrates; (B) nitrites; (C) NDMA.
4. Discussion
This is the first meat‐analysis evaluating relationships between dietary nitrates, nitrites, and
nitrosamines intake and the risk of gastric cancer. We found that consumption of food rich in nitrates
was related to a decreased risk of gastric cancer, and that high intake of nitrites and NDMA resulted
in an elevated risk of cancer. Stratifying analysis for study design, similar results were observed in
the case‐control studies, and the cohort studies also indicated the consequences of this trend. The
dose‐response analysis further showed that the inverse association between nitrates and stomach
cancer appeared to be pronounced with nitrates intake level ranged from about 66.4 to 220 mg/day.
Estimated in linear dose‐response model for nitrites, the risk increased in gastric cancer was 7%
corresponded to each 0.1 mg/day increment of nitrites intake. When daily NDMA intake reached 0.12
μg, the harmful effect to human became more obvious.
Figure 4. Funnel plot of nitrates, nitrites and NDMA consumption and gastric cancer risk. (A) Baseon trim and fill method, hypothetical dummy studies indicated by squares are added to the genuinestudies for nitrates; (B) nitrites; (C) NDMA.
4. Discussion
This is the first meat-analysis evaluating relationships between dietary nitrates, nitrites, andnitrosamines intake and the risk of gastric cancer. We found that consumption of food rich in nitrateswas related to a decreased risk of gastric cancer, and that high intake of nitrites and NDMA resultedin an elevated risk of cancer. Stratifying analysis for study design, similar results were observed inthe case-control studies, and the cohort studies also indicated the consequences of this trend. Thedose-response analysis further showed that the inverse association between nitrates and stomachcancer appeared to be pronounced with nitrates intake level ranged from about 66.4 to 220 mg/day.Estimated in linear dose-response model for nitrites, the risk increased in gastric cancer was 7%
9891

Nutrients 2015, 7, 9872–9895
corresponded to each 0.1 mg/day increment of nitrites intake. When daily NDMA intake reached0.12 µg, the harmful effect to human became more obvious.
In order to understand the mechanisms of nitrates, nitrites, and NDMA, we need to know itschemical and potential biologic property. Nitrates and nitrites are two types of inorganic compounds,which compose of a single nitrogen atom (N) and a number of oxygen atoms (O); and the chemicalsymbols are NO3 and NO2 for nitrate and nitrite, respectively. It is believed that nitrates themselvesare relatively inert, until they are reduced to nitrites. Nitrates can turn into nitrites by bacteria inthe mouth and then be swallowed. As nitrites hit the highly acidic juices in stomach, it is convertedto nitrous acid, which reacts with amines to form nitrosamines [37]. In our life, processed productssuch as meats are heated at high temperatures, the nitrites of which can also turn into nitrosamines.Animal models were used to test the carcinogenic potential of these chemical substances. In 2010,International Agency for Research on Cancer (IARC) have concluded that there was no substantialevidence implicating nitrates as animal carcinogen [38]. Besides, nitrites in combination withamines or amides were proved to be carcinogenic to animals. Most nitrosamines can induce animalcarcinogenesis by causing gene mutation and DNA adductions. Thereafter, a well-done systematicreview performed by Bryan et al. elaborated the animal toxicology of these molecules and drewa consistent conclusion [39]. Whereas human diet is a potentially modifiable exposure, it remainsdifficult to attribute the etiology of cancer to a single nutrient. Recently, the data from prospectivecohort studies, indicating that estimated intake of nitrates, nitrites, and NDMA in the diet was notsignificantly associated with a risk of gastric cancer [15–17,19,20,40]. Thus, it is necessary to conducta meta-analysis to reveal a trend that may not be obvious in a single study.
In the present study, high nitrates consumption demonstrated a protective effect for gastriccancer, in line with some previous studies [25,29,34]. Because dietary nitrates are mainly provided byvegetables, and its protection is likely to be reflected by fiber, vitamin C, and other anti-oxidants. Asis known to all, the daily intake of nitrates in Korea is highest, due to the consumption of nitrate-richgreen leafy vegetables such as Kimchi, and this country is also a high-risk region for gastric cancerin Asia. Kim and his colleagues reported that the estimated values of nitrates from the KoreaFood Balance Sheet (390–742 mg/day) were considerably higher, compared to European countries(52–156 mg/day) and China (422.8 mg/day). Their research also showed that a higher intake ofnitrates was not related to a greater cancer risk [32]. In contrast, higher nitrates intake relative toanti-oxidants was associated with an increase the gastric cancer risk. Considering the collinearity ofnitrates and antioxidant vitamins intake, we further took a meta-analysis of these studies that hadadjusted for vitamin C, vegetables, or fruits, and the pooled RR was 0.97 (95% CI, 0.81–1.17) with noheterogeneity (I2 = 0.0%, p = 0.849) [16,19,20,33]. Therefore, studies with validated methodologiesquantifying the source of exposure as much as possible in the diet are needed to validate this finding.
Strengths of our meta-analysis included the large number of total subjects (650,826 for nitrates;663,634 for nitrites; 742,038 for NDMA), dose-response relationship, reliable sources of heterogeneity,and the stable results in the sensitivity analysis. Here, some limitations were pointed out as follows.First, food frequency questionnaires were used to record the usual dietary consumption and classifythem to estimate daily nitrates, nitrites, and NDMA intake. As a result, measurement error indifferent studies was inevitable, which might contribute to attenuation of the true relationship [41].Second, there was a wide range of nitrates/nitrites/NDMA intake values between the lowest andhighest categories, which might lead to the heterogeneity in the pooled analysis and conclusionslimited. Third, only few articles were available for the stratified analysis of cancer type (cardia andnon-cardia gastric cancer), and the dose-response analysis, especially for the nitrites (two papers/fivestudies), so we should treat the results with caution. More well-designed studies with detailedclinical characteristics are needed to answer these questions more completely. Fourth, significantheterogeneity was detected for NDMA, even after we confined to the stratified analysis, heterogeneitystill existed in the subgroups. Fifth, Helicobacter pylori infection is a well-known risk factor for thedevelopment of distal gastric cancer. In this meta-analysis, only three case-control studies concerned
9892

Nutrients 2015, 7, 9872–9895
this problem [31,32,34]. Lastly, during the long follow-up for cohort studies, the level of nitrates,nitrites, and nitrosamines in food have been marked changed due to the development of foodprocessing technology. In addition, participants may have changed their diets and eating habits.Therefore, further prospective studies with complete questionnaires and updated diet informationtimely are warranted.
As diet is a very complex exposure variable, knowledge of beneficial factors and risk factorsprovide us an opportunity to improve heath and even prevent cancer. According to the reportfrom WCRF/AICR [42], non-starchy vegetables as well as fruits with a relatively high content ofanti-oxidants, ascorbic acid, and fiber probably protect against stomach cancer. However, salt andalso salt-preserved foods have been proposed for probably causing this cancer. There is limitedevidence suggesting dietary nitrates, nitrites, and NDMA intake increase the cancer risk. A review ofprevious research, studies of low quality tended to support the hypothesis of an increased risk withconsumption of nitrite intake, while most research including better designed and conducted studiesregarded NDMA as a potential human carcinogen. These results were in accord with our stratifiedanalysis by sample size and quality score.
5. Conclusions
In summary, this meta-analysis suggested that dietary nitrates intake was associated with areduced risk of gastric cancer, and high consumption of nitrites and NDMA could increase the risk.Considering the limitations and confounding factors, we could not absolutely confirm the reliabilityof these findings. More well-designed large prospective studies are needed to help us understandthese substances in the etiology of gastric cancer.
Supplementary Materials: The following are available online at www.mdpi.com/2072-6643/7/12/5505/s1,Table S1: Methodologic quality of cohort studies included in the meta-analysis, Table S2: Methodologic qualityof case-control studies included in the meta-analysis, Figure S1: Influence analysis of the summary relative risksfor dietary nitrates, nitrites and NDMA intake. (A) nitrates; (B) nitrites; (C) NDMA, Figure S2: Galbraith plots ofnitrates intake and gastric cancer. The central solid line and two outer parallel lines represent the estimated RRsand 95% CIs, respectively.
Acknowledgments: This work was supported by the grants from National Natural Science Foundation of China(81372364).
Conflict of Interest: The authors declare no conflict of interest.
References
1. Torre, L.A.; Bray, F.; Siegel, R.L.; Ferlay, J.; Lortet-Tieulent, J.; Jemal, A. Global cancer statistics, 2012.CA Cancer J. Clin. 2015, 65, 87–108. [CrossRef] [PubMed]
2. Abnet, C.C.; Corley, D.A.; Freedman, N.D.; Kamangar, F. Diet and upper gastrointestinal malignancies.Gastroenterology 2015, 148, 1234–1243. [CrossRef] [PubMed]
3. Petrick, J.L.; Steck, S.E.; Bradshaw, P.T.; Trivers, K.F.; Abrahamson, P.E.; Engel, L.S.; He, K.; Chow, W.H.;Mayne, S.T.; Risch, H.A.; et al. Dietary intake of flavonoids and oesophageal and gastric cancer: Incidenceand survival in the United States of America (USA). Br. J. Cancer 2015, 112, 1291–1300. [CrossRef] [PubMed]
4. Bradbury, K.E.; Appleby, P.N.; Key, T.J. Fruit, vegetable, and fiber intake in relation to cancer risk: Findingsfrom the European prospective investigation into cancer and nutrition (EPIC). Am. J. Clin. Nutr. 2014, 100(Suppl. S1), 394S–398S. [CrossRef] [PubMed]
5. Gonzalez, C.A.; Lujan-Barroso, L.; Bueno-de-Mesquita, H.B.; Jenab, M.; Duell, E.J.; Agudo, A.;Tjonneland, A.; Boutron-Ruault, M.C.; Clavel-Chapelon, F.; Touillaud, M.; et al. Fruit and vegetableintake and the risk of gastric adenocarcinoma: A reanalysis of the European prospective investigation intocancer and nutrition (EPIC-EURGAST) study after a longer follow-up. Int. J. Cancer 2012, 131, 2910–2919.[CrossRef] [PubMed]
6. Larsson, S.C.; Orsini, N.; Wolk, A. Processed meat consumption and stomach cancer risk: A meta-analysis.J. Natl. Cancer Inst. 2006, 98, 1078–1087. [CrossRef] [PubMed]
9893

Nutrients 2015, 7, 9872–9895
7. Tricker, A.R.; Pfundstein, B.; Theobald, E.; Preussmann, R.; Spiegelhalder, B. Mean daily intake of volatileN-nitrosamines from foods and beverages in west Germany in 1989–1990. Food Chem. Toxicol. 1991, 29,729–732. [CrossRef]
8. Jakszyn, P.; Agudo, A.; Berenguer, A.; Ibanez, R.; Amiano, P.; Pera, G.; Ardanaz, E.; Barricarte, A.;Chirlaque, M.D.; Dorronsoro, M.; et al. Intake and food sources of nitrites and N-nitrosodimethylaminein Spain. Public Health Nutr. 2006, 9, 785–791. [CrossRef] [PubMed]
9. Tricker, A.R.; Preussmann, R. Carcinogenic N-nitrosamines in the diet: Occurrence, formation, mechanismsand carcinogenic potential. Mutat. Res. 1991, 259, 277–289. [CrossRef]
10. Anderson, L.M.; Souliotis, V.L.; Chhabra, S.K.; Moskal, T.J.; Harbaugh, S.D.; Kyrtopoulos, S.A.N-nitrosodimethylamine-derived O(6)-methylguanine in DNA of monkey gastrointestinal and urogenitalorgans and enhancement by ethanol. Int. J. Cancer 1996, 66, 130–134. [CrossRef]
11. Stang, A. Critical evaluation of the newcastle-ottawa scale for the assessment of the quality ofnonrandomized studies in meta-analyses. Eur. J. Epidemiol. 2010, 25, 603–605. [CrossRef] [PubMed]
12. Greenland, S. Quantitative methods in the review of epidemiologic literature. Epidemiol. Rev. 1987, 9, 1–30.[PubMed]
13. Orsini, N.; Li, R.; Wolk, A.; Khudyakov, P.; Spiegelman, D. Meta-analysis for linear and nonlineardose-response relations: Examples, an evaluation of approximations, and software. Am. J. Epidemiol. 2012,175, 66–73. [CrossRef] [PubMed]
14. Duval, S.; Tweedie, R. Trim and fill: A simple funnel-plot-based method of testing and adjusting forpublication bias in meta-analysis. Biometrics 2000, 56, 455–463. [CrossRef] [PubMed]
15. Galanis, D.J.; Kolonel, L.N.; Lee, J.; Nomura, A. Intakes of selected foods and beverages and the incidenceof gastric cancer among the Japanese residents of hawaii: A prospective study. Int. J. Epidemiol. 1998, 27,173–180. [CrossRef] [PubMed]
16. Van Loon, A.J.; Botterweck, A.A.; Goldbohm, R.A.; Brants, H.A.; van Klaveren, J.D.; van den Brandt, P.A.Intake of nitrate and nitrite and the risk of gastric cancer: A prospective cohort study. Br. J. Cancer 1998, 78,129–135. [CrossRef] [PubMed]
17. Knekt, P.; Jarvinen, R.; Dich, J.; Hakulinen, T. Risk of colorectal and other gastro-intestinal cancers afterexposure to nitrate, nitrite and N-nitroso compounds: A follow-up study. Int. J. Cancer 1999, 80, 852–856.[CrossRef]
18. Larsson, S.C.; Bergkvist, L.; Wolk, A. Processed meat consumption, dietary nitrosamines and stomachcancer risk in a cohort of Swedish women. Int. J. Cancer 2006, 119, 915–919. [CrossRef] [PubMed]
19. Cross, A.J.; Freedman, N.D.; Ren, J.; Ward, M.H.; Hollenbeck, A.R.; Schatzkin, A.; Sinha, R.; Abnet, C.C.Meat consumption and risk of esophageal and gastric cancer in a large prospective study. Am. J.Gastroenterol. 2011, 106, 432–442. [CrossRef] [PubMed]
20. Keszei, A.P.; Goldbohm, R.A.; Schouten, L.J.; Jakszyn, P.; van den Brandt, P.A. Dietary N-nitrosocompounds, endogenous nitrosation, and the risk of esophageal and gastric cancer subtypes in theNetherlands cohort study. Am. J. Clin. Nutr. 2013, 97, 135–146. [CrossRef] [PubMed]
21. Risch, H.A.; Jain, M.; Choi, N.W.; Fodor, J.G.; Pfeiffer, C.J.; Howe, G.R.; Harrison, L.W.; Craib, K.J.;Miller, A.B. Dietary factors and the incidence of cancer of the stomach. Am. J. Epidemiol. 1985, 122, 947–959.[PubMed]
22. Buiatti, E.; Palli, D.; Decarli, A.; Amadori, D.; Avellini, C.; Bianchi, S.; Bonaguri, C.; Cipriani, F.; Cocco, P.;Giacosa, A.; et al. A case-control study of gastric cancer and diet in Italy: II. Association with nutrients. Int.J. Cancer 1990, 45, 896–901. [CrossRef] [PubMed]
23. Boeing, H.; Frentzel-Beyme, R.; Berger, M.; Berndt, V.; Gores, W.; Korner, M.; Lohmeier, R.; Menarcher, A.;Mannl, H.F.; Meinhardt, M.; et al. Case-control study on stomach cancer in germany. Int. J. Cancer 1991, 47,858–864. [CrossRef] [PubMed]
24. Hansson, L.E.; Nyren, O.; Bergstrom, R.; Wolk, A.; Lindgren, A.; Baron, J.; Adami, H.O. Nutrients andgastric cancer risk. A population-based case-control study in sweden. Int. J. Cancer 1994, 57, 638–644.[CrossRef] [PubMed]
25. La Vecchia, C.; Ferraroni, M.; D’Avanzo, B.; Decarli, A.; Franceschi, S. Selected micronutrient intake and therisk of gastric cancer. Cancer Epidemiol. Biomarkers Prev. 1994, 3, 393–398. [PubMed]
26. Pobel, D.; Riboli, E.; Cornee, J.; Hemon, B.; Guyader, M. Nitrosamine, nitrate and nitrite in relation to gastriccancer: A case-control study in marseille, france. Eur. J. Epidemiol. 1995, 11, 67–73. [CrossRef] [PubMed]
9894

Nutrients 2015, 7, 9872–9895
27. La Vecchia, C.; D’Avanzo, B.; Airoldi, L.; Braga, C.; Decarli, A. Nitrosamine intake and gastric cancer risk.Eur. J. Cancer Prev. 1995, 4, 469–474. [CrossRef] [PubMed]
28. De Stefani, E.; Boffetta, P.; Mendilaharsu, M.; Carzoglio, J.; Deneo-Pellegrini, H. Dietary nitrosamines,heterocyclic amines, and risk of gastric cancer: A case-control study in Uruguay. Nutr. Cancer 1998, 30,158–162. [CrossRef] [PubMed]
29. Palli, D.; Russo, A.; Decarli, A. Dietary patterns, nutrient intake and gastric cancer in a high-risk area ofitaly. Cancer Causes Control 2001, 12, 163–172. [CrossRef] [PubMed]
30. Engel, L.S.; Chow, W.H.; Vaughan, T.L.; Gammon, M.D.; Risch, H.A.; Stanford, J.L.; Schoenberg, J.B.;Mayne, S.T.; Dubrow, R.; Rotterdam, H.; et al. Population attributable risks of esophageal and gastriccancers. J. Natl. Cancer Inst. 2003, 95, 1404–1413. [CrossRef] [PubMed]
31. López-Carrillo, L.; Torres-López, J.; Galván-Portillo, M.; Muñoz, L.; López-Cervantes, M. Helicobacterpylori-caga seropositivity and nitrite and ascorbic acid food intake as predictors for gastric cancer. Eur.J. Cancer 2004, 40, 1752–1759. [CrossRef] [PubMed]
32. Kim, H.J.; Lee, S.S.; Choi, B.Y.; Kim, M.K. Nitrate intake relative to antioxidant vitamin intake affects gastriccancer risk: A case-control study in korea. Nutr. Cancer 2007, 59, 185–191. [CrossRef] [PubMed]
33. Ward, M.H.; Heineman, E.F.; Markin, R.S.; Weisenburger, D.D. Adenocarcinoma of the stomach andesophagus and drinking water and dietary sources of nitrate and nitrite. Int. J. Occup. Environ. Health2008, 14, 193–197. [CrossRef] [PubMed]
34. Hernández-Ramírez, R.U.; Galván-Portillo, M.V.; Ward, M.H.; Agudo, A.; González, C.A.;Oñate-Ocaña, L.F.; Herrera-Goepfert, R.; Palma-Coca, O.; López-Carrillo, L. Dietary intake of polyphenols,nitrate and nitrite and gastric cancer risk in Mexico city. Int. J. Cancer 2009, 125, 1424–1430. [CrossRef][PubMed]
35. Navarro Silvera, S.A.; Mayne, S.T.; Risch, H.A.; Gammon, M.D.; Vaughan, T.; Chow, W.H.; Dubin, J.A.;Dubrow, R.; Schoenberg, J.; Stanford, J.L.; et al. Principal component analysis of dietary and lifestylepatterns in relation to risk of subtypes of esophageal and gastric cancer. Ann. Epidemiol. 2011, 21, 543–550.[CrossRef] [PubMed]
36. Jakszyn, P.; Bingham, S.; Pera, G.; Agudo, A.; Luben, R.; Welch, A.; Boeing, H.; del Giudice, G.; Palli, D.;Saieva, C.; et al. Endogenous versus exogenous exposure to N-nitroso compounds and gastric cancer riskin the European prospective investigation into cancer and nutrition (EPIC-EURGAST) study. Carcinogenesis2006, 27, 1497–1501. [CrossRef] [PubMed]
37. Kobayashi, J.; Ohtake, K.; Uchida, H. No-rich diet for lifestyle-related diseases. Nutrients 2015, 7, 4911–4937.[CrossRef] [PubMed]
38. World Health Oganization; International Agency for Research on Cancer. IARC Monographs on theEvaluation of Carcinogenic Risks to Humans, Volume 94, Ingested Nitrate and Nitrite, and Cyanobacterial PeptideToxins; International Agency for Research on Cancer: Lyon, France, 2010.
39. Bryan, N.S.; Alexander, D.D.; Coughlin, J.R.; Milkowski, A.L.; Boffetta, P. Ingested nitrate and nitrite andstomach cancer risk: An updated review. Food Chem. Toxicol. 2012, 50, 3646–3665. [CrossRef] [PubMed]
40. Loh, Y.H.; Jakszyn, P.; Luben, R.N.; Mulligan, A.A.; Mitrou, P.N.; Khaw, K.T. N-nitroso compounds andcancer incidence: The European prospective investigation into cancer and nutrition (EPIC)-norfolk study.Am. J. Clin. Nutr. 2011, 93, 1053–1061. [CrossRef] [PubMed]
41. Kipnis, V.; Subar, A.F.; Midthune, D.; Freedman, L.S.; Ballard-Barbash, R.; Troiano, R.P.; Bingham, S.;Schoeller, D.A.; Schatzkin, A.; Carroll, R.J. Structure of dietary measurement error: Results of the openbiomarker study. Am. J. Epidemiol. 2003, 158, 14–21. [CrossRef] [PubMed]
42. Marmot, M.; Atinmo, T.; Byers, T.; Chen, J.; Hirohata, T.; Jackson, A.; James, W. Food, Nutrition, PhysicalActivity, and the Prevention of Cancer: A Global Perspective; WCRF/AICR Expert Report; World CancerResearch Fund/American Institute for Cancer Research: Washington, DC, USA, 2007.
© 2015 by the authors; licensee MDPI, Basel, Switzerland. This article is an openaccess article distributed under the terms and conditions of the Creative Commons byAttribution (CC-BY) license (http://creativecommons.org/licenses/by/4.0/).
9895