Embed Size (px)
Citation preview
ANION EXCHANGE RESINS AS SOURCES OF NITROSAMINES AND NITROSAMINE PRECURSORS
Riley Christopher Flowers
A dissertation submitted to the faculty of the University of North Carolina at Chapel Hill in partial fulfillment of the requirements for the degree of Doctor of Philosophy in the
Department of Environmental Sciences and Engineering.
Chapel Hill 2012
Approved by:
Philip C. Singer
Rose M. Cory
James W. Jorgenson
William A. Mitch
Stephen C. Whalen
ii
Abstract
RILEY C FLOWERS: Anion Exchange Resins as Sources of Nitrosamines and Nitrosamine Precursors
(Under the direction of Philip C. Singer)
Nitrosamines are a family of potent chemical carcinogens including, among
others, N-nitrosodimethylamine (NDMA), N-nitrosodiethylamine (NDEA), N-nitrosodi-
n-propylamine (NDPA) and N-nitrosodi-n-butylamine (NDBA). NDMA and other
nitrosamines have been identified as disinfection byproducts. They are regulated in the
State of California and are candidates for Federal regulation.
Anion exchange resins, used for the removal of anionic contaminants from
drinking water, consist of polymer networks with positively charged amine groups.
Resins are often synthesized using trimethylamine (TMA), triethylamine (TEA), tri-n-
propylamine (TPA) or tri-n-butylamine (TBA) which can react with chloramines to form
NDMA, NDEA, NDPA and NDBA, respectively. Drinking water treatment plants using
anion exchange resins have been found to have higher levels of NDMA in finished
waters.
The objective of this research was to investigate the potential relationship
between the use of anion exchange resins in drinking water treatment and the presence of
nitrosamines and nitrosamine precursors in finished waters. A wide array of resins,
representing those commonly used in practice, was investigated through bench-scale
iii
batch contact experiments, bench-scale continuous-flow column experiments, and
measurements at water utilities using anion exchange for treatment.
In the batch experiments, resins were found to release nitrosamines and their
precursors after one hour of contact. Resins manufactured with TEA or TBA were found
to release NDMA precursors in addition to NDEA or NDBA precursors. In column
experiments, resins released high nitrosamines and precursors in the first 10 bed volumes
of flow. Regeneration with NaCl resulted in a spike in precursor release, as did flow
interruptions. The introduction of chlorine or preformed monochloramine resulted in
increases in nitrosamines. Explanations for the presence of precursors and their increased
release during regeneration and flow interruption are offered, and a mechanism for
nitrosamine formation via reactions with free chlorine and monochloramine is proposed.
A study of ten full-scale treatment plants using anion exchange resins found that
three contained nitrosamines and five contained precursors in their anion exchange
effluents. Experiments suggested that resins can be washed clean of any residual
nitrosamines and precursors, and field observations confirmed that resins that have been
in place for longer periods of time release lower levels of precursors.
iv
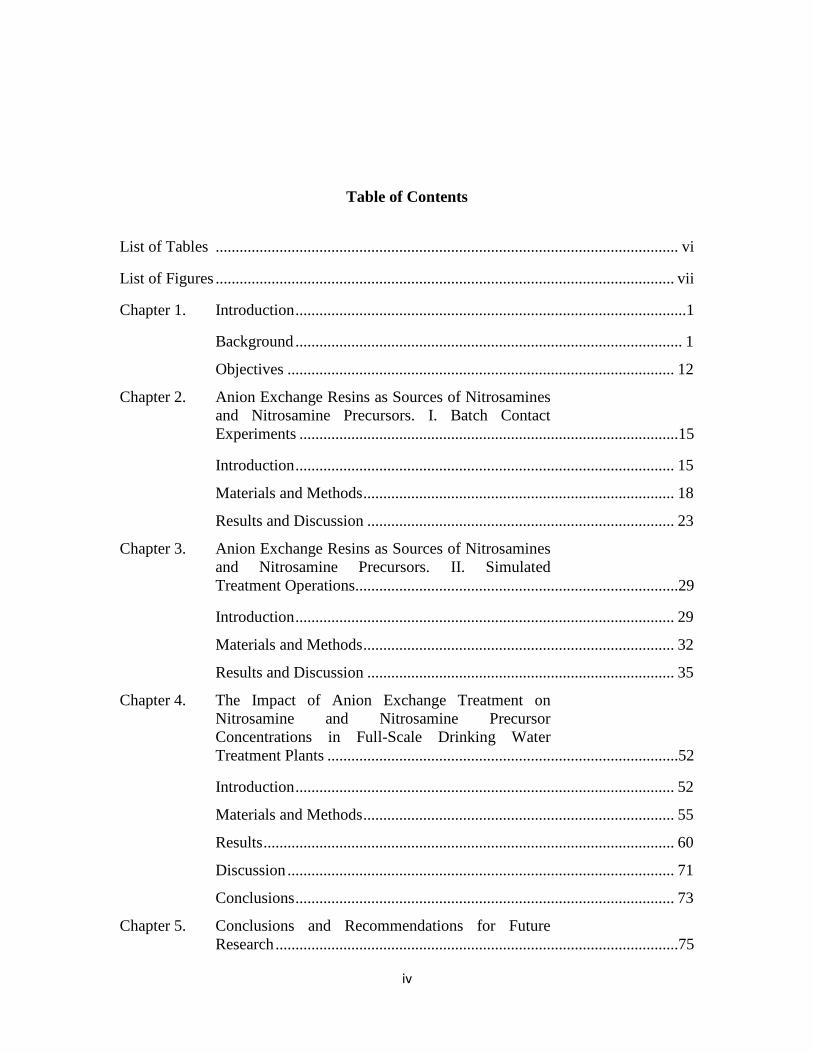
Table of Contents
List of Tables .................................................................................................................... vi
List of Figures ................................................................................................................... vii
Chapter 1. Introduction ..................................................................................................1
Background ................................................................................................. 1
Objectives ................................................................................................. 12
Chapter 2. Anion Exchange Resins as Sources of Nitrosamines and Nitrosamine Precursors. I. Batch Contact Experiments ...............................................................................................15
Introduction ............................................................................................... 15
Materials and Methods .............................................................................. 18
Results and Discussion ............................................................................. 23
Chapter 3. Anion Exchange Resins as Sources of Nitrosamines and Nitrosamine Precursors. II. Simulated Treatment Operations.................................................................................29
Introduction ............................................................................................... 29
Materials and Methods .............................................................................. 32
Results and Discussion ............................................................................. 35
Chapter 4. The Impact of Anion Exchange Treatment on Nitrosamine and Nitrosamine Precursor Concentrations in Full-Scale Drinking Water Treatment Plants ........................................................................................52
Introduction ............................................................................................... 52
Materials and Methods .............................................................................. 55
Results ....................................................................................................... 60
Discussion ................................................................................................. 71
Conclusions ............................................................................................... 73
Chapter 5. Conclusions and Recommendations for Future Research .....................................................................................................75
v
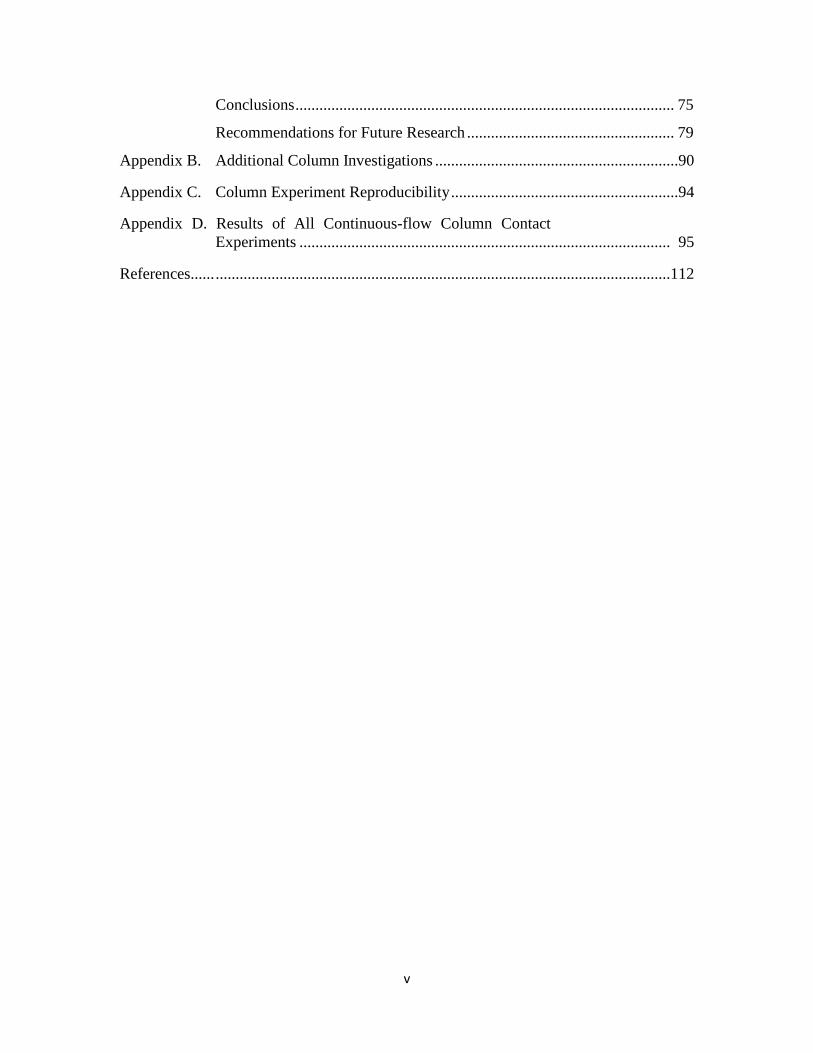
Conclusions ............................................................................................... 75
Recommendations for Future Research .................................................... 79
Appendix B. Additional Column Investigations .............................................................90
Appendix C. Column Experiment Reproducibility .........................................................94
Appendix D. Results of All Continuous-flow Column Contact Experiments ............................................................................................. 95
References...... ..................................................................................................................112
vi
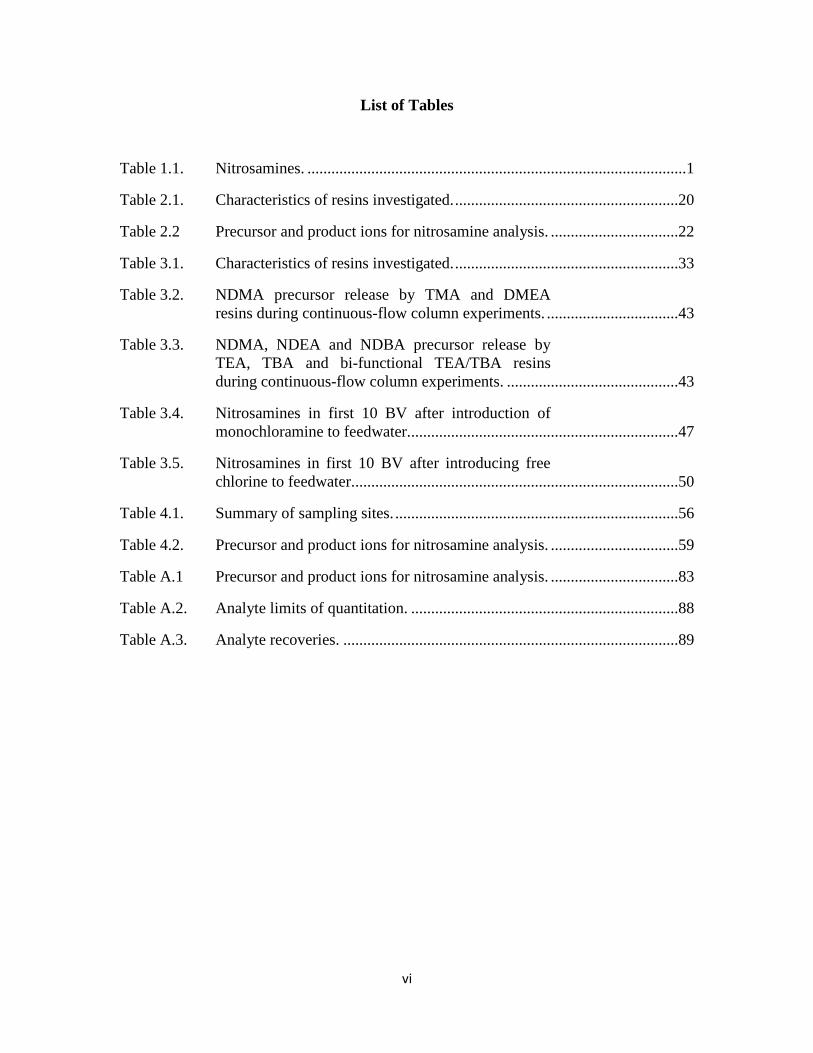
List of Tables
Table 1.1. Nitrosamines. ...............................................................................................1
Table 2.1. Characteristics of resins investigated. ........................................................20
Table 2.2 Precursor and product ions for nitrosamine analysis. ................................22
Table 3.1. Characteristics of resins investigated. ........................................................33
Table 3.2. NDMA precursor release by TMA and DMEA resins during continuous-flow column experiments. .................................43
Table 3.3. NDMA, NDEA and NDBA precursor release by TEA, TBA and bi-functional TEA/TBA resins during continuous-flow column experiments. ...........................................43
Table 3.4. Nitrosamines in first 10 BV after introduction of monochloramine to feedwater....................................................................47
Table 3.5. Nitrosamines in first 10 BV after introducing free chlorine to feedwater..................................................................................50
Table 4.1. Summary of sampling sites. .......................................................................56
Table 4.2. Precursor and product ions for nitrosamine analysis. ................................59
Table A.1 Precursor and product ions for nitrosamine analysis. ................................83
Table A.2. Analyte limits of quantitation. ...................................................................88
Table A.3. Analyte recoveries. ....................................................................................89
vii
List of Figures
Figure 1.1. Mechanism of NDMA formation from dichloramine and dimethylamine (Schreiber and Mitch, 2006). .......................................4
Figure 1.2. Addition of quaternary amine group to polystyrene resin. .............................................................................................................9
Figure 1.3. Addition of quaternary amine group to polyacrylic resin. ...........................................................................................................10
Figure 2.1. Addition of quaternary amine group to polystyrene resin. ...........................................................................................................16
Figure 2.2. Addition of quaternary amine group to polyacrylic resin. ...........................................................................................................16
Figure 2.3. Nitrosamines released by selected anion exchange resins during 1 hour contact experiments at pH 7......................................23
Figure 2.4. Nitrosamine precursors released by anion exchange resins during 1 hour contact experiments at pH 7......................................25
Figure 2.5. Release of NDMA and NDEA precursors at different pH levels......................................................................................27
Figure 3.1. NDMA release by Resin A300E during a typical continuous-flow column experiment. ........................................................35
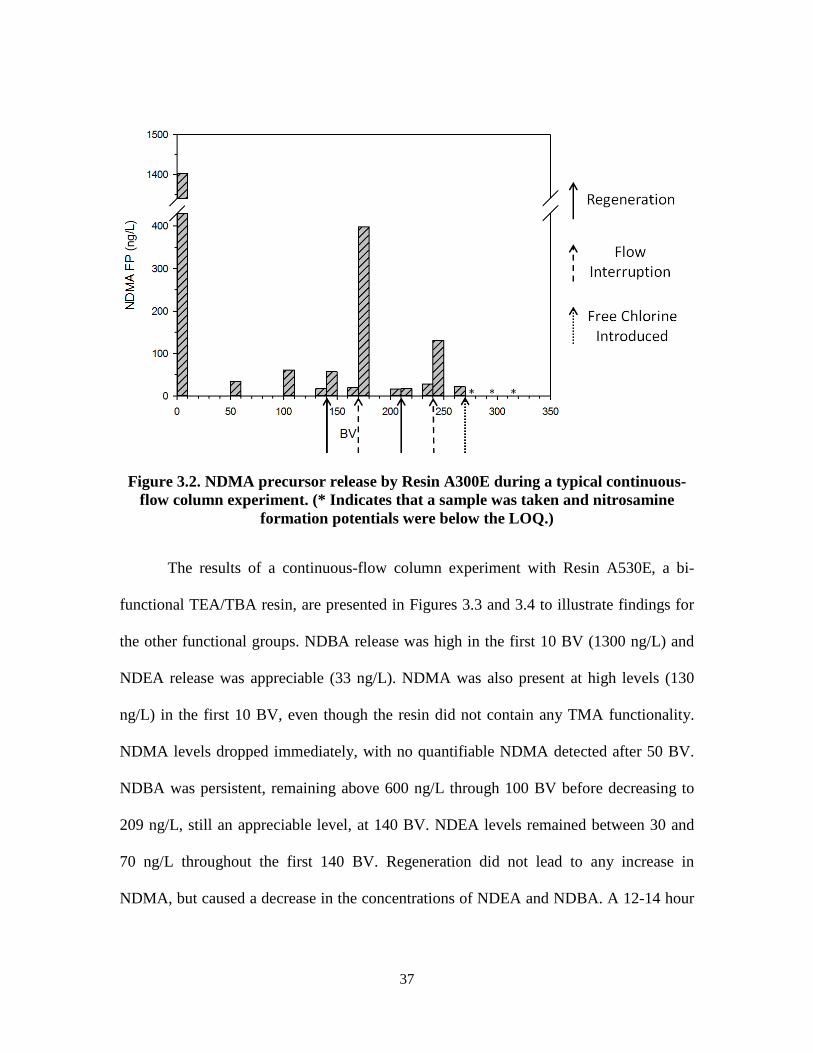
Figure 3.2. NDMA precursor release by Resin A300E during a typical continuous-flow column experiment. ............................................37
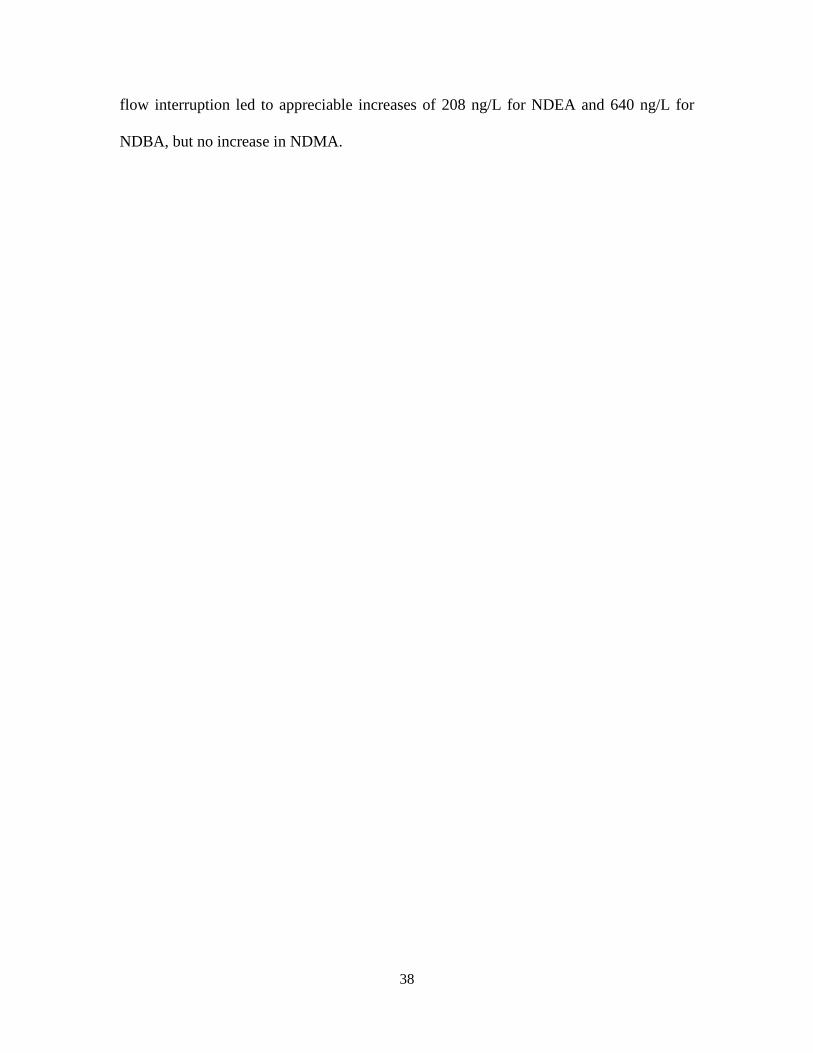
Figure 3.3. Nitrosamine release by Resin A530E during a typical continuous-flow column experiment. a) NDMA release; b) NDEA release; c) NDBA release ................................39
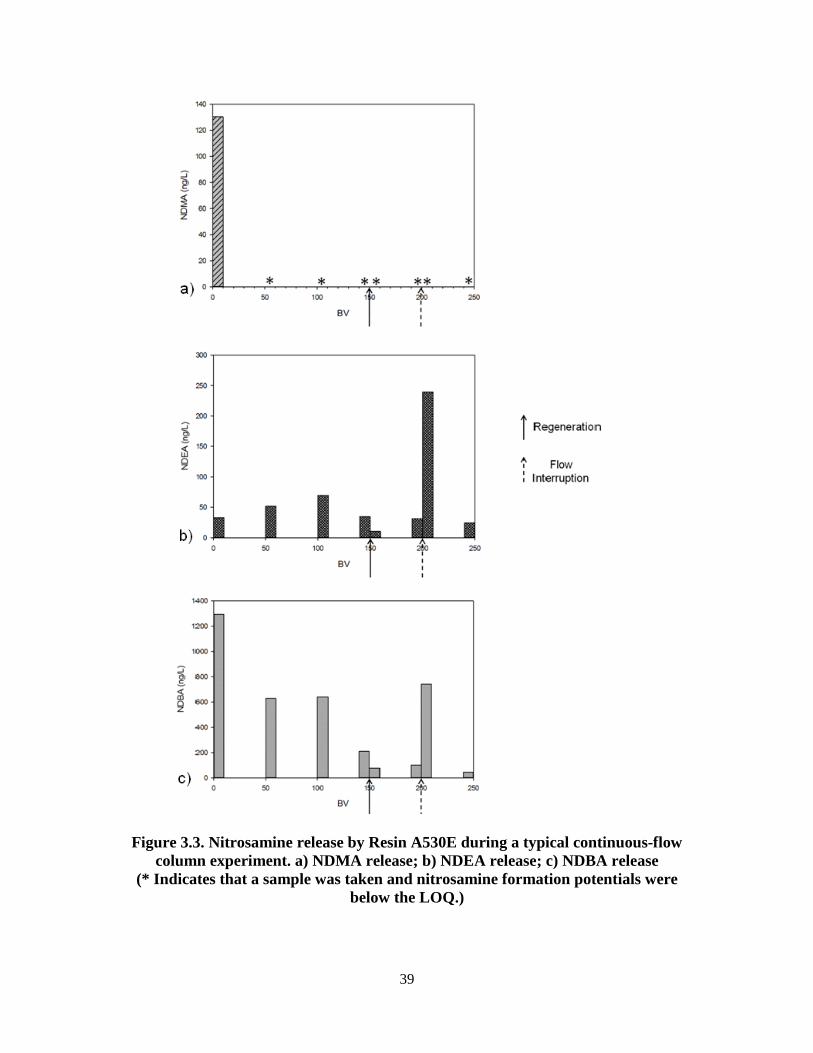
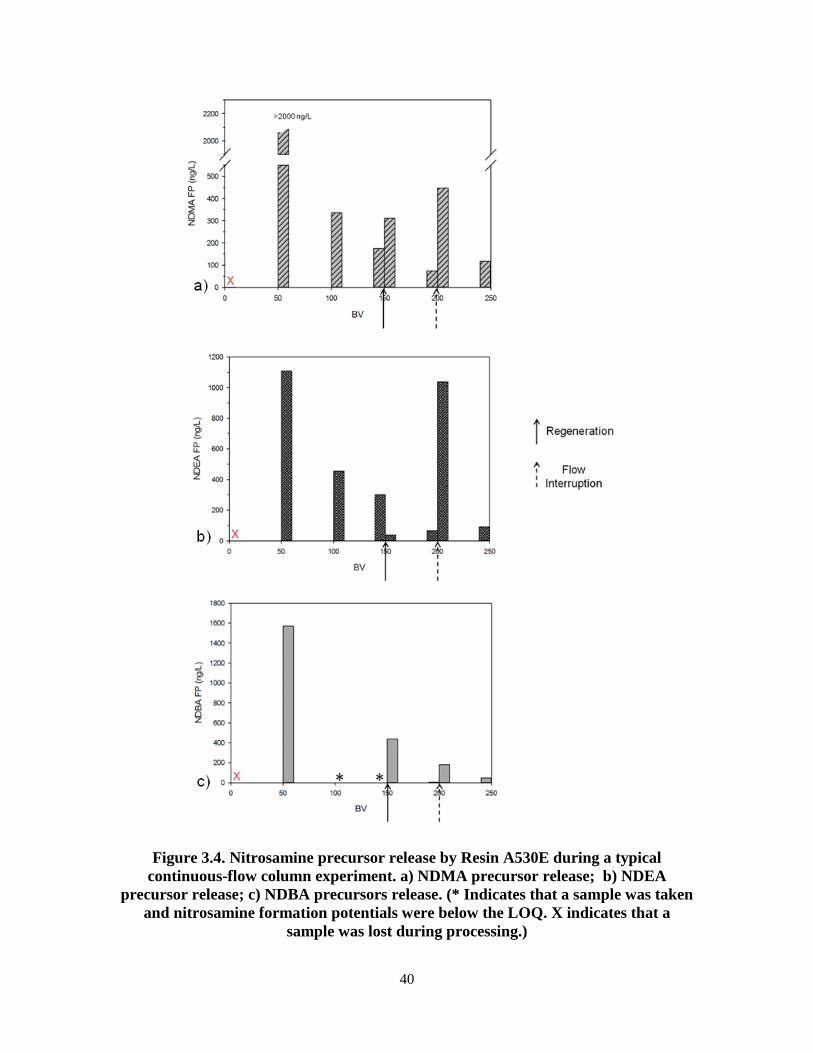
Figure 3.4. Nitrosamine precursor release by Resin A530E during a typical continuous-flow column experiment. a) NDMA precursor release; b) NDEA precursor release; c) NDBA precursors release. ........................................40
Figure 3.5. General chemical structures of styrene-divinylbenzene and polyacrylic resins. ......................................................48
Figure 3.6. Proposed pathway for formation of nitrosamines from dialkylamine groups bound to polystyrene-divinylbenzene polymers. ..........................................................................49
viii
Figure 4.1. NDMA in Site 1 effluent samples. a) NDMA; b) NDMA formation potential........................................................................61
Figure 4.2. Release of nitrosamine precursors by fresh and spent A532E during column experiments. a) NDMA precursors from fresh resin; b) NDMA precursors from spent A532E; c) NDEA precursors from fresh resin; d)NDEA precursors from spent resin; e) NDBA precursors from fresh resin; f) NDBA precursors from spent A532E. .......................................................70
Figure A.1. Representative chromatograms of nitrosamine analytes and internal standards. .................................................................84
Figure A.2. Representative NDMA calibration curve. ..................................................85
Figure A.3. Representative NDEA calibration curve. ...................................................85
Figure A.4. Representative NDPA calibration curve. ...................................................86
Figure A.5. Representative NDBA calibration curve. ..................................................86
Figure A.6. Representative d6-NDMA calibration curve. ............................................87
Figure A.7. Representative d10-NDEA calibration curve. ...........................................87
Figure A.8. Representative d14-NDPA calibration curve.............................................88
Figure A.9. Representative d18-NDBA calibration curve. ...........................................88
Figure B.1. Release of nitrosamine precursors by Resin A530E during multiple-regeneration column experiments. a) NDMA precursor release; b) NDBA precursor release. .......................................................................................................90
Figure B.2 Release of NDMA precursors by Resin PWA5 during multiple-regeneration column experiments. ...................................91
Figure B.3. Release of nitrosamine precursors by Resin PWA5 during continuous-flow column experiments. a) NDMA precursor release, t=0; b) NDMA precursor release, t=6 months; c) NDEA precursor release, t=0; d) NDEA precursor release, t=6 months. ...........................................92
Figure B.4. Release of NDMA precursors by Resin TAN-1 during continuous-flow column experiments. a) NDMA precursor release, t=0; b) NDMA precursor release, t=6 months. ...................................................................................93
ix
Figure C.1. Release of NDMA precursors by Resin PWA15 during 3 identical continuous-flow column experiments. ...............................................................................................94
Figure D.1. NDMA release by Resin A300E during a continuous-flow column experiment. ........................................................95
Figure D.2. NDMA precursor release by Resin A300E during a continuous-flow column experiment. ........................................................95
Figure D.3. NDMA release by Resin A400E in a continuous-flow column experiment. ...........................................................................96
Figure D.4. NDMA precursor release by Resin A400E during a continuous-flow column experiment. ........................................................96
Figure D.5. Nitrosamine release by Resin A520E in a continuous-flow column experiment. a) NDMA release; b) NDEA release. ..........................................................................97
Figure D.6. Nitrosamine precursor release by Resin A520E during a continuous-flow column experiment. a) NDMA precursor release; b) NDEA precursor release. .......................................................................................................98
Figure D.7. Nitrosamine release by Resin A530E during a continuous-flow column experiment. a) NDMA release; b) NDEA release; c) NDBA release. ............................................99
Figure D.8. Nitrosamine precursor release by Resin A530E during a continuous-flow column experiment. a) NDMA precursor release; b) NDEA precursor release; c) NDBA precursor release. ........................................................100
Figure D.9. NDMA release by Resin A600E during a continuous-flow column experiment. ......................................................101
Figure D.10. NDMA precursor release by Resin A600E during a continuous-flow column experiment. ......................................................101
Figure D.11. NDMA precursor release by Resin A860E during a continuous-flow column experiment. ......................................................102
Figure D.12. NDMA release by Resin CalRes 2109 during a continuous-flow column experiment. ......................................................102
Figure D.13. NDBA precursor release by Resin CalRes 2109 during a continuous-flow column experiment. ........................................103
x
Figure D.14. NDMA release by Resin IRA400 during a continuous-flow column experiment. ......................................................103
Figure D.15. Release of NDMA precursors by Resin IRA400 during a continuous-flow column experiment. ........................................104
Figure D.16. Nitrosamine release by Resin PWA2 during a continuous-flow column experiment. a) NDMA release; b) NDBA release. ........................................................................105
Figure D.17. Nitrosamine precursor release by Resin PWA2 during a continuous-flow column experiment. a) NDMA precursor release; b) NDBA precursor release. .....................................................................................................106
Figure D.18. NDMA precursor release by Resin PWA5 during a continuous-flow column experiment. ......................................................107
Figure D.19. NDMA precursor release by Resin PWA5 during a continuous-flow column experiment. ......................................................107
Figure D.20. Nitrosamine release by Resin SIR-100 during a continuous-flow column experiment. a) NDMA release; b) NDEA release. ........................................................................108
Figure D.21. Nitrosamine precursor release by Resin SIR-100 during a continuous-flow column experiment. a) NDMA precursor release; b) NDEA precursor release. .....................................................................................................109
Figure D.22. Nitrosamine precursor release by Resin SIR-110 during a continuous-flow column experiment. a) NDMA precursor release; b) NDBA precursor release. .....................................................................................................110
Figure D.23. NDMA precursor release by Resin TAN-1 during a continuous-flow column experiment. ......................................................111
Chapter 1. Introduction
Background
Nitrosamines
Nitrosamines are a family of highly potent chemical carcinogens including,
among others, N-nitrosodimethylamine (NDMA), N-nitrosodiethylamine (NDEA), N-
nitrosodi-n-propylamine (NDPA) and N-nitrosodi-n-butylamine (NDBA) (see Table 1.1).
In recent years, nitrosamines have been identified as emerging nitrogenous disinfection
byproducts (N-DBPs) and have been the subject of extensive research in the field of
water quality.
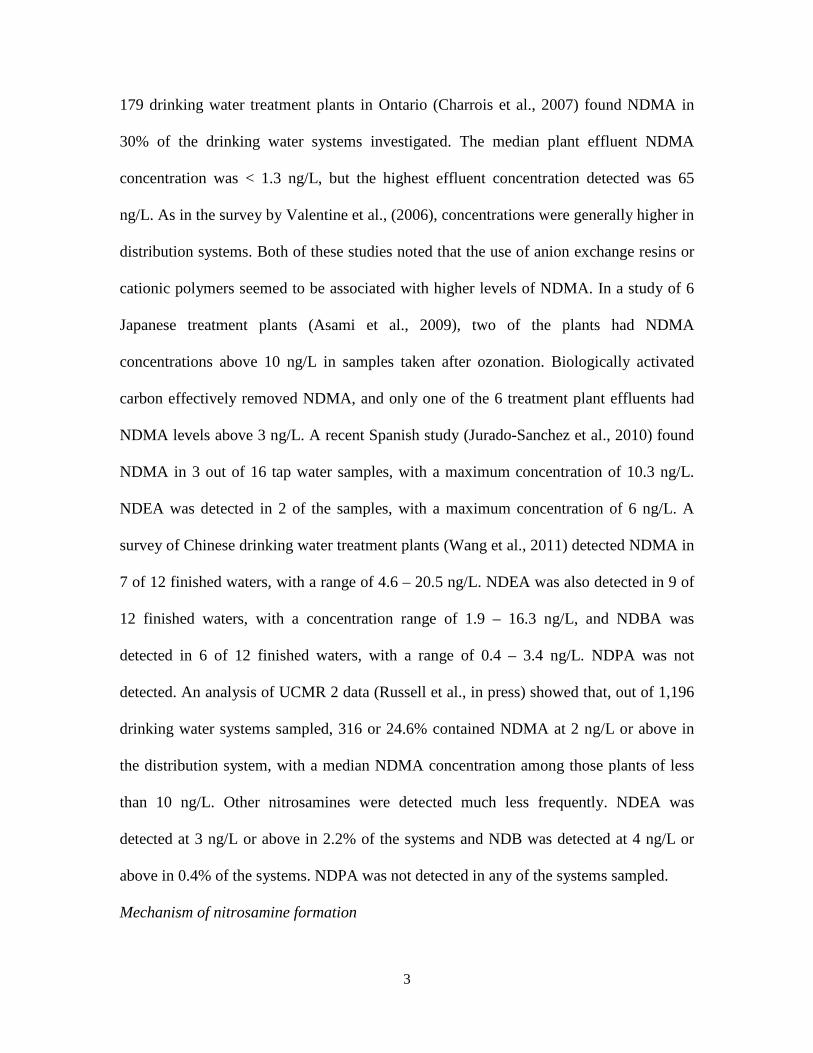
Table 1.1. Nitrosamines.
Name Abbreviation Chemical Structure N-nitrosodimethylamine NDMA (CH3)2N-N=O N-nitrosodiethylamine NDEA (CH3CH2)2N-N=O
N-nitrosodi-n-propylamine NDPA (CH3CH2CH2)2N-N=O N-nitrosodi-n-butylamine NDBA (CH3CH2CH2CH2)2N-N=O
The United States Environmental Protection Agency (USEPA) Integrated Risk
Information System (IRIS) lists drinking water concentrations corresponding to a 10-6
lifetime cancer risk at 0.7 ng/L for NDMA, 0.2 ng/L for NDEA, 5 ng/L for NDPA, and 6
ng/L for NDBA (USEPA, 2011a). For the most harmful of the trihalomethanes,
bromodichloromethane, IRIS lists a concentration of 600 ng/L for the same risk level.
2
Hence, nitrosamines are orders of magnitude more carcinogenic than the regulated
trihalomethanes.
Nitrosamines have been the subject of drinking water regulation by different
agencies. The Ontario Ministry of the Environment has set an Interim Maximum
Allowable Concentration of 9 ng/L for NDMA in drinking water (Ontario Ministry of the
Environment, 1998). The California Department of Public Health has set a Notification
Level (the level at which a governing body must be notified and consumer notification is
recommended) of 10 ng/L for NDMA, NDEA and NDPA in drinking water, with
Response Levels (levels at which a water source may be removed from service) at 100,
300 and 500 ng/L, respectively (CA DPH, 2009), and the Massachusetts Department of
Environmental Protection has set an Office of Research and Standards Guideline of 10
ng/L for NDMA in drinking water (MassDEP 2004). While the USEPA has not yet set a
Maximum Contaminant Level for any nitrosamine, NDMA, NDEA and NDPA are
included on Contaminant Candidate List 3 (USEPA, 2011b), and NDMA, NDEA, NDPA
and NDBA are being monitored as part of the Unregulated Contaminant Monitoring Rule
2 (UCMR 2) (USEPA, 2011c). Currently, the USEPA is considering regulation of
nitrosamines as a group as part of Goal 1 of its new Drinking Water Strategy (USEPA,
2010).
Nitrosamine occurrence in drinking waters
A survey of 21 US and Canadian drinking water treatment plants (Valentine et al.,
2006) detected NDMA in the finished water of 18 plants. In all but two cases, NDMA
concentrations were below 10 ng/L, a level of regulatory concern in the US. NDMA
concentrations were higher in samples collected from distribution systems. A survey of
3
179 drinking water treatment plants in Ontario (Charrois et al., 2007) found NDMA in
30% of the drinking water systems investigated. The median plant effluent NDMA
concentration was < 1.3 ng/L, but the highest effluent concentration detected was 65
ng/L. As in the survey by Valentine et al., (2006), concentrations were generally higher in
distribution systems. Both of these studies noted that the use of anion exchange resins or
cationic polymers seemed to be associated with higher levels of NDMA. In a study of 6
Japanese treatment plants (Asami et al., 2009), two of the plants had NDMA
concentrations above 10 ng/L in samples taken after ozonation. Biologically activated
carbon effectively removed NDMA, and only one of the 6 treatment plant effluents had
NDMA levels above 3 ng/L. A recent Spanish study (Jurado-Sanchez et al., 2010) found
NDMA in 3 out of 16 tap water samples, with a maximum concentration of 10.3 ng/L.
NDEA was detected in 2 of the samples, with a maximum concentration of 6 ng/L. A
survey of Chinese drinking water treatment plants (Wang et al., 2011) detected NDMA in
7 of 12 finished waters, with a range of 4.6 – 20.5 ng/L. NDEA was also detected in 9 of
12 finished waters, with a concentration range of 1.9 – 16.3 ng/L, and NDBA was
detected in 6 of 12 finished waters, with a range of 0.4 – 3.4 ng/L. NDPA was not
detected. An analysis of UCMR 2 data (Russell et al., in press) showed that, out of 1,196
drinking water systems sampled, 316 or 24.6% contained NDMA at 2 ng/L or above in
the distribution system, with a median NDMA concentration among those plants of less
than 10 ng/L. Other nitrosamines were detected much less frequently. NDEA was
detected at 3 ng/L or above in 2.2% of the systems and NDB was detected at 4 ng/L or
above in 0.4% of the systems. NDPA was not detected in any of the systems sampled.
Mechanism of nitrosamine formation
4
A mechanism of NDMA formation involving the chlorination or chloramination
and subsequent oxidation of dimethylamine (DMA) to form unsymmetrical
dimethylhydrazine (UDMH), which can be oxidized to form NDMA, was proposed in
different mechanistic studies (Mitch and Sedlak, 2002; Choi and Valentine, 2002a; Choi
and Valentine, 2002b). These studies demonstrated that NDMA formation occurs when
water is chloraminated or chlorinated in the presence of ammonia, that increasing
chloramine doses lead to increased NDMA formation, that chloramine is a source of
nitrogen atoms in NDMA, and that DMA is an important NDMA precursor. However,
noting that UDMH does not form NDMA at the yield expected based on NDMA yields
from DMA and that the UDMH models are not robust over a wide pH range, Schreiber
and Mitch (2006) demonstrated that NDMA formation actually depends on dichloramine
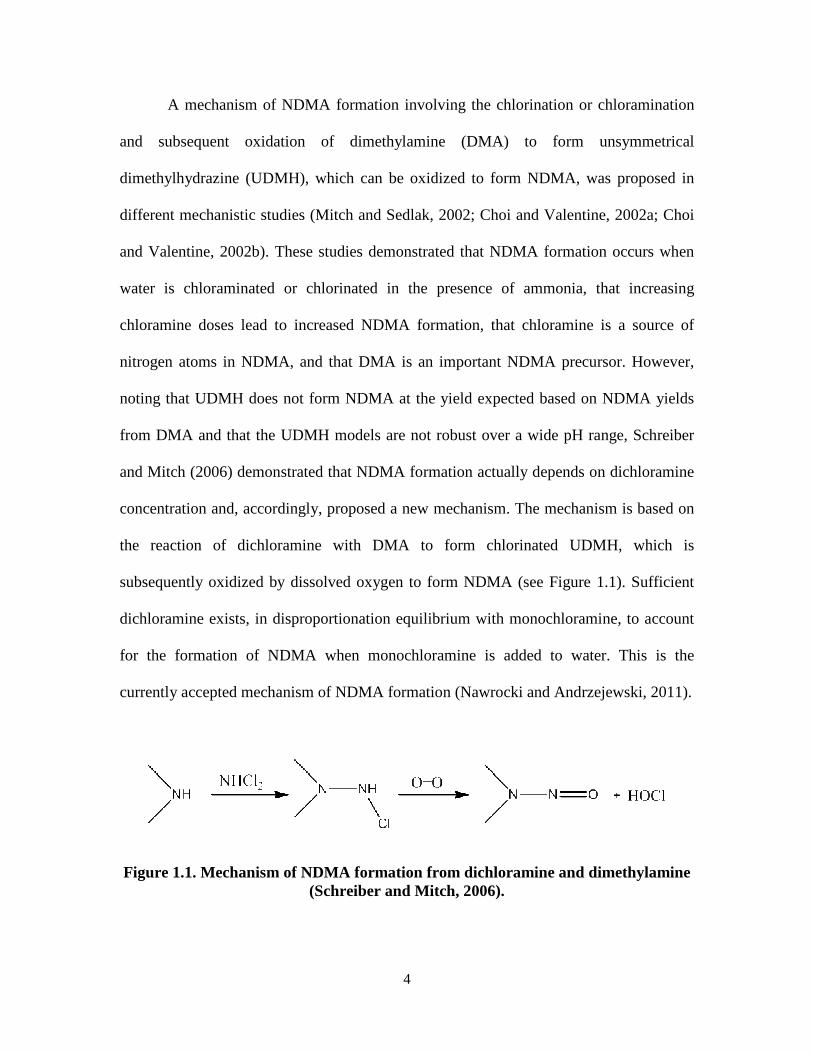
concentration and, accordingly, proposed a new mechanism. The mechanism is based on
the reaction of dichloramine with DMA to form chlorinated UDMH, which is
subsequently oxidized by dissolved oxygen to form NDMA (see Figure 1.1). Sufficient
dichloramine exists, in disproportionation equilibrium with monochloramine, to account
for the formation of NDMA when monochloramine is added to water. This is the
currently accepted mechanism of NDMA formation (Nawrocki and Andrzejewski, 2011).
Figure 1.1. Mechanism of NDMA formation from dichloramine and dimethylamine (Schreiber and Mitch, 2006).
5
Nitrosamine precursors
While DMA has been used as a model NDMA precursor for kinetic and
mechanistic investigations, it was noted (Mitch et al., 2003; Chen and Valentine, 2007;
Padhye et al., 2009) that DMA levels in natural waters could not account for the amounts
of NDMA formed when those waters were chloraminated. Chloramination of natural
organic matter (NOM) has been shown to produce significant amounts of NDMA
(Gerecke and Sedlak, 2003; Chen and Valentine, 2006; Chen and Valentine, 2007).
Dissolved organic nitrogen (DON), a measure of the amount of undefined nitrogen-
containing species in NOM, is believed to be an important factor in the formation of
NDMA in raw drinking water sources (Lee et al., 2007). It has been shown (Mitch and
Sedlak, 2004) that tertiary amines with dimethylamine functional groups can serve as
important NDMA precursors and that trialkylamines can degrade to dialkylamines when
oxidants/disinfectants are added, which then react to form nitrosamines (Mitch and
Schreiber, 2008). Dimethylamine groups within NOM macromolecules are thought to
account for the formation of NDMA by NOM. It is likely that diethylamine (DEA), di-n-
propylamine (DPA) and di-n-butylamine (DBA), and larger molecules containing these
functional groups, serve as analogous precursors to NDEA, NDPA and NDBA,
respectively. A recent study by Wang et al. (2011) showed that DEA and DBA in the
influent and effluent of drinking water treatment plants were precursors of NDEA and
NDBA.
Other chemicals containing DMA functional groups have been shown to form
NDMA upon chloramination, including herbicides (Chen and Young, 2008) and
pharmaceuticals and personal care products (Kemper et al., 2010; Shen and Andrews,
6
2011), which may be present in drinking waters with sources impacted by agricultural
activity or wastewater discharge. Le Roux et al. (2011) found that 5-
(dimethylaminomethyl)furfuryl alcohol, a component of the drug ranitidine, when
chlorinated, formed NDMA at a much higher molar yield than that of DMA (74.9% vs
1.2%). This was attributed to the proximity of an electron-dense furan group to the
reactive DMA group, which enhances the electrophilic attack of chloramine.
In the context of drinking water treatment, cationic coagulant polymers and anion
exchange resins have been identified as sources of nitrosamine precursors. Treatment
with polydiallyldimethylammonium chloride (polyDADMAC) was shown to result in
increased NDMA formation (Wilczak et al., 2003), and reaction mechanisms for the
degradation of polyDADMAC and polyamines to release DMA and form NDMA during
chloramination have been proposed (Park et al., 2009). Polyamine undergoes an
electrophilic attack by chloramines at the tertiary amine chain ends, proceeding through
an imine intermediate, which yields DMA through hydrolysis. PolyDADMAC contains
quaternary amine groups throughout the polymer structure. These groups undergo a
Hofmann elimination, leading to a tertiary amine that degrades in the same manner as the
polyamine chain ends. The relationship between nitrosamines and anion exchange
treatment is discussed below.
Anion Exchange
Anion exchange resins are commonly used for the removal of anionic
contaminants, such as nitrate, perchlorate, arsenic, chromate, and dissolved organic
matter, during drinking water treatment. These resins consist of crosslinked polymer
networks (styrene-divinylbenzene or polyacrylate) functionalized with amine groups to
7
provide positively charged exchange sites. Resins remove anionic contaminants when the
negatively charged contaminants are attracted to the positively charged exchange sites.
The resins bind contaminants and release harmless chloride ions according to Equation
1.1:
Cl- + X-(aq) ↔ X- + Cl-(aq) (1.1)
where underlining indicates the resin phase and X- is an anionic contaminant. Resins are
designed to preferentially remove different anions, binding anions for which they have a
greater selectivity and releasing less selectively bound anions. A qualitative selectivity
spectrum for a typical resin is shown in Equation 1.2, with more selectively bound anions
on the left and less selectively bound anions on the right (Dow Chemical Company,
2011a).
SO42- > NO3
- > Br- > CN- >BrO3- > NO2
- > Cl- > HCO3- > F- (1.2)
As treatment progresses, high-selectivity anions are taken up and fewer exchange sites
are available, so that the resin becomes exhausted. To regenerate the resin, the resin is
treated with concentrated NaCl and the equilibrium in Equation 1.1 is pushed to the left.
The exchange sites release the contaminants into a waste regenerant stream and the resin
is again ready for treatment. Resins are typically regenerated at regular intervals over
their treatment lifetimes. As resins absorb water differently based on the ionic form that
they are in, regeneration causes a change in swelling and places osmotic stress on the
resins (Montgomery Watson Harza, Inc., 2005).
Perchlorate (ClO4-) contamination poses a unique challenge for anion exchange
treatment. Other anions, such as nitrate (NO3-) and sulfate (SO4
2-), often occur at much
higher concentrations than ClO4-, and compete with ClO4
- for exchange sites (Calgon
8
Carbon Corporation, 2005). To address this problem, specific anion exchange resins have
been developed to selectively bind the large, poorly hydrated ClO4- molecule (Gu et al.,
1999). These resins have such high selectivities for ClO4- that regeneration with Cl- is
impractical and so they are utilized as single-use, non-regenerable resins.
The polymer matrices of resins affect their performance. Acrylic resins are more
elastic than polystyrene resins and can handle a greater amount of osmotic stress.
Polystyrene resins, on the other hand, are more rigid and are better for high-pressure
applications as they resist compression.
An important physical characteristic of resins is pore structure. Resins with
macroporous pore structures have highly crosslinked polymer matrices and uniform areas
of high charge density, while gel resins take on a looser, amorphous structure. As a result,
macroporous resins tend to be more physically stable and to have greater affinities for
given anions, while gel resins tend to exhibit much faster exchange kinetics and to have
high exchange capacities by weight (Harland, 1994).
Anion exchange resins are classified according to their functional groups. Resins
with secondary or tertiary amines at their exchange sites are protonated, and thus
positively charged under a limited pH range. Such resins are known as weak base anion
exchange resins. Resins with quaternary amines are positively charged at all pH levels
and are known as strong base anion exchange resins. Strong base anion exchange resins
are further classified into two groups: resins that have trialkylamine groups such as TMA,
triethylamine (TEA), tri-n-propylamine (TPA) or tri-n-butylamine (TBA) are known as
Type I resins, while resins with dimethylethanolamine (DMEA) functional groups are
known as Type II resins.
9
Different resin functional groups can be used to achieve different selectivities.
While resins with TMA functional groups are the simplest, resins with TEA or TBA
functional groups are often used for NO3- and ClO4
- removal because the larger alkyl
chains effectively block the uptake of SO42- (DeSilva, 2003). TBA resins are preferable
for some applications because of their greater SO42- blocking properties, while TEA
resins are preferable in others because the large chains on TBA resins can cause losses in
exchange capacity due to the kinetic effects of steric hindrance (Gu et al., 1999). Type II
resins are similar to TMA resins, with higher operating capacities and exchange
efficiencies but lower chemical stability (Dow Chemical Company, 2011b).
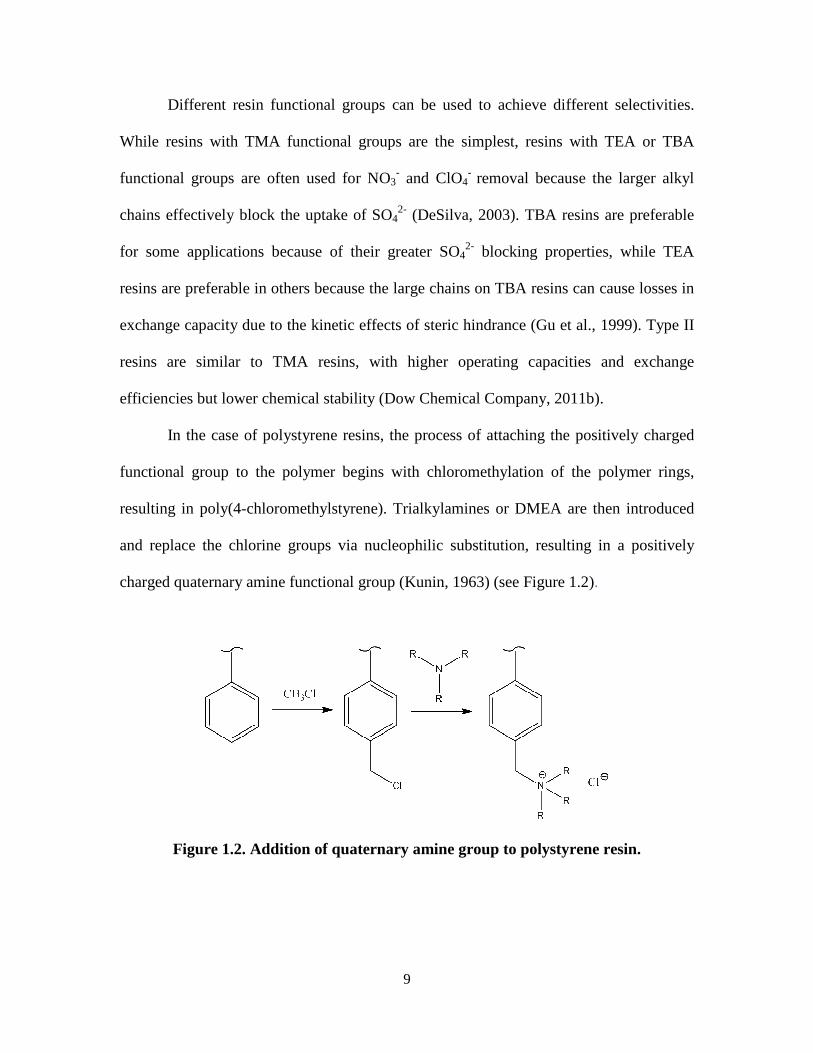
In the case of polystyrene resins, the process of attaching the positively charged
functional group to the polymer begins with chloromethylation of the polymer rings,
resulting in poly(4-chloromethylstyrene). Trialkylamines or DMEA are then introduced
and replace the chlorine groups via nucleophilic substitution, resulting in a positively
charged quaternary amine functional group (Kunin, 1963) (see Figure 1.2).
Figure 1.2. Addition of quaternary amine group to polystyrene resin.
10
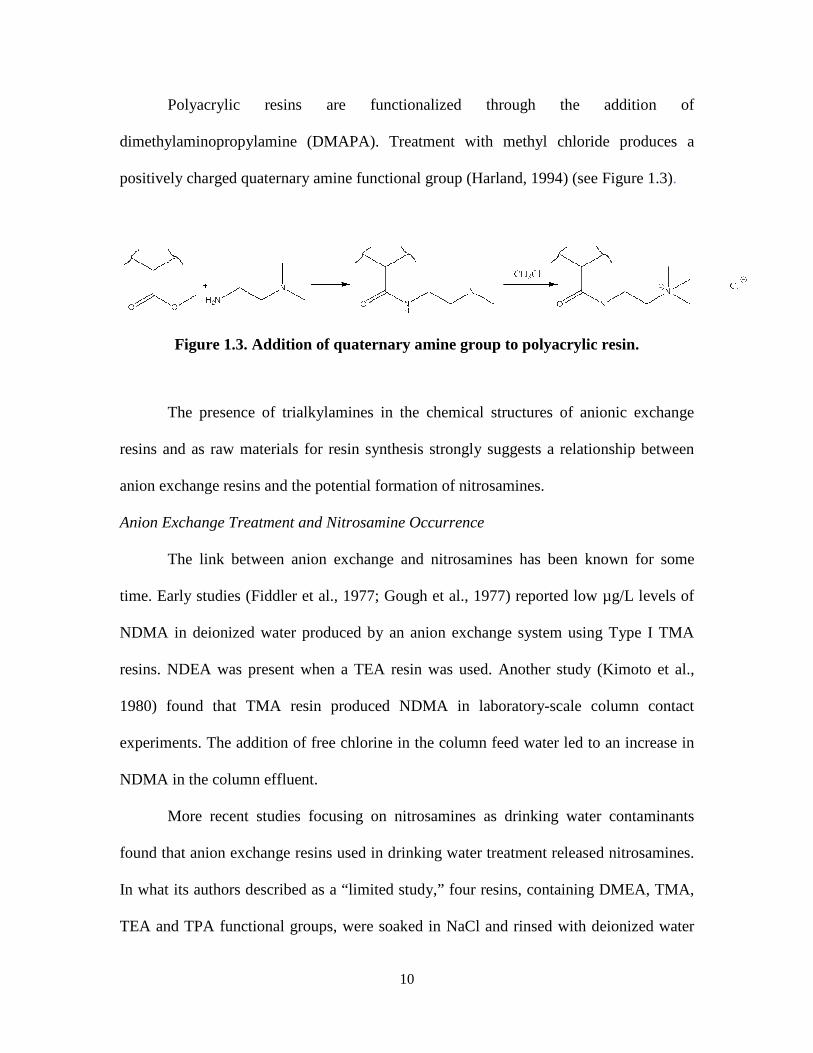
Polyacrylic resins are functionalized through the addition of
dimethylaminopropylamine (DMAPA). Treatment with methyl chloride produces a
positively charged quaternary amine functional group (Harland, 1994) (see Figure 1.3).
Figure 1.3. Addition of quaternary amine group to polyacrylic resin.
The presence of trialkylamines in the chemical structures of anionic exchange
resins and as raw materials for resin synthesis strongly suggests a relationship between
anion exchange resins and the potential formation of nitrosamines.
Anion Exchange Treatment and Nitrosamine Occurrence
The link between anion exchange and nitrosamines has been known for some
time. Early studies (Fiddler et al., 1977; Gough et al., 1977) reported low µg/L levels of
NDMA in deionized water produced by an anion exchange system using Type I TMA
resins. NDEA was present when a TEA resin was used. Another study (Kimoto et al.,
1980) found that TMA resin produced NDMA in laboratory-scale column contact
experiments. The addition of free chlorine in the column feed water led to an increase in
NDMA in the column effluent.
More recent studies focusing on nitrosamines as drinking water contaminants
found that anion exchange resins used in drinking water treatment released nitrosamines.
In what its authors described as a “limited study,” four resins, containing DMEA, TMA,
TEA and TPA functional groups, were soaked in NaCl and rinsed with deionized water
11
before being contacted with untreated groundwater, distilled water, and distilled water
containing nitrite for 3 hours (Najm and Trussel, 2001). The DMEA and TMA resins
released appreciable levels of NDMA (up to 140 ng/L). In this preliminary investigation,
the releases of NDEA or NDPA by the TEA and TPA resins were not measured, nor were
the releases of nitrosamine precursors. In another study (Kemper et al., 2010), a TMA, a
TBA and a DMEA resin were found to release NDMA in continuous-flow column
experiments (empty bed contact time of 6 minutes) with a model water buffered at pH 8.5
and containing chloride, sulfate and nitrate. The resins were not cleaned in any way prior
to the experiments. The resins released high levels of NDMA precursors (1000 - 11,000
ng/L) at the beginning of the flow experiments but the levels quickly subsided. NDMA
precursor levels rose after the resins were regenerated with NaCl, and nitrosamine levels
increased considerably when free chlorine or preformed monochloramine was introduced
to the feed water. The TBA resin released comparable levels of NDMA and NDBA.
Treatment by anion exchange has been previously identified as a contributory
factor for the presence of nitrosamines in finished drinking waters. A study of 21
drinking water treatment plants (Valentine et al., 2006) found that a plant using anion
exchange and chlorination had the highest NDMA levels (10-30 ng/L) in the finished
water. The study included one other plant employing anion exchange to treat a portion of
its water, but the finished water of this plant did not contain similarly high NDMA levels.
A survey conducted by the California Department of Health Services (CDHS, 2002)
investigated 4 plants using anion exchange. One of the 4 plants had NDMA
concentrations (30-34 ng/L) above the California notification level (10 ng/L) for finished
waters.
12
Objectives
As described above, preliminary studies have demonstrated a link between anion
exchange resins and nitrosamines, but these studies were limited in scope. Each dealt
with only three or four resins out of the wide array of resins used for drinking water
treatment applications. Furthermore, these studies focused on NDMA and briefly
addressed NDBA, but there are two other carcinogenic nitrosamines that may be
associated with the use of anion exchange resins.
Accordingly, the overall objective of this research was to investigate the potential
relationship between the use of anion exchange resins in drinking water treatment and the
presence of nitrosamines and nitrosamine precursors in finished drinking water. A large
number of resins were investigated, representing the array of anion exchange resins used
in drinking water treatment practice. The overall objective was pursued as three specific
research objectives:
i) to evaluate the release of nitrosamines and nitrosamine precursors by anion
exchange resins, specifically addressing the release of multiple nitrosamines
and their corresponding precursors by single resins;
ii) to evaluate the effects of different treatment operations on the release of
nitrosamines and nitrosamine precursors by anion exchange resins,
specifically addressing the release of resins at the beginning of operation and
the effects of regeneration, flow interruption, and the presence of free chlorine
or monochloramine in column feed water; and
13
iii) to evaluate the release of nitrosamines and nitrosamine precursors in water
treatment practice through sampling of full-scale drinking water treatment
plants employing resins previously determined through laboratory
experiments to release notable levels of nitrosamines and nitrosamine
precursors.
To meet these objectives, controlled bench-scale batch and continuous-flow column
studies were conducted, and samples were collected from a number of full-scale
treatment plants using anion exchange. Each of these components of the study is
presented as a separate chapter in this dissertation:
Anion exchange resins as a source of nitrosamines and nitrosamine precursors.
I. Batch Contact Experiments. This chapter summarizes the results obtained from batch
contact experiments performed with a large array of resins to assess the release of
NDMA, NDEA, NDPA and NDBA and their precursors from resins with different
chemical structures and functionalities. Resins releasing high levels of nitrosamines and
precursors, or resins releasing more than one nitrosamine with its corresponding
precursors were identified for further study. Resin cleaning arose as an important issue,
and continuous-flow column experiments were suggested to evaluate nitrosamine and
precursor release during rinsing and during subsequent column operations.
Anion exchange resins as a source of nitrosamines and nitrosamine precursors.
II. Simulated Treatment Operations. This chapter summarizes the results obtained
from continuous-flow column contact experiments conducted with resins of interest as
identified during the batch contact studies. Nitrosamine and precursor levels were
monitored during column flow to determine the impact of rinsing on nitrosamine and
14
precursor release. Simulated regenerations and flow interruptions were performed on the
resins and increases in nitrosamine and nitrosamine precursor release due to these
operations were observed. The results of these experiments suggested that full-scale
treatment plant sampling be conducted with attention given to resin regeneration, resin
age (time of operation since installation), and downtime.
The impact of anion exchange treatment on nitrosamine and nitrosamine
precursor concentrations in full-scale drinking water treatment plants. Samples of
anion exchange process influent and effluent were collected at ten full-scale drinking
water treatment plants using resins that were studied in previous laboratory
investigations. When possible, samples were collected before and after resins were
regenerated, or after seasonal downtime. For non-regenerable resins, samples were taken
from systems with different resin ages (time in operation). Plants using multiple resins
were sampled, and multiple plants using the same resin were sampled. Full-scale field
observations were compared to previous laboratory observations to gain insight into
nitrosamine and nitrosamine precursor release in drinking water treatment practice.
The major conclusions of the research and recommendations for further study are
summarized in Chapter 5.
Chapter 2. Anion Exchange Resins as Sources of Nitrosamines and Nitrosamine Precursors. I. Batch Contact Experiments
Introduction
Nitrosamines are a class of highly potent chemical carcinogens that include,
among others, N-nitrosodimethylamine (NDMA), N-nitrosodiethylamine (NDEA), N-
nitrosodi-n-propylamine (NDPA) and N-nitrosodi-n-butylamine (NDBA). Nitrosamines,
especially NDMA, have been detected in a number of drinking waters (Valentine et al.,
2006; Charrois et al., 2007; Zhao et al., 2006; Asami et al., 2009) and are candidates for
USEPA regulation (USEPA, 2011b).
The most thoroughly studied nitrosamine, NDMA, has been identified as a
byproduct of the disinfection of water with chloramines (Choi and Valentine, 2002a).
Extensive research into the mechanism of NDMA formation has shown a two-step
process involving dichloramine and dissolved oxygen reacting with dimethylamine
(DMA) (Choi and Valentine 2002b; Mitch and Sedlak 2002; Schreiber and Mitch 2005;
Schreiber and Mitch 2006). Further study has identified DMA and tertiary amines
containing DMA groups as major nitrosamine precursors (Lee et al., 2007).
Anion exchange resins are commonly used for the removal of anionic
contaminants, such as nitrate, perchlorate, arsenic, chromate, and dissolved organic
matter, during drinking water treatment. Resins are typically composed of a crosslinked
polymer (polystyrene-divinylbenzene or polyacrylic) matrix that is functionalized with
quaternary amine groups to provide positively charged exchange sites. Resins are
16
classified according to functional group. Type I resins have trialkylamines –
trimethylamine (TMA), triethylamine (TEA), triproplyamine (TPA) or tributylamine
(TBA) – at the charged sites, while Type II resins use dimethylethanolamine (DMEA).
In the case of polystyrene resins, the process of attaching the positively charged
functional group to the polymer begins with the chloromethylation of the polymer rings,
resulting in poly(4-chloromethylstyrene). Trialkylamines or DMEA are then introduced
and replace the chlorine groups via nucleophilic substitution, resulting in a positively
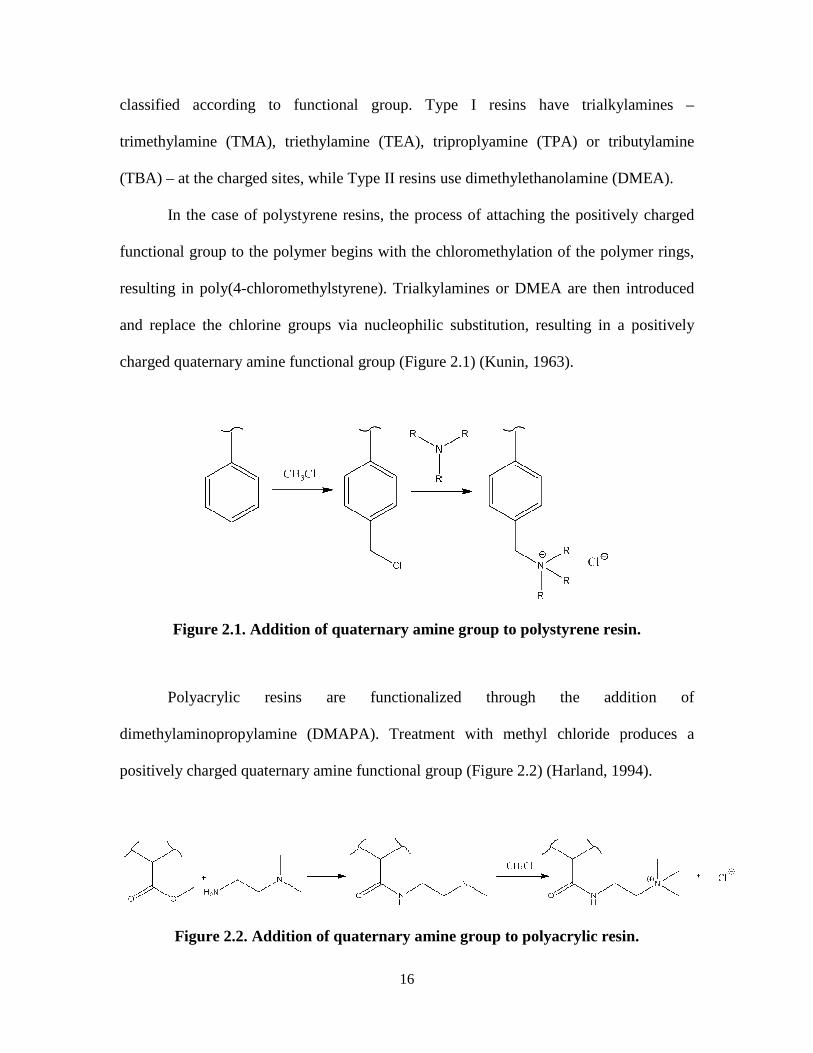
charged quaternary amine functional group (Figure 2.1) (Kunin, 1963).
Figure 2.1. Addition of quaternary amine group to polystyrene resin.
Polyacrylic resins are functionalized through the addition of
dimethylaminopropylamine (DMAPA). Treatment with methyl chloride produces a
positively charged quaternary amine functional group (Figure 2.2) (Harland, 1994).
Figure 2.2. Addition of quaternary amine group to polyacrylic resin.
17
The presence of trialkylamines in the chemical structures of resins and as raw
materials for resin synthesis strongly suggests a relationship between anion exchange
resins and the potential formation of nitrosamines. DMA is a principal precursor of
NDMA, and TMA, DMEA and DMAPA contain the DMA group. Further, TEA, TPA
and TBA may have analogous relationships to NDEA, NDPA and NDBA formation.
Early studies found that anion exchange resins used in deionized water systems
released NDMA (Fiddler et al., 1977; Gough et al., 1977; Kimoto et al., 1980). More
recent studies focusing on nitrosamines as drinking water contaminants found that anion
exchange resins used in drinking water treatment released nitrosamines. In what its
authors described as a “limited study,” four resins, containing DMEA, TMA, TEA and
TPA functional groups, were soaked in NaCl and rinsed with deionized water before
being contacted with untreated groundwater, distilled water, and distilled water
containing nitrite for 3 hours (Najm and Trussel, 2001). The DMEA and TMA resins
released appreciable levels of NDMA (up to 140 ng/L). In this preliminary investigation,
the releases of NDEA or NDPA by the TEA and TPA resins were not measured, nor were
the releases of nitrosamine precursors. In another study (Kemper et al., 2010), a TMA, a
TBA and a DMEA resin were found to release NDMA in continuous-flow column
experiments (empty bed contact time of 6 minutes) with a model water buffered at pH 8.5
and containing chloride, sulfate and nitrate. The resins were not cleaned in any way prior
to the experiments. The resins released high levels of NDMA precursors (1000 - 11,000
ng/L) at the beginning of the flow experiments, but the levels quickly subsided. NDMA
precursor levels rose after resins were regenerated with NaCl, and nitrosamine levels
18
increased considerably when free chlorine or preformed monochloramine was introduced
to the feed water. The TBA resin released comparable levels of NDMA and NDBA.
While these studies demonstrated a link between anion exchange resins and
nitrosamines, they tended to be limited in scope, each investigating three or four different
resins out of the wide array of resins used for drinking water treatment applications.
Furthermore, these studies focused on NDMA, but there are three other carcinogenic
nitrosamines that may be associated with the use of anion exchange resins. The objective
of this study was to investigate the release of NDMA, NDEA, NDPA and NDBA and
their precursors by a large, representative group of resins employed for the treatment of
drinking water. Sixteen resins with different functional groups, pore structures and
polymer matrices from several different manufacturers were subjected to batch contact
experiments to determine nitrosamine and nitrosamine precursor release. The effects of
pH on nitrosamine and nitrosamine precursor release were also studied. A continuous-
flow column study was conducted in follow-up to this batch study and is the subject of
another paper.
Materials and Methods
Materials
NDMA, NDEA, NDPA, NDBA, d6-NDMA and d14-NDPA standards were
obtained from Accustandard (New Haven, CT) and d10-NDEA and d18-NDBA were
obtained from CDN Isotopes (Pointe Claire, Quebec, Canada). EPA Method 521 method-
specific activated carbon solid phase extraction (SPE) cartridges were purchased from
Restek (Bellefonte, PA). Laboratory-grade water (LGW) was prepared using a system
19
consisting of filters, granular activated carbon adsorbers, mixed-bed ion exchange resins
and ultraviolet (UV) treatment. The LGW was analyzed periodically and found to contain
levels of nitrosamines and nitrosamine precursors below detection limits. All other
chemicals were purchased from Fisher Scientific (Pittsburgh, PA) and were reagent-grade
or higher. All glassware was rendered chlorine demand-free, rinsed with acetone and
baked at 400 °C for four hours. Detergent, which often contains TEA, was not used at
any time during glassware preparation.
Strong base anion exchange resins were obtained from four different
manufacturers. Resin characteristics are presented in Table 2.1. The resins investigated
are all commercially available for use in drinking water treatment plants. Of the 16 resins,
5 are TMA resins, 2 are TEA resins, 1 is a TPA resin, 3 are TBA resins, 1 is a TEA/TBA
combination resin, and 4 are Type II DMEA resins. Six have gel structures while 10 have
macroporous structures. Three have a polyacrylic matrix while 13 have a polystyrene
matrix. The resins each came from one batch; possible batch-to-batch differences were
not investigated.
20
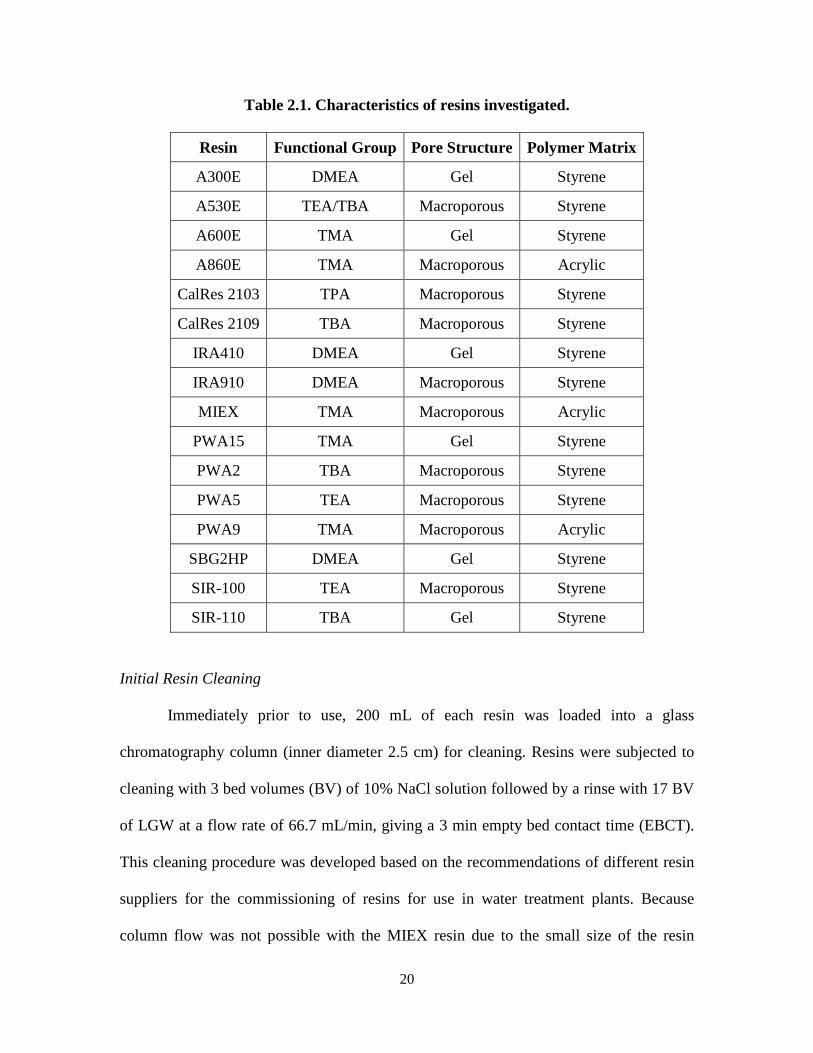
Table 2.1. Characteristics of resins investigated.
Resin Functional Group Pore Structure Polymer Matrix
A300E DMEA Gel Styrene
A530E TEA/TBA Macroporous Styrene
A600E TMA Gel Styrene
A860E TMA Macroporous Acrylic
CalRes 2103 TPA Macroporous Styrene
CalRes 2109 TBA Macroporous Styrene
IRA410 DMEA Gel Styrene
IRA910 DMEA Macroporous Styrene
MIEX TMA Macroporous Acrylic
PWA15 TMA Gel Styrene
PWA2 TBA Macroporous Styrene
PWA5 TEA Macroporous Styrene
PWA9 TMA Macroporous Acrylic
SBG2HP DMEA Gel Styrene
SIR-100 TEA Macroporous Styrene
SIR-110 TBA Gel Styrene
Initial Resin Cleaning
Immediately prior to use, 200 mL of each resin was loaded into a glass
chromatography column (inner diameter 2.5 cm) for cleaning. Resins were subjected to
cleaning with 3 bed volumes (BV) of 10% NaCl solution followed by a rinse with 17 BV
of LGW at a flow rate of 66.7 mL/min, giving a 3 min empty bed contact time (EBCT).
This cleaning procedure was developed based on the recommendations of different resin
suppliers for the commissioning of resins for use in water treatment plants. Because
column flow was not possible with the MIEX resin due to the small size of the resin
21
beads, MIEX resin was cleaned by swirling 200 mL of resin in 200 mL of LGW 20
times.
Batch Contact Experiments
The cleaned resins were contacted with LGW at a resin concentration of 20 mg/L.
The solutions were buffered at pH 7.0 with a 10 mM phosphate buffer. After 1 hour of
contact, the resins were separated from solution using 0.7 µm pore size borosilicate filters
that were rinsed with 1.0 L of LGW and baked at 400 °C for four hours. The solutions
were then analyzed for nitrosamines and nitrosamine formation potential.
Nitrosamine Analysis
Samples for nitrosamine analysis (1.0 L) were spiked with 50 ng/L d6-NDMA,
d10-NDEA, d14-NDPA and d18-NDBA for quantitation by isotope dilution and
extracted using activated carbon SPE cartridges. The cartridges were eluted with 30 mL
of methylene chloride. LGW (1-2 mL) was added to the extracts and the methylene
chloride was removed using a rotary evaporator. The extracts were analyzed by ultra-
performance liquid chromatography tandem mass spectrometry in the positive
electrospray ionization mode using a Waters Acquity UPLC BEH phenyl column (100
mm x 2.1 mm x 1.7 µm). The mobile phase was composed of a 0.2 mM aqueous formic
acid solution and methanol. The percentage of methanol in the mobile phase began at
10% and increased from 10% to 45% from 0 to 4 min and from 45% to 95% from 4 to 6
min, remained at 95% from 6 to 9 min, then decreased from 95% to 10% from 9 to 10
min, remaining at 10% for a 2 min re-equilibration period. Analyte identity confirmation
was achieved by comparing retention times and product ion ratios of sample analytes
22
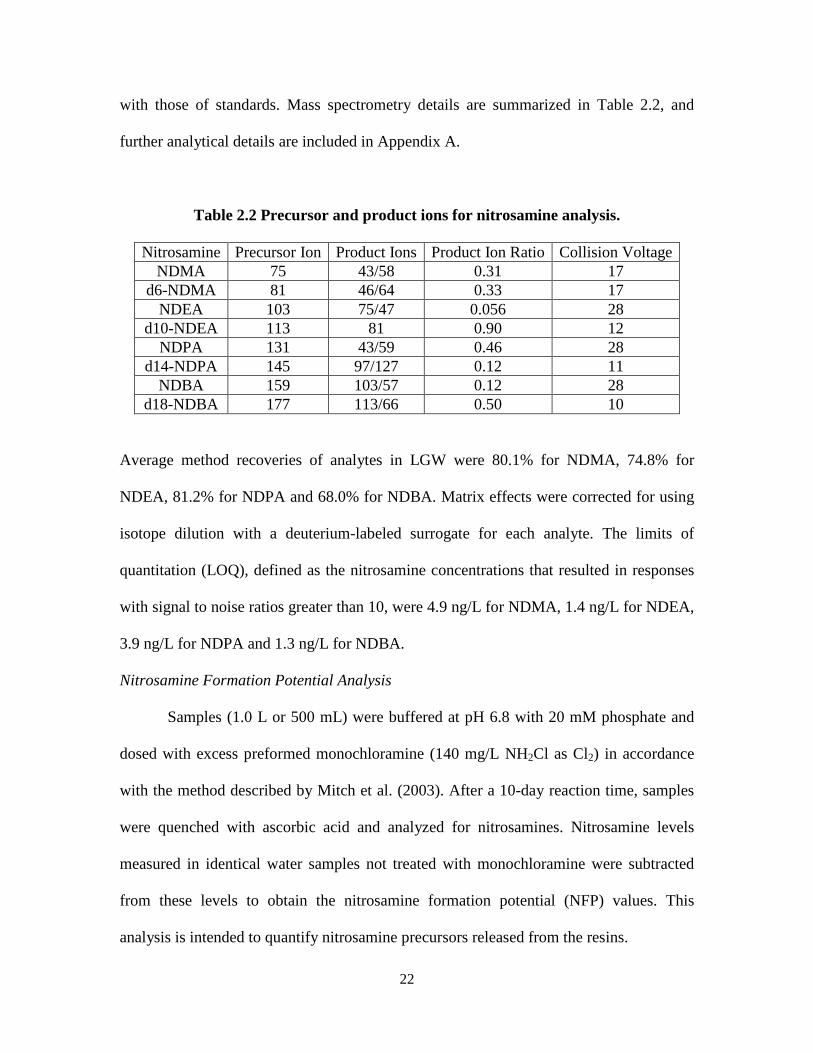
with those of standards. Mass spectrometry details are summarized in Table 2.2, and
further analytical details are included in Appendix A.
Table 2.2 Precursor and product ions for nitrosamine analysis.
Nitrosamine Precursor Ion Product Ions Product Ion Ratio Collision Voltage NDMA 75 43/58 0.31 17
d6-NDMA 81 46/64 0.33 17 NDEA 103 75/47 0.056 28
d10-NDEA 113 81 0.90 12 NDPA 131 43/59 0.46 28
d14-NDPA 145 97/127 0.12 11 NDBA 159 103/57 0.12 28
d18-NDBA 177 113/66 0.50 10
Average method recoveries of analytes in LGW were 80.1% for NDMA, 74.8% for
NDEA, 81.2% for NDPA and 68.0% for NDBA. Matrix effects were corrected for using
isotope dilution with a deuterium-labeled surrogate for each analyte. The limits of
quantitation (LOQ), defined as the nitrosamine concentrations that resulted in responses
with signal to noise ratios greater than 10, were 4.9 ng/L for NDMA, 1.4 ng/L for NDEA,
3.9 ng/L for NDPA and 1.3 ng/L for NDBA.
Nitrosamine Formation Potential Analysis
Samples (1.0 L or 500 mL) were buffered at pH 6.8 with 20 mM phosphate and
dosed with excess preformed monochloramine (140 mg/L NH2Cl as Cl2) in accordance
with the method described by Mitch et al. (2003). After a 10-day reaction time, samples
were quenched with ascorbic acid and analyzed for nitrosamines. Nitrosamine levels
measured in identical water samples not treated with monochloramine were subtracted
from these levels to obtain the nitrosamine formation potential (NFP) values. This
analysis is intended to quantify nitrosamine precursors released from the resins.
23
Results and Discussion
General Batch Contact Experiments
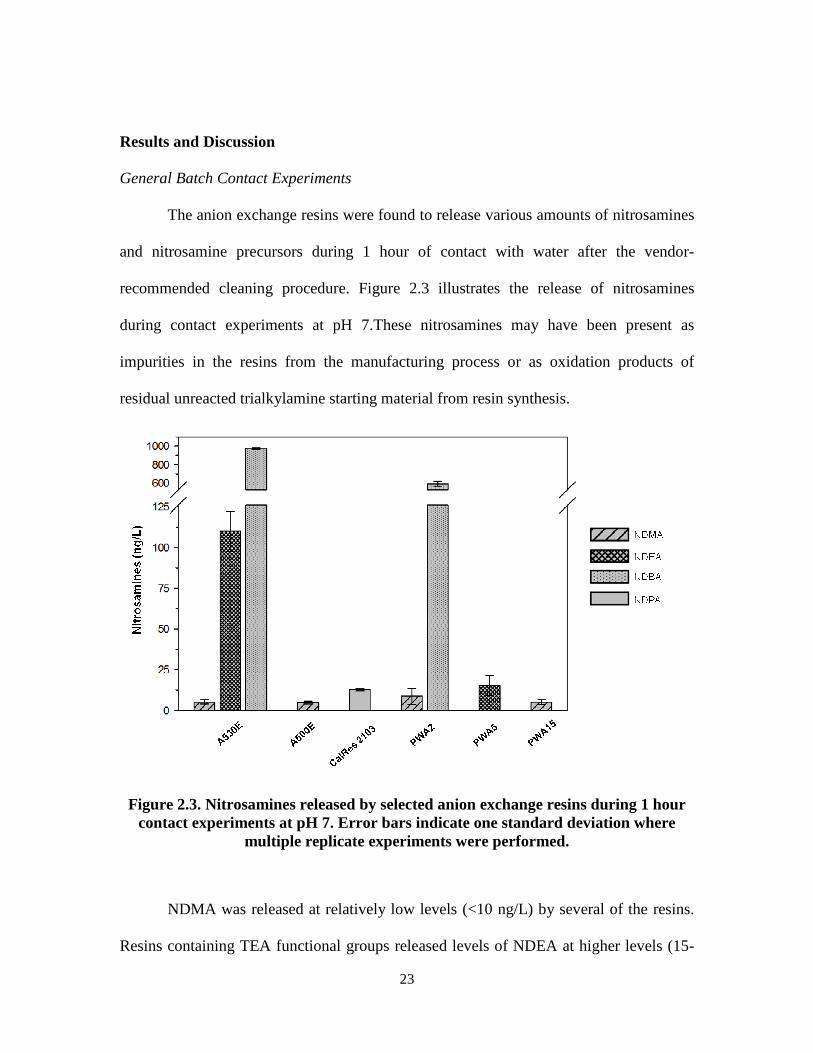
The anion exchange resins were found to release various amounts of nitrosamines
and nitrosamine precursors during 1 hour of contact with water after the vendor-
recommended cleaning procedure. Figure 2.3 illustrates the release of nitrosamines
during contact experiments at pH 7.These nitrosamines may have been present as
impurities in the resins from the manufacturing process or as oxidation products of
residual unreacted trialkylamine starting material from resin synthesis.
Figure 2.3. Nitrosamines released by selected anion exchange resins during 1 hour contact experiments at pH 7. Error bars indicate one standard deviation where
multiple replicate experiments were performed.
NDMA was released at relatively low levels (<10 ng/L) by several of the resins.
Resins containing TEA functional groups released levels of NDEA at higher levels (15-
24
110 ng/L), and resins containing TBA functional groups released NDBA at yet higher
levels (592-974 ng/L). The higher releases of NDEA and NDBA can be explained by
their different chemical structures. Longer alkyl chains make molecules more
hydrophobic, and more hydrophobic molecules are more likely to be trapped in the
hydrophobic polymer matrices of the resins during resin formulation. NDBA, with the
longest alky chain, can be expected to be retained in the polymer matrix to the greatest
extent and is therefore released at the highest concentrations, followed by NDEA and
NDMA.
The lone resin containing TPA functional groups (CalRes 2103) released NDPA
at 13 ng/L. All of the other resins listed in Table 2.1 but not included in Figure 2.3 were
investigated and found to release nitrosamines at levels below the limits of quantitation.
Of all the resins tested, 6 out of 16 released nitrosamines at quantifiable levels.
Resin A530E, a bi-functional TEA/TBA resin, released not only NDEA and
NDBA, but also NDMA. It is noteworthy that this resin and Resin PWA2, a TBA resin,
released NDMA as there are no corresponding TMA of DMA functionalities present in
these resins. This NDMA is probably derived from TMA impurities present in the TEA
and TBA starting materials used to synthesize the resins. Kemper et al. (2009) reported
the release of NDMA by a TBA resin, but found that the resin released comparable
amounts of NDMA and NDBA rather than the very different concentrations reported
here. Najm and Trussel (2001) reported that TEA and TPA resins released very low
levels of NDMA but did not investigate NDEA or NDPA release. In this study, resins
containing only TMA functional groups did not release detectable levels of NDEA,
25
NDPA or NDBA or their precursors. Resin PWA5, a TEA resin, released NDEA but no
detectable NDMA.
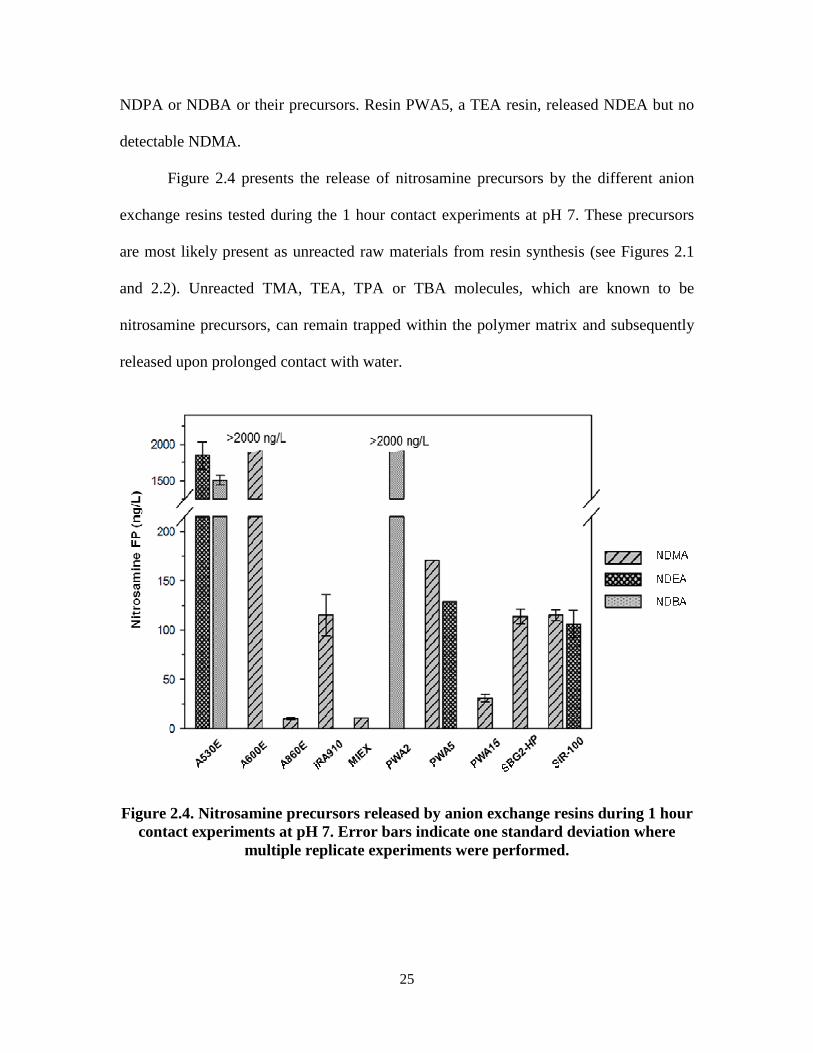
Figure 2.4 presents the release of nitrosamine precursors by the different anion
exchange resins tested during the 1 hour contact experiments at pH 7. These precursors
are most likely present as unreacted raw materials from resin synthesis (see Figures 2.1
and 2.2). Unreacted TMA, TEA, TPA or TBA molecules, which are known to be
nitrosamine precursors, can remain trapped within the polymer matrix and subsequently
released upon prolonged contact with water.
Figure 2.4. Nitrosamine precursors released by anion exchange resins during 1 hour contact experiments at pH 7. Error bars indicate one standard deviation where
multiple replicate experiments were performed.
26
NDMA, NDEA and NDBA precursors were released over a wide range of
concentrations, with NDMA and NDBA precursor release in excess of 2000 ng/L (the
highest calibration standard injected) and NDEA precursor release reaching 1850 ng/L.
Resins that released nitrosamines generally released nitrosamine precursors at
appreciably higher levels. Resins A860E, CalRes 2103 and PWA9 released nitrosamine
precursors below quantitation limits.
Resin SIR-100, a TEA resin, released NDMA precursors as well as NDEA
precursors. Again, this was noteworthy because TEA resin preparation does not include
any TMA starting materials that could go unreacted and be released as NDMA
precursors. Resin A530E, a bi-functional TEA/TBA resin, and PWA2, a TBA resin, both
released NDMA but did not release quantifiable concentrations of NDMA precursors.
pH Batch Contact Experiments
Because pH can affect the extent of charge for any of the residual trialkylamine
contaminants associated with any of the resins and is a factor in NDMA formation, the
impact of pH on the release of nitrosamines and nitrosamine precursors was investigated.
Batch contact experiments were performed on selected resins at various pH levels from
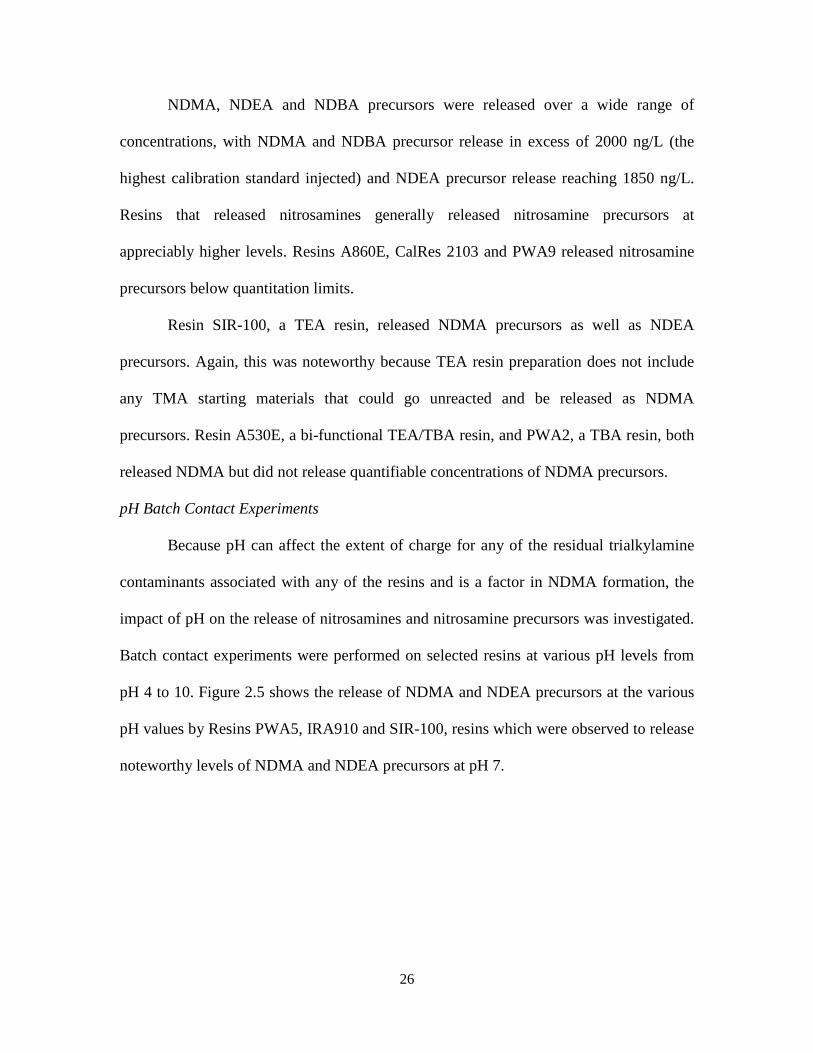
pH 4 to 10. Figure 2.5 shows the release of NDMA and NDEA precursors at the various
pH values by Resins PWA5, IRA910 and SIR-100, resins which were observed to release
noteworthy levels of NDMA and NDEA precursors at pH 7.
27
Figure 2.5. Release of NDMA and NDEA precursors at different pH levels.
As illustrated, there was no appreciable difference in NDMA/NDEA precursor
release by Resins PWA5 and IRA910 from pH 6 to pH 8, or in NDMA/NDEA precursor
release by Resin SIR100 from pH 4 to pH 10.
Summary
The release of nitrosamines by some resins and the release of nitrosamine
precursors by many resins among a large, representative group of anion exchange resins
used in water treatment practice has been demonstrated and confirmed. The release of
multiple nitrosamine precursors by single resins, and the previously unreported release of
NDEA and NDEA precursors by TEA resins are significant findings. Of special concern
are the high releases of nitrosamines by some resins and the high releases of nitrosamine
precursors by several of the resins. Accordingly, it is important to consider the effects of
resin-cleaning on nitrosamine and nitrosamine precursor release prior to placing them in
28
service. It is not possible, using batch experiments, to distinguish between surface
contaminants that are easily washed away and precursors embedded within the resin
structure that are steadily released over time. Continuous flow-through column
experiments with a large, representative group of resins are recommended to further
investigate the release of nitrosamines and nitrosamine precursors by anion exchange
resins.
Chapter 3. Anion Exchange Resins as Sources of Nitrosamines and Nitrosamine Precursors. II. Simulated Treatment Operations
Introduction
Nitrosamines are a class of highly potent chemical carcinogens that include,
among others, N-nitrosodimethylamine (NDMA), N-nitrosodiethylamine (NDEA) and N-
nitrosodi-n-butylamine (NDBA). Nitrosamines, especially NDMA, have been detected in
a number of drinking waters (Valentine et al., 2006; Charrois et al., 2007; Wang et al.,
2011) and are candidates for EPA regulation. NDMA has been identified as a byproduct
of the disinfection of drinking water with chloramines (Choi and Valentine, 2002a) and
compounds containing dimethylamine (DMA) groups have been identified as important
NDMA precursors (Mitch and Sedlak, 2004).
Anion exchange resins are commonly used for the removal of anionic
contaminants such as nitrate, perchlorate, arsenic, chromate, and dissolved organic matter
during drinking water treatment. These resins consist of crosslinked polymer networks
(styrene-divinylbenzene or polyacrylate) functionalized with quaternary amine groups to
provide positively charged exchange sites. Exchange site functional groups include
trimethylamine (TMA), dimethylethanolamine (DMEA), triethylamine (TEA) and tri-n-
butylamine (TBA). TMA and DMEA both contain DMA and can thus react to form
NDMA. TEA and TBA have analogous relationships to NDEA and NDBA, respectively.
The presence of these trialkylamines in the chemical structures of resins and as raw
30
materials for resin synthesis strongly suggests a relationship between anion exchange
resins and potential formation of nitrosamines.
Recent studies have found that anion exchange resins can serve as sources of
nitrosamines and nitrosamine precursors. In a limited study (Najm and Trussel, 2001),
four resins were soaked in NaCl, rinsed, and contacted with untreated groundwater,
distilled water, and distilled water containing nitrite for 3 hours. Two resins containing
TMA and DMEA functional groups released NDMA at concentrations up to 140 ng/L.
Nitrosamine precursors and other nitrosamines were not investigated. A more
comprehensive study investigated sixteen resins (see Chapter 2). The resins were rinsed
with NaCl and laboratory-grade water before being contacted with water at pH 7 for 1
hour. Six of the resins were found to release nitrosamines, with NDMA releases below 9
ng/L, while NDEA levels up to 110 ng/L and NDBA levels as high as 970 ng/L were
reported. Ten of the resins were found to release nitrosamine precursors, with NDEA
precursor release as high as 1850 ng/L and NDMA and NDBA precursor releases above
2000 ng/L. Resins containing TEA and TBA functional groups were found to release
NDMA precursors in addition to TEA and TBA precursors.
It was noted (see Chapter 2) that it is not possible, using batch experiments, to
distinguish between surface contaminants that are easily washed away and precursors
embedded within the resin structure that may be steadily released over time. They
recommended that continuous flow-through column experiments be conducted to more
appropriately investigate the release of nitrosamines and nitrosamine precursors by anion
exchange resins.
31
Kemper et al. (2010) conducted bench-scale column studies using a TMA resin, a
DMEA resin and a TBA resin. The resins were subjected to a continuous flow of water
containing chloride, sulfate and nitrate, buffered at pH 8.5. The resins released low levels
of NDMA (rarely above 10 ng/L). The resins released high levels of NDMA precursors
(1000 - 11,000 ng/L) at the beginning of the experiments, but the releases quickly
subsided. NDMA precursor levels rose again after the resins were regenerated with NaCl,
and nitrosamine levels increased considerably when free chlorine or preformed
monochloramine was introduced to the feed water. The TBA resin released comparable
levels of NDMA and NDBA.
Previous studies have examined small groups of three or four resins, and all but
one were limited to batch studies. The objective of this study was to investigate the
release of nitrosamines and nitrosamine precursors in flow-through column studies by a
large, representative group of resins used for the treatment of drinking water. Fourteen
resins with different functional groups, pore structures and polymer matrices from
different manufacturers were contacted with a model water in continuous-flow column
contact experiments. Treatment plant operations, including regeneration, periodic down-
time, and the introduction of low levels of oxidant, were simulated. The initial releases of
nitrosamines and nitrosamine precursors, and the effects of these treatment operations on
nitrosamine and nitrosamine precursor release, were observed.
32
Materials and Methods
Materials
NDMA, NDEA, NDBA, and d6-NDMA standards were obtained from
Accustandard (New Haven, CT). d10-NDEA and d18-NDBA were obtained from CDN
Isotopes (Pointe Claire, Quebec, Canada). EPA Method 521 method-specific activated
carbon solid-phase extraction (SPE) cartridges were purchased from Restek (Bellefonte,
PA). Laboratory-grade water (LGW) was prepared using a system consisting of filters,
granular activated carbon adsorbers, mixed-bed ion exchange resins and UV irradiation
treatment. The LGW was analyzed periodically and no nitrosamines or nitrosamine
precursors were detected. All other chemicals were purchased from Fisher Scientific
(Pittsburgh, PA) and were reagent-grade or higher. All glassware was rendered chlorine
demand-free, rinsed with acetone and baked at 400 °C for four hours. Detergent, which
often contains TEA, was not used at any time during glassware preparation. To avoid
contamination, no rubber was used in the column setup.
Strong base anion exchange resins were obtained from four different
manufacturers that provide resins for water treatment practice. Samples of a
representative collection of Type I resins with TMA, TEA and TBA functional groups as
exchange sites, as well as bi-functional resins using both TEA and TBA and Type II
resins with DMEA functional groups, were used in the experiments. The group includes
resins with both gel and macroporous pore structures. All of the resins have polymer
backbones consisting of styrene crosslinked with divinylbenzene except for A860E,
which contains a polyacrylate backbone. Resin characteristics are presented in Table 3.1.
Each of these resins is commercially available for use in drinking water treatment plants.
33
The resins each came from one batch; possible batch-to-batch differences were not
investigated.
Table 3.1. Characteristics of resins investigated.
Resin Functional Group Pore Structure Polymer Backbone
A300E DMEA Macroporous Styrene
A400E TMA Gel Styrene
A520E TEA Macroporous Styrene
A530E TEA/TBA Macroporous Styrene
A532E TEA/TBA Gel Styrene
A600E TMA Gel Styrene
A860E TMA Macroporous Acrylic
CalRes 2109 TBA Macroporous Styrene
IRA400 TMA Gel Styrene
PWA15 TMA Gel Styrene
PWA2 TBA Macroporous Styrene
PWA5 TEA Macroporous Styrene
SIR-100 TEA Macroporous Styrene
SIR-110 TBA Gel Styrene
TAN-1 TMA Macroporous Styrene
Continuous-flow Column Contact Experiments
Resins (200 mL bed volume (BV)) were packed into glass chromatographic
columns with an inner diameter of 2.5 cm. LGW containing 10 mM phosphate buffer at
pH 7 was passed through the columns at a flow rate of 66.7 mL/min, resulting in an
empty bed contact time (EBCT) of 3 min. This EBCT is typical of contact times used for
ion exchange in water treatment practice. The columns were regenerated periodically
34
with 600 mL (3 BV) of a 10% NaCl solution. Column flow was interrupted periodically
and the resins were stored submerged in the columns for 12-14 hours. Feed water
containing free chlorine (0.24 mg/L as Cl2) or preformed monochloramine (0.24 mg/L as
Cl2) was introduced at the end of each experiment. At the conclusion of each experiment,
the resin was removed from the column and discarded, and the column was cleaned with
nitric acid and acetone and rinsed with LGW before being packed with a new resin.
Samples (2.0 L, 10 BV) were collected at the beginning of each column
experiment and immediately before and after regenerations, flow interruptions and the
introduction of oxidant, and were analyzed for nitrosamines and nitrosamine precursors.
Nitrosamine Analysis
NDMA, NDEA and NDBA were analyzed as previously reported (see Chapter 2).
Briefly, samples were spiked with 50 ng/L d6-NDMA, d10-NDEA, and d18-NDBA for
quantitation by isotope dilution before being concentrated with activated carbon SPE
cartridges and eluted with methylene chloride. LGW was added to the extracts and
methylene chloride was removed using a rotary evaporator. The extracts were analyzed
by ultra performance liquid chromatography – tandem mass spectrometry (UPLC-
MS/MS). Limits of quantitation (LOQ) were 4.9 ng/L for NDMA, 1.4 ng/L for NDEA
and 1.3 ng/L for NDBA.
Nitrosamine Formation Potential Analysis
Nitrosamine precursors were analyzed as previously reported (see Chapter 2)
following the method described by Mitch et al. (2003). Briefly, samples were reacted
with a large excess of preformed monochloramine for 10 days, after which they were
analyzed for nitrosamines as described above.
35
Results and Discussion
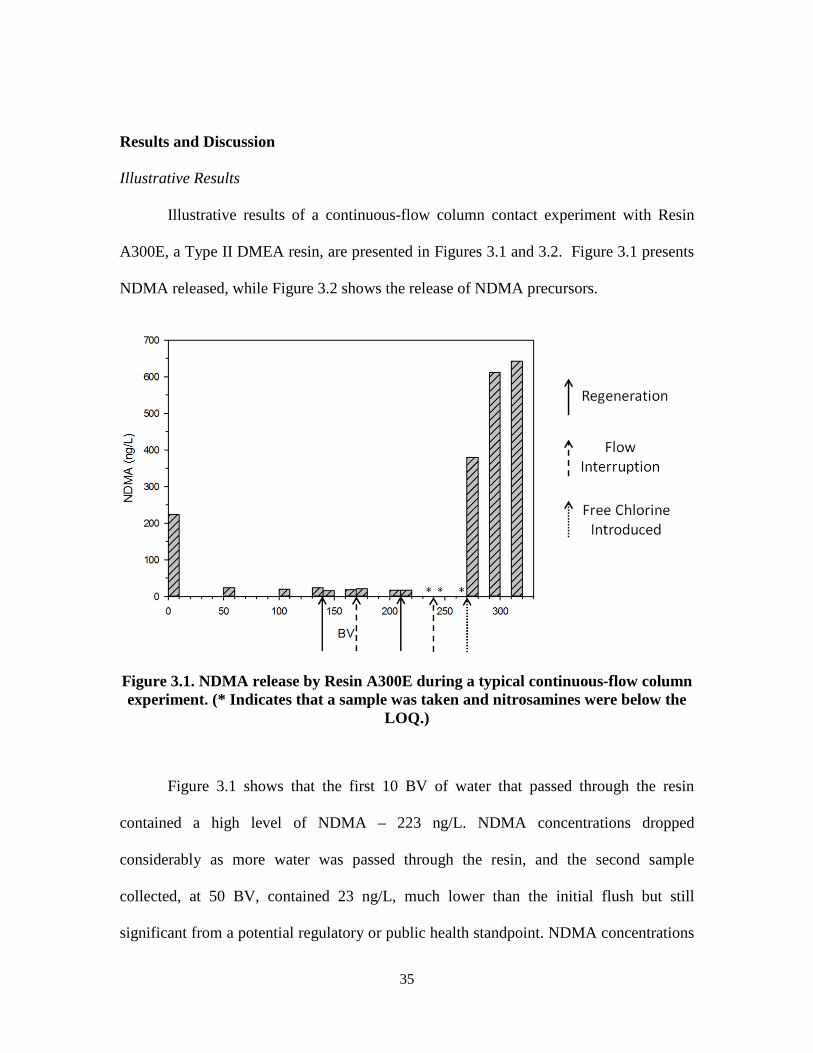
Illustrative Results
Illustrative results of a continuous-flow column contact experiment with Resin
A300E, a Type II DMEA resin, are presented in Figures 3.1 and 3.2. Figure 3.1 presents
NDMA released, while Figure 3.2 shows the release of NDMA precursors.
Figure 3.1. NDMA release by Resin A300E during a typical continuous-flow column experiment. (* Indicates that a sample was taken and nitrosamines were below the
LOQ.)
Figure 3.1 shows that the first 10 BV of water that passed through the resin
contained a high level of NDMA – 223 ng/L. NDMA concentrations dropped
considerably as more water was passed through the resin, and the second sample
collected, at 50 BV, contained 23 ng/L, much lower than the initial flush but still
significant from a potential regulatory or public health standpoint. NDMA concentrations
36
remained at a similar level, even after two regenerations, and it was not until 240 BV of
water was processed that NDMA levels dropped below the LOQ of 4.9 ng/L. There was
no apparent increase in NDMA levels as a result of regeneration or from the two 12-14
hour flow interruptions. When feed water containing 0.24 mg/L free chlorine was
introduced, NDMA levels rose dramatically, reaching 380 ng/L within the first 10 BV
and 642 ng/L within 50 BV. Column effluent contained the same free chlorine
concentration as column feed water. No further samples were collected.
Figure 3.2 presents NDMA precursors released during the same continuous-flow
column experiment. With respect to NDMA formation potential, the first 10 BV of water
that passed through the resin contained a high level of NDMA precursors – 1402 ng/L.
Precursor levels, like NDMA levels, fell quickly, with the sample collected at 50 BV
containing 34 ng/L. In contrast to the findings for NDMA itself, NDMA precursor levels
increased as a result of regeneration and flow interruption. The first regeneration resulted
in an NDMA precursor increase of 50 ng/L while the second regeneration resulted in no
apparent increase. The first 12-14 hour flow interruption resulted in an NDMA precursor
increase of 378 ng/L and the second 12-14 hour flow interruption resulted in a precursor
increase of 103 ng/L. In each case, the increased levels of NDMA precursors caused by
regeneration or flow interruption subsided within 40 BV. While the introduction of 0.24
mg/L free chlorine resulted in a dramatic increase in NDMA (see Figure 3.1), it did not
result in an increase in NDMA precursors.
37
Figure 3.2. NDMA precursor release by Resin A300E during a typical continuous-flow column experiment. (* Indicates that a sample was taken and nitrosamine
formation potentials were below the LOQ.)
The results of a continuous-flow column experiment with Resin A530E, a bi-
functional TEA/TBA resin, are presented in Figures 3.3 and 3.4 to illustrate findings for
the other functional groups. NDBA release was high in the first 10 BV (1300 ng/L) and
NDEA release was appreciable (33 ng/L). NDMA was also present at high levels (130
ng/L) in the first 10 BV, even though the resin did not contain any TMA functionality.
NDMA levels dropped immediately, with no quantifiable NDMA detected after 50 BV.
NDBA was persistent, remaining above 600 ng/L through 100 BV before decreasing to
209 ng/L, still an appreciable level, at 140 BV. NDEA levels remained between 30 and
70 ng/L throughout the first 140 BV. Regeneration did not lead to any increase in
NDMA, but caused a decrease in the concentrations of NDEA and NDBA. A 12-14 hour
38
flow interruption led to appreciable increases of 208 ng/L for NDEA and 640 ng/L for
NDBA, but no increase in NDMA.
39
Figure 3.3. Nitrosamine release by Resin A530E during a typical continuous-flow column experiment. a) NDMA release; b) NDEA release; c) NDBA release
(* Indicates that a sample was taken and nitrosamine formation potentials were below the LOQ.)
40
Figure 3.4. Nitrosamine precursor release by Resin A530E during a typical continuous-flow column experiment. a) NDMA precursor release; b) NDEA
precursor release; c) NDBA precursors release. (* Indicates that a sample was taken and nitrosamine formation potentials were below the LOQ. X indicates that a
sample was lost during processing.)
41
While the sample collected in the first 10 BV of water that passed through the
resin was lost, the water passed through the column from 50 – 60 BV contained high
levels of NDEA and NDBA precursors (1108 and 1569 ng/L, respectively), and even
higher levels of NDMA precursors (>2000 ng/L, the highest calibration point used),
despite the fact that this resin did not contain TMA functional groups. The concentration
of NDBA precursors appeared to be lowered to non-detectable levels with continued
flow. However, while their concentrations decreased over time, NDMA and NDEA
precursors continued to leach from the resin. Regeneration caused an increase in NDMA
and NDBA precursor levels but not for NDEA precursors, and the 12-14 hour flow
interruption resulted in an increase in precursor levels for all three nitrosamines.
Additional Investigations
Resins A530E and PWA5 were subjected to ten successive regenerations in
additional column experiments. Results (see Appendix B) indicated that nitrosamine
precursor release decreased with repeated regenerations.
Column experiments were performed with Resins PWA5 and TAN-1 immediately
after receipt of resin samples and after six months of storage in the dark at 4°C to test the
stability of the resin during storage. Results were inconclusive, as Resin PWA5 released
appreciably increased levels of both NDMA and NDEA precursors after six months,
while Resin TAN-1 released comparable levels in both experiments (see Appendix B).
Reproducibility
To investigate the reproducibility of the experimental procedure, three identical
column experiments were performed with Resin PWA15. The results of these
42
experiments are included in Appendix C. None of the samples collected during these
experiments contained quantifiable levels of nitrosamines themselves, although they did
contain appreciable levels of nitrosamine precursors. NDMA precursor levels measured
in samples collected before and after regeneration and before and after the 12-14 hour
flow interruption agreed with each other within a relative standard deviation of 30%. The
initial 10 BV replicate samples exhibited large standard deviations, but they were
reproducible in that they all showed high NDMA formation potentials. An explanation
for the high standard deviations among the first 10 BV replicates is given in Appendix C.
Summary of Results for all Resins Tested
Column experiments similar to those illustrated above were performed with each
of the resins listed in Table 3.1. The results for the other resins are presented in Appendix
D. Seven of the fourteen resins investigated released quantifiable levels of nitrosamines
in the first 10 BV of flow. These nitrosamines are probably present as impurities from the
resin synthesis process, as suggested by Kemper et al. (2010) and in Chapter 2. In each
case, elevated levels of nitrosamine release dropped to low ng/L levels within 100 BV of
flow. Resin A530E was the only resin to release elevated levels of nitrosamines after
regeneration and flow interruption (see Figure D.7).
The release of nitrosamine precursors was more interesting. Table 3.2 presents the
release of NDMA precursors by resins with TMA and DMEA functional groups in the
first 10 BV, due to regeneration, and due to flow interruption. Table 3.3 presents the
release of NDMA, NDEA and NDBA precursors by resins with TEA or TBA functional
groups and by TEA/TBA bi-functional resins.
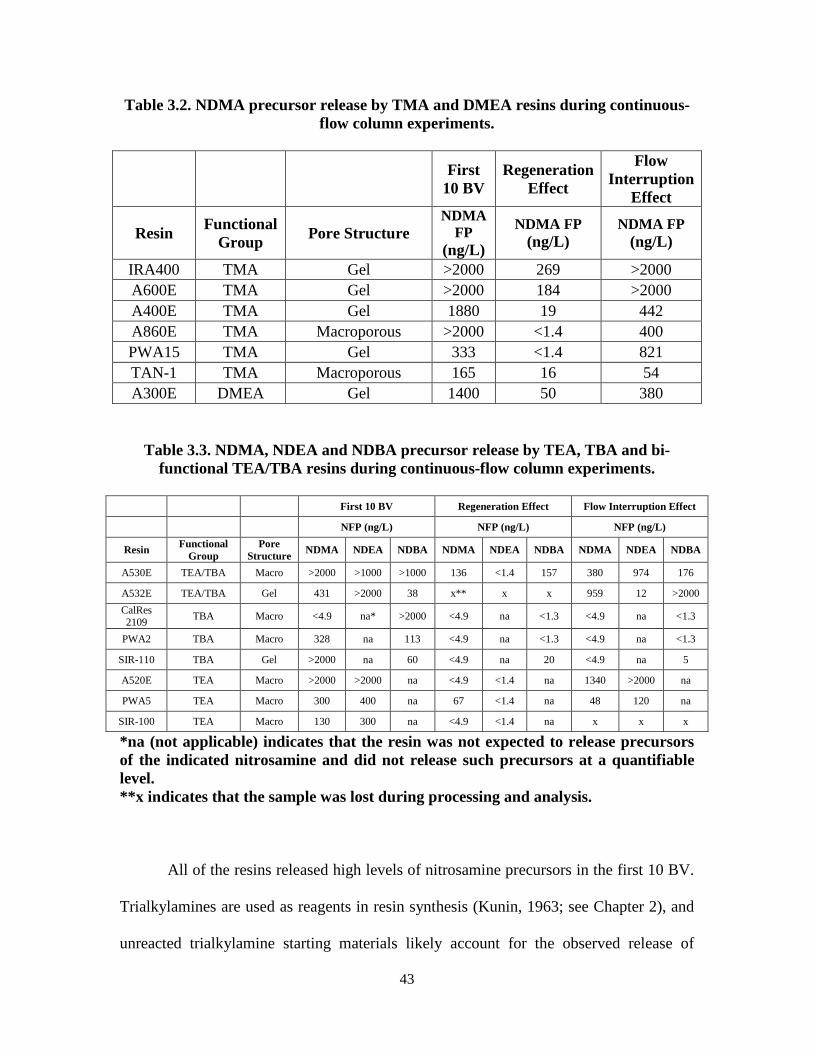
43
Table 3.2. NDMA precursor release by TMA and DMEA resins during continuous-flow column experiments.
First
10 BV Regeneration
Effect
Flow Interruption
Effect
Resin Functional
Group Pore Structure NDMA
FP (ng/L)
NDMA FP (ng/L)
NDMA FP (ng/L)
IRA400 TMA Gel >2000 269 >2000 A600E TMA Gel >2000 184 >2000 A400E TMA Gel 1880 19 442 A860E TMA Macroporous >2000 <1.4 400 PWA15 TMA Gel 333 <1.4 821 TAN-1 TMA Macroporous 165 16 54 A300E DMEA Gel 1400 50 380
Table 3.3. NDMA, NDEA and NDBA precursor release by TEA, TBA and bi-functional TEA/TBA resins during continuous-flow column experiments.
First 10 BV Regeneration Effect Flow Interruption Effect
NFP (ng/L) NFP (ng/L) NFP (ng/L)
Resin Functional Group
Pore Structure
NDMA NDEA NDBA NDMA NDEA NDBA NDMA NDEA NDBA
A530E TEA/TBA Macro >2000 >1000 >1000 136 <1.4 157 380 974 176
A532E TEA/TBA Gel 431 >2000 38 x** x x 959 12 >2000
CalRes 2109
TBA Macro <4.9 na* >2000 <4.9 na <1.3 <4.9 na <1.3
PWA2 TBA Macro 328 na 113 <4.9 na <1.3 <4.9 na <1.3
SIR-110 TBA Gel >2000 na 60 <4.9 na 20 <4.9 na 5
A520E TEA Macro >2000 >2000 na <4.9 <1.4 na 1340 >2000 na
PWA5 TEA Macro 300 400 na 67 <1.4 na 48 120 na
SIR-100 TEA Macro 130 300 na <4.9 <1.4 na x x x
*na (not applicable) indicates that the resin was not expected to release precursors of the indicated nitrosamine and did not release such precursors at a quantifiable level. **x indicates that the sample was lost during processing and analysis.
All of the resins released high levels of nitrosamine precursors in the first 10 BV.
Trialkylamines are used as reagents in resin synthesis (Kunin, 1963; see Chapter 2), and
unreacted trialkylamine starting materials likely account for the observed release of
44
nitrosamine precursors. Precursor release typically dropped to low ng/L levels within 100
BV of column throughput.
It is noteworthy that TEA, TBA and bi-functional TEA/TBA resins also released
NDMA precursors (see Table 3.3). TEA and TBA are used as starting materials during
synthesis of these resins; thus they are likely the sources of the NDEA and NDBA
formation potential. These trialkylamines are not expected to react with preformed
monochloramine to form NDMA as TMA does. However, commercial trialkylamines
have been shown to contain trialkylamines of differing alkyl chain lengths as impurities
(de Zeeuw, 2011). The presence of TMA as an impurity in TEA and TBA likely accounts
for the NDMA formation potential observed. No TMA resins released quantifiable levels
of NDEA or NDBA or their precursors.
In general, NDMA precursors were washed away more quickly than NDEA or
NDBA precursors when multiple nitrosamine precursors were released. This illustrates
the ability of the resins to act as reverse-phase chromatographic media. The NDMA
precursors have shorter carbon chains and so are less hydrophobic in nature and,
accordingly, were not retained in the columns. In contrast, NDEA and NDBA precursors
have longer carbon chains and are more hydrophobic, causing them to be retained by the
resins and released at a slower rate
Regeneration of the resins with 3 BV of 10% NaCl produced an immediate spike
in nitrosamine precursor release in seven of the fourteen resins tested. Following this
spike, precursor levels returned to low ng/L levels within 20 BV of throughput. The
following explanation might account for this behavior. Resins are shipped in the chloride
form, i.e. with Cl- as the counterion, and are designed to selectively exchange these Cl-
45
counterions for specific contaminants such as NO3-. The resins need to equilibrate with
all anions in solution and, in this controlled laboratory study, had the potential to take up
H2PO4- and HPO4
2- to some degree when contacted with the pH 7 buffered water,
according to Equation 3.1,
Cl- + X-(aq) ↔ X- + Cl-(aq) (3.1)
where the underlined terms refer to the resin phase and X- is H2PO4- or HPO4
2- . When
concentrated NaCl is introduced to the column as feed water during regeneration, the
equilibrium is pushed back to the left and the resins return to the chloride form. The
moisture content of a resin changes as a function of the ionic form of the resin
(Montgomery Watson Harza, Inc., 2005). The change in swelling that the resins undergo
due to changes in moisture content may cause the polymer matrix to release unreacted
trialkylamines that are trapped within the polymer structure, resulting in the increase in
nitrosamine precursors observed as a result of regeneration. That there was no increase in
nitrosamine release as a result of regeneration suggests that any nitrosamines present as
impurities existed on the surface of the resins and were fully washed away before
regeneration, while the residual trialkylamine precursors are also embedded within the
polymer backbone of the resins. The results from the column studies in which resins
underwent repeated regeneration (see Appendix B) indicated that nitrosamine precursors
that might be embedded within the resin are ultimately washed out over time. Equation
3.1 applies in water treatment practice as well, where X- can be nitrate, perchlorate, etc.
Hence, nitrosamine precursors can be expected to be released during water treatment
practice when the resins are regenerated, due to changing moisture content of the resins
and different swelling behavior. Each resin has a different structure and can therefore be
46
expected to undergo different changes in swelling. Because macroporous resins are rigid
and highly crosslinked while gel resins are looser, the two types of resins were expected
to behave differently with respect to nitrosamine and nitrosamine precursor release, with
gel resins possibly exhibiting greater swelling changes during regeneration, leading to
higher releases. However, no discernable differences between the behaviors of the two
types of resins were observed.
When flow was interrupted for 12-14 hours and resins were allowed to sit in
prolonged contact with the water, there was typically an elevated level of nitrosamine
precursors released in the first 10 BV of throughput after flow resumed. During the
extended contact time of the flow interruption, water is able to more fully penetrate the
polymer backbone of the resins and any residual trialkylamine precursors held within the
polymer structure enters the aqueous phase, resulting in the increased levels of
nitrosamine precursors observed. Tables 3.2 and 3.3 indicate that, in most cases,
nitrosamine precursors in the first 10 BV of flow were higher than levels released after
flow interruption, which were in turn higher than those released after regeneration. This
suggests that most of the unreacted residual trialkylamine precursor material is at or near
the surface of the resins and is rinsed away more quickly.
The bi-functional TEA/TBA resins tended to release higher levels of nitrosamine
precursors than did the resins containing only TEA or TBA. TBA resins released NDMA
and NDBA precursors in the first 10 BV but did not release any precursors upon flow
interruption or regeneration.
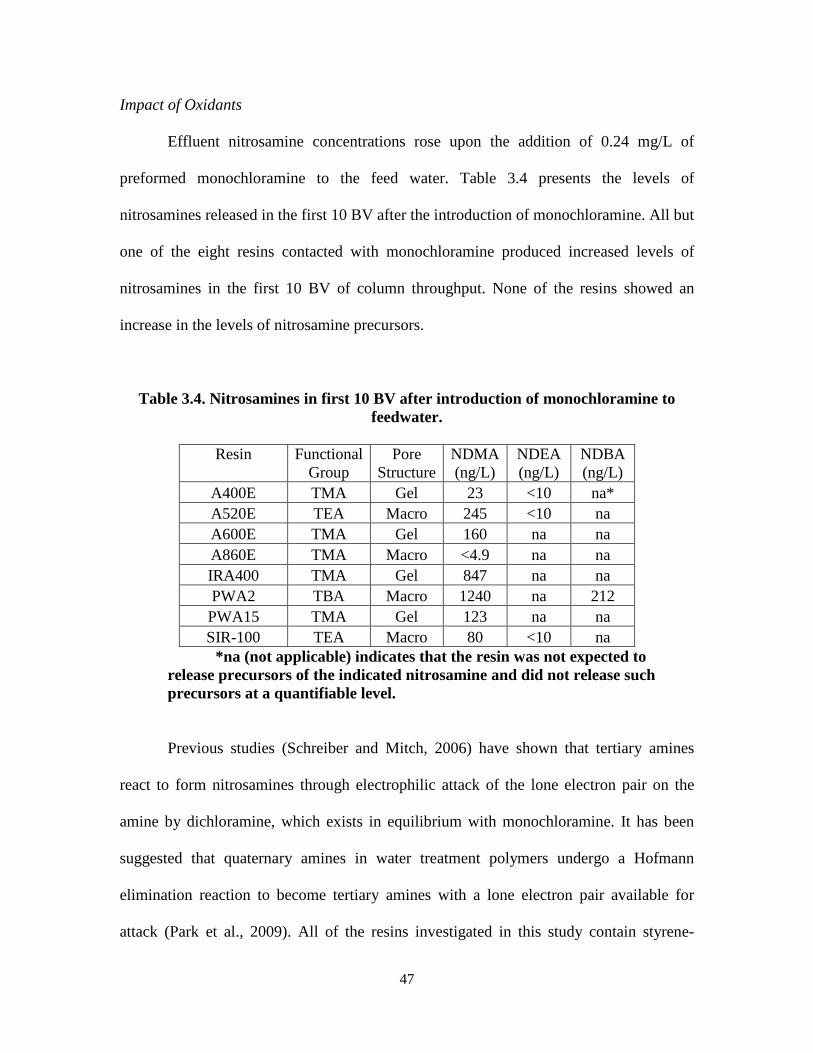
47
Impact of Oxidants
Effluent nitrosamine concentrations rose upon the addition of 0.24 mg/L of
preformed monochloramine to the feed water. Table 3.4 presents the levels of
nitrosamines released in the first 10 BV after the introduction of monochloramine. All but
one of the eight resins contacted with monochloramine produced increased levels of
nitrosamines in the first 10 BV of column throughput. None of the resins showed an
increase in the levels of nitrosamine precursors.
Table 3.4. Nitrosamines in first 10 BV after introduction of monochloramine to feedwater.
Resin Functional
Group Pore
Structure NDMA (ng/L)
NDEA (ng/L)
NDBA (ng/L)
A400E TMA Gel 23 <10 na* A520E TEA Macro 245 <10 na A600E TMA Gel 160 na na A860E TMA Macro <4.9 na na IRA400 TMA Gel 847 na na PWA2 TBA Macro 1240 na 212 PWA15 TMA Gel 123 na na SIR-100 TEA Macro 80 <10 na
*na (not applicable) indicates that the resin was not expected to release precursors of the indicated nitrosamine and did not release such precursors at a quantifiable level.
Previous studies (Schreiber and Mitch, 2006) have shown that tertiary amines
react to form nitrosamines through electrophilic attack of the lone electron pair on the
amine by dichloramine, which exists in equilibrium with monochloramine. It has been
suggested that quaternary amines in water treatment polymers undergo a Hofmann
elimination reaction to become tertiary amines with a lone electron pair available for
attack (Park et al., 2009). All of the resins investigated in this study contain styrene-
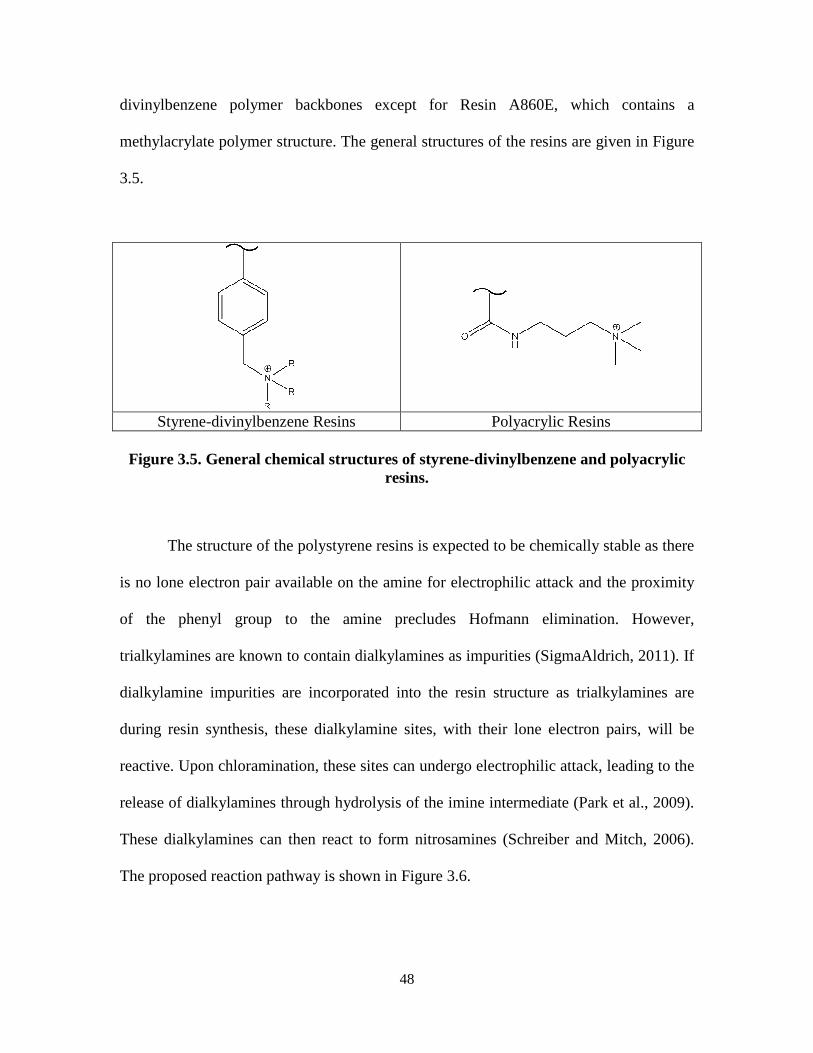
48
divinylbenzene polymer backbones except for Resin A860E, which contains a
methylacrylate polymer structure. The general structures of the resins are given in Figure
3.5.
Styrene-divinylbenzene Resins Polyacrylic Resins
Figure 3.5. General chemical structures of styrene-divinylbenzene and polyacrylic resins.
The structure of the polystyrene resins is expected to be chemically stable as there
is no lone electron pair available on the amine for electrophilic attack and the proximity
of the phenyl group to the amine precludes Hofmann elimination. However,
trialkylamines are known to contain dialkylamines as impurities (SigmaAldrich, 2011). If
dialkylamine impurities are incorporated into the resin structure as trialkylamines are
during resin synthesis, these dialkylamine sites, with their lone electron pairs, will be
reactive. Upon chloramination, these sites can undergo electrophilic attack, leading to the
release of dialkylamines through hydrolysis of the imine intermediate (Park et al., 2009).
These dialkylamines can then react to form nitrosamines (Schreiber and Mitch, 2006).
The proposed reaction pathway is shown in Figure 3.6.
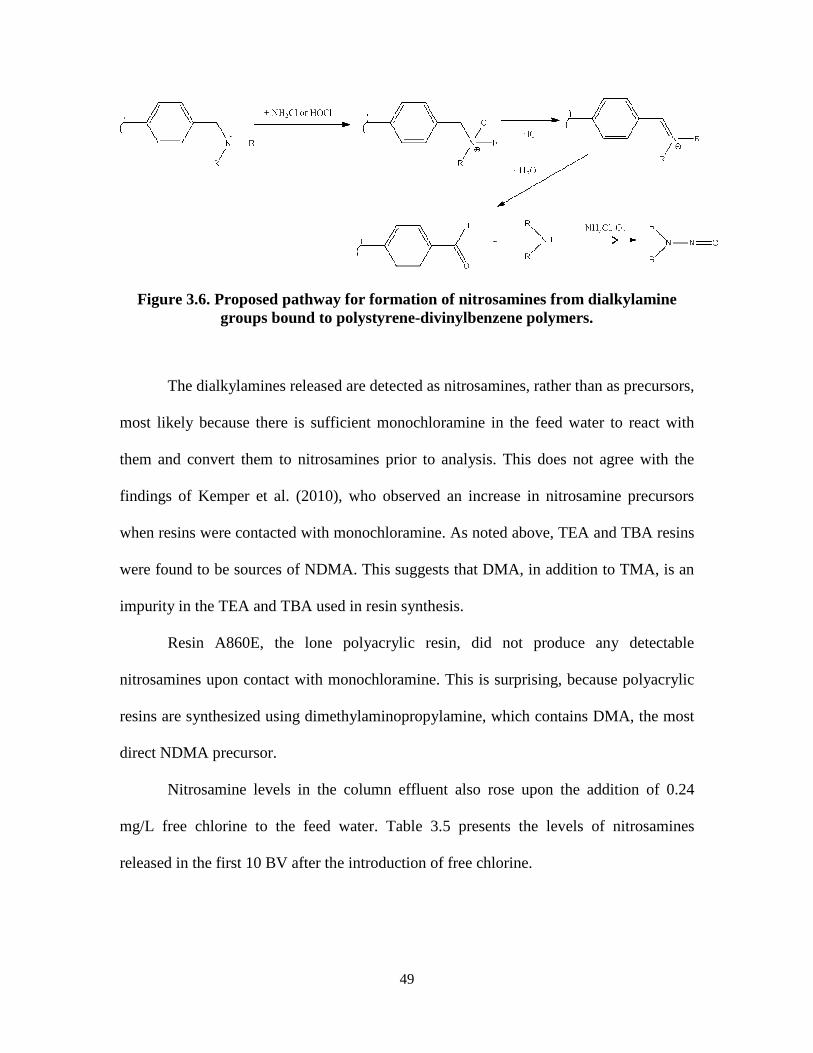
49
Figure 3.6. Proposed pathway for formation of nitrosamines from dialkylamine groups bound to polystyrene-divinylbenzene polymers.
The dialkylamines released are detected as nitrosamines, rather than as precursors,
most likely because there is sufficient monochloramine in the feed water to react with
them and convert them to nitrosamines prior to analysis. This does not agree with the
findings of Kemper et al. (2010), who observed an increase in nitrosamine precursors
when resins were contacted with monochloramine. As noted above, TEA and TBA resins
were found to be sources of NDMA. This suggests that DMA, in addition to TMA, is an
impurity in the TEA and TBA used in resin synthesis.
Resin A860E, the lone polyacrylic resin, did not produce any detectable
nitrosamines upon contact with monochloramine. This is surprising, because polyacrylic
resins are synthesized using dimethylaminopropylamine, which contains DMA, the most
direct NDMA precursor.
Nitrosamine levels in the column effluent also rose upon the addition of 0.24
mg/L free chlorine to the feed water. Table 3.5 presents the levels of nitrosamines
released in the first 10 BV after the introduction of free chlorine.
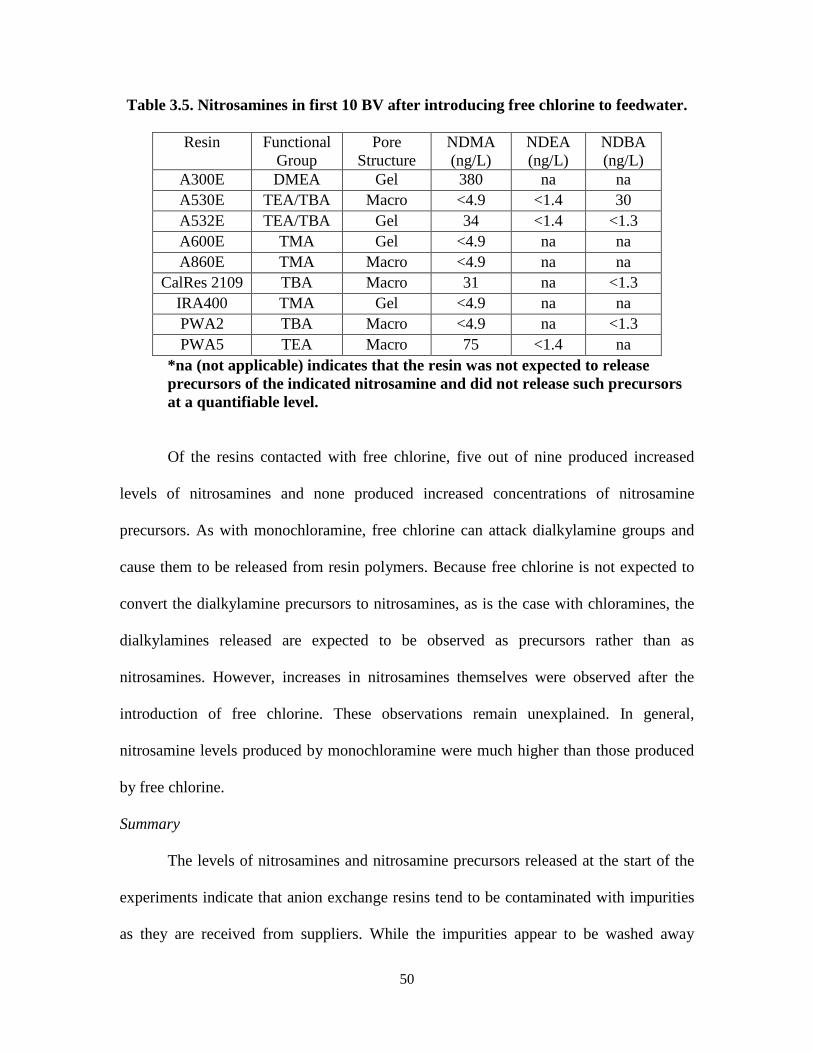
50
Table 3.5. Nitrosamines in first 10 BV after introducing free chlorine to feedwater.
Resin Functional Group
Pore Structure
NDMA (ng/L)
NDEA (ng/L)
NDBA (ng/L)
A300E DMEA Gel 380 na na A530E TEA/TBA Macro <4.9 <1.4 30 A532E TEA/TBA Gel 34 <1.4 <1.3 A600E TMA Gel <4.9 na na A860E TMA Macro <4.9 na na
CalRes 2109 TBA Macro 31 na <1.3 IRA400 TMA Gel <4.9 na na PWA2 TBA Macro <4.9 na <1.3 PWA5 TEA Macro 75 <1.4 na
*na (not applicable) indicates that the resin was not expected to release precursors of the indicated nitrosamine and did not release such precursors at a quantifiable level.
Of the resins contacted with free chlorine, five out of nine produced increased
levels of nitrosamines and none produced increased concentrations of nitrosamine
precursors. As with monochloramine, free chlorine can attack dialkylamine groups and
cause them to be released from resin polymers. Because free chlorine is not expected to
convert the dialkylamine precursors to nitrosamines, as is the case with chloramines, the
dialkylamines released are expected to be observed as precursors rather than as
nitrosamines. However, increases in nitrosamines themselves were observed after the
introduction of free chlorine. These observations remain unexplained. In general,
nitrosamine levels produced by monochloramine were much higher than those produced
by free chlorine.
Summary
The levels of nitrosamines and nitrosamine precursors released at the start of the
experiments indicate that anion exchange resins tend to be contaminated with impurities
as they are received from suppliers. While the impurities appear to be washed away
51
relatively quickly, the spikes in precursor levels after regeneration and flow interruption
leading to prolonged contact times raise concern that drinking waters treated with anion
exchange resins may experience periodic increases in nitrosamine levels that occur for
extended periods of time. The increase in nitrosamine levels observed when oxidants
such as free or combined chlorine were introduced to the feed waters, even at relatively
low concentrations, clearly illustrate the need to prevent any chlorine from entering the
anion exchange resin vessels. While most nitrosamine research has been focused on
NDMA, the release of NDEA and NDBA precursors by several of the resins suggests that
the occurrence and behavior of these other nitrosamines are deserving of further
investigation.
Chapter 4. The Impact of Anion Exchange Treatment on Nitrosamine and Nitrosamine Precursor Concentrations in Full-Scale Drinking Water Treatment
Plants
Introduction
Nitrosamines are a class of highly potent chemical carcinogens and include,
among others, N-nitrosodimethylamine (NDMA), N-nitrosodiethylamine (NDEA), and
N-nitrosodi-n-butylamine (NDBA). NDMA, the most thoroughly studied and most
commonly detected nitrosamine, has been identified as a byproduct of the disinfection of
water with chloramines (e.g. Choi and Valentine, 2002a). NDMA, NDEA and NDBA
have been detected in a number of drinking waters (Valentine et al., 2006; Charrois et al.,
2007; Zhao et al., 2007; Asami et al., 2009; Wang et al., 2011). Nitrosamines are
regulated in drinking water in California with notification levels of 10 ng/L (CA DPH,
2008) and are candidates for Federal EPA regulation (USEPA, 2011b).
The presence of nitrosamines in finished drinking water has been linked to the use
of anion exchange resins for treatment. Dimethylamine (DMA) has been identified as a
key precursor of NDMA (Choi and Valentine, 2002b), and diethylamine (DEA) and di-n-
butylamine (DBA) have been shown to have analogous relationships to NDEA and
NDBA (Wang et al., 2011). Anion exchange resins have trialkylamine groups such as
trimethylamine (TMA), dimethylethanolamine (DMEA), triethylamine (TEA) or tri-n-
butylamine (TBA) bound to a polymer backbone as positively charged anion exchange
53
sites. TMA has been shown to degrade to DMA and further react to form NDMA (Lee et
al., 2007), and it is likely that DMEA, TEA and TBA exhibit similar behaviors.
The link between anion exchange and nitrosamines has been demonstrated in the
laboratory. Four resins having different functional groups were soaked in NaCl, rinsed,
and contacted with water for 3 hours, and the resins containing TMA and DMEA
released up to 140 ng/L NDMA (Najm and Trussel, 2001). A more comprehensive study
(see Chapter 2) contacting 16 resins with buffered water after an NaCl rinse found that
TMA and DMEA resins released NDMA and NDMA precursors. TEA and TBA resins
released NDEA and NDBA and their precursors, respectively, while also releasing
NDMA and NDMA precursors. Of the sixteen resins investigated in that study, six
released notable levels of nitrosamines and ten released appreciable levels of precursors,
with nitrosamine releases as high as 1000 ng/L and precursor releases reaching more than
2000 ng/L.
Continuous-flow bench-scale column experiments have yielded insights into the
release of nitrosamines and their precursors under simulated treatment conditions. In one
study (Kemper et al., 2010), three resins were contacted with water buffered at pH 8.5.
The resins released high levels of NDMA precursors (1000 – 11,000 ng/L) at the start of
the experiments, with noticeable spikes in precursor levels after simulated regeneration
with NaCl. Nitrosamine levels increased considerably when free chlorine or preformed
monochloramine was introduced to the feed water. An expanded continuous-flow column
study (see Chapter 3) found that thirteen of fourteen resins investigated released high
levels of nitrosamine precursors (from 130 ng/L to over 2000 ng/L) in the first 10 bed
volumes of flow. Nitrosamine precursor levels rose dramatically in the first 10 bed
54
volumes after NaCl regeneration and after water stood in the columns during a 12-14-
hour flow interruption. The introduction of monochloramine to the feed water caused
elevated nitrosamine release. All resins, regardless of their functional groups or structure,
released NDMA precursors, and TEA and TBA resins additionally released precursors of
the corresponding nitrosamines, NDEA and NDBA.
Anion exchange has been previously identified as a contributory factor for the
presence of nitrosamines in finished drinking waters. A study of 21 drinking water
treatment plants (Valentine et al., 2006) found that a plant using anion exchange and
chlorination had the highest NDMA levels (10-30 ng/L) in its finished water. That study
included one other plant employing anion exchange to treat a portion of its water, but the
finished water at this plant did not contain elevated NDMA levels. A survey conducted
by the California Department of Health Services (CDHS) investigated NDMA in four
plants using anion exchange (CDHS, 2002). One of the four plants had elevated NDMA
concentrations (30-34 ng/L) in its finished water.
While these studies suggested a link between anion exchange use and the
presence of nitrosamines in drinking water, they tended to be limited in scope, and only
one investigated NDMA precursors. Furthermore, while these studies focused on NDMA
occurrence, there are other nitrosamines that may have relationships to anion exchange
resins commonly used in the field, namely NDEA and NDBA. Additionally, the studies
measured overall plant influent and effluent, only isolating the anion exchange process in
one instance. Accordingly, the objective of this research was to investigate the effect of
anion exchange treatment on levels of NDMA, NDEA and NDBA and their precursors in
a select sampling of drinking water treatment plants using anion exchange. Ten drinking
55
water treatment plants, using a total of nine different anion exchange resins for the
removal of various contaminants under differing conditions, were identified for sampling.
Samples of anion exchange process influent and effluent were taken to isolate the release
of nitrosamines and their precursors by the anion exchange resins.
Materials and Methods
Approach
Previous research has identified resins that released high levels of nitrosamines
and precursors during bench-scale experiments (see Chapters 2 and 3). Accordingly, full-
scale drinking water treatment plants using these resins of interest were identified for
sampling. As precursor levels were shown in the laboratory to increase after resin
regeneration, samples were taken immediately before and after regeneration in those
facilities at which regenerable resins were used. To corroborate laboratory findings that
prolonged contact time results in an increase in nitrosamine precursor levels, water that
had been sitting in a resin vessel for several months was sampled. Additionally, sample
sites were selected to assess the impact of resin age, i.e. how long the resins had been in
place since they were first installed. In selecting sampling sites, consideration was given
to geographical diversity, i.e. eastern US, midwest, and west coast. Descriptive
information about the sampling sites is presented in Table 4.1.
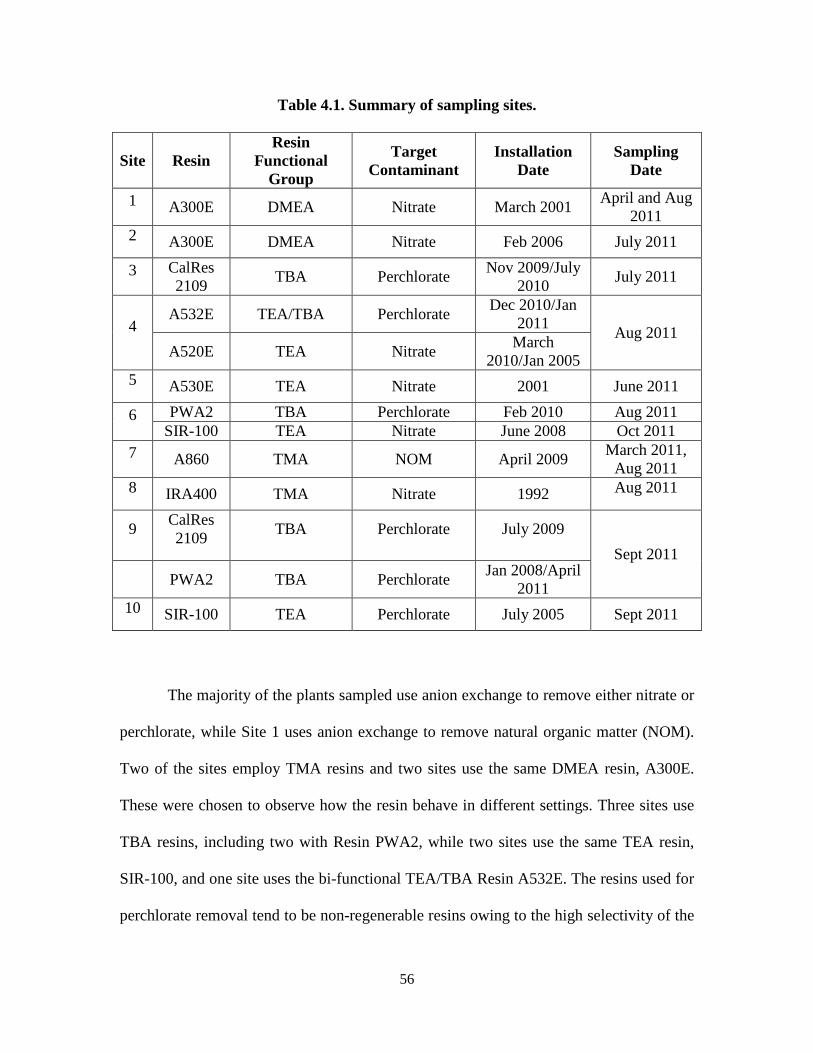
56
Table 4.1. Summary of sampling sites.
Site Resin Resin
Functional Group
Target Contaminant
Installation Date
Sampling Date
1 A300E DMEA Nitrate March 2001 April and Aug
2011 2 A300E DMEA Nitrate Feb 2006 July 2011
3 CalRes 2109
TBA Perchlorate Nov 2009/July
2010 July 2011
4 A532E TEA/TBA Perchlorate
Dec 2010/Jan 2011
Aug 2011 A520E TEA Nitrate
March 2010/Jan 2005
5 A530E TEA Nitrate 2001 June 2011
6 PWA2 TBA Perchlorate Feb 2010 Aug 2011 SIR-100 TEA Nitrate June 2008 Oct 2011
7 A860 TMA NOM April 2009 March 2011,
Aug 2011 8 IRA400 TMA Nitrate 1992 Aug 2011
9 CalRes 2109
TBA Perchlorate July 2009
Sept 2011 PWA2 TBA Perchlorate
Jan 2008/April 2011
10 SIR-100 TEA Perchlorate July 2005 Sept 2011
The majority of the plants sampled use anion exchange to remove either nitrate or
perchlorate, while Site 1 uses anion exchange to remove natural organic matter (NOM).
Two of the sites employ TMA resins and two sites use the same DMEA resin, A300E.
These were chosen to observe how the resin behave in different settings. Three sites use
TBA resins, including two with Resin PWA2, while two sites use the same TEA resin,
SIR-100, and one site uses the bi-functional TEA/TBA Resin A532E. The resins used for
perchlorate removal tend to be non-regenerable resins owing to the high selectivity of the
57
resins for perchlorate, which makes on-site regeneration difficult. All of these resins were
found to release noteworthy levels of nitrosamine precursors in previous laboratory
studies (see Chapters 2 and 3).
As the treatment trains at each plant had differing configurations and operated
differently, each plant is described individually along with the results.
Materials
NDMA, NDEA, NDBA, and d6-NDMA standards were obtained from
Accustandard (New Haven, CT). d10-NDEA and d18-NDBA were obtained from CDN
Isotopes (Pointe Claire, Quebec, Canada). EPA Method 521 method-specific activated
carbon solid-phase extraction (SPE) cartridges were purchased from Restek (Bellefonte,
PA). Laboratory-grade water (LGW) was prepared using a system consisting of filters,
granular activated carbon adsorbers, mixed-bed ion exchange resins and UV irradiation
treatment. The LGW was analyzed periodically and no nitrosamines or nitrosamine
precursors were detected. All other chemicals were purchased from Fisher Scientific
(Pittsburgh, PA) and were reagent-grade or higher.
Sample Collection
Grab samples of anion exchange process influent and effluent were collected in
2.5-L amber glass bottles that had rinsed with acetone and baked at 400°C to remove any
nitrosamine precursors. Sample bottles were placed in styrofoam inserts, packed in
coolers with blue ice, and shipped to the water plants after prior arrangements had been
made as to where and when the samples should be collected. The samples were returned
by overnight carrier to the University of North Carolina, where they were stored at 4°C
58
until analysis. Samples were analyzed for NDMA, NDEA and NDBA and their
corresponding precursors within one week of receipt.
Continuous-flow Column Experiments
A sample of exhausted Resin A532E, a bi-functional TEA/TBA resin, was
obtained from one drinking water treatment plant when the exhausted resin was being
replaced with fresh resin. A sample of the fresh Resin A532E being installed was also
obtained, and the two resins were subjected to identical continuous-flow column
experiments similar to those described previously (see Chapter 3). Two hundred mLs of
the resin were packed into glass chromatographic columns with an inner diameter of 2.5
cm. LGW containing 10 mM phosphate buffer at pH 7 was passed through the columns at
a flow rate of 66.7 mL/min, resulting in an empty bed contact time (EBCT) of 3 min.
This EBCT is typical of contact times used for ion exchange in water treatment practice.
After 100 bed volumes (BV) of flow, the resins were regenerated with 600 mL (3 BV) of
a 10% NaCl solution. Samples (2.0 L, 10 BV) were collected at the beginning of the
column experiments, after 40 BV of flow, and immediately before and after regeneration,
and analyzed for nitrosamines and nitrosamine precursors.
Nitrosamine Analysis
Samples for nitrosamine analysis (1.0 L) were spiked with 50 ng/L d6-NDMA,
d10-NDEA and d18-NDBA for quantitation by isotope dilution, and extracted using
activated carbon SPE cartridges. The cartridges were eluted with 30 mL of methylene
chloride. LGW (1-2 mL) was added to the extracts and the methylene chloride was
removed using a rotary evaporator. The extracts were analyzed by ultra-performance
liquid chromatography (UPLC) tandem mass spectrometry in the positive electrospray
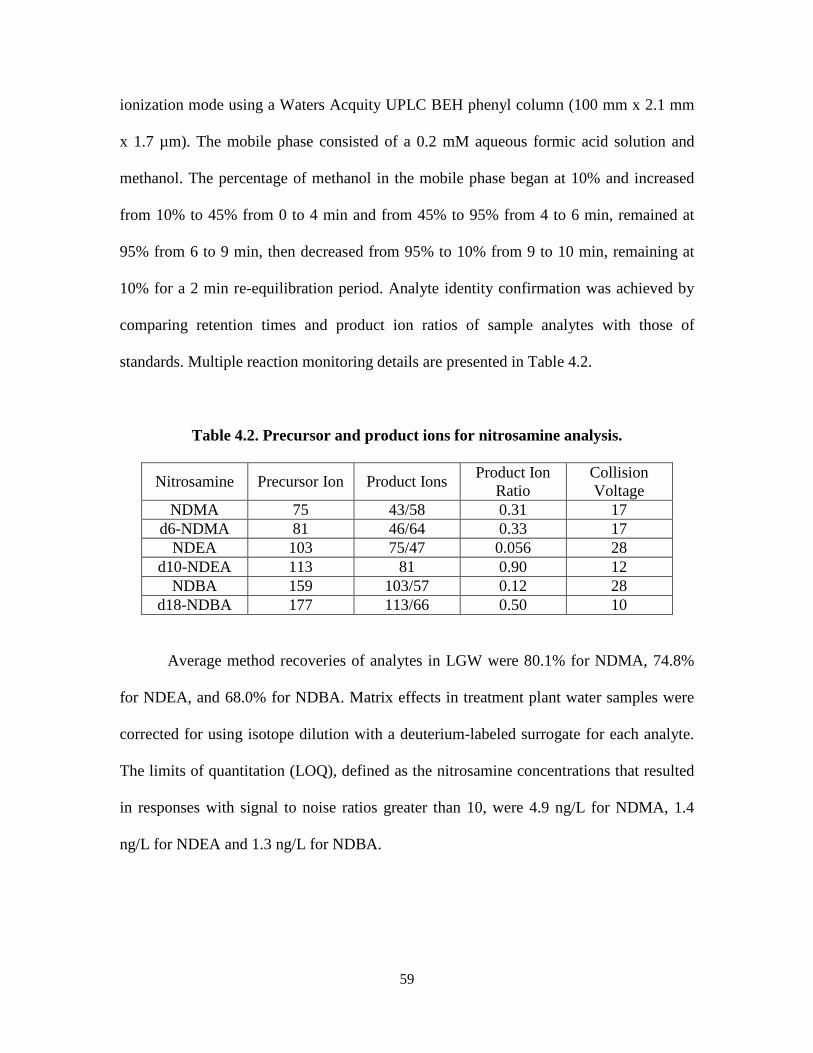
59
ionization mode using a Waters Acquity UPLC BEH phenyl column (100 mm x 2.1 mm
x 1.7 µm). The mobile phase consisted of a 0.2 mM aqueous formic acid solution and
methanol. The percentage of methanol in the mobile phase began at 10% and increased
from 10% to 45% from 0 to 4 min and from 45% to 95% from 4 to 6 min, remained at
95% from 6 to 9 min, then decreased from 95% to 10% from 9 to 10 min, remaining at
10% for a 2 min re-equilibration period. Analyte identity confirmation was achieved by
comparing retention times and product ion ratios of sample analytes with those of
standards. Multiple reaction monitoring details are presented in Table 4.2.
Table 4.2. Precursor and product ions for nitrosamine analysis.
Nitrosamine Precursor Ion Product Ions Product Ion
Ratio Collision Voltage
NDMA 75 43/58 0.31 17 d6-NDMA 81 46/64 0.33 17
NDEA 103 75/47 0.056 28 d10-NDEA 113 81 0.90 12
NDBA 159 103/57 0.12 28 d18-NDBA 177 113/66 0.50 10
Average method recoveries of analytes in LGW were 80.1% for NDMA, 74.8%
for NDEA, and 68.0% for NDBA. Matrix effects in treatment plant water samples were
corrected for using isotope dilution with a deuterium-labeled surrogate for each analyte.
The limits of quantitation (LOQ), defined as the nitrosamine concentrations that resulted
in responses with signal to noise ratios greater than 10, were 4.9 ng/L for NDMA, 1.4
ng/L for NDEA and 1.3 ng/L for NDBA.
60
Nitrosamine Formation Potential Analysis
Samples (1.0 L or 500 mL) were buffered at pH 6.8 with 20 mM phosphate and
dosed with excess preformed monochloramine (140 mg/L NH2Cl as Cl2) in accordance
with the method described by Mitch et al. (2003). After a 10-day reaction time, samples
were quenched with ascorbic acid and analyzed for nitrosamines. The nitrosamine
formation potential (NFP) was calculated by subtracting the corresponding ambient
nitrosamine values from those formed by chloramination This NFP analysis is intended to
quantify nitrosamine precursors released from the resins.
Results
Site 1
Site 1 employs Resin A300E, a DMEA resin, for the removal of nitrate. Resin
vessels have a bed volume of 314 cubic feet and are operated at a flow rate of 420 gallons
per minute, giving an EBCT of 5.6 minutes. Resins are regenerated with NaCl after
700,000 gallons of water have been treated, approximately every 28 hours. The resin was
installed in March 2001 and samples were collected in April 2011 and August 2011.
Samples of the influent and effluent of one anion exchange vessel were taken: 1)
immediately before the vessel was taken offline for regeneration, 2) immediately after the
vessel was placed back online after regeneration and rinsing, 3)1 hour (10.7 BV) after the
vessel was placed back online, and 4) 14 hours (150 BV) after the vessel was placed back
online, or halfway through the operating cycle, between regenerations. None of the
influent samples were found to contain quantifiable levels of nitrosamines or nitrosamine
precursors. The results for each effluent sample are shown in Figure 4.1. Elevated levels
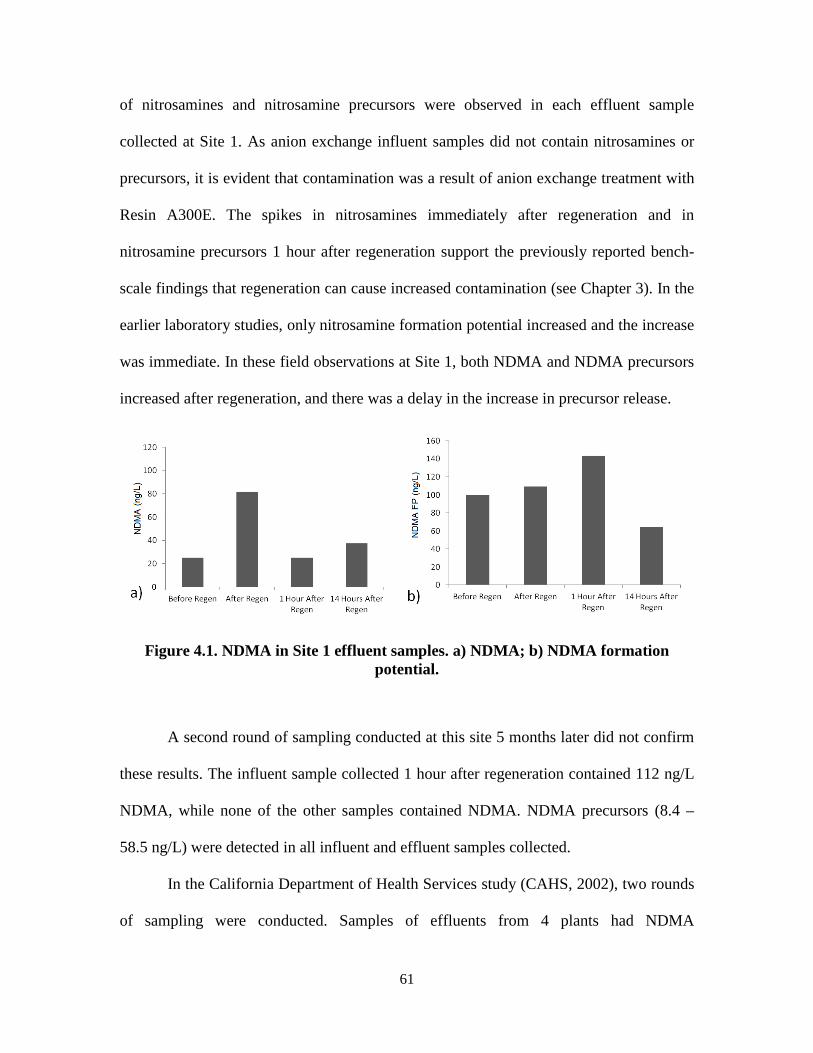
61
of nitrosamines and nitrosamine precursors were observed in each effluent sample
collected at Site 1. As anion exchange influent samples did not contain nitrosamines or
precursors, it is evident that contamination was a result of anion exchange treatment with
Resin A300E. The spikes in nitrosamines immediately after regeneration and in
nitrosamine precursors 1 hour after regeneration support the previously reported bench-
scale findings that regeneration can cause increased contamination (see Chapter 3). In the
earlier laboratory studies, only nitrosamine formation potential increased and the increase
was immediate. In these field observations at Site 1, both NDMA and NDMA precursors
increased after regeneration, and there was a delay in the increase in precursor release.
Figure 4.1. NDMA in Site 1 effluent samples. a) NDMA; b) NDMA formation potential.
A second round of sampling conducted at this site 5 months later did not confirm
these results. The influent sample collected 1 hour after regeneration contained 112 ng/L
NDMA, while none of the other samples contained NDMA. NDMA precursors (8.4 –
58.5 ng/L) were detected in all influent and effluent samples collected.
In the California Department of Health Services study (CAHS, 2002), two rounds
of sampling were conducted. Samples of effluents from 4 plants had NDMA
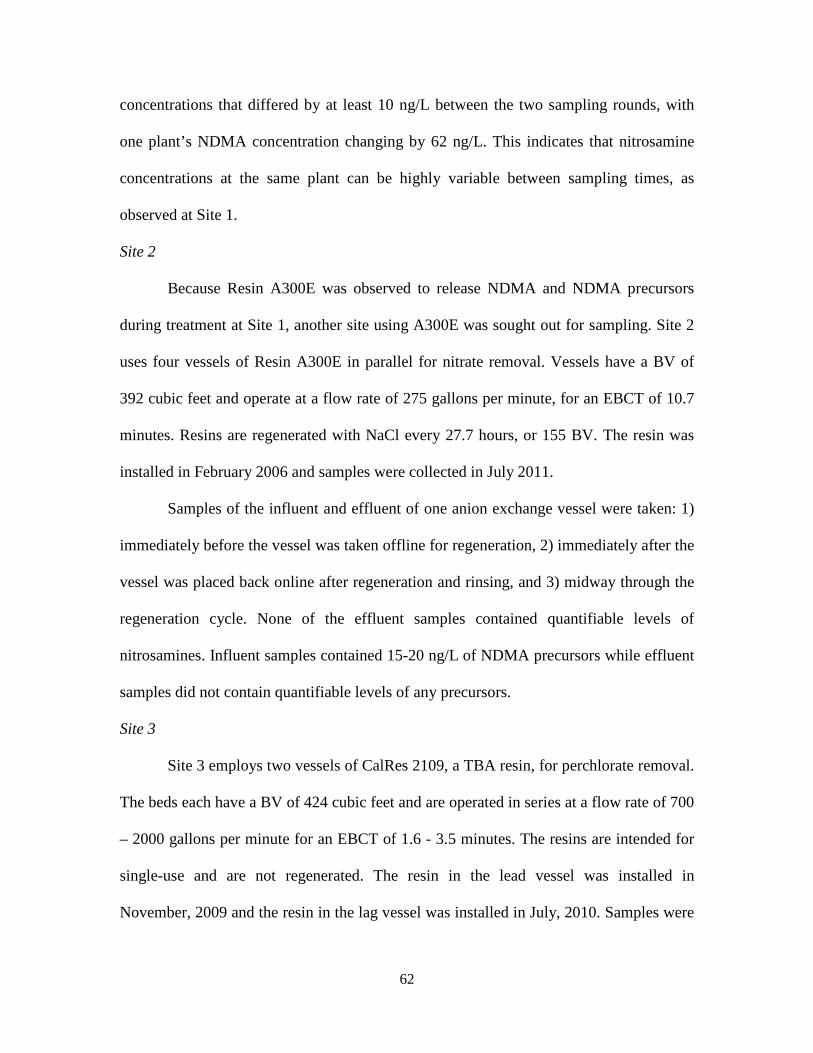
62
concentrations that differed by at least 10 ng/L between the two sampling rounds, with
one plant’s NDMA concentration changing by 62 ng/L. This indicates that nitrosamine
concentrations at the same plant can be highly variable between sampling times, as
observed at Site 1.
Site 2
Because Resin A300E was observed to release NDMA and NDMA precursors
during treatment at Site 1, another site using A300E was sought out for sampling. Site 2
uses four vessels of Resin A300E in parallel for nitrate removal. Vessels have a BV of
392 cubic feet and operate at a flow rate of 275 gallons per minute, for an EBCT of 10.7
minutes. Resins are regenerated with NaCl every 27.7 hours, or 155 BV. The resin was
installed in February 2006 and samples were collected in July 2011.
Samples of the influent and effluent of one anion exchange vessel were taken: 1)
immediately before the vessel was taken offline for regeneration, 2) immediately after the
vessel was placed back online after regeneration and rinsing, and 3) midway through the
regeneration cycle. None of the effluent samples contained quantifiable levels of
nitrosamines. Influent samples contained 15-20 ng/L of NDMA precursors while effluent
samples did not contain quantifiable levels of any precursors.
Site 3
Site 3 employs two vessels of CalRes 2109, a TBA resin, for perchlorate removal.
The beds each have a BV of 424 cubic feet and are operated in series at a flow rate of 700
– 2000 gallons per minute for an EBCT of 1.6 - 3.5 minutes. The resins are intended for
single-use and are not regenerated. The resin in the lead vessel was installed in
November, 2009 and the resin in the lag vessel was installed in July, 2010. Samples were
63
collected in July 2011. The resins at this plant are regularly taken offline for periods of
several months at a time due to groundwater availability issues – recently, they were
offline from March to July of 2010, from December 2010 to February 2011, and again
from April to July of 2011.
Samples of the water that had been standing in each vessel during this most recent
period of downtime were collected. Additionally, influent and effluent samples were
collected from each vessel 1 hour after flow had resumed. The water that had been
standing in the lead vessel contained 7.9 ng/L NDMA, 75.2 ng/L NDBA and 15.4 ng/L of
NDMA precursors. The water that had been standing in the lag vessel contained 61.2
ng/L NDBA and 7.9 ng/L of NDMA precursors. One hour after flow resumed, anion
exchange influent contained 6.4 ng/L NDBA while the lead vessel effluent contained
43.5 ng/L NDBA and the lag vessel effluent contained 46.7 ng/L NDBA. It is likely that,
with continued operation, residual NDBA would have been washed away. These elevated
nitrosamine levels support the previously reported bench-scale findings that prolonged
contact of resins with water can cause increased contamination (see Chapter 3). The
bench-scale experiments had shown that nitrosamine precursor levels rose with prolonged
contact between resins and water, while these field observations also indicate a rise in the
actual nitrosamine itself. This was also noted in the observations from Site 1.
Site 4
Site 4 employs two treatment trains consisting of Resin A520E, a TEA resin, for
the removal of nitrate in series with Resin A532E, a bi-functional TEA/TBA resin, for the
removal of perchlorate. The A532E beds precede the A520E beds. Each train has
multiple beds of A520E and A532E operating in parallel. The A520E vessels have BVs
64
of 25 cubic feet and are operated at an average flow rate of 57.6 gallons per minute for an
EBCT of 3.2 minutes, and are regenerated with a 26% sodium chloride brine solution
every 600 BV of flow. The A532E vessels have BVs of 1000 cubic feet and are operated
at an average flow rate of 750 gallons per minute for an EBCT of 10 minutes. Fresh
Resin A520E was installed in Train A in March 2010 and in Train B in January 2005.
Fresh Resin A532E was installed in Train A in December 2010 and in Train B in January
2011. Samples were collected in August 2011.
Influent samples taken from Train A and Train B contained no detectable
nitrosamines or precursors. Samples taken of Resin A532E effluent from one of the
vessels in Train A and one of the vessels in Train B contained no detectable nitrosamines
or precursors. Two samples of Resin A520E effluent were taken from Train A, one from
a bed that was soon to be regenerated (at the end of a cycle) and one that recently had
been regenerated (at the beginning of a cycle). Three samples of Resin A520E effluent
were taken from Train B; one from a vessel soon to be regenerated, one from a vessel that
had been recently regenerated, and one from a vessel midway through the regeneration
cycle. The Train A sample taken at the end of the cycle contained 31.9 ng/L NDMA, 114
ng/L of NDMA precursors and 20.4 ng/L of NDEA precursors. The analogous Train B
sample contained 31.6 ng/L NDMA and 8.3 ng/L of NDMA precursors. The Train B
sample taken from a vessel midway through the cycle contained 15 ng/L of NDMA
precursors and 3.4 ng/L NDEA precursors.
Site 5
Site 5 uses A530E, a TEA resin, to remove nitrate. Vessels with a 233 cubic foot
BV are operated at a flow rate of 500–800 gallons per minute for an EBCT of 2.2-3.5
65
minutes. The resins are regenerated with NaCl after 1.5 million gallons (861 BV) of
water have been treated. The resin was installed in 2001 and samples were collected in
June 2011.
Influent and effluent samples of one anion exchange vessel were taken: 1)
immediately before the vessel was taken offline for regeneration, 2) immediately after the
vessel was placed back online after regeneration and rinsing, 3)1 hour (approximately 20
BV) after the vessel was placed back online, and 4) halfway through the operating cycle.
Influent and effluent samples contained 5-9 ng/L of NDMA precursors throughout the
course of sampling. Only one sample contained quantifiable levels of nitrosamines; the
effluent sample collected 1 hour after regeneration contained 15.8 ng/L NDMA. No
NDEA or NDEA precursors were detected.
Site 6
Site 6 uses Resin PWA2, a TBA resin, for perchlorate removal and Resin SIR-
100, a TEA resin, for nitrate removal. Each of the resin vessels has a BV of 24.7 cubic
feet, and the PWA2 vessels are operated at a flow rate of 45 gallons per minute for an
EBCT of 4.1 minutes, while the SIR-100 vessels are operated at a flow rate of 50 gallons
per minute for an EBCT of 3.7 minutes. The treatment train consists of 20 PWA2 vessels
in parallel followed in series by 18 SIR-100 vessels in parallel.
Effluent samples were collected from PWA2 Vessel A (Age: 42,229 BV) and
PWA2 Vessel B (Age: 104,354 BV), along with the corresponding influent to the PWA2
vessels. Likewise, influent to the SIR-100 vessels was sampled, and corresponding
samples were collected from SIR-100 Vessel A (444 BV after regeneration, soon to be
regenerated again), SIR-100 Vessel B (22.9 BV, or 1 hour after regeneration) and SIR-
66
100 Vessel C (225.9 BV after regeneration, or midway through a cycle). The sample of
PWA2 influent contained 1.3 ng/L of NDBA precursors, while the effluent from Vessels
A and B contained 1.7 ng/L and 7.6 ng/L of NDBA precursors, respectively. SIR-100
influent contained no quantifiable nitrosamines or precursors, while the effluent from
SIR-100 Vessel B, the sample taken 1 hour after regeneration, contained 7.2 ng/L of
NDBA precursors.
Site 7
Site 7 uses Resin A860, a TMA resin, for removal of natural organic matter. The
resin has a 400 cubic foot BV and is operated at a flow rate of 950 gallons per minute, for
an EBCT of 3.5 min. The resin is regenerated with NaCl every 11.9 hours, or 204 BV.
The resin was installed in April 2009 and samples were collected in March 2011 and
August 2011.
Samples of the influent and effluent of one anion exchange vessel were taken: 1)
immediately before the vessel was taken offline for regeneration, 2) immediately after the
vessel was placed back online after regeneration and rinsing, 3)1 hour (17 BV) after the
vessel was placed back online, and 4) 4 hours (68 BV) after the vessel was placed back
online. No quantifiable levels of nitrosamines were detected in any of the samples.
Influent and effluent samples collected in March 2011 contained 58-104 ng/L of NDMA
precursors at each sampling time, with influent and effluent samples having comparable
levels. A sample of anion exchange influent collected 5 months later was not found to
contain any NDMA precursors.
Site 8
67
Site 8 uses eight parallel vessels of IRA910, a TMA resin, for nitrate removal.
Each vessel has a 450 cubic foot BV and is operated at a flow rate of 100 gallons per
minute, for an EBCT of 3.4 minutes. Resins are regenerated every 24 hours (424 BV).
The resins were installed in 1992 and samples were taken in September 2011. The ion
exchange system operates seasonally, as needed.
At the time of sampling, the ion exchange system had been offline for several
months. Prior to sampling, the resins were brought back into service and went through
three full regeneration cycles. Influent and effluent samples were taken from Bed A: 1)
immediately before the third regeneration, 2) immediately after regeneration and rinsing,
3) 1 hour after the bed was brought back online after regeneration, and 4) 12 hours (212
BV) after regeneration, or midway through a typical operating cycle. Effluent samples
were also taken from Beds B and C immediately before and after the third regeneration.
None of the samples collected at this site contained quantifiable levels of nitrosamines or
nitrosamine precursors despite the findings from earlier laboratory studies (see Chapters
2 and 3) that this resin had the highest release of NDMA precursors, especially after flow
interruption.
Site 9
Site 9 uses Resins PWA2 and CalRes 2109, both TBA resins, for perchlorate
removal. The PWA2 configuration consists of two treatment trains in parallel, each
consisting of two vessels in series. The vessels each have a BV of 300 cubic feet and are
operated at a flow rate of 1500 gallons per minute for an EBCT of 1.5 min. The resin in
Train A was installed in April 2011 and the resin in Train B was installed in January
2008. The CalRes 2109 treatment configuration consists of two vessels in parallel
68
followed in series by another two vessels in parallel. The vessels each have a BV of 425
cubic feet and are operated at a flow rate of 2000 gallons per minute for an EBCT of 1.6
min. The resins in the CalRes 2109 vessels were installed in July 2009. Samples were
collected in August 2011. None of the resins are regenerated, and the vessels are
estimated to be in use 60% of the time.
Samples of the influent and final effluent of the CalRes 2109 process train were
collected. Influent, lead vessel effluent and lag vessel effluent samples were collected
from each PWA2 train. No sample contained quantifiable levels of nitrosamines or
nitrosamine precursors.
Site 10
Site 10 uses Resin SIR-100, a TEA resin, for perchlorate removal. The resins are
intended for single-use and are not regenerated. There are 16 SIR-100 vessels operated in
parallel, with 10 vessels online at any one time. The vessels each have a BV of 24.7 cubic
feet and are operated at a flow rate of 74.8 gallons per minute for an EBCT of 2.47
minutes. Several days prior to sampling, the ion exchange beds were cleaned and
disinfected by the utility using free chlorine to control microbial growth that had
developed in the system. The utility collected samples and analyzed for nitrosamines
after disinfection at the direction of the California Department of Public Health and found
that nitrosamine levels were below regulatory limits, but did not analyze for nitrosamine
precursors. Samples were collected in September 2011.
Anion exchange influent and the effluents of three different vessels were sampled.
Vessel A had a resin age of 13,738 BV, Vessel B had a resin age of 22,339 BV and
69
Vessel C had a resin age of 51,499 BV at the time of sample collection. None of the
samples collected contained quantifiable levels of nitrosamines or nitrosamine precursors.
Column experiments with fresh and exhausted resins
The releases of nitrosamine precursors by each of the A532E resins during the
bench-scale continuous-flow column experiments are presented in Figure 4.2. One of the
columns contained spent resin that had been used in a drinking water treatment plant for
perchlorate removal for 29 months. The other column contained fresh sample of the same
resin.
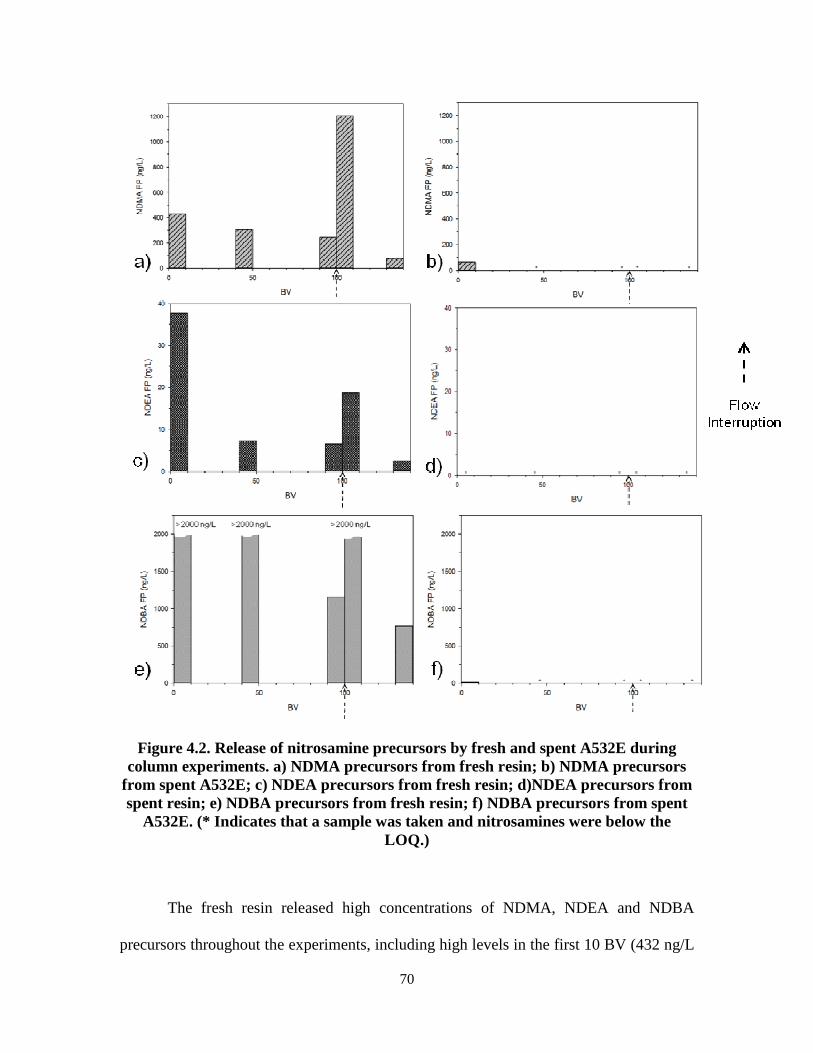
70
Figure 4.2. Release of nitrosamine precursors by fresh and spent A532E during column experiments. a) NDMA precursors from fresh resin; b) NDMA precursors
from spent A532E; c) NDEA precursors from fresh resin; d)NDEA precursors from spent resin; e) NDBA precursors from fresh resin; f) NDBA precursors from spent
A532E. (* Indicates that a sample was taken and nitrosamines were below the LOQ.)
The fresh resin released high concentrations of NDMA, NDEA and NDBA
precursors throughout the experiments, including high levels in the first 10 BV (432 ng/L
71
NDMA, 38 ng/L NDEA and >2000 ng/L NDBA precursors), and appreciable increases
after a 12-14-hour flow interruption. In contrast, the spent resin released NDMA and
NDBA precursors at levels much lower than the fresh resin and did not release detectable
NDEA precursors. Flow interruptions, which have been shown to result in increased
precursor releases even in resins with low releases during the first 10 BV of flow (see
Chapter 3), did not result in an increase in nitrosamine precursor release for the spent
resin. With respect to actual nitrosamine release, the only release by the fresh A532E was
an NDMA release of 115 ng/L in the first 10 BV of flow (not shown). This is consistent
with previous laboratory findings for this resin (see Chapter 3). The spent A532E
released low (<5 ng/L) levels of NDBA throughout the column experiment, with a jump
to 7.7 ng/L NDBA after a 12-14-hour flow interruption.
Full-scale influent and effluent samples could not be collected from the plant
where Resin A532E was being used for treatment.
Discussion
From an analytical standpoint, the dual confirmation of analytes through
chromatographic retention time and multiple reaction monitoring ensured proper
identification of the analytes measured in this field study. Nitrosamines were quantified
by isotope dilution using a specific deuterium-labeled standard for each analyte in order
to correct for matrix effects, so the concentrations given above can be considered reliable.
Replicate samples were collected and analyzed for several plants. These samples showed
consistent findings in that they all had nitrosamine and nitrosamine precursor levels
below quantitation limits, but a statistical analysis of reproducibility was not possible.
72
Nitrosamine precursors were found in the anion exchange influent samples
collected at five of the sites (Sites 1, 2, 5, 6 and 7). The majority of NDMA precursors in
natural waters have unidentified structures (Padye et al., 2009) and are thought to be
present in the high-nitrogen fractions of NOM (Dotson et al., 2009). Many of the sites
sampled use groundwater as a raw water source. While groundwaters typically have low
DON concentrations (Westerhoff and Mash, 2002), NOM in some groundwaters is
nitrogen-rich, with low DOC/DON ratios (Thurman and Malcolm, 1981). Site 3
contained 6.4 ng/L NDBA in the anion exchange influent. While NDBA has recently
been detected in raw drinking waters at concentrations as high as 19.9 ng/L (Wang et al.,
2011), it has not previously been reported in drinking water treatment plants using
groundwater as a source.
Anion exchange influent samples collected at Site 2 contained noticeable NDMA
precursor levels (14.9 – 20.3 ng/L), but anion exchange effluent samples did not contain
any NDMA precursors. NOM, a known precursor of NDMA (Dotson et al., 2009),
contains negatively charged functional groups at water treatment pH levels and can be
effectively removed by anion exchange resins (e.g. Bolto et al., 2002). It is likely that the
NDMA precursors in the anion exchange influent at Site 2 were incorporated within
NOM macromolecules and were removed through the anion exchange process.
Analysis of the findings indicates that resins may be a greater source of
nitrosamine contamination earlier in their treatment lives, and that resins which have
been in place for long periods of time are not likely to exhibit nitrosamine or nitrosamine
precursor levels of concern. The different observations at plants using Resin A520E
illustrate this point. At Site 4, the Resin A520E effluent sample taken from Train A
73
contained appreciably higher levels of NDMA and precursors of NDMA and NDEA than
did the samples taken from Train B, where the resin had been in service five years longer
than the resin in Train A.
The observations at Site 8 also seem to support this conclusion. Resin IRA400, a
TMA resin, was shown in previous bench-scale research (see Chapters 2 and 3) to be one
of the resins releasing the greatest amounts of nitrosamines and nitrosamine precursors
from among a large number of resins examined. The observation that all of the samples
collected from IRA400 effluent at Site 8 were free of nitrosamines and nitrosamine
precursors is most likely due to the fact that the resin was installed in 1992, a full 19
years before sampling, and that any residual tri- or dialklyamine compounds remaining
from resin synthesis had been fully washed away before sampling occurred.
Finally, column experiments performed with fresh and exhausted Resin A532E
clearly demonstrated that, while the fresh resin released appreciable nitrosamines and
nitrosamine precursors, the exhausted resin no longer released these contaminants. It is
likely that nitrosamines and precursors were present in the exhausted resin when it was
newly installed and were washed away during 29 months of use in treatment.
Conclusions
Out of ten drinking water treatment plants surveyed that use anion exchange for
the removal of nitrate, perchlorate, arsenic, and NOM among other anionic contaminants,
three plants contained noteworthy levels of nitrosamines in their ion exchange effluents.
It should be noted that all three of these plants contained nitrosamine concentrations
above 10 ng/L, a likely level of regulatory concern. A greater percentage (five out of ten)
had noteworthy levels of nitrosamine precursors in their ion exchange effluents. [It must
74
be noted that the nitrosamine precursor measurements reported in this study reflect the
nitrosamine formation potential and are not an indication of the actual levels that will be
formed for typical distribution system practices because of the high levels of preformed
monochloramine used in the formation potential analysis. Nevertheless, the fact that
these precursors are found in the ion exchange effluent suggests that nitrosamines can be
formed at undesirable levels when finished water is chloraminated.
The effects of resin regeneration and resin downtime on nitrosamine and
nitrosamine precursor release reported earlier in laboratory studies (see Chapter 3) were
each illustrated to some degree by the results obtained at full-scale treatment facilities.
Appreciable concentrations of nitrosamine precursors were detected in the anion
exchange influents at several sites, and anion exchange treatment actually removed
nitrosamine precursors in one instance. The results suggest that, as resins are used in
treatment, their nitrosamine and nitrosamine precursor contribution diminishes.
In this study, one-time grab samples were collected from plants employing anion
exchange treatment. The observations reported suggest that nitrosamine and nitrosamine
precursor levels will be different at each plant using this technology, and that utilities
should be attentive to the potential for high levels of nitrosamines and their precursors,
especially when new resins are installed, after regeneration, and after extended periods of
downtime. More research is needed to fully determine the extent and the persistence of
nitrosamine contamination at anion exchange plants and to develop a treatment protocol
that can effectively minimize the addition of nitrosamines and nitrosamine precursors to
water treated by anion exchange resins.
Chapter 5. Conclusions and Recommendations for Future Research
Conclusions
The release of nitrosamines by some resins and the release of nitrosamine
precursors by many resins among a large group of anion exchange resins used in water
treatment practice was demonstrated and confirmed in batch contact experiments. The
release of NDEA and NDEA precursors by TEA resins in a drinking water treatment
context and the release of NDPA by a TPA resin were reported here for the first time.
The release of three nitrosamines by one bi-functional resin (A532E) and the release of
NDMA precursors by resins manufactured with TEA and TBA functional groups were
demonstrated and highlighted. The importance of resin cleaning and the consequent
inability of batch contact studies to definitively address nitrosamine release were noted,
and continuous-flow column studies that allow for the monitoring of nitrosamine and
nitrosamine precursor levels as resins are rinsed were recommended and undertaken.
In continuous-flow column studies, anion exchange resins were found to release
elevated levels of nitrosamines and nitrosamine precursors at the start of experiments
designed to simulate operations in full-scale drinking water treatment plants. Nitrosamine
concentrations typically fell below levels of regulatory concern within 100 BV of
throughput, while nitrosamine formation potential generally stayed above 10 ng/L
throughout the column experiments. Regeneration of the resins with NaCl, as practiced in
treatment plants, led to noticeable increases in nitrosamine precursor concentrations. The
76
elevated levels decreased quickly with continued column flow. Changes in resin swelling
due to the change in resin ionic form and the ionic strength of the regenerant solution
during regeneration were proposed as the causes of the nitrosamine precursor spikes.
Flow interruptions of 12-14 hours resulted in nitrosamine precursor spikes typically
larger than those due to regeneration. These increased precursor concentrations also
decreased quickly with column flow. The increased concentrations are likely due to water
penetrating resin polymer structures more deeply during prolonged contact time and
allowing deeply embedded precursors to enter the aqueous phase and be released when
flow resumes.
Residual trialkylamines present as unreacted materials from resin synthesis are
proposed as the source of the nitrosamine precursors observed. In the cases of NDMA
precursor release by resins manufactured with TEA or TBA functional groups, the
NDMA precursors are believed to be TMA present as impurities in TEA or TBA starting
materials. A large amount of these precursors are rinsed from the resins at the beginning
of flow, and precursors that are more deeply embedded in the polymer structures are
released during changes in resin swelling and are leached out during long contact times.
Some resins were found to react with monochloramine and free chlorine in
column feed water to produce nitrosamines. The quaternary amine functional groups of
these resins do not offer any plausible opportunity for reaction with oxidants. It is
possible, however, that DMA present as impurities in TMA used for resin synthesis
became incorporated into the chemical structures of the resins. A reaction mechanism
based on the attack of DMA groups by monochloramine or free chlorine resulting in the
77
liberation of DMA was proposed. This DMA can then react with chloramines in the feed
water to form NDMA, accounting for the observed NDMA concentrations.
Out of ten full-scale drinking water treatment plants surveyed that use anion
exchange, three plants contained noteworthy levels of nitrosamines in anion exchange
effluent samples and five contained nitrosamine precursors in anion exchange effluent
samples. This was the first study to include NDEA and NDBA analysis in a field survey
isolating anion exchange treatment. The presence of NDBA and the presence of NDEA
and NDBA precursors in drinking water treatment plants as a result of anion exchange is
report here for the first time.
The laboratory findings of the effects of resin regeneration and prolonged resin
downtime were verified in the field by samples collected at full-scale operating anion
exchange treatment plants. Many anion exchange influent samples were found to contain
nitrosamines or nitrosamine precursors, possibly due to the presence of amines as
constituents of NOM. In one plant, the anion exchange process was found to remove
NDMA precursors. This may be due to the removal of negatively charged NOM
molecules containing DMA functional groups through anion exchange.
In several cases, a plant using a given resin had nitrosamines or precursors in its
anion exchange effluent while another plant using the same resin did not. In these cases,
the plants without nitrosamines or precursors had been using the resins for longer periods
of time than the plants with nitrosamines or precursors, suggesting that resins may be
washed clean of any possible contamination with extended use. This effect was also
observed in controlled bench-scale column contact studies performed with a fresh resin
and a resin that had been exhausted after years of use at a full-scale treatment plant.
78
Previous full-scale sampling investigations of nitrosamines have included anion
exchange plants among larger groups of plants for sampling. One study (CA DPH, 2002)
found that 1 out of 4 anion exchange plants had elevated nitrosamine levels. Another
(Valentine et al., 2006) found elevated nitrosamines in one anion exchange plant but not
in another. The findings of this expanded study (3 out of 10 plants with elevated
nitrosamines, 5 out of 10 with elevated precursors) corroborate the findings of the
previous studies that, while the use of anion exchange indicates that nitrosamines may be
a problem in water treatment practice, it does not follow that every treatment plant that
uses anion exchange will have elevated nitrosamine levels. The potential for the
occurrence of nitrosamines and nitrosamine precursors in full-scale anion exchange
facilities must be evaluated on a plant-by-plant basis.
This research clearly demonstrated that strong base anion exchange resins can
serve as sources of nitrosamines and nitrosamine precursors in drinking water treatment,
most likely due to the presence of residual tri- and dialklyamines remaining from resin
synthesis. Several anion exchange resins were found to release multiple nitrosamines and
their precursors. Resin regeneration and downtime were found in laboratory experiments
and field observations to be factors leading to an increase in nitrosamine contamination.
Laboratory experiments suggested that resins can be washed clean of any residual
nitrosamines and precursors, and field observations confirmed that resins that have been
in place for longer periods of time tend to release lower levels of nitrosamine precursors.
An important implication of these findings is that new resins need to be rinsed or
cleaned effectively before being placed into service. This may require multiple
regenerations or extended rinsing. Utilities should analyze for nitrosamines and
79
nitrosamine formation potential before placing resin beds into service. Additionally, resin
suppliers need to take care in providing contaminant-free resins for use in drinking water
treatment.
Recommendations for Future Research
Laboratory Investigations
Nitrosamine precursors were found to be released by most of the anion exchange
resins investigated in this study, and it was proposed that these precursors were present as
unreacted trialkylamine resin synthesis materials and dialkylamine contaminants. The
presence of these chemicals in resins has been tolerated to this point, but now that
nitrosamines have become a public health concern, it is important to confirm that
unreacted trialkylamines are in fact the source of nitrosamine precursors, and investigate
ways to minimize their presence. To confirm their presence, batch or column studies
similar to those performed in this study should be conducted, with waters analyzed for
trialkylamines and dialkylamines. Commercial resins are prepared using technical-grade
chemicals in an industrial setting; model resins could be synthesized using a more
rigorous laboratory synthesis with higher purity chemicals. Batch or column leaching
experiments performed with laboratory-prepared resins may yield different nitrosamine
results. In fact, resins of high purity are already commercially available for
pharmaceutical applications.
The presence of dialkylamines in place of trialkylamines at exchange sites was
proposed as part of a mechanism for the reaction of resins with oxidants. It may be
possible to detect the presence of dialkylamines in the resin structures using
80
spectroscopic methods such as infrared spectroscopy (IR) or nuclear magnetic resonance
spectroscopy (NMR). If there are dialkylamines present, then the exchange sites with
dialkylamines will function as weak base exchangers rather than as strong base
exchangers and will lose their charge and therefore their exchange capacity at high pH. A
measurement of the exchange capacities of resins at different pH values may give an
indication of the degree to which dialkylamines are present in place of trialkylamines.
The formation of nitrosamines during the reaction of free chlorine with anion
exchange resins remains unexplained. Further fundamental investigation of the different
mechanisms of nitrosamine formation is required, especially as it relates to anion
exchange.
The increase in nitrosamine precursor release after NaCl regeneration of resins in
the laboratory studies was attributed to changes in resin swelling as resins released
phosphate buffer ions in favor of chloride or to the increased ionic strength associated
with regeneration. This could be further elucidated by contacting resins in columns with a
feed water containing high concentrations of various anions. The resins would take up
these various anions and undergo a more dramatic change in ionic form when
regenerated. As the extent of resin swelling is expected to be different for each different
ionic form, perhaps a more mild regeneration procedure could be developed using an
anion that causes a less dramatic change in swelling than chloride, or introducing chloride
in a concentration gradient, resulting in less stress on the resin.
Field Investigations
In this study, the most recently installed resin investigated in the field had been in
operation for five months, while the controlled laboratory studies indicated that the
81
greatest nitrosamine release occurs at the beginning of column flow. It would therefore be
desirable to examine resins at full-scale treatment facilities as they are installed and to
collect samples at the beginning of the treatment life of a resin, including before and after
the resin is regenerated for the first several times.
Various methods have been found to destroy nitrosamines, most notably UV
irradiation. During this study, no plants were identified that use UV irradiation or other
methods for nitrosamine destruction during drinking water treatment. It would be
desirable to identify plants using these technologies and to evaluate their effectiveness in
destroying nitrosamines and nitrosamine precursors. It would be particularly interesting
to locate a plant that was installing fresh resin and using a nitrosamine removal
technology, and to investigate the performance of the removal technology during the
treatment life of the resin. Studies such as these, by definition, need to be site-specific.
Nitrosamine precursors were found in several anion exchange effluents at full-
scale drinking water treatment plants. As nitrosamines are known to form during
reactions between chloramines and precursors, and as chloramines are known to be
persistent in the distribution system, it is important to determine the degree to which the
precursors released by anion exchange resins react to form nitrosamines before reaching
the consumer’s tap. Samples should be taken from several locations in the distribution
systems of utilities found to have nitrosamine precursors in their plant effluent and
analyzed for nitrosamines to determine the actual public health risks posed by
nitrosamine precursors.
82
Appendix A. Analytical Details
Materials
NDMA, NDEA, NDPA, NDBA, d6-NDMA and d14-NDPA standards were
obtained from Accustandard (New Haven, CT) and d10-NDEA and d18-NDBA were
obtained from CDN Isotopes (Pointe Claire, Quebec, Canada). EPA Method 521 method-
specific activated carbon solid phase extraction (SPE) cartridges were purchased from
Restek (Bellefonte, PA). Laboratory-grade water (LGW) was prepared using a system
consisting of filters, granular activated carbon adsorbers, mixed-bed ion exchange resins
and ultraviolet (UV) treatment. The LGW was analyzed periodically and found to contain
levels of nitrosamines and nitrosamine precursors below detection limits. All other
chemicals were purchased from Fisher Scientific (Pittsburgh, PA) and were reagent-grade
or higher. All glassware was rendered chlorine demand-free, rinsed with acetone and
baked at 400 °C for four hours. Detergent, which often contains TEA, was not used at
any time during glassware preparation.
Nitrosamine Analysis
Samples for nitrosamine analysis (1.0 L) were spiked with 50 ng/L d6-NDMA,
d10-NDEA, d14-NDPA and d18-NDBA for quantitation by isotope dilution and
extracted using activated carbon SPE cartridges. The cartridges were preconditioned with
6 mL of methylene chloride, 6 mL of methanol, and 20 mL of LGW and eluted with 30
mL of methylene chloride. LGW (1-2 mL) was added to the extracts and the methylene
chloride was removed using a rotary evaporator. The extracts were analyzed by ultra-
performance liquid chromatography tandem mass spectrometry in the positive
electrospray ionization mode using a Waters Acquity UPLC BEH phenyl column (100
mm x 2.1 mm x 1.7 µm). The mobile phase was composed of a 0.2 mM aqueous formic
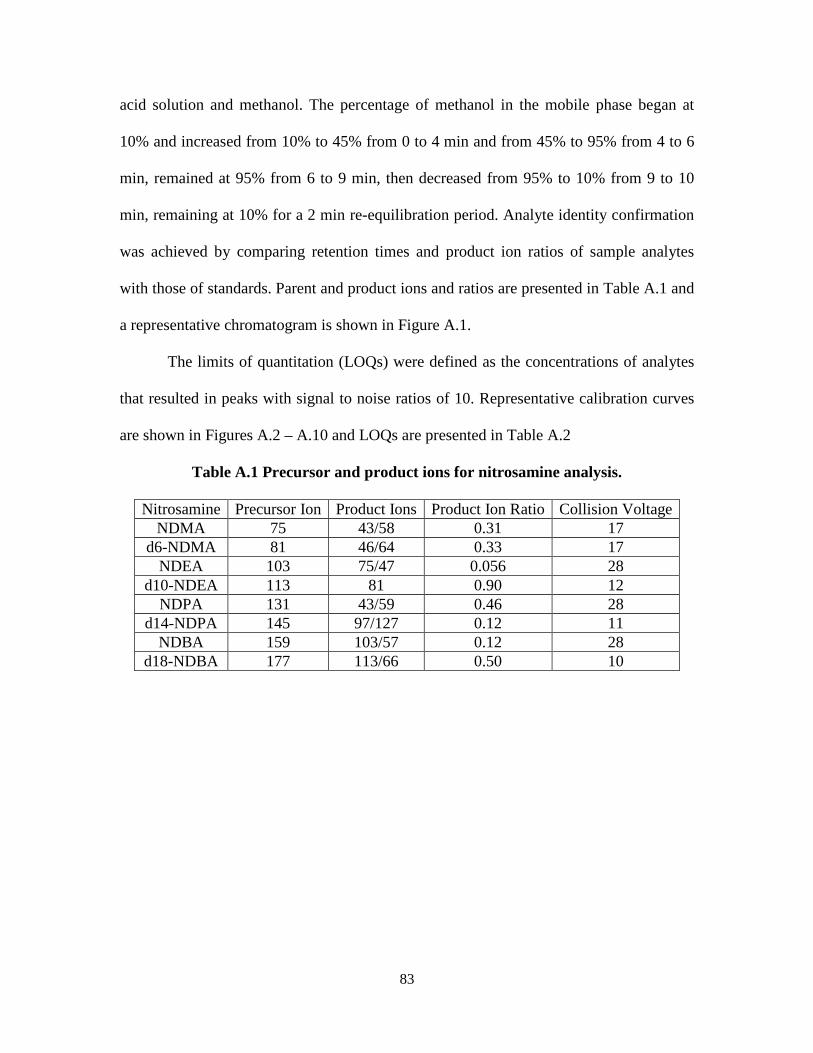
83
acid solution and methanol. The percentage of methanol in the mobile phase began at
10% and increased from 10% to 45% from 0 to 4 min and from 45% to 95% from 4 to 6
min, remained at 95% from 6 to 9 min, then decreased from 95% to 10% from 9 to 10
min, remaining at 10% for a 2 min re-equilibration period. Analyte identity confirmation
was achieved by comparing retention times and product ion ratios of sample analytes
with those of standards. Parent and product ions and ratios are presented in Table A.1 and
a representative chromatogram is shown in Figure A.1.
The limits of quantitation (LOQs) were defined as the concentrations of analytes
that resulted in peaks with signal to noise ratios of 10. Representative calibration curves
are shown in Figures A.2 – A.10 and LOQs are presented in Table A.2
Table A.1 Precursor and product ions for nitrosamine analysis.
Nitrosamine Precursor Ion Product Ions Product Ion Ratio Collision Voltage NDMA 75 43/58 0.31 17
d6-NDMA 81 46/64 0.33 17 NDEA 103 75/47 0.056 28
d10-NDEA 113 81 0.90 12 NDPA 131 43/59 0.46 28
d14-NDPA 145 97/127 0.12 11 NDBA 159 103/57 0.12 28
d18-NDBA 177 113/66 0.50 10
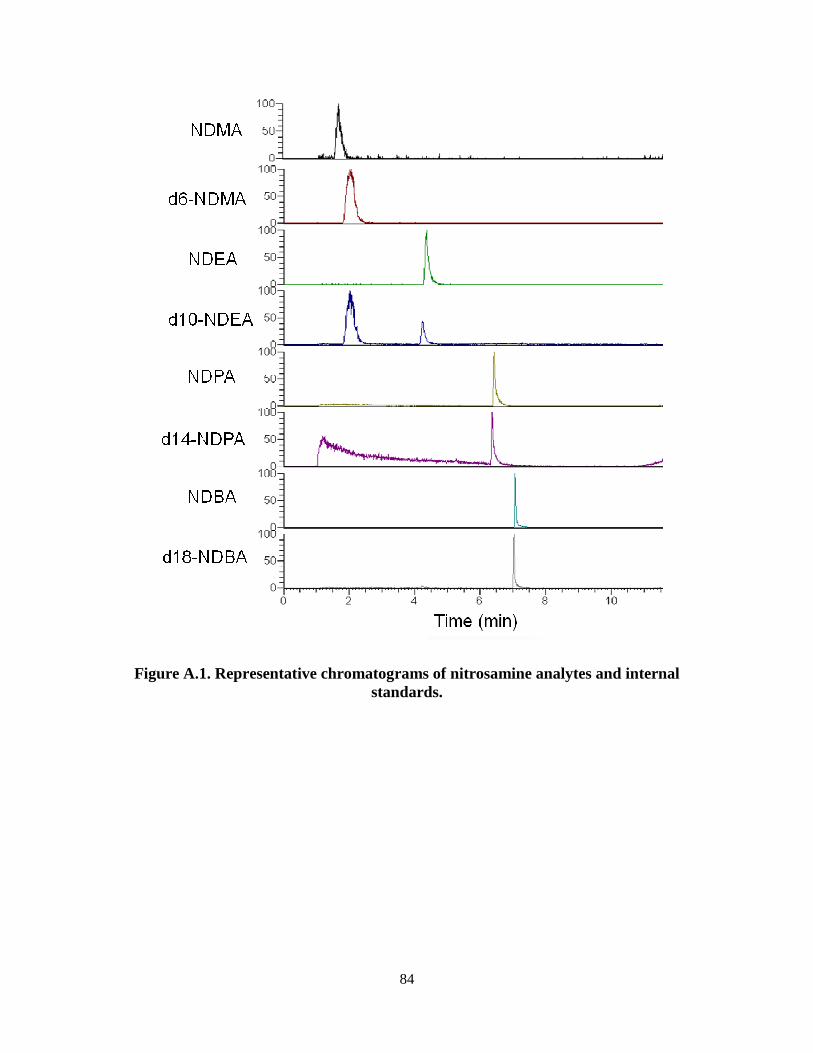
84
Figure A.1. Representative chromatograms of nitrosamine analytes and internal standards.
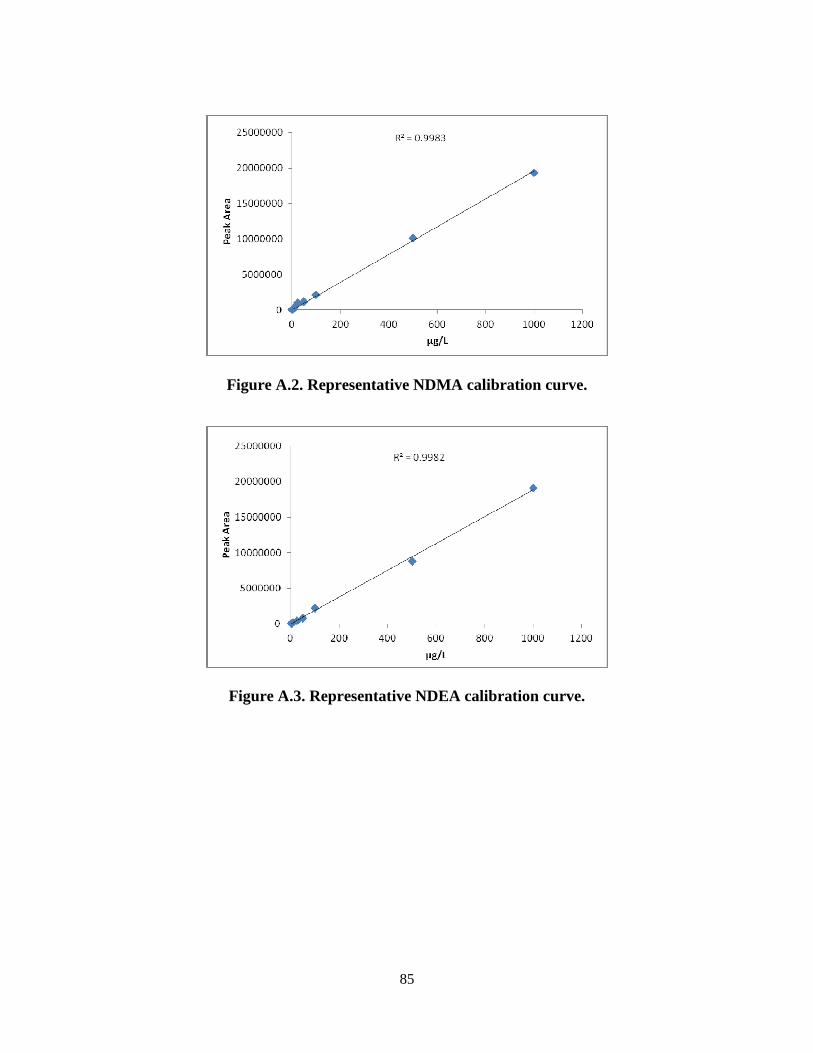
85
Figure A.2. Representative NDMA calibration curve.
Figure A.3. Representative NDEA calibration curve.
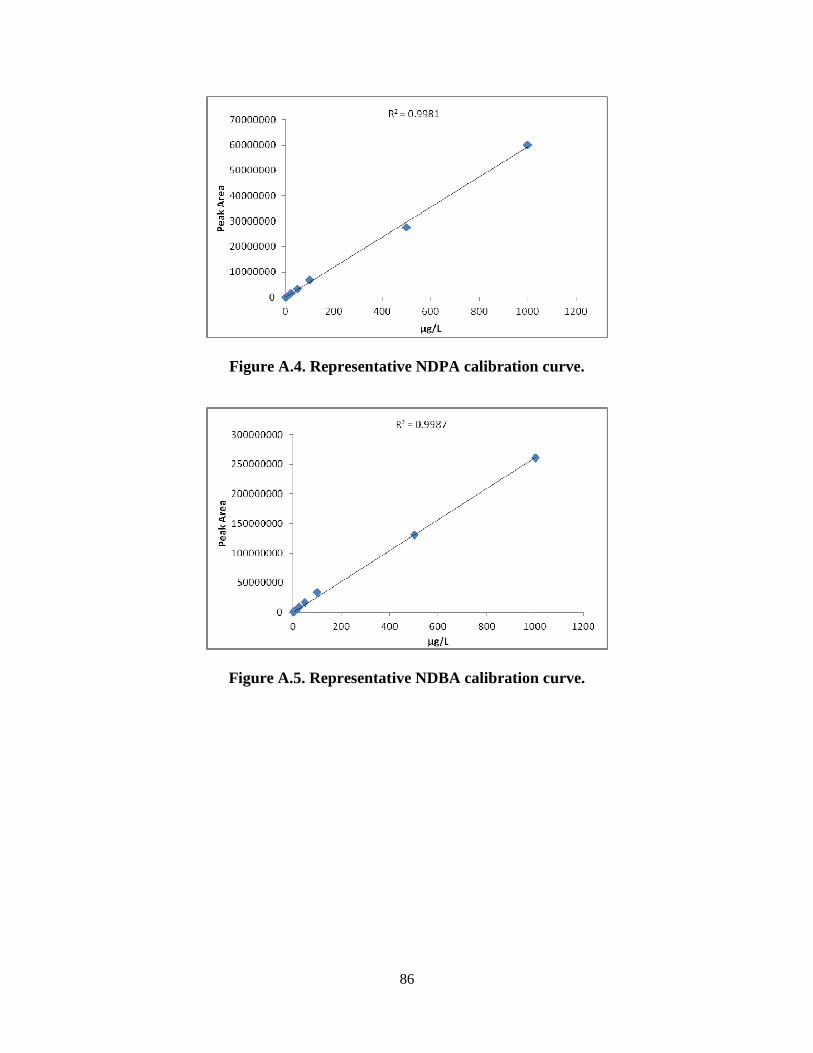
86
Figure A.4. Representative NDPA calibration curve.
Figure A.5. Representative NDBA calibration curve.
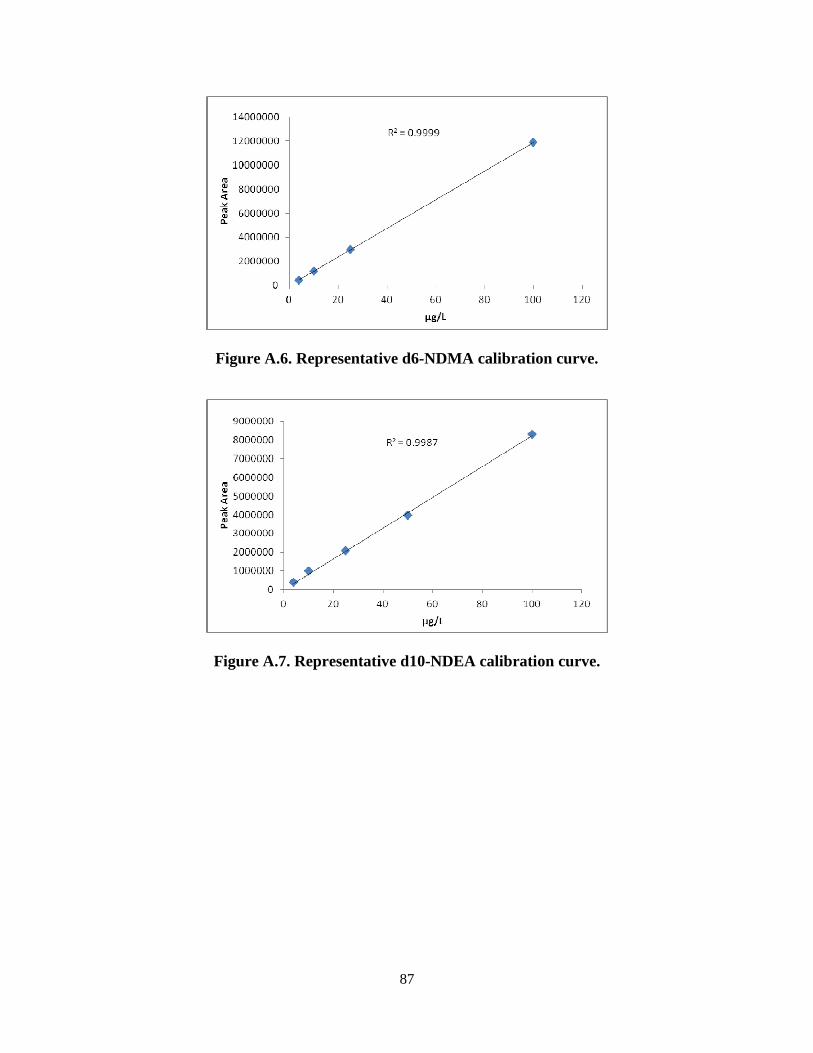
87
Figure A.6. Representative d6-NDMA calibration curve.
Figure A.7. Representative d10-NDEA calibration curve.
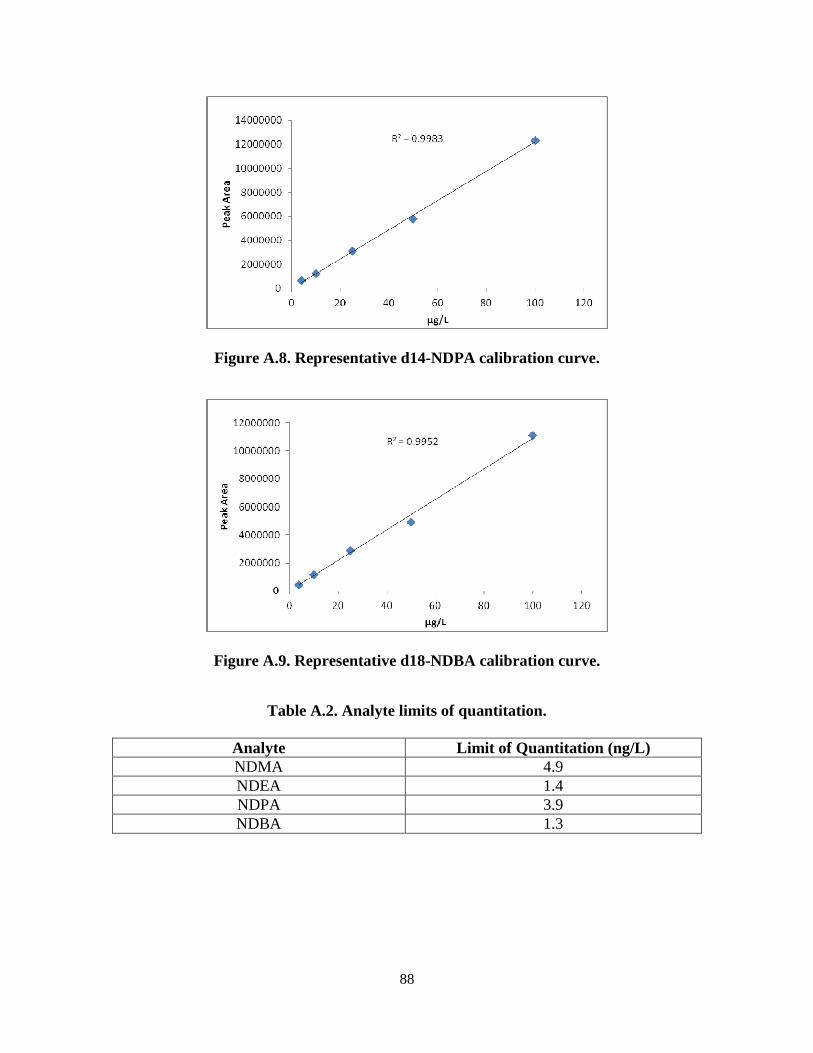
88
Figure A.8. Representative d14-NDPA calibration curve.
Figure A.9. Representative d18-NDBA calibration curve.
Table A.2. Analyte limits of quantitation.
Analyte Limit of Quantitation (ng/L) NDMA 4.9 NDEA 1.4 NDPA 3.9 NDBA 1.3
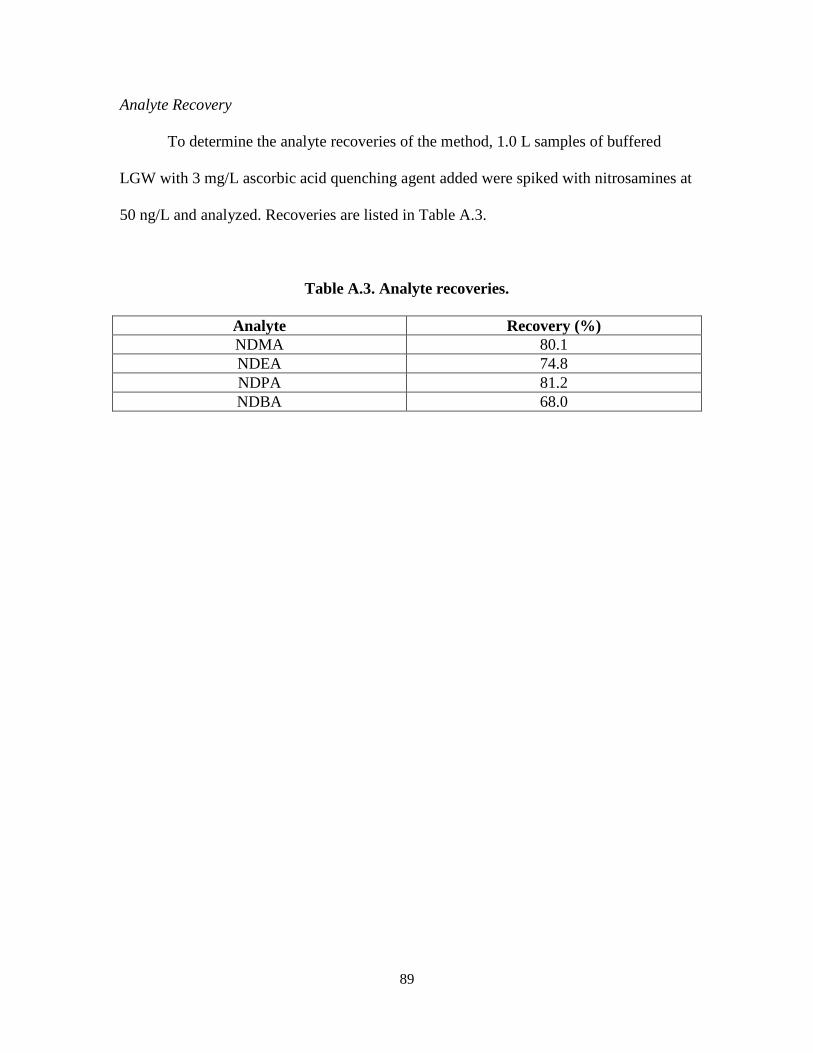
89
Analyte Recovery
To determine the analyte recoveries of the method, 1.0 L samples of buffered
LGW with 3 mg/L ascorbic acid quenching agent added were spiked with nitrosamines at
50 ng/L and analyzed. Recoveries are listed in Table A.3.
Table A.3. Analyte recoveries.
Analyte Recovery (%) NDMA 80.1 NDEA 74.8 NDPA 81.2 NDBA 68.0
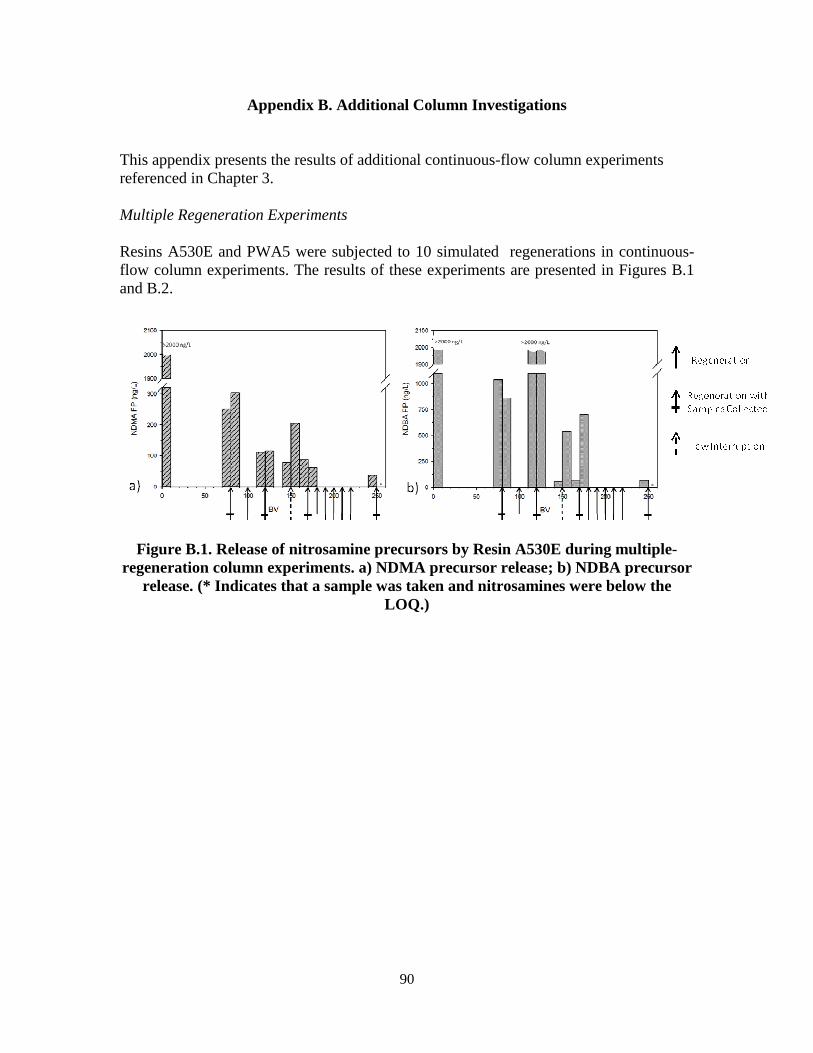
90
Appendix B. Additional Column Investigations
This appendix presents the results of additional continuous-flow column experiments referenced in Chapter 3. Multiple Regeneration Experiments Resins A530E and PWA5 were subjected to 10 simulated regenerations in continuous-flow column experiments. The results of these experiments are presented in Figures B.1 and B.2.
Figure B.1. Release of nitrosamine precursors by Resin A530E during multiple-regeneration column experiments. a) NDMA precursor release; b) NDBA precursor
release. (* Indicates that a sample was taken and nitrosamines were below the LOQ.)
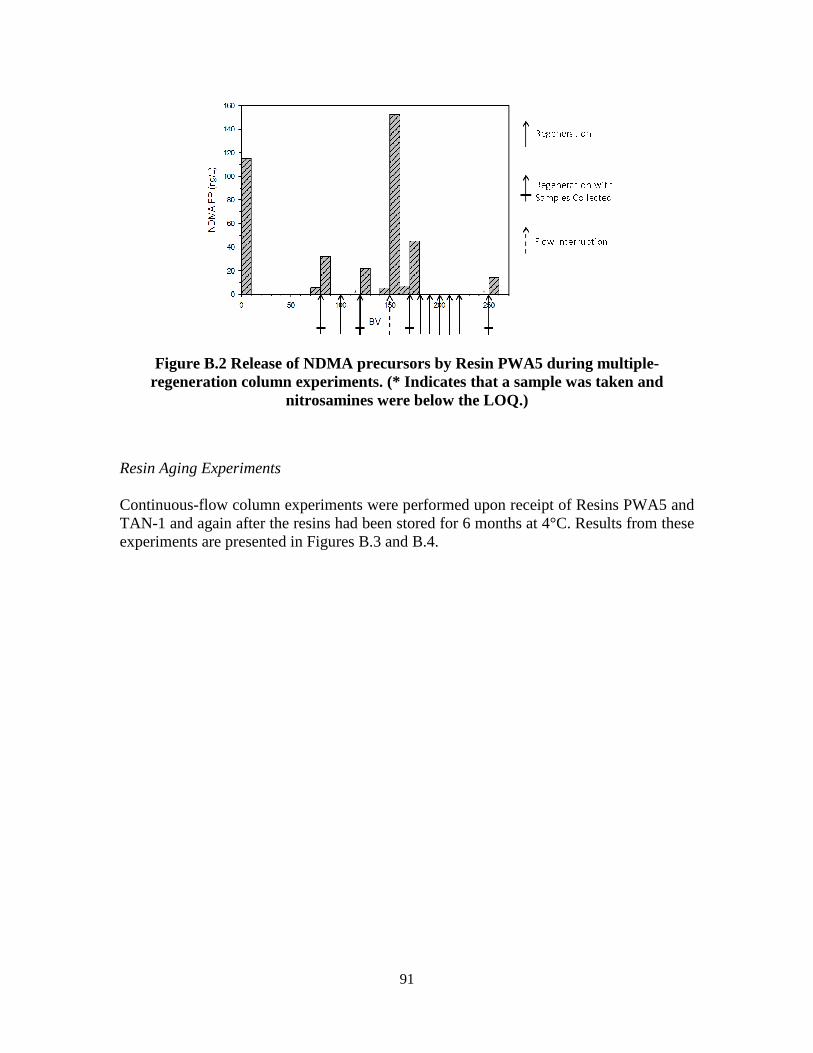
91
Figure B.2 Release of NDMA precursors by Resin PWA5 during multiple-regeneration column experiments. (* Indicates that a sample was taken and
nitrosamines were below the LOQ.)
Resin Aging Experiments Continuous-flow column experiments were performed upon receipt of Resins PWA5 and TAN-1 and again after the resins had been stored for 6 months at 4°C. Results from these experiments are presented in Figures B.3 and B.4.
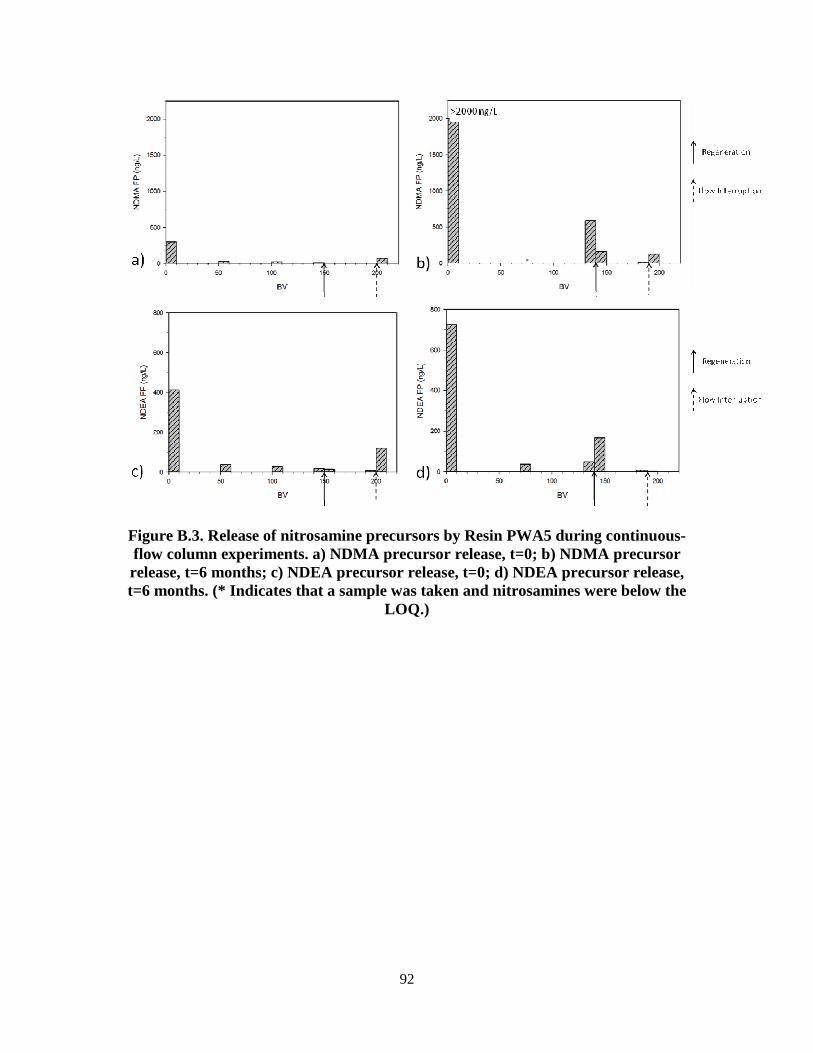
92
Figure B.3. Release of nitrosamine precursors by Resin PWA5 during continuous-flow column experiments. a) NDMA precursor release, t=0; b) NDMA precursor release, t=6 months; c) NDEA precursor release, t=0; d) NDEA precursor release, t=6 months. (* Indicates that a sample was taken and nitrosamines were below the
LOQ.)
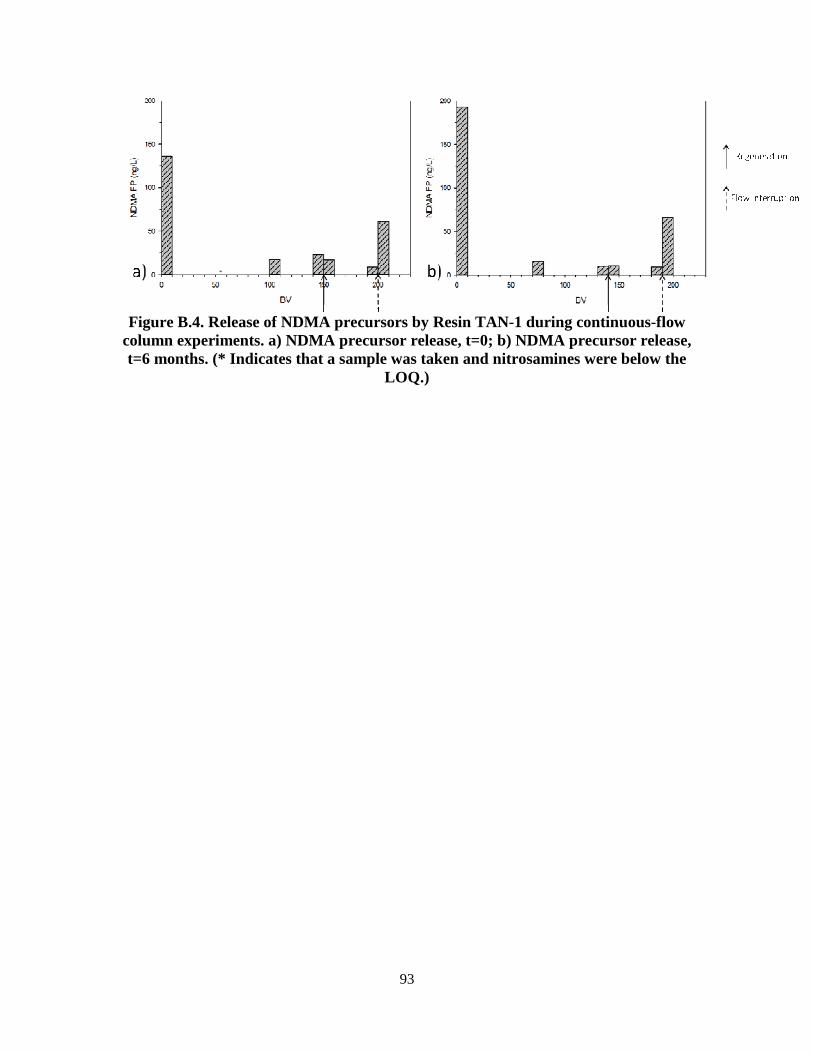
93
Figure B.4. Release of NDMA precursors by Resin TAN-1 during continuous-flow
column experiments. a) NDMA precursor release, t=0; b) NDMA precursor release, t=6 months. (* Indicates that a sample was taken and nitrosamines were below the
LOQ.)
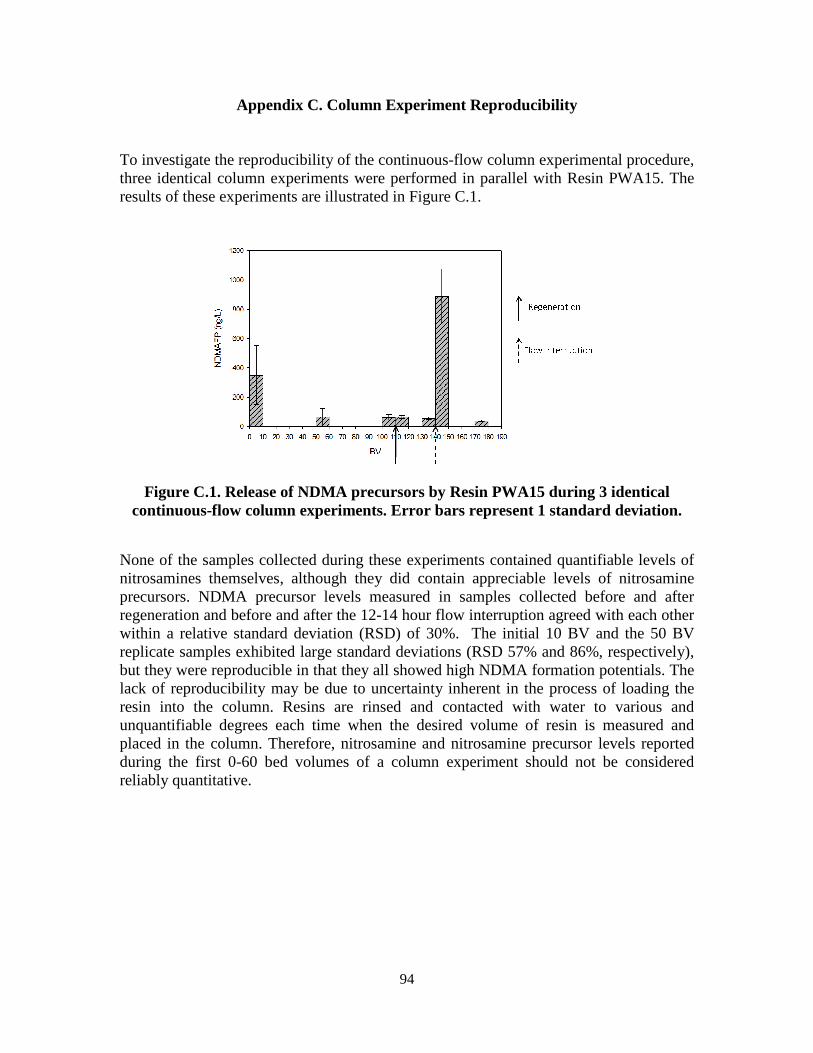
94
Appendix C. Column Experiment Reproducibility
To investigate the reproducibility of the continuous-flow column experimental procedure, three identical column experiments were performed in parallel with Resin PWA15. The results of these experiments are illustrated in Figure C.1.
Figure C.1. Release of NDMA precursors by Resin PWA15 during 3 identical continuous-flow column experiments. Error bars represent 1 standard deviation.
None of the samples collected during these experiments contained quantifiable levels of nitrosamines themselves, although they did contain appreciable levels of nitrosamine precursors. NDMA precursor levels measured in samples collected before and after regeneration and before and after the 12-14 hour flow interruption agreed with each other within a relative standard deviation (RSD) of 30%. The initial 10 BV and the 50 BV replicate samples exhibited large standard deviations (RSD 57% and 86%, respectively), but they were reproducible in that they all showed high NDMA formation potentials. The lack of reproducibility may be due to uncertainty inherent in the process of loading the resin into the column. Resins are rinsed and contacted with water to various and unquantifiable degrees each time when the desired volume of resin is measured and placed in the column. Therefore, nitrosamine and nitrosamine precursor levels reported during the first 0-60 bed volumes of a column experiment should not be considered reliably quantitative.
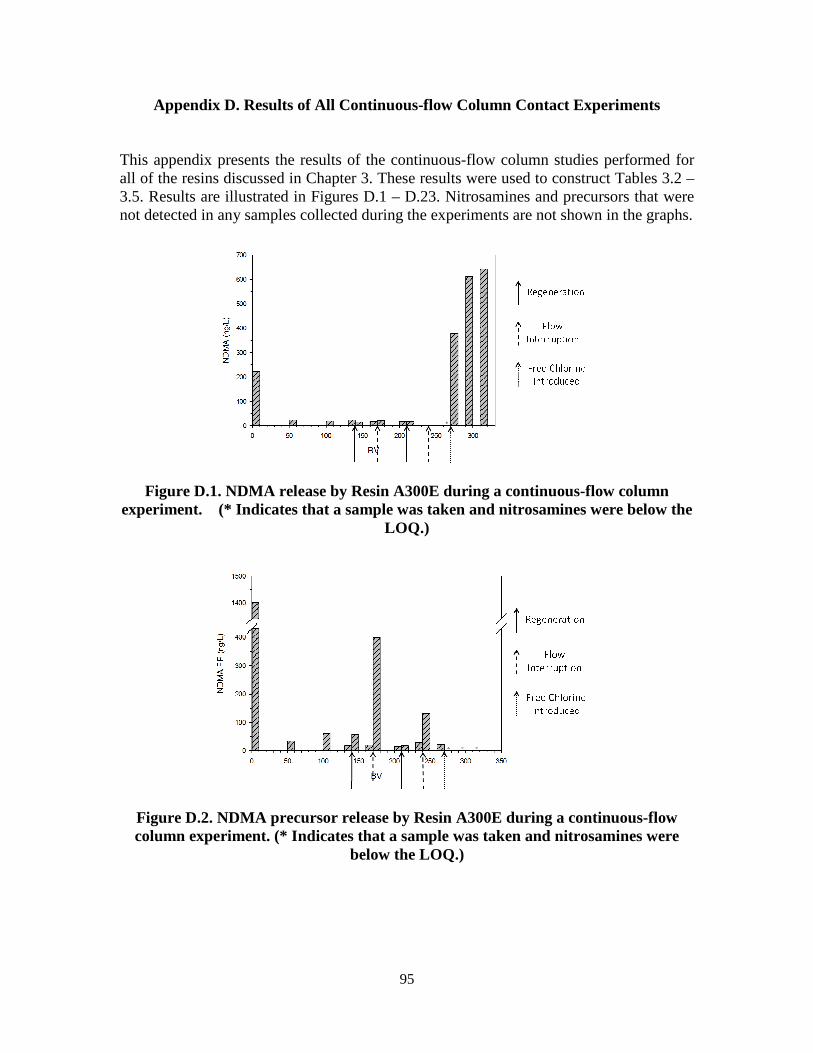
95
Appendix D. Results of All Continuous-flow Column Contact Experiments
This appendix presents the results of the continuous-flow column studies performed for all of the resins discussed in Chapter 3. These results were used to construct Tables 3.2 – 3.5. Results are illustrated in Figures D.1 – D.23. Nitrosamines and precursors that were not detected in any samples collected during the experiments are not shown in the graphs.
Figure D.1. NDMA release by Resin A300E during a continuous-flow column experiment. (* Indicates that a sample was taken and nitrosamines were below the
LOQ.)
Figure D.2. NDMA precursor release by Resin A300E during a continuous-flow column experiment. (* Indicates that a sample was taken and nitrosamines were
below the LOQ.)
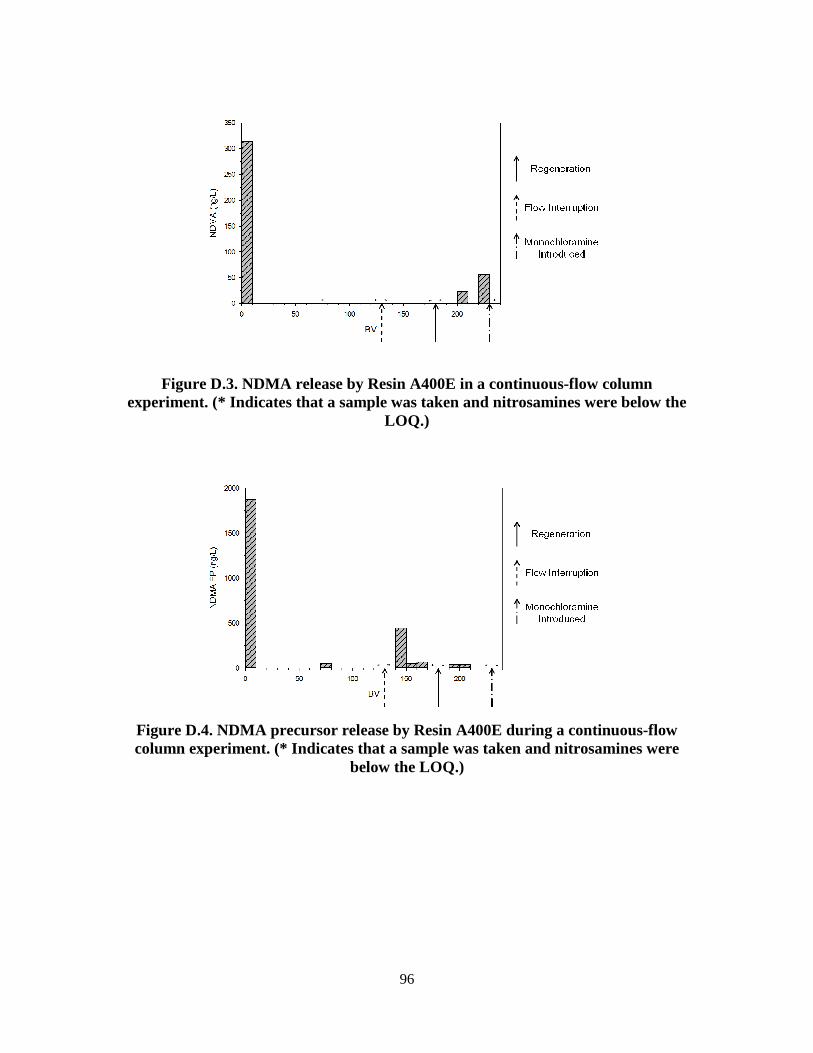
96
Figure D.3. NDMA release by Resin A400E in a continuous-flow column experiment. (* Indicates that a sample was taken and nitrosamines were below the
LOQ.)
Figure D.4. NDMA precursor release by Resin A400E during a continuous-flow column experiment. (* Indicates that a sample was taken and nitrosamines were
below the LOQ.)
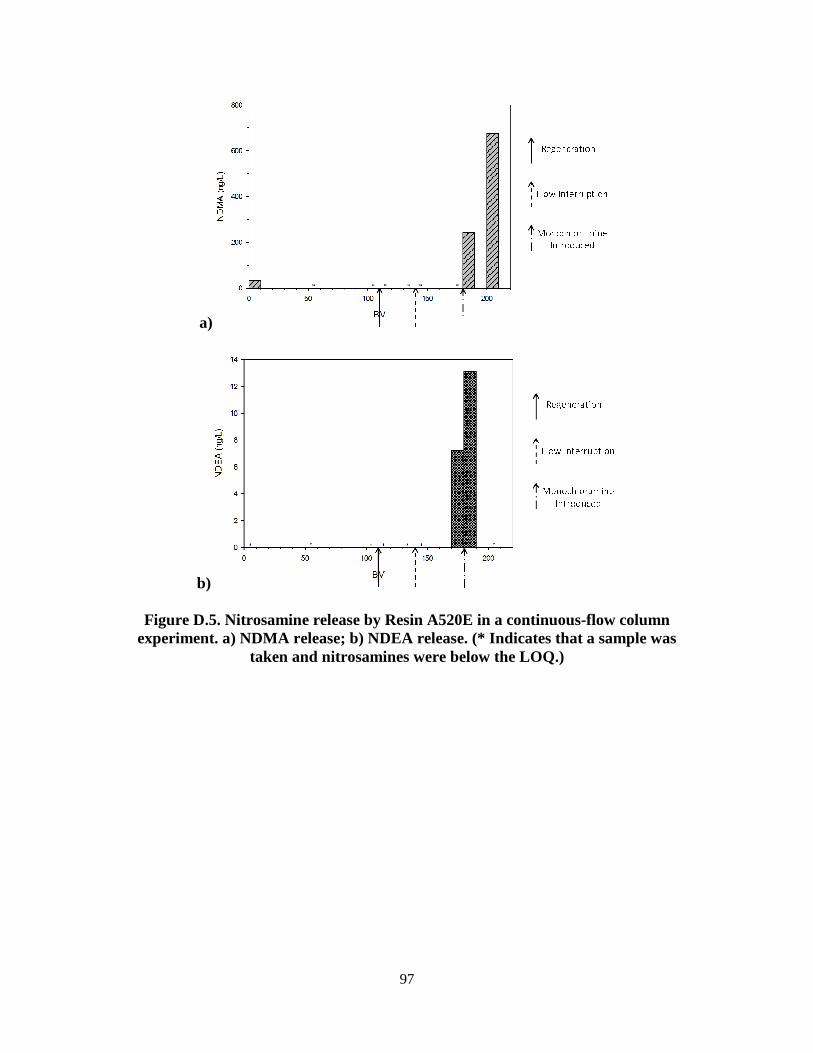
97
a)
b)
Figure D.5. Nitrosamine release by Resin A520E in a continuous-flow column experiment. a) NDMA release; b) NDEA release. (* Indicates that a sample was
taken and nitrosamines were below the LOQ.)
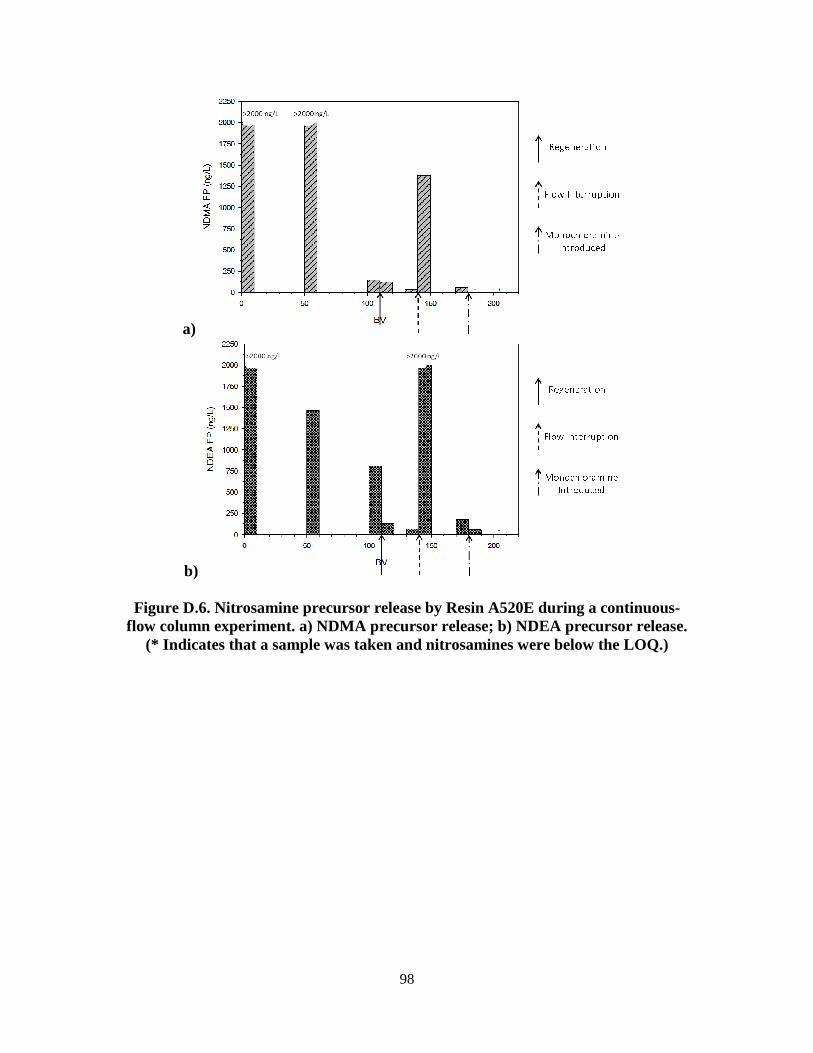
98
a)
b)
Figure D.6. Nitrosamine precursor release by Resin A520E during a continuous-flow column experiment. a) NDMA precursor release; b) NDEA precursor release.
(* Indicates that a sample was taken and nitrosamines were below the LOQ.)
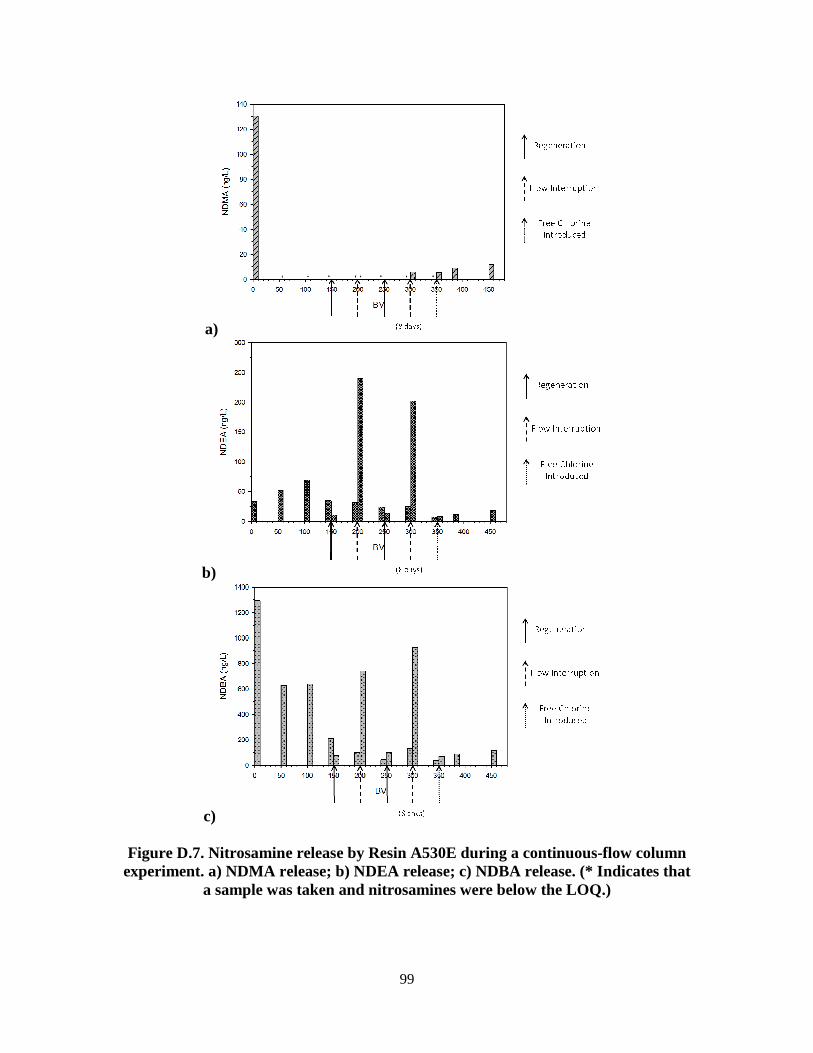
99
a)
b)
c)
Figure D.7. Nitrosamine release by Resin A530E during a continuous-flow column experiment. a) NDMA release; b) NDEA release; c) NDBA release. (* Indicates that
a sample was taken and nitrosamines were below the LOQ.)
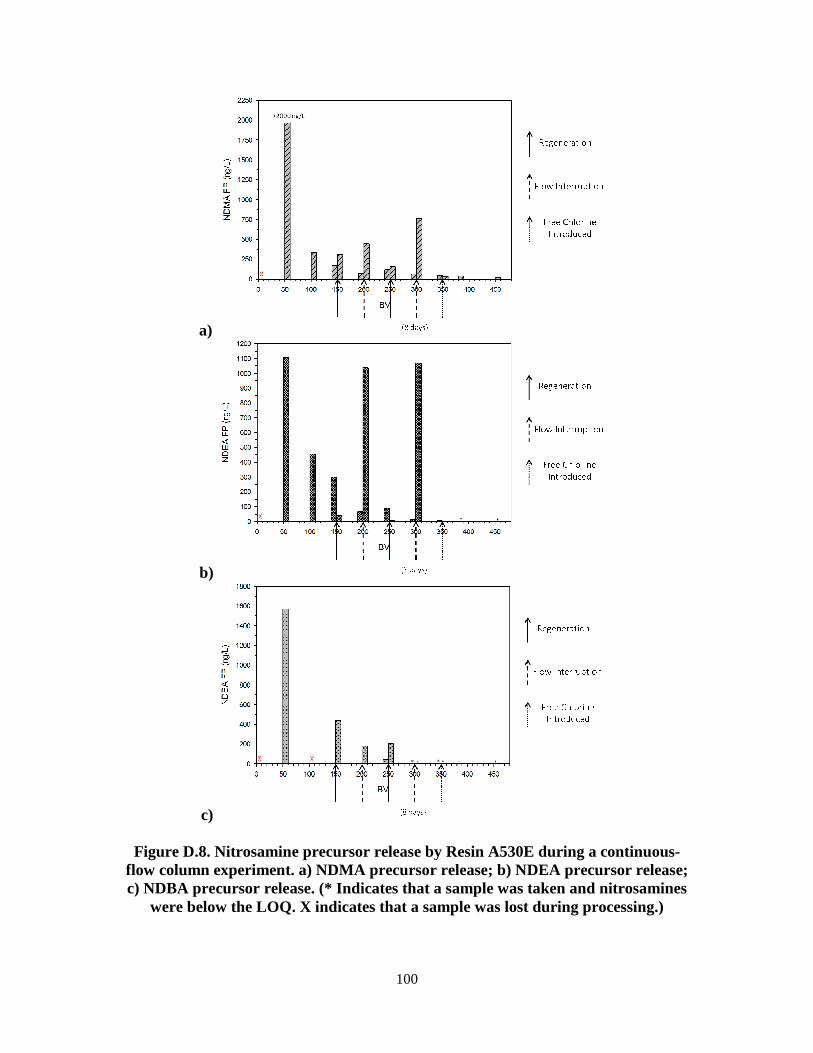
100
a)
b)
c)
Figure D.8. Nitrosamine precursor release by Resin A530E during a continuous-flow column experiment. a) NDMA precursor release; b) NDEA precursor release; c) NDBA precursor release. (* Indicates that a sample was taken and nitrosamines
were below the LOQ. X indicates that a sample was lost during processing.)
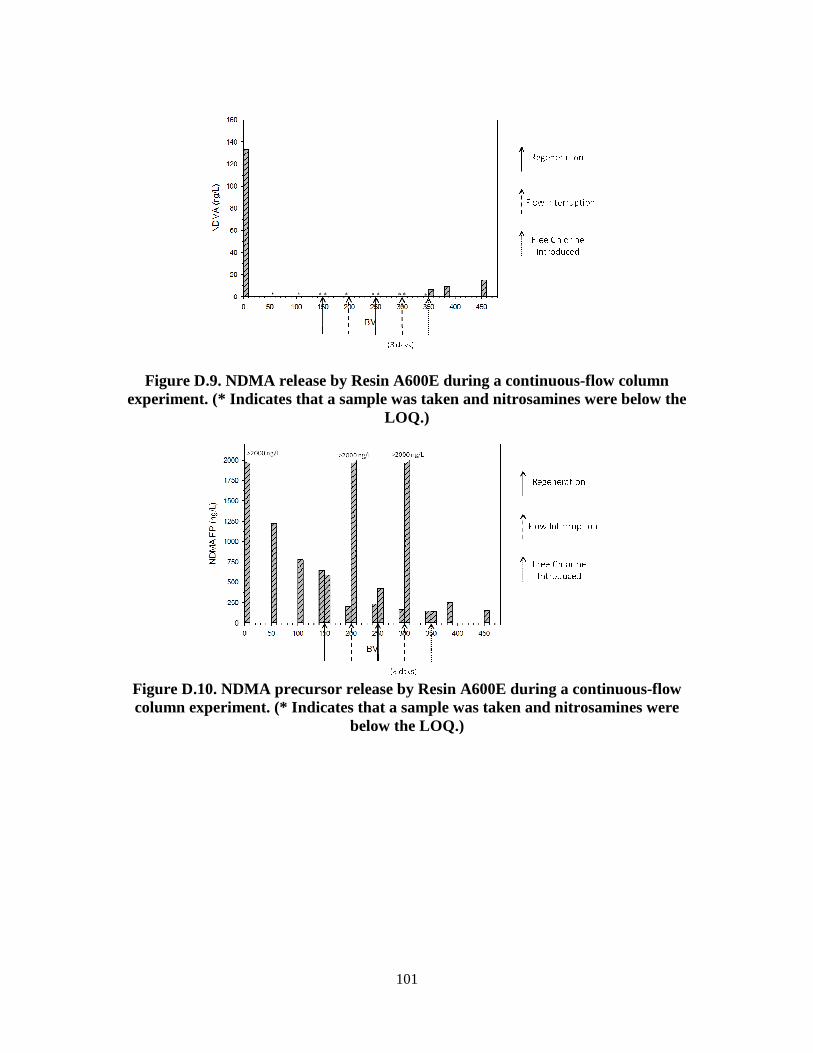
101
Figure D.9. NDMA release by Resin A600E during a continuous-flow column experiment. (* Indicates that a sample was taken and nitrosamines were below the
LOQ.)
Figure D.10. NDMA precursor release by Resin A600E during a continuous-flow column experiment. (* Indicates that a sample was taken and nitrosamines were
below the LOQ.)
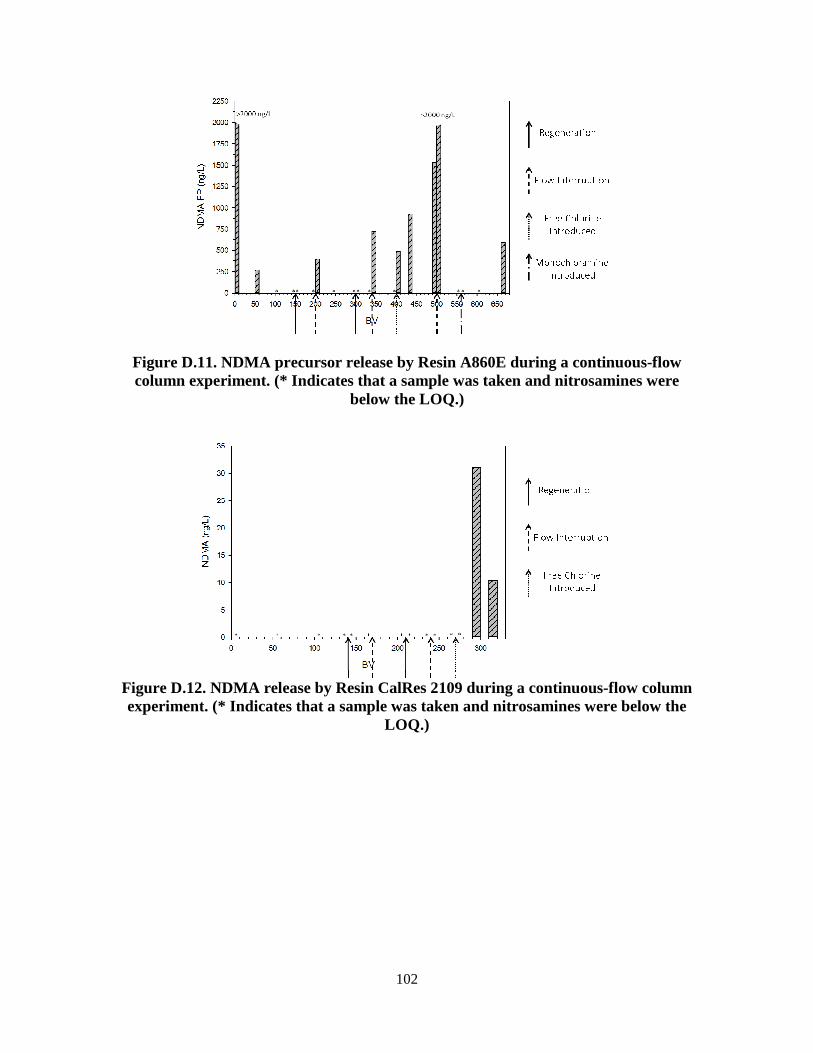
102
Figure D.11. NDMA precursor release by Resin A860E during a continuous-flow column experiment. (* Indicates that a sample was taken and nitrosamines were
below the LOQ.)
Figure D.12. NDMA release by Resin CalRes 2109 during a continuous-flow column experiment. (* Indicates that a sample was taken and nitrosamines were below the
LOQ.)
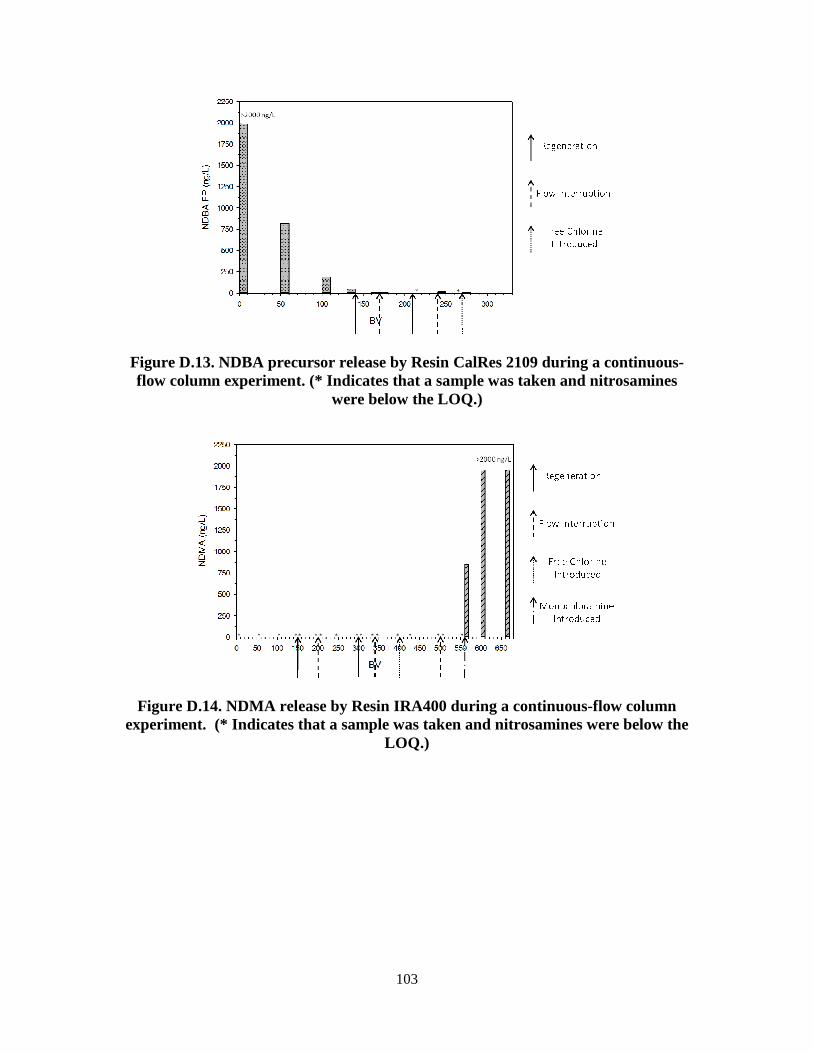
103
Figure D.13. NDBA precursor release by Resin CalRes 2109 during a continuous-flow column experiment. (* Indicates that a sample was taken and nitrosamines
were below the LOQ.)
Figure D.14. NDMA release by Resin IRA400 during a continuous-flow column experiment. (* Indicates that a sample was taken and nitrosamines were below the
LOQ.)
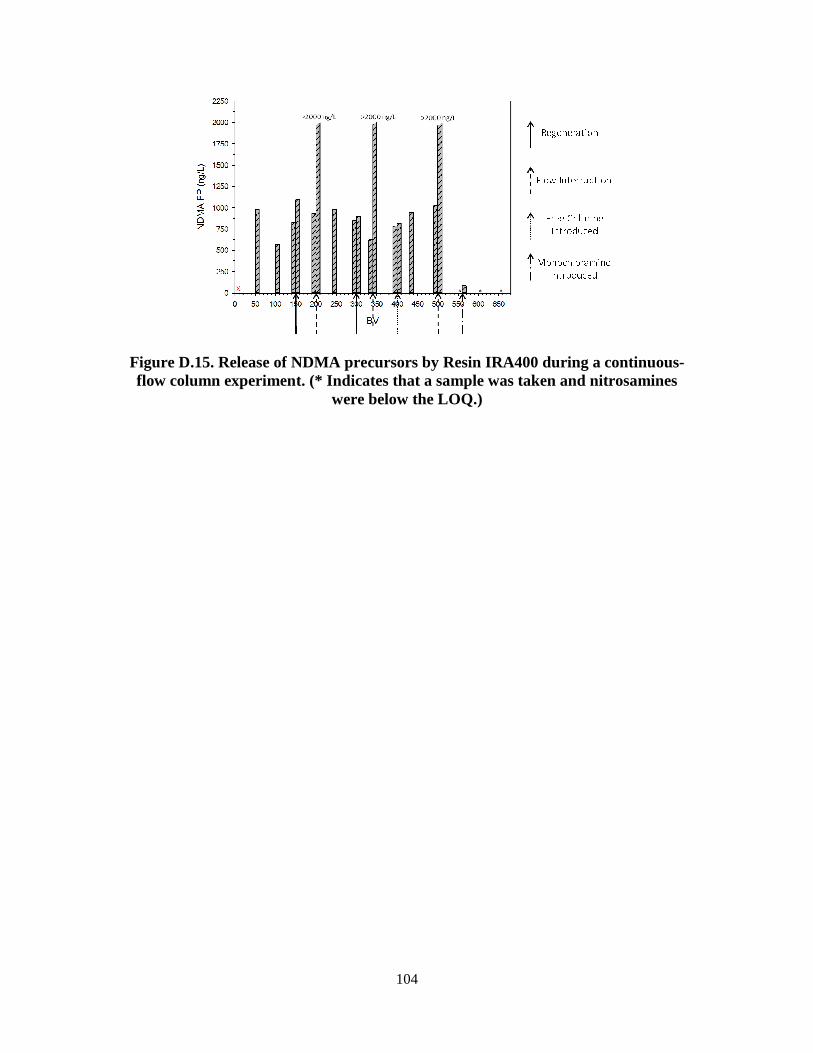
104
Figure D.15. Release of NDMA precursors by Resin IRA400 during a continuous-flow column experiment. (* Indicates that a sample was taken and nitrosamines
were below the LOQ.)
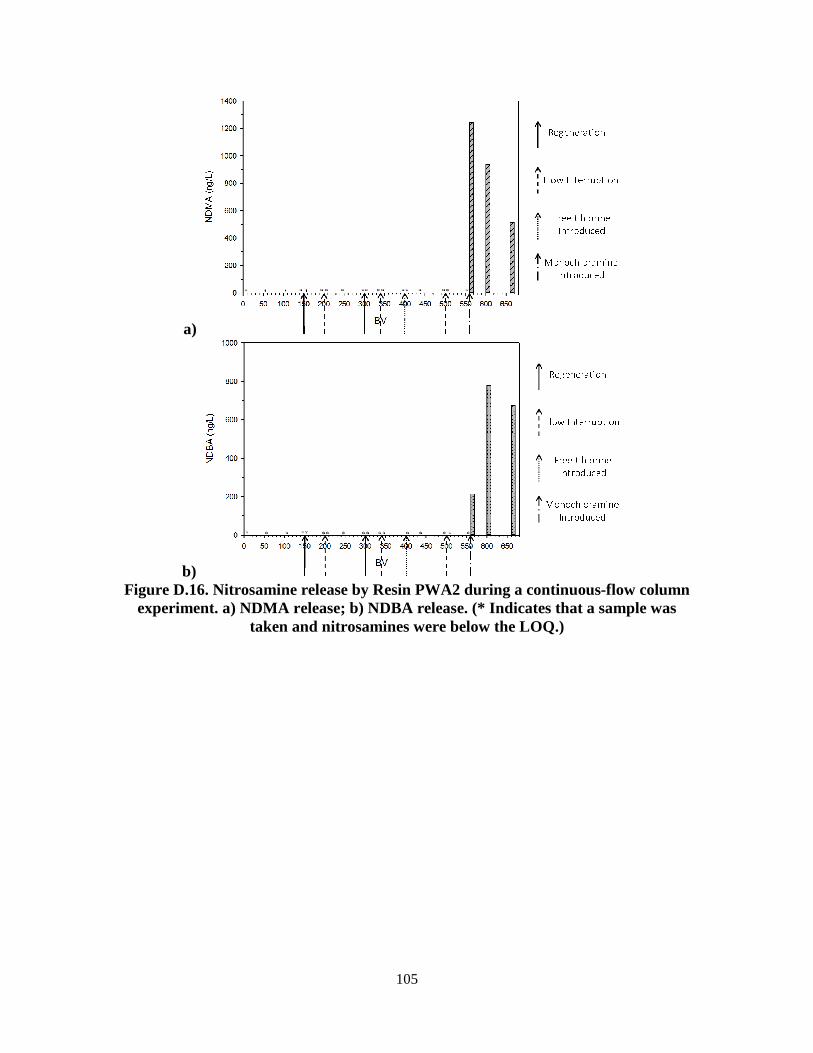
105
a)
b) Figure D.16. Nitrosamine release by Resin PWA2 during a continuous-flow column
experiment. a) NDMA release; b) NDBA release. (* Indicates that a sample was taken and nitrosamines were below the LOQ.)
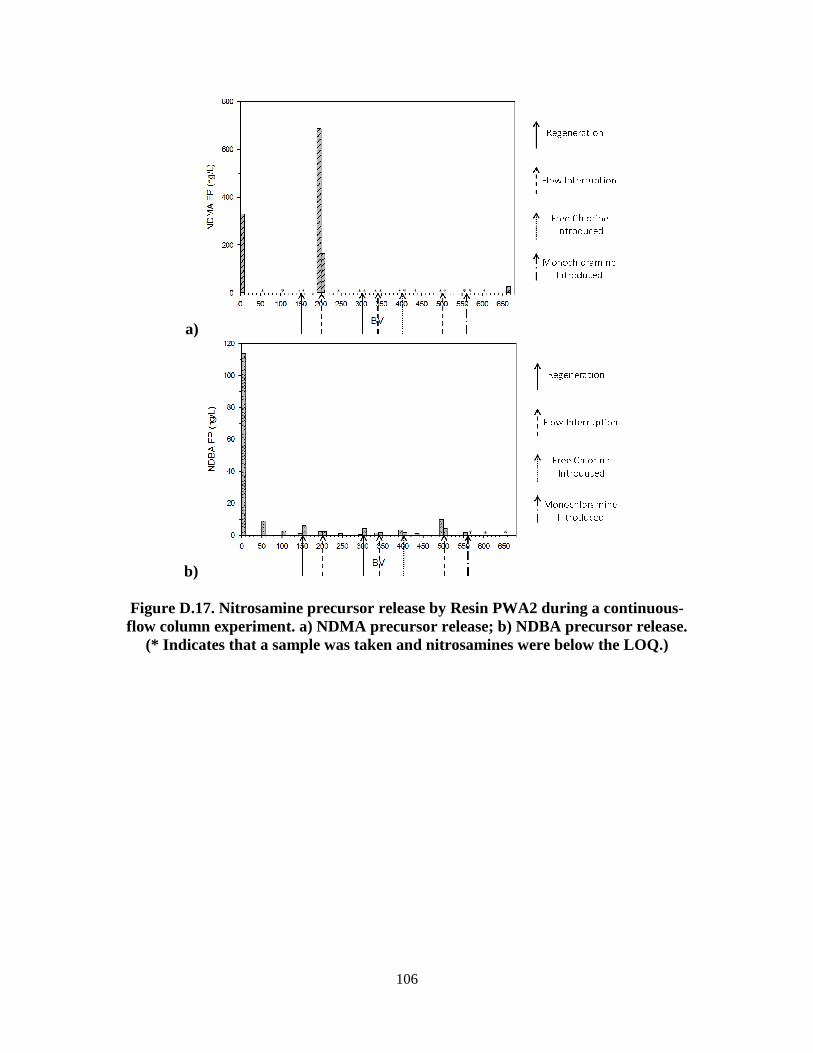
106
a)
b)
Figure D.17. Nitrosamine precursor release by Resin PWA2 during a continuous-flow column experiment. a) NDMA precursor release; b) NDBA precursor release.
(* Indicates that a sample was taken and nitrosamines were below the LOQ.)
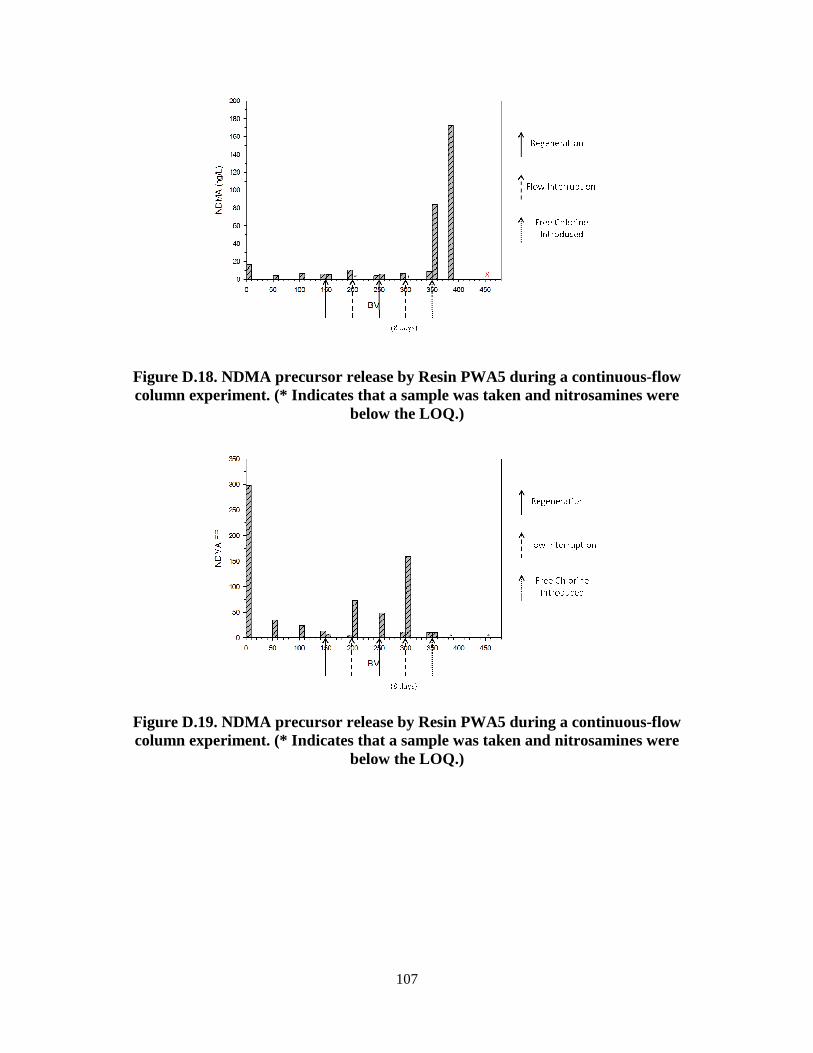
107
Figure D.18. NDMA precursor release by Resin PWA5 during a continuous-flow column experiment. (* Indicates that a sample was taken and nitrosamines were
below the LOQ.)
Figure D.19. NDMA precursor release by Resin PWA5 during a continuous-flow column experiment. (* Indicates that a sample was taken and nitrosamines were
below the LOQ.)
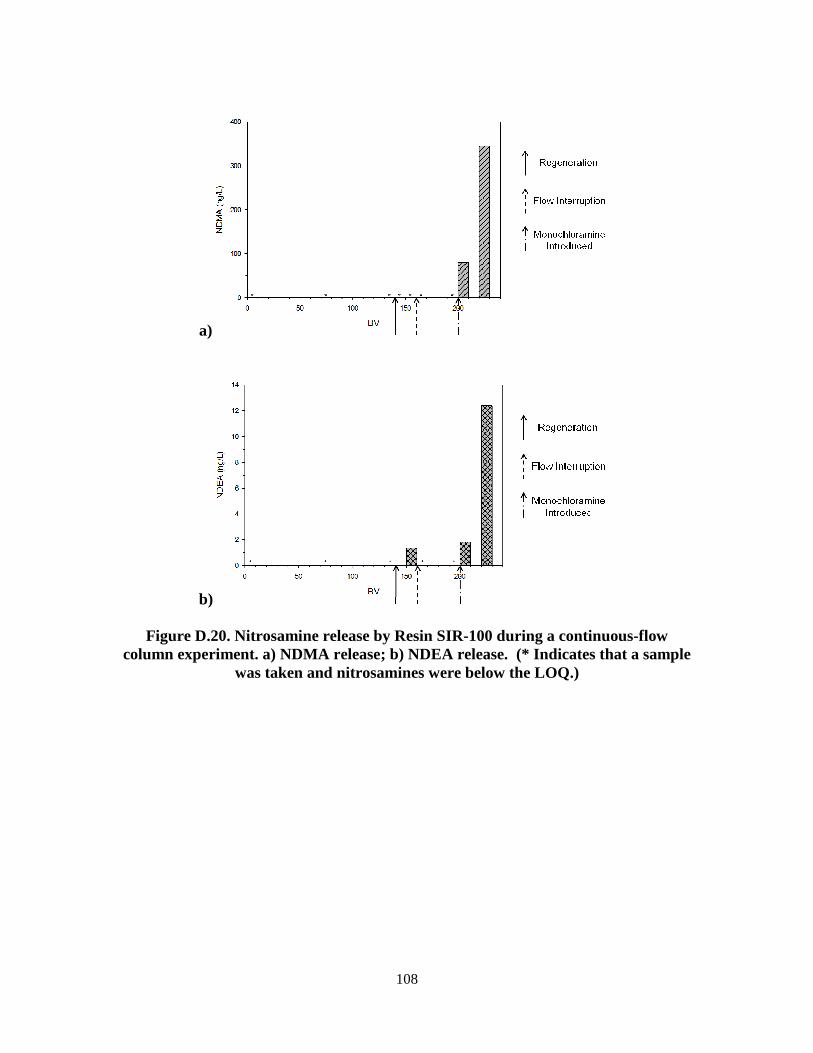
108
a)
b)
Figure D.20. Nitrosamine release by Resin SIR-100 during a continuous-flow column experiment. a) NDMA release; b) NDEA release. (* Indicates that a sample
was taken and nitrosamines were below the LOQ.)
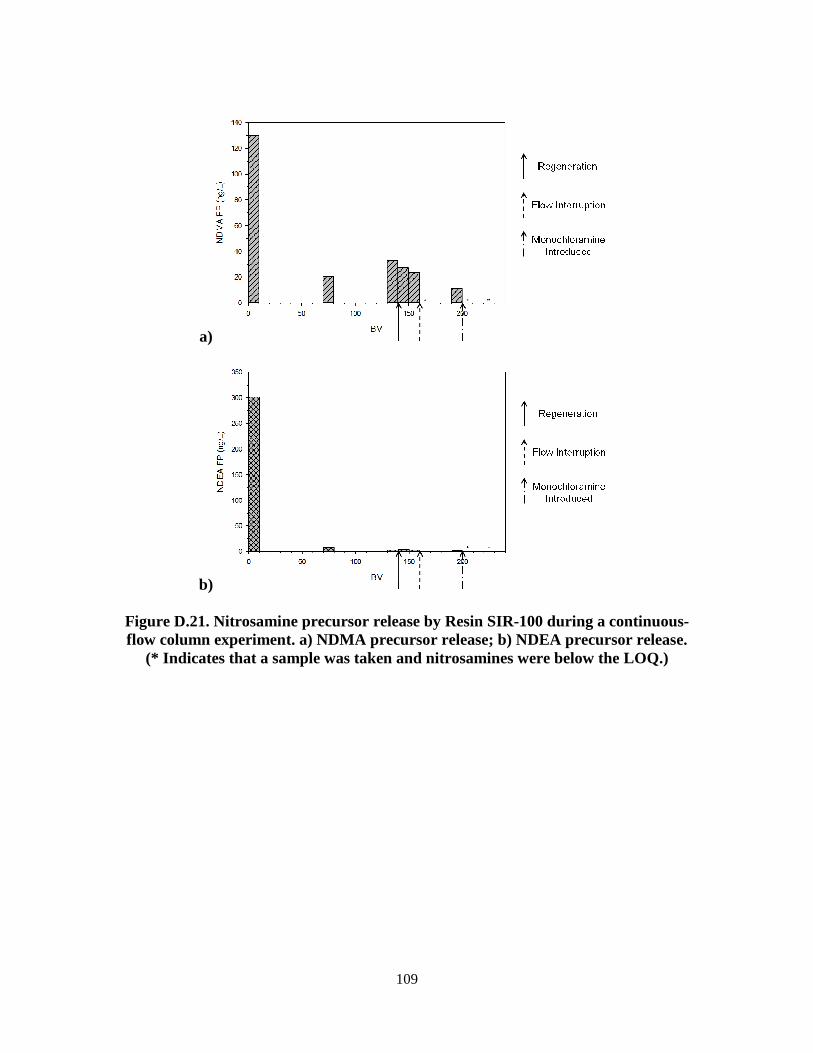
109
a)
b) Figure D.21. Nitrosamine precursor release by Resin SIR-100 during a continuous-flow column experiment. a) NDMA precursor release; b) NDEA precursor release.
(* Indicates that a sample was taken and nitrosamines were below the LOQ.)
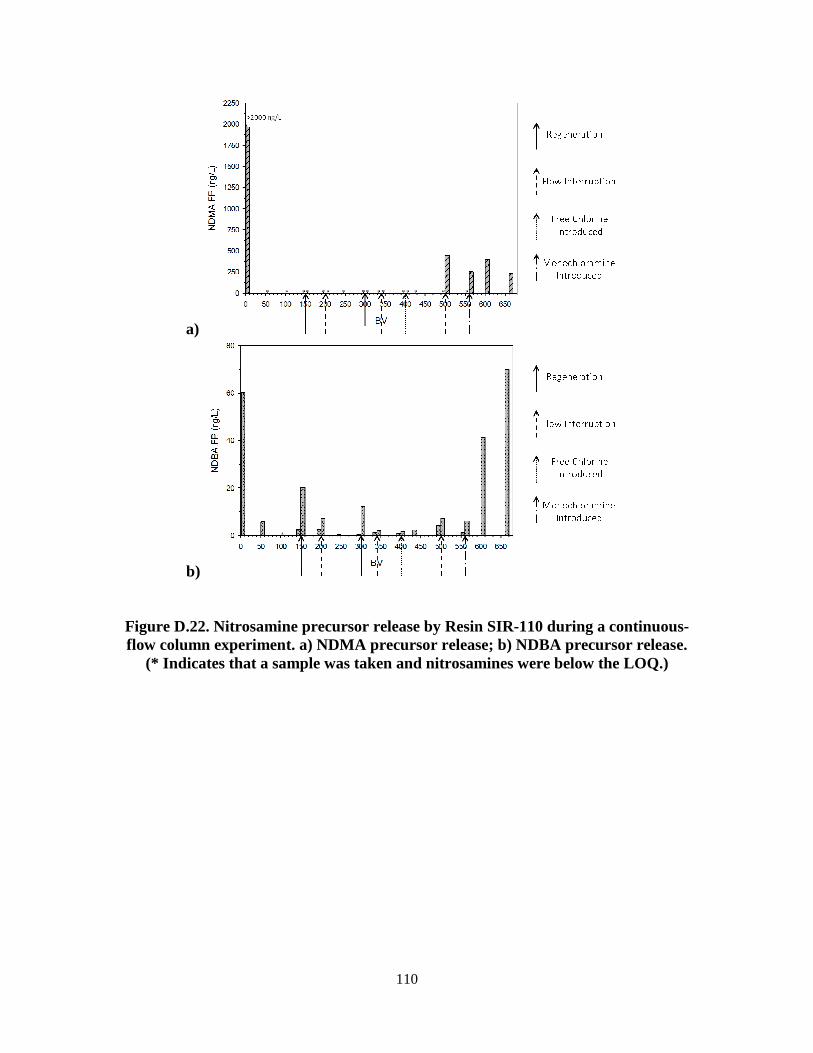
110
a)
b)
Figure D.22. Nitrosamine precursor release by Resin SIR-110 during a continuous-flow column experiment. a) NDMA precursor release; b) NDBA precursor release.
(* Indicates that a sample was taken and nitrosamines were below the LOQ.)
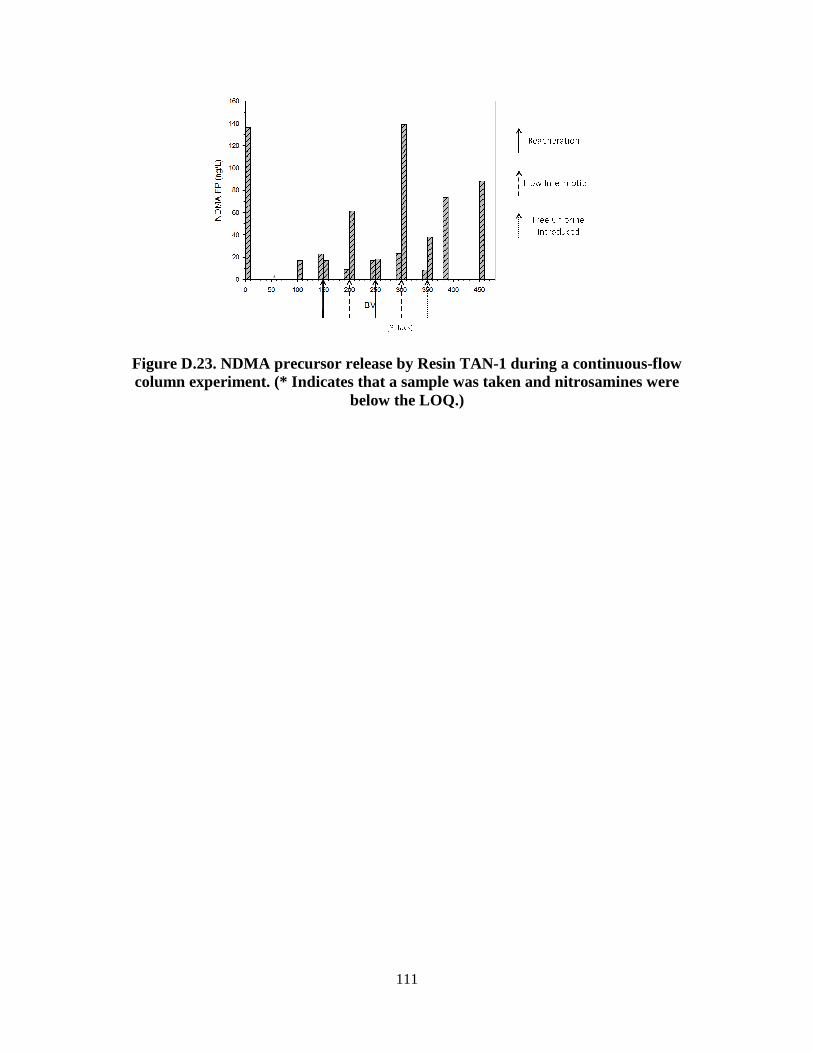
111
Figure D.23. NDMA precursor release by Resin TAN-1 during a continuous-flow column experiment. (* Indicates that a sample was taken and nitrosamines were
below the LOQ.)
112
References
Asami, M.; Oya, M.; Kosaka, K. A nationwide survey of NDMA in raw and drinkingwater in Japan. Sci. Total Environ. 2009, 407, 3540-3545. Bolto, B.; Dixon, D.; Eldridge, R.; King, S.; Linge, K. Removal of natural organic matter by ion exchange. Water Res. 2002, 36 (20), 5057-5065. California Department of Health Services; Studies on the Occurrence of NDMA in Drinking Water; 2002 California Department of Public Health (CA DPH); NDMA and Other Nitrosamines – Drinking Water Issues; <http://www.cdph.ca.gov/certlic/drinkingwater/Pages/NDMA.aspx> 2009 Calgon Carbon Corporation; Ion Exchange Technologies for Perchlorate Removal from Drinking Water are Evolving 2005 Charrois, J. W. A.; Boyd, J. M.; Froese, K. L.; Hrudey, S. E. Occurrence of N-nitrosamines in Alberta public drinking-water distribution systems. J. Environ. Eng. Sci. 2007, 6, 103-114. Chen, Z.; Valentine, R. L. Modeling the formation of N-nitrosodimethylamine from the reaction of natural organic matter (NOM) with monochloramine. Environ. Sci. Technol. 2006, 40, 7290-7297. Chen, Z.; Valentine, R. L. Formation of N-nitrosodimethylamine (NDMA) from humic substances in natural water. Environ. Sci. Technol. 2007, 41, 6059-6065. Chen, Z.; Young, T. M. NDMA formation during chlorination and chloramination of aqueous diuron solutions. Environ. Sci. Technol. 2008, 42, 1072-1077. Choi, J.; Valentine, R. L. Formation of N-nitrosodimethylamine (NDMA) from reaction of monochloramine: a new disinfection by-product. Water Res. 2002a, 36, 817-824. Choi, J.; Valentine, R. L. A Kinetic model of N-nitrosodimethylamine (NDMA) formation during water chlorination/chloramination. Water Sci. Technol. 2002b, 46 (3), 65. Dotson, A.; Westerhoff, P.; Krasner, S. W. Nitrogen enriched dissolved organic matter (DOM) isolates and their affinity to form emerging disinfection by-products. Water Sci. Technol. 2009 Dow Chemical Company; DOWEX™ Ion Exchange Resins – Using Ion Exchange Resin Selectivity Coefficients 2011a
113
Dow Chemical Company; DOW Ion Exchange Resins - Type 1 and Type 2 Strong Base Anion Resins Differences 2011b, 43, 2911-2918. deSilva, F. J. Nitrate Removal by Ion Exchange; Water Quality Products, April, 2003 de Zeeuw, J.; Stricek, R.; Stidsen, G. A base-deactivated capillary column for analysis of volatile amines, ammonia, and alcohols. American Laboratory 2011, February. Fiddler, W.; Pensabene, J. W.; Doerr, R. C.; Dooley, C. J. The presence of dimethyl- and diethylnitrosamines in deionized water. Food and Cosmetics Toxicology 1977, 15 (5), 441. Gerecke, A. C.; Sedlak, D. L. Precursors of N-nitrosodimethylamine in natural waters. Enrivon. Sci. Technol. 2003, 37, 1331-1336. Gough, T. A.; Webb, K. S.; McPhail, M. F. Volatile nitrosamines from ion-exchange resins. Food and Cosmetics Toxicology 1977, 15 (5), 437. Gu, B.; Brown, G. M.; Alexandratos, D.; Ober, R.; Patel V. Selective Anion Exchange Resins for the Removal of Perchlorate ClO4
- from Groundwater. Oak Ridge Nat. Lab. Eniron. Sci. Div., Pub. No 4863 1999 Harland, C. E. Ion Exchange: Theory and Practice, 2nd Ed.; The Royal Society of Chemistry: Cambridge, U.K., 1994 Jurado-Sanchez, B.; Ballesteros, E.; Gallego, M. Screening of N-nitrosamines in tap a swimming pool waters using fast gas chromatography. J. Sep. Sci. 2010, 33, 610-616. Kemper, J. M.; Westerhoff, P.; Dotson, A.; Mitch, W. A. Nitrosamine, dimethylnitramine, and chloropicrin formation during strong base anion-exchange treatment. Environ. Sci. Technol. 2009, 43 (2), 466-472. Kemper, J.; Walse, S. S.; Mitch, W. A.; Quaternary amines as nitrosamine precursors: a role for consumer products. Environ. Sci. Technol. 2010, 44, 1224-1231. Kimoto, W. I.; Dooley, C. J.; Carre, J.; Fiddler, W. Role of strong ion exchange resins in nitrosamine formation in water. Water Res. 1980, 14 (7) 869-876. Kunin, R. Ion Exchange Resins, 2nd Ed.; John Wiley: New York, 1963 Lee, W.; Westerhoff, P.; Croue, J. P. Dissolved organic nitrogen as a precursor for chloroform, dichloroacetonitrile, N-nitrosodimethylamine, and trichloronitromethane. Environ. Sci. Technol. 2007, 41 (15), 5485-5490.
114
Le Roux, J.; Gallard, H.; Croue, J. P. Formation of NDMA by chloramination of nitrogenous contamiants: potential role of bromide and dissolved oxygen. Proc., Am. Water Works Assoc. Water Qual. Technol. Conf. 2011 Massachusetts Department of Evnironmental Protection (MassDEP); Current Regulatory Limit: n-Nitrosodimethylamine (NDMA); <http://www.mass.gov/dep/water/drinking/standards/ndma.htm> 2004 Mitch, W. A.; Schreiber, I. M. Degradation of tertiary alkylamines during chlorination/chloramination: implications for formation of aldehydes, nitriles, halonitroalkanes, and nitrosamines. Environ. Sci.Technol. 2008, 42 (13), 4811-4817. Mitch, W. A.; Gerecke, A. C.; Sedlak, D. L. A N-nitrosodimethylamine (NDMA) precursor analysis for chlorination of water and wastewater. Water Res. 2003, 37 (15), 3733-3741. Mitch, W. A.; Sedlak, D. L. Formation of N-nitrosodimethylamine (NDMA) from dimethylamine during chlorination. Environ. Sci. Technol. 2002, 36 (4), 588-595. Mitch, W. A.; Sedlak, D. L. Characterization and fate of N-nitrosodimethylamine precursors in municipal wastewater treatment plants. Environ. Sci. Technol. 2004, 38 (5), 1445-1454. Montgomery Watson Harza, Inc. Water Treatment Principles and Design, 2nd Ed.; John Wiley: Hoboken, NJ, 2005 Najm, I.; Trussell, R. R. NDMA formation in water and wastewater. J. – Am. Water Works Assoc. 2001 93, 92-99.
Nawrocki, J.; Andrzejewski, P. Nitrosamines and water. J. Hazard. Mater. 2011, 189, 1-18. Ontario Ministry of the Environment; Drinking Water Surveillance Program 1996-1997 Executive Summary Report; <http://www.ene.gov.on.ca/stdprodconsume/groups/lr/@ene/@resources/documents/resource/stdprod_078238.pdf> 1998 Padhye, L.; Tezel, U.; Mitch, W. A.; Pavlostasis, S. G.; Huang, C.-H. Occurrence and fate of nitrosamines and their precursors in municipal sludge and anaerobic digestion systems. Environ. Sci. Technol. 2009, 43, 3087-3093. Park, S. H.; Wei, S.; Mizaikoff, B.; Taylor, A. E.; Favero, C.; Huang, C.-H. Degradation of amine-based water treatment polymers during chloramination as N-nitrosodimethylamine (NDMA) precursors. Environ. Sci. Technol. 2009, 43, 1360-1366.
115
Russell, C. G.; Blute, N. K.; Via, S.; Wu, X.; Chowdhury, Z. Nationwide assessment of nitrosamine occurrence and trends. J. – Am. Water Works Assoc. (in press) Schreiber, M.; Mitch, W. A. Influence of the order of reagent addition on NDMA formation during chloramination. Environ. Sci. Technol. 2005, 39 (10), 3811-3818. Schreiber, M.; Mitch, W. A.; Nitrosamine formation pathway revisited. The importance of chloramines speciation and dissolved oxyger. Environ. Sci. Technol. 2006, 40, 6007-6014. Shen, R.; Andrews, S. A. Demonstration of 20 pharmaceuticals and personal care products (PPCPs) as nitrosamine precursors during chloramines disinfection. Water Res. 2010, 45, 944-952. Sigma-Aldrich; Product Specification – Trimethylamine – anhydrous, ≥99% 2011 Thurman, E. M.; Malcolm, R. L. Preparative isolation of aquatic humic substances. Environ. Sci. Technol. 1981, 15 (4), 463-466. United States Environmental Protection Agency (US EPA); A New Approach to Protecting Drinking Water and Public Health; <http://water.epa.gov/lawsregs/rulesregs/sdwa/dwstrategy/upload/Drinking_Water_Strategyfs.pdf > 2010 United States Environmental Protection Agency (US EPA); Integrated Risk Information System (IRIS); < http://www.epa.gov/IRIS/> 2011a United States Environmental Protection Agency (US EPA); Contaminant Candidate List 3 – CCL 3; <http://water.epa.gov/scitech/drinkingwater/dws/ccl/ccl3.cfm> 2011b United States Environmental Protection Agency (US EPA); Unregulated Contaminant Monitoring Rule 2 (UCMR 2); <http://water.epa.gov/lawsregs/rulesregs/sdwa/ucmr/ucmr2/> 2011c Valentine, R. L.; Choi, Z.; Chen, Z.; Barrett, S. E.; Hwang, C.; Guo, Y. C.; Wehner, M.; Fitzsimmons, S.; Andrews, S. A.; Werker, A. G.; Brubacher, C.; Kohut, K. Factors Affecting the Formation of NDMA in Water and Occurrence; AwwaRF and AWWA: Denver, CO, 2006 Wang, W.; Ren, S.; Zhang, H.; Yu, J.; An, W.; Hu, J.; Yang, M. Occurrence of nine nitrosamines and secondary amines in source water and drinking water: Potential of secondary amines as nitrosamine precursors. Water Res. 2011, 45, 4930-4938. Westerhoff, P.; Mash, H. Dissolved organic nitrogen in drinking water supplies: a review. J. Water Supply Res. Technol. – Aqua 2002, 51.8, 415-448.
116
Wilczak, A.; Assadi-Rad, A.; Lai, H. H.; Hoover, L. L.; Smith, J. F.; Berger, R.; Rodigari, F.’ Beland, J. W.; Lazzelle, L. J.; Kincannon, E. G.; Baker, H.; Heany, C. T. Formation of NDMA in chloraminated water coagulated with DAMAC cationic polymer. J. – Am. Water Works Assoc. 2003, 95 (9), 94-682. Zhao, Y.-Y.; Boyd, J.; Hrudey, S. E.; Li, X.-F. Characterization of new nitrosamines in drinking water using liquid chromatography tandem mass spectrometry. Environ. Sci. Technol. 2006, 40 (24), 7637-7641.