Embed Size (px)
Citation preview
Loyola University ChicagoLoyola eCommons
Master's Theses Theses and Dissertations
2010
Diet Overlap and Competition Among Native andNon-Native Small-Bodied Fishes in the ColoradoRiver, Grand Canyon, ArizonaSarah Ellen Zahn SeegertLoyola University Chicago
This Thesis is brought to you for free and open access by the Theses and Dissertations at Loyola eCommons. It has been accepted for inclusion inMaster's Theses by an authorized administrator of Loyola eCommons. For more information, please contact [email protected].
This work is licensed under a Creative Commons Attribution-Noncommercial-No Derivative Works 3.0 License.Copyright © 2010 Sarah Ellen Zahn Seegert
Recommended CitationSeegert, Sarah Ellen Zahn, "Diet Overlap and Competition Among Native and Non-Native Small-Bodied Fishes in the Colorado River,Grand Canyon, Arizona" (2010). Master's Theses. Paper 563.http://ecommons.luc.edu/luc_theses/563

LOYOLA UNIVERSITY CHICAGO
DIET OVERLAP AND COMPETITION AMONG NATIVE AND NON-NATIVE
SMALL-BODIED FISHES IN THE COLORADO RIVER, GRAND CANYON,
ARIZONA
A THESIS SUBMITTED TO
THE FACULTY OF THE GRADUATE SCHOOL
IN CANDIDACY FOR THE DEGREE OF
MASTER OF SCIENCE
PROGRAM IN BIOLOGY
BY
SARAH ELLEN ZAHN SEEGERT
CHICAGO, ILLINOIS
DECEMBER 2010

Copyright by Sarah Ellen Zahn Seegert, 2010 All rights reserved.

iii
ACKNOWLEDGMENTS
I thank A. Adams, A. Aubeneau, C. Baxter, K. Behn, N. Bender, M. Berg, A.
Copp, W. Cross, K. Donner, B. Hall, P. Hoppe, J. Kampman, H. Kelly, T. Kennedy, D.
Kincaid, C. Petereson, A. Riggs, M. Schroer, K. Vallis for field and laboratory assistance,
data analysis and editing. I especially thank my advisor, Dr. Emma Rosi-Marshall, for all
her guidance, support, and encouragement during my time at Loyola. I also would
especially like to thank my committee members, Dr. Chris Peterson, Dr. Marty Berg, and
Dr. Colden Baxter for their guidance and thoughtful comments regarding this work. This
work was supported by a grant from the United States Geological Survey, Grand Canyon
Monitoring and Research Center.

To my husband, Nathan, and my parents Rick and Rosan, for all your love and support.

v
TABLE OF CONTENTS
ACKNOWLEDGEMENTS iii
LIST OF TABLES vi
LIST OF FIGURES viii
ABSTRACT x
CHAPTER ONE: INTRODUCTION 1 Objectives and hypotheses 11 Study questions 12
CHAPTER TWO: METHODS 15 Study sites and sample collection 15 Study species 17 Gut content analysis 20 Data analysis 24
CHAPTER THREE: RESULTS 27 Diet composition 27 Seasonal variability 27 Diet overlap 33 Inter-annual patterns and dam operations 39 Potential drivers of seasonal and inter-annual diet variability 43 Potential influences of habitat on diet composition 46 CHAPTER FOUR: DISCUSSION 51 Niche overlap 52 Seasonal heterogeneity in diets and niche overlap 52 Inter-annual heterogeneity and dam operations 55 Potential drivers of seasonal and inter-annual diet variability 56 Importance of backwaters 56 Implications of niche overlap 57 Implications for management and recommendations for future research priorities 61 Conclusion 62 APPENDIX A: COMPLETE DIET COMPOSITION TABLE 64
LITERATURE CITED 89
VITA 95

vi
LIST OF TABLES
Table 1. Approximate mean site characteristics. 16
Table 2. Correlation of percent diet resulting from mass and area measurements for each of the dominant food resources (>10% in diets) and each sampling date. 22
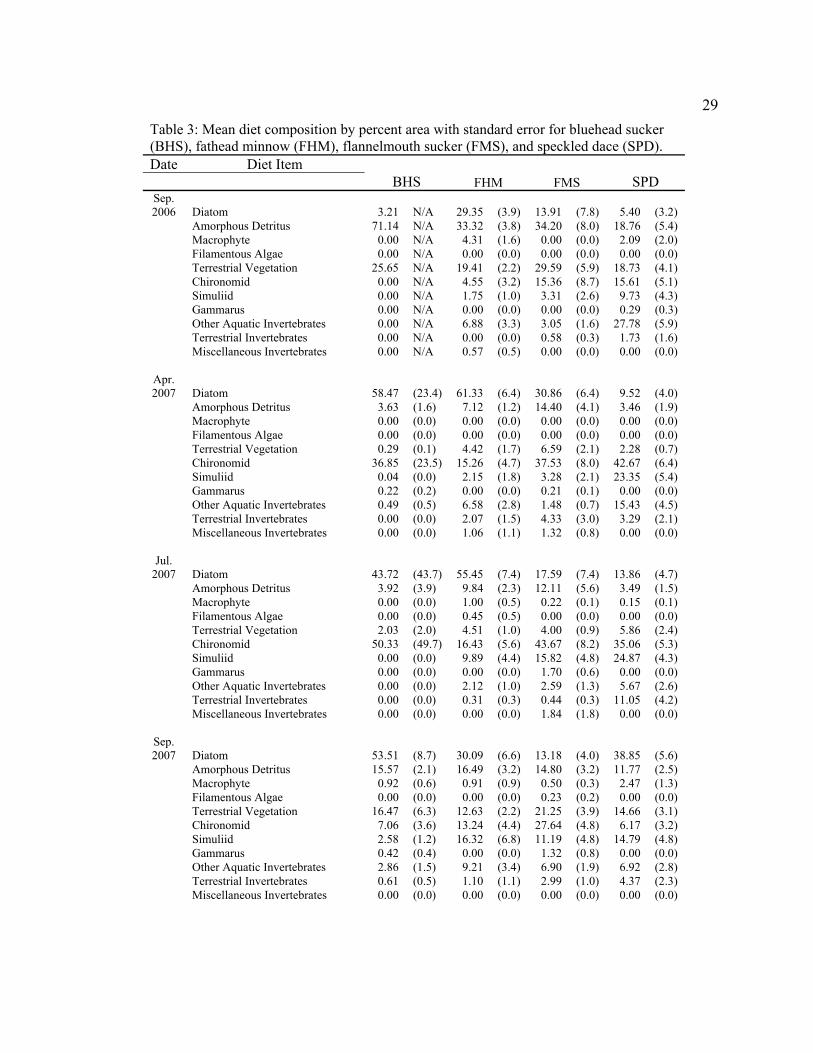
Table 3. Mean diet composition by percent area with standard error for bluehead
sucker (BHS), fathead minnow (FHM), flannelmouth sucker (FMS), and speckled dace (SPD). 29
Table 4. Seasonal differences in the proportion of each of the dominant food
resources (>10% in diets) in the diets of bluehead sucker (BHS), flannelmouth sucker (FMS), speckled dace (SPD) and fathead minnow (FHM) (One-way ANOVAs with Tukey’s pairwise comparisons). Bold values indicate significant p-values (<0.05). Non-significant (p-value > 0.05) ANOVA analyses are not shown. 31
Table 5. Schoener’s similarity matrix for all species-species combinations for each
sampling date. Scores are calculated from the mean proportion of each diet item. Scores above 0.600 (substantial overlap) are in bold. 34
Table 6. Results of one-way ANOSIM examining differences among species for each
sampling date. Pairwise comparisons with significant (p-value < 0.05) differences in diet are bold. NS indicates that the global R statistic was not significant (p-value > 0.05). 36
Table 7. Axis correlation scores for each of the dominant food resources (>10% in
diets) in the non-metric multi-dimensional scaling analysis illustrated in Figure 4. Axis 1 corresponds to the x-axis and Axis 2 corresponds to the y-axis in Figure 4. 37
Table 8. Inter-annual differences in the proportion of each of the dominant food
resources (>10% in diets) in the diets of bluehead sucker (BHS), flannelmouth sucker (FMS), speckled dace (SPD) and fathead minnow (FHM) during the monsoon season (July – September) (one-way ANOVAs). Bold values indicate significant p-values (<0.05). Non-significant ANOVAs (p-value > 0.05) are not shown. 41

vii
Table 9. Correlations of the metric of turbidity (MT, the number of observations in the 30 days prior to sampling when silt concentrations were higher than 316 mg/l, and when GPP (gross primary production) = 0) with proportions of dominant items in bluehead sucker (BHS), flannelmouth sucker (FMS), speckled dace (SPD), and fathead minnow (FHM) diets. Bold values indicate significant relationships (p-value < 0.05). N/A indicates that data was not available for the analysis. 46
Table 10. Differences between mainstem and backwater habitats in the diets of
bluehead sucker (BHS), flannelmouth sucker (FMS), speckled dace (SPD), and fathead minnow (FHM) (One-way ANOSIMs for each species and for each sampling date). N/A indicates sampling dates and species for which samples from both habitats were not available. Bold values indicate significant results (p-value < 0.05). 47
Table 11. Schoener’s similarity matrix for all species-species combinations for each
sampling date and in mainstem (MS) and backwater (BW) habitats. Scores are calculated from the mean proportion of each diet item. Scores above 0.600 (substantial overlap) are in bold, and scores below 0.400 (substantial differences) are italicized. 49
Table 12. Differences in diet overlap patterns in mainstem (MS) and backwater
(BW) habitats for each sampling date (one-way ANOSIM). Species are bluehead sucker (BHS), flannelmouth sucker (FMS), fathead minnow (FHM), and speckled dace (SPD). Bold values indicate comparisons with significant diet differences (p-value < 0.05). N/A indicates an incomplete sample set. 50
Table 13. Correlations of total length and percent diet for each dominant food
resource (> 10 % in diet) and each species: bluehead sucker (BHS), flannelmouth sucker (FMS), speckled dace (SPD), and fathead minnow (FHM). Bold values indicate significant relationships (p-value < 0.05). 55

viii
LIST OF FIGURES
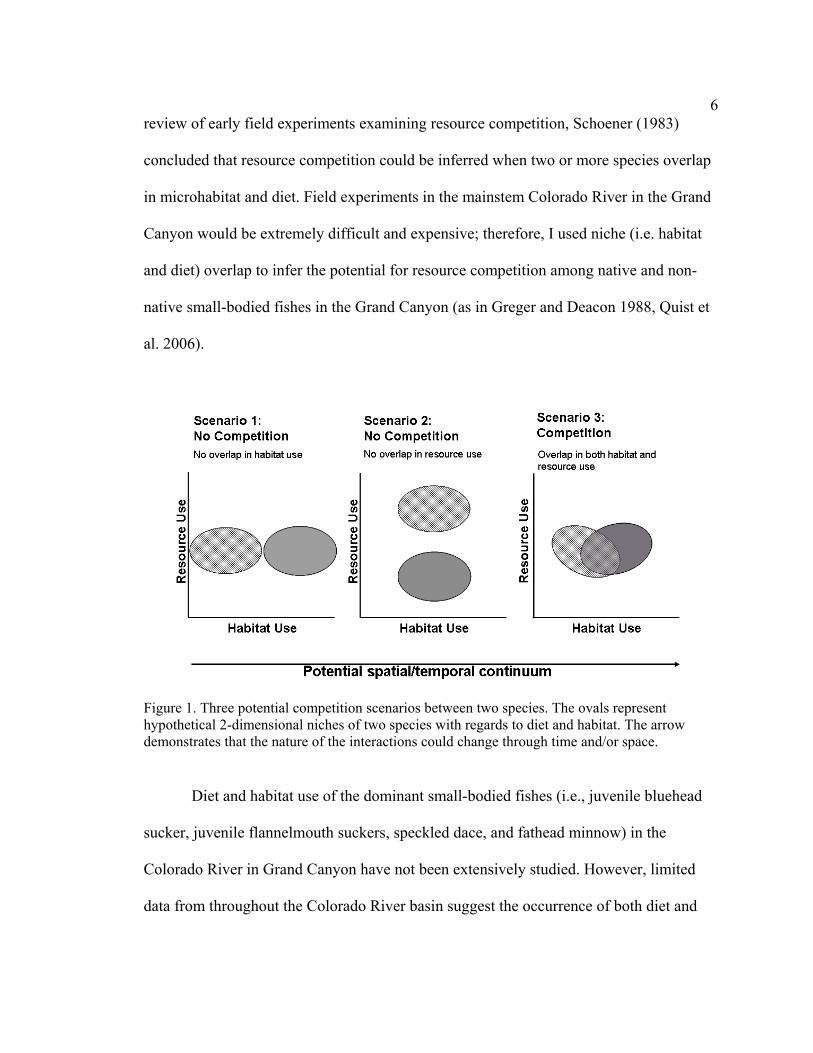
Figure 1. Three potential competition scenarios between two species. The ovals represent hypothetical 2-dimensional niches of two species with regards to diet and habitat. The arrow demonstrates that the nature of the interactions could change through time and/or space. 6
Figure 2. The Colorado River and its tributaries through Grand Canyon, Arizona.
Six sites were sampled (circles), 62, 127, 167, and 225 miles downstream from Glen Canyon Dam. 15
Figure 3. Seasonal variability in the diet composition of the four dominant small-
bodied fish species: (A) juvenile bluehead sucker (n=29), (B) juvenile flannelmouth sucker (n=89), (C) speckled dace (n=134), and (D) fathead minnow (n=118). Values are averages across four sites for each sampling date. 28
Figure 4. Seasonal changes in diet overlap among species. Non-metric
multidimensional scaling based on proportional diet composition of all species: juvenile bluehead suckers (BHS; circles), speckled dace (SPD; squares), juvenile flannelmouth suckers (FMS; diamonds), and fathead minnow (FHM; triangles) in all habitats for each sampling date (A) September 2006 (stress = 0.14), (B) April 2007 (stress = 0.12), (C) July 2007 (stress = 0.10), (D) September 2007 (stress = 0.14), (E) January 2008 (stress = 0.11), and (F) September 2008 (stress = 0.11). Ovals encompass >80% of specimens of each species for which there were significant differences in diet (ANOSIM p-value < 0.05; ANOSIM results in Table 6). 35
Figure 5. Inter-annual variability and effects of dam releases on fish diets during
the monsoon season. Dam operations in September 2008 were constrained and there were no daily fluctuations in discharge. (A) juvenile bluehead sucker (n=48), (B) juvenile flannelmouth sucker (n=64), (C) speckled dace (n=94), and (D) fathead minnow (n=88). Values are averages across four sites for each sampling date. 43

ix
Figure 6. (A) Mean (+ 1 standard deviation) and (B) maximum silt concentrations in the 30 days prior to sampling for all sampling dates. Mean concentrations were compared using a one-way ANOVA with Tukey’s post-hoc test (df = 5, F = 2140.6, p < 0.001). 45
Figure 7. Variability of diets between backwater (BW) and mainstem (MS) habitats
for (A) juvenile bluehead suckers, (B) juvenile flannelmouth suckers, (C) speckled dace, and (D) fathead minnows. No data (n.d.) represents sampling periods where data were not collected in mainstem and/or backwater habitats. Values are averaged across four sites for each sampling date. 48
Figure 8. Non-metric multidimensional scaling (NMDS) illustrating variability
between habitats (solid shapes are mainstem habitats; open shapes are backwater habitats) in (A) juvenile bluehead sucker diets (stress = 0.08), (B) juvenile flannelmouth sucker diets (stress = 0.13), (C) speckled dace diets (stress = 0.17), and (D) fathead minnow diets (stress = 0.12) in 6 sampling periods (NMDS). 49

x
ABSTRACT
Introductions of non-native fishes are threatening native fish communities in
streams and rivers across the United States. The Colorado River especially has
experienced numerous species invasions, and native fish populations throughout the basin
are in decline. The native fish community in the Grand Canyon has been particularly
affected, with half of the native fishes extirpated from the canyon. Many scientists blame
interactions with non-native fishes for these declines. However, to date no one has
conducted a thorough diet analysis of small-bodied fishes in the system to assess overlap
between native and non-native fish diets. I analyzed the diets of native juvenile bluehead
sucker, juvenile flannelmouth sucker, speckled dace, and non-native fathead minnow in
multiple seasons and years. Small-bodied fishes in the Grand Canyon consumed a variety
of resources, including diatoms, amorphous detritus, terrestrial vegetation, aquatic
invertebrates, and terrestrial invertebrates. Diet composition depended on season, and
was especially affected by turbidity during flood events. Generally, small-bodied fishes
consumed more allochthonous carbon (e.g. amorphous detritus and terrestrial vegetation)
during the monsoon season when tributaries were flooding and mainstem turbidity was
high. Regardless of seasonal variability in diet, the juveniles of native suckers exhibited
extensive diet overlap with non-native fathead minnows, but speckled dace diets did not
overlap with fathead minnow diets. I therefore infer a potential for competition among
fathead minnows and the juveniles of bluehead and flannelmouth suckers.

1
CHAPTER ONE
INTRODUCTION
Streams and rivers world-wide are experiencing unprecedented rates of invasion
by non-native species. Globally, 1,354 international introductions of exotic fishes had
occurred by 1990, and this number excludes the numerous translocations of species
among river basins within a country’s borders (Welcomme 1988). In the United States,
over 530 fish species have been introduced (Tyus and Saunders 2000), and the majority
of 125 important watersheds have experienced at least one fish invasion (Gido and
Brown 1999). The mechanisms of fish introductions and invasions are varied, but include
intentional introductions to establish sport fisheries, to support fish culture, and as
biological control agents (Allan and Flecker 1993). Unintentional introductions also
contribute to fish invasions via release or escape from aquariums or as “hitchhikers” in
ballast water of ships, in shipments of other fish species, or in bait buckets (Allan and
Flecker 1993).
Non-native species have been implicated in the wide-spread decline of native
fishes in rivers and streams across the United States (Allan and Flecker 1993). Non-
native fishes may interact with native fishes in many ways. Examples of non-native fishes
reducing native fish populations via predation and competition are often cited. There is
also evidence that hybridization with non-native fishes can degrade the genetic integrity
of native fish populations (Allan and Flecker 1993, Tyus and Saunders 2000). Habitat
2
degradation and the spread of diseases and parasites are additional mechanisms by which
non-native fishes can damage native fish populations (Welcomme 1988, Allan and
Flecker 1993).
Although most river basins are exposed to non-native fish introductions, the
number of successful invasions varies greatly among rivers. In the United States,
southwestern rivers are among the most heavily impacted by non-native fishes (Gido and
Brown 1999). For example, over 100 fishes have been introduced to the Colorado River
basin, at least half of which are now well established in the basin (Rinne and Janisch
1995, Tyus and Saunders 2000, Olden and Poff 2005). The dominance of non-native
fishes in the Colorado River is especially striking in the Grand Canyon, where non-native
species diversity is much larger than the diversity of remaining native species. Non-
native trout were stocked in the Colorado River in Glen Canyon just above the Grand
Canyon as game fish in the 1920s, and a successful trout fishery was established in the
cold tailwaters of Glen Canyon Dam after its completion in 1963 (Minckley et al. 2003).
Both rainbow (Oncorhynchus mykiss) and brown trout (Salmo trutta) contribute to this
fishery. Common carp (Cyprinus carpio), channel catfish (Ictalurus punctatus), yellow
bullhead (Ictalurus melas), fathead minnow (Pimephales promelas), plains killifish
(Fundulus zebrinus), and red shiner (Cyprinella lutrensis) also occur commonly
throughout the Grand Canyon (Tyus and Saunders 2000, Valdez et al. 2001, Minckley et
al. 2003).
The extensive non-native fish assemblage in the Colorado River has been blamed
for the dramatic declines of the native fish community (Minckley 1991, Tyus and

3
Saunders 2000). Historically, the native fish assemblage in the Grand Canyon was
composed of eight species: Colorado squawfish (Ptychocheilus lucius), razorback sucker
(Xyrauchen texanus), roundtail chub (Gila robusta), bonytail chub (G. elegans),
humpback chub (G. cypha), flannelmouth sucker (Catostomus latipinnis), bluehead
sucker (C. discobolus), and speckled dace (Rhinichthys osculus) (Minckley et al. 2003).
Native species richness has declined by half, with only flannelmouth sucker, bluehead
sucker, speckled dace, and the federally endangered humpback chub currently residing in
the Grand Canyon.
Non-native fishes in the Grand Canyon may affect native fish populations through
predation and competition for resources or spawning sites. The effects of large-bodied
exotic species in the Grand Canyon (e.g. rainbow and brown trout, catfish) apparently
include substantial effects of predation (Tyus and Saunders 2000). However, the small-
bodied exotic fishes in this system (e.g., fathead minnows, red shiners, plains killifish)
may compete with or prey upon both native small-bodied fishes (speckled dace) and the
larvae or juveniles of large-bodied native fishes (humpback chub, flannelmouth sucker,
and bluehead sucker). These small-bodied exotic fishes were unintentionally introduced
via bait buckets, and may pose a serious threat to native species due to their aggressive
behavior, such as chasing and physical threats, and via resource competition (Karp and
Tyus 1990, Tyus and Saunders 2000). Fathead minnows, for example, are highly
territorial and have been known to physically attack sucker larvae (Tyus and Saunders
2000). In addition, fathead minnows are the most abundant of the exotic small-bodied
fishes in the system (Baxter et al. unpublished data, Gloss and Coggins 2005). Although

4
alternatives could be imagined, it is most plausible that serious resource competition is
most likely when native and non-native species inhabit the same locations. For example,
backwater habitats and other potentially important nurseries for native fishes may create
spaces for fierce resource competition with abundant fathead minnows and red shiners
(Holden and Stalnaker 1975, Rees et al. 2005).
Although competition with non-native fishes has been widely implicated in the
decline of native fishes in the Grand Canyon, competition has not been adequately
studied in small-bodied fishes (Tyus and Saunders 2000). Trophic interactions of native
and non-native fishes must be understood to assess the extent of resource competition
between native and non-natives fishes. The niche concept is a useful construct in
assessing these trophic interactions. The extent to which a species uses food resources
and various habitats shapes its ecological niche. Grinnell (1917) first used the niche
concept to describe the requirements of a species that limit its distribution. In 1927, Elton
described a species’ niche as its overall role in the ecological community, with special
emphasis on trophic interactions. Hutchinson (1957) solidified the definition of a niche as
an N-dimensional hypervolume, composed of both physical and biological factors. My
discussion of ecological niches will reflect the Hutchinsonian niche concept.
The niche concept can be used to evaluate resource competition among species.
For example, the complete range of biotic and abiotic environmental factors within which
a species can survive in the absence of competition is its fundamental niche (Hutchinson
1957). Interspecific resource competition is only possible if three conditions are met: 1)
two or more species share fundamental niches to some degree; 2) the shared resources are

5
limited; and 3) all species involved are negatively affected by sharing the limited
resource (Crombie 1947, Angermeier 1982). When faced with interspecific resource
competition, species’ niches are often constricted. These constricted niches are called
realized niches (Hutchinson 1957). By partitioning shared resources into smaller realized
niches that do not greatly overlap, competing species can coexist. The degree of niche
restriction varies, and depends on the strength of competition. The degree of competition
is affected by the amount of overlap among species’ fundamental niches, the degree of
resource limitation, and the competitive ability of each species involved. In extreme
cases, a dominant competitor may drive the weaker competitor to local extinction, called
“competitive exclusion” (Hutchinson 1957).
From these ideas of niche overlap and resource competition, I developed a
diagram to illustrate the potential interactions of two species using habitat and diet as the
dimensions of a two dimensional niche-space (Figure 1). In scenarios 1 and 2, resource
competition is not possible because only one dimension of the species niches overlap. In
scenario 1, the two species overlap in diet, but not habitat. Scenario 2 illustrates the
reverse scenario, where two species’ habitat overlaps, but their diets do not. Scenario 3
depicts two species experiencing resource competition; in this scenario the two species
overlap in the two dimensions measured, diet and habitat.
Directly measuring the extent of competition involves a series of pair-wise
exclusion or introduction experiments manipulating the abundances of the species of
interest (Schoener 1983). Because these experiments can be logistically difficult in many
systems, ecologists have sought metrics from which they can infer competition. In his
6
review of early field experiments examining resource competition, Schoener (1983)
concluded that resource competition could be inferred when two or more species overlap
in microhabitat and diet. Field experiments in the mainstem Colorado River in the Grand
Canyon would be extremely difficult and expensive; therefore, I used niche (i.e. habitat
and diet) overlap to infer the potential for resource competition among native and non-
native small-bodied fishes in the Grand Canyon (as in Greger and Deacon 1988, Quist et
al. 2006).
Figure 1. Three potential competition scenarios between two species. The ovals represent hypothetical 2-dimensional niches of two species with regards to diet and habitat. The arrow demonstrates that the nature of the interactions could change through time and/or space.
Diet and habitat use of the dominant small-bodied fishes (i.e., juvenile bluehead
sucker, juvenile flannelmouth suckers, speckled dace, and fathead minnow) in the
Colorado River in Grand Canyon have not been extensively studied. However, limited
data from throughout the Colorado River basin suggest the occurrence of both diet and

7
habitat overlap among the species commonly found in the lower Colorado River (Muth
and Snyder 1995, Childs et al. 1998, Gido and Propst 1999, Bezzerides and Bestgen
2002, Rees et al. 2005, Ptacek et al. 2005, Gido et al. 2006). Habitat use among juvenile
bluehead and flannelmouth suckers, speckled dace, and fathead minnow overlaps greatly;
most of these small-bodied fishes prefer slow and shallow backwaters and mainstem
near-shore habitats. However, speckled dace often occupied habitats with higher
velocities (Childs et al. 1998, Gido and Propst 1999, Bezzerides and Bestgen 2002, Gido
et al. 2006). Shallow backwaters provide protection from piscivorous fish and from fast
moving water (Childs et al. 1998, Converse et al. 1998, Gido and Propst 1998, Valdez et
al. 2001, Ward et al. 2002, Ralsten et al. 2007). Behavioral studies suggest that larvae of
sucker species actively seek out backwater habitats (Bezzerides and Bestgen 2002, Rees
et al. 2005, Ptacek et al. 2005). In addition, backwaters may provide warm water
temperatures for improved larval and juvenile fish development (Clarkson and Childs
2000, Tyus and Saunders 2000). These studies and the co-occurrence of larval and
juvenile flannelmouth and bluehead suckers, speckled dace and fathead minnows in the
Grand Canyon (personal observation, Ralsten et al. 2007) indicate that these fishes
overlap in habitat use.
These studies also provide some descriptions of the diet preferences of small-
bodied fishes found in the lower Colorado River basin. Larval and juvenile native fishes
(flannelmouth sucker, bluehead sucker, humpback chub, speckled dace) in the Little
Colorado River consume larval chironomids. Sucker species consume large amounts of
unidentifiable organic matter, and diatoms make up a small relative volume of sucker

8
diets (<1%) (Childs et al. 1998). In the San Juan River, stable isotope analysis
demonstrated that juvenile flannelmouth and bluehead sucker, speckled dace, and fathead
minnow are at least partially invertivorous (Gido et al. 2006). Fathead minnows and
bluehead suckers are considered herbivores/detritivores and speckled dace are considered
invertivorous (Muth and Snyder 1995, Gido et al. 2006). Similarly, in backwater
environments in the Green River, larval and juvenile flannelmouth and bluehead suckers
consume diatoms, zooplankton, dipteran larvae and organic debris (Muth and Snyder
1995, Rees et al. 2005, Ptacek et al. 2005).
The habitat and food resources of fishes in the Grand Canyon are spatially
variable (Minckley 1991, Blinn and Cole 1991, Ralsten et al. 2007). For example,
temperature and water clarity are variable along the length of the river. The tailwaters of
Glen Canyon Dam are relatively clear and cold but the Colorado River warms slightly
and becomes progressively turbid downstream with inputs of more tributaries. This is
especially prominent downstream of the two largest tributaries, the Little Colorado River
and the Paria River (Figure 2). As a result, algal production is much lower downstream of
these tributaries (Hall et al. unpublished data). Tributaries also deliver allochthonous
carbon to the Colorado River and these resources are available to fishes for consumption
(Kennedy et al. unpublished data). The invertebrate community in the Grand Canyon also
changes longitudinally downstream of the dam. The tailwater invertebrate community is
dominated by non-native gammarus, New Zealand mudsnail, and chironomid species,
most of which are likely non-native (Kennedy and Gloss 2005). However, gammarus and
New Zealand mudsnails become rarer downstream, and chironomids and simuliids

9
dominate the downstream invertebrate community (Kennedy and Gloss 2005). In
addition to changes in the invertebrate community, invertebrate abundance and biomass
also decline with distance downstream from the dam (Kennedy and Gloss 2005).
The Colorado River is also laterally variable, with habitat patches created by
differences in physical properties such as water depth and velocity, substrate type, and
shoreline habitat. Historically, lateral heterogeneity was likely greater, because
backwaters were more prevalent in the Grand Canyon prior to the construction of Glen
Canyon Dam in 1963 (Converse et al. 1998). Backwaters are generally considered ideal
habitat for small-bodied fishes. Small fish can take refuge from fast currents, cold
temperatures, and large aquatic predators in backwater habitats (Goeking et al. 2003,
Brouder et al. 1999). The operation of the dam has changed the stability of the
backwaters currently present in the Grand Canyon (Brouder et al. 1999). The discharge
from the dam fluctuates on a daily basis to meet daily changes in power demand, and
these frequent changes in discharge result in short retention times of water in backwaters
(Behn et al. 2010). The short retention time results in backwaters that do not resemble
backwaters in less regulated systems (i.e. warmer, relatively stagnant water, higher
phytoplankton and zooplankton densities, etc.) (Behn et al. 2010). Despite these changes
to backwaters in the Grand Canyon, there is a perceived paradigm among researchers and
managers that backwaters are critically important habitats for juvenile native fishes in the
Grand Canyon (Brouder et al. 1999, Behn et al. 2010), but this paradigm has not been
tested.

10
The longitudinal variation in turbidity is accentuated seasonally when flooding
tributaries carry more sediment and organic matter into the mainstem Colorado River
(Blinn and Cole, 1991). During the monsoon season (July 15 – September 30), tributaries
deliver up to 500,000 metric tons of particulate organic matter to the mainstem (Kennedy
et al. unpublished data), which may be an important food resource for fishes. This
seasonal heterogeneity was likely greater prior to construction of Glen Canyon Dam
(Andrews 1991, Lovich and Melis 2007). Before the dam was completed, the Colorado
River in the Grand Canyon was punctuated by extreme variability in seasonal discharge,
turbidity and temperature (Blinn and Cole 1991, Stevens et al. 1997). Now, Glen Canyon
Dam retains the majority of suspended sediment and organic matter from upstream and
releases uniformly clear and cold water from Lake Powell (Lovich and Melis 2007).
The Colorado River also exhibits less inter-annual heterogeneity than was likely
historical and the sources of this heterogeneity have likely changed. Historically, the
main sources of inter-annual heterogeneity were variation in spring snow-melt in the
headwaters and the strength of monsoon season storms in late summer and early fall
(White et al. 2005). However, the Glen Canyon Dam dampens the effects of spring snow-
melt and to a lesser extent, monsoon flooding (Lovich and Melis 2007). Human activities
now also contribute to inter-annual variability in habitat conditions in the river. The role
of human activities is especially large in the Colorado River due to the predominance of
dams in the riverscape (Minckley 1991, Graf 1999). The Glen Canyon Dam, just
upstream of the Grand Canyon, is one of more than 117 major dams with impoundments
greater than one million cubic meters on the Colorado River (Minckley 1991). These

11
dams are operated to meet regional power demand and to maintain reservoirs that also
meet regional demands for freshwater (Andrews 1991, Minckley 1991). Due to changes
in power or water demand, average annual downstream discharge can change
substantially. In addition, experimental flow treatments are used as an ecological
management tool to improve downstream riverine habitat (Lovich and Melis 2007,
Ralsten 2007, Coggins 2008). Examples of experimental flow treatments include the
unrestricted release of water, simulating seasonal flooding, and periods of constant daily
discharge, simulating normal river conditions in contrast to the daily fluctuations in
discharge in normal dam operations (Lovich and Melis 2007, Ralsten 2007, Coggins
2008,). One such experimental “steady flow” regime was implemented September –
October 2008 and this paper discusses the effect of this steady flow treatment on small-
bodied fish diets.
Objectives and hypotheses
My goal was to describe the diets and niche overlap of the dominant small-bodied
fishes: native juvenile flannelmouth and bluehead suckers (FMS and BHS, respectively),
speckled dace (SPD), and non-native fathead minnows (FHM) and to infer potential
resource competition among native and non-native fishes in the Grand Canyon. I defined
“small-bodied” as smaller than 150 mm total length. This included all life stages of
fathead minnow and speckled dace, and juveniles of flannelmouth and bluehead suckers.
I examined the extent of diet overlap of these species via gut content analysis to evaluate
the possibility that resource competition with non-natives is responsible, in part, for
native species declines. I also assessed the importance of seasonal and spatial

12
heterogeneity in river conditions to small-bodied fish diets by comparing fish diets from
four seasons and from backwater and mainstem habitats. In September and October
2008, Glen Canyon Dam operators implemented an experimental flow regime in which
daily discharge was held constant (i.e. there were no fluctuations in discharge). Thus, to
address the consequences of this management action on small-bodied fish diets, I
compared small-bodied fish diets from three monsoon seasons (2006, 2007, and 2008).
Study questions
In considering these objectives, I addressed the following research questions: 1)
What are the diets of the dominant native and non-native small-bodied fishes in the
Colorado River, Grand Canyon? 2) How does diet composition vary with habitat
(backwater versus maistem) or season (spring, summer, autumn, winter)? 3) Do the diets
of the dominant small-bodied fishes overlap? 4) Does the extent of diet overlap vary with
habitat (backwater versus mainstem) or season? 5) Do dam operations (i.e. steady flow
treatment) in the monsoon season affect diet composition and overlap among the
dominant small-bodied fishes?
Based on these questions, I predicted that all small-bodied fishes would utilize
most types of resources available to them in the system, e.g. aquatic invertebrates,
especially Simulium arcticum, Gammarus lacustris, and chironomid spp., diatoms, plant
debris, amorphous detritus, and terrestrial invertebrates, but that speckled dace would be
the most invertivorous because of their feeding strategy and preferred habitat (Childs et
al. 1998, Gido and Propst, 1999, Gido et al. 2006). I also predicted that organic debris,
such as plant material and amorphous detritus, would be more available in backwater

13
habitats than mainstem habitats due to lower water velocity and higher deposition rates,
as described in Behn et al. (2010). Therefore, I predicted that the diets of small-bodied
fishes caught in these habitats would reflect this difference in resource availability.
Resource availability in the Colorado River changes seasonally, most notably in the
monsoon season (July 15-September 30) when tributaries flood and deliver large amounts
of allochthonous carbon to the mainstem. Therefore, I predicted that the diets of small-
bodied fishes would reflect seasonal changes in resource availability. During turbid
conditions, I predicted that juvenile suckers and fathead minnows would consume fewer
diatoms and rely more heavily on allochthonous material, such as plant debris and
potentially amorphous detritus. Conversely, I predicted that, because they are likely
primarily invertivorous, speckled dace diets would not be affected by temporal variation
in allochthonous resources.
I also predicted that the shift toward allochthonous material in juvenile sucker and
fathead minnow diets would be exaggerated in strong monsoon years (i.e. higher tributary
discharge and higher mainstem turbidity). Experimental low steady flows in the summer
of 2000 reduced drift and resulted in higher chironomid densities in upstream reaches of
the Grand Canyon (Rogers 2003). Based on this limited evidence, I predicted that the
benthic-feeding juvenile suckers, fathead minnows, and to a lesser extent speckled dace,
would consume more chironomids in periods of steady flows than in periods of
fluctuating flow.
A conceptual diagram (Figure 1) outlines three potential scenarios for niche
overlap between two species. Given the existing literature, I hypothesized that scenario 3

14
would best describe the interactions of fathead minnows with juvenile suckers. Because
speckled dace are likely more invertivorous than juvenile suckers and fathead minnows
(Childs et al. 1998, Gido et al. 2006), I hypothesized that scenario 2 (Figure 1) would best
describe the interactions of speckled dace with fathead minnows and juvenile suckers. In
addition, I hypothesized that the extent of interspecific competition would be more
intense (greater diet overlap) in turbid conditions (i.e., during the monsoon season) due to
low rates of primary production and limited resource availability. However, the reverse
may also occur where allochthonous carbon from tributaries results in higher resource
availability and diversity and decreases diet overlap among small-bodied fishes. I also
predicted that all four taxa would utilize backwaters similarly based on studies in other
parts of the Colorado River basin (Gido and Propst 1999), and thus the extent of overlap
would not be affected by habitat.
15
CHAPTER TWO
METHODS
Study sites and sample collection
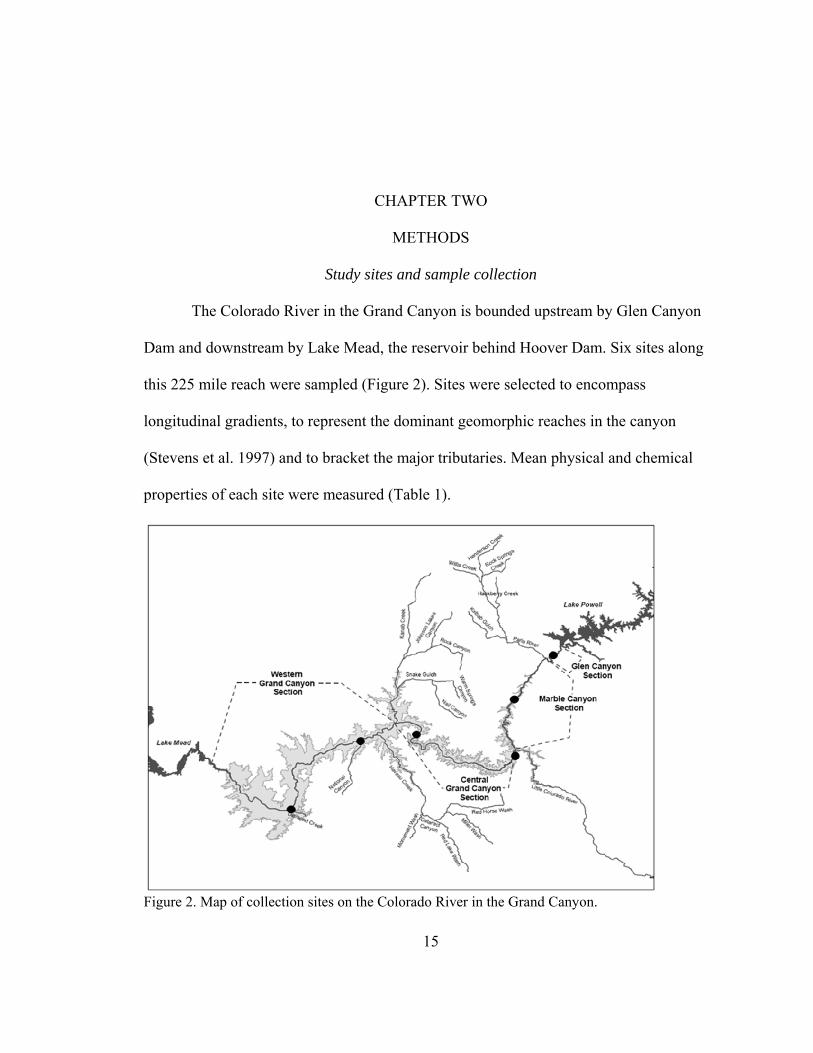
The Colorado River in the Grand Canyon is bounded upstream by Glen Canyon
Dam and downstream by Lake Mead, the reservoir behind Hoover Dam. Six sites along
this 225 mile reach were sampled (Figure 2). Sites were selected to encompass
longitudinal gradients, to represent the dominant geomorphic reaches in the canyon
(Stevens et al. 1997) and to bracket the major tributaries. Mean physical and chemical
properties of each site were measured (Table 1).
Figure 2. Map of collection sites on the Colorado River in the Grand Canyon.

16
Table 1. Approximate mean site characteristics. Annual Discharge Catchment area
m3/s (SD) (million ha)RM 0 329.89 (53.61) 28.96 6.3 131.4RM 30 N/A N/A 6.3 77.1RM 62 > 346.68 (51.45)* > 63.67* 7.8 110.3
RM 127 > 346.68 (51.45)* > 63.67* 5.1 60.8RM 167 N/A 38.31 6.2 74.4RM 225 357.66 (48.90) 38.67 6.2 82.5
Site Depth (m) Width (m)
* site is located at RM 88. Annual discharge and catchment area were calculated using USGS Real-Time Water Data for Arizona. Annual discharge is calculated from the monthly mean discharges taken from July 2006 to May 2007. Catchment area is taken from the USGS station closest to the sites listed above.
Although six sites were sampled, the native small-bodied fishes (speckled dace
and juvenile flannelmouth and bluehead suckers) were absent from the two upper-most
sites (above RM 62). The same was true of fathead minnows, the dominant non-native
small-bodied fish. These patterns are likely attributable to lack of suitable spawning
habitat and to the high densities of piscivorous rainbow trout in the upper reaches of the
Grand Canyon (Gloss and Coggins 2005). Because the majority of samples were captured
downstream of the two major tributaries (Paria River and Little Colorado River), diet
variability caused by longitudinal gradients was likely dampened. In addition, sample
sizes from individual sites for each sample date were small (<10 individuals/species).
Thus, there was low statistical power to assess the effect of longitudinal gradients on
small-bodied fish diets. Therefore, I focused on seasonal and lateral (i.e. habitat)
variability and pooled samples from the four sites to increase the statistical power of this
analysis.
17
To evaluate seasonal variability in small-bodied fish diets, I collected samples in
four seasons (April 2007, July 2007, September 2007, and January 2008). To examine
inter-annual variability and the influence of a dam operational change, i.e., steady flows, I
collected samples from September 2006 and 2007, during typical diel fluctuations in dam
discharge and in September 2008 when dam operations were restricted to steady flows.
The importance of habitat to small-bodied fish diets was examined by collecting samples
from backwater and mainstem habitats at each site and for each sampling date.
Up to 10 individuals of each species were collected at each site through seining
and electroshocking. Backwater habitats and sandy near-shore habitats in the mainstem
were sampled during the day using seine nets. Other near-shore habitats in the mainstem
were sampled via electrshocking shortly after dark. Fish were handled according to the
USGS-Grand Canyon Monitoring and Research Center protocol. Fish were weighed and
measured for fork length (FL) and total length (TL), and whole specimens were preserved
in the field in 70% ethanol for later gut content analysis. I defined “small-bodied fish” as
any specimen smaller than 150 mm total length, regardless of life stage. Sample
collection was supervised by a collaborator (C.V. Baxter, Idaho State University IACUC
protocol number 6261007).
Study species
Although many species of small-bodied fish were collected in small numbers, this
analysis focuses on the species caught in consistently larger numbers. These include:
juvenile bluehead sucker, juvenile flannelmouth sucker, speckled dace, and fathead
minnow.

18
Bluehead sucker (BHS)
Bluehead sucker (Catostomus discobolus) is one of three endemic catostomids
historically found in the Grand Canyon. Both males and females generally reach sexual
maturity at lengths greater than 318 mm, but some reports indicate that sexual maturity
can be reached at slightly smaller sizes (Ptacek et al. 2005). Bluehead sucker spawn in
spring, but spawning activity may stretch into early summer. Spawning generally takes
place over clean gravel. Once developed, larvae drift downstream to low velocity habitats
such as backwaters. In the Upper Colorado River basin, young bluehead suckers grow to
about 50 mm in their first year, and are approximately 90 mm after their second year
(Ptacek et al. 2005).
Adult bluehead suckers are found in fast-flowing cobble areas and have a
pronounced stiff scraping disc in their lower jaw. They are benthic feeders and scrape
algae, associated invertebrates, and other organic matter off hard substrates (Ptacek et al.
2005). Larval and juvenile bluehead suckers generally inhabit areas of slower water
velocity and consume more invertebrates than do adults (Ptacek et al. 2005).
Flannelmouth sucker (FMS)
Flannelmouth sucker (Catostomus latipinnis) is the second of three endemic
catostomids historically found in the Grand Canyon. The third, razorback sucker
(Xyrauchen texanus), has been reported occasionally in the Grand Canyon, but is
generally considered extirpated from the canyon (Gloss and Coggins, 2005). On average,
adult flannelmouth suckers reach lengths of about 500 mm, and most mature
flannelmouth suckers caught in the Grand Canyon are between 400 and 650 mm (Rees et

19
al. 2005). Flannelmouth suckers generally spawn in the spring and early summer, but
there is some evidence of fall or even year round spawning in some tributaries in the
Grand Canyon (Rees et al. 2005). Spawning is thought to occur over cobble substrate in
tributaries near the confluence with the mainstem. Like larval bluehead suckers, larval
flannelmouth suckers drift and can even actively seek out areas of low velocity, such as
near-shore and backwater habitats.
Adult flannelmouth suckers inhabit areas of slower velocity than do adult
bluehead suckers, such as pools, slow moving rivers, and backwaters (Rees et al. 2005).
Flannelmouth suckers lack the cartilaginous ridges found in bluehead suckers, and adults
are benthic omnivores, consuming invertebrates, algae and detritus (Rees et al. 2005).
Larvae and juveniles are less benthic, but also consume mainly invertebrates and algae
(Rees et al. 2005).
Speckled dace (SPD)
Speckled dace (Rhinichthys osculus) is a small-bodied fish, native to the Western
United States (Moyle 1976, Lovich 2005). The species is highly adaptable and can
inhabit a wide range of habitats from intermittent streams to lake environments (Moyle
1976). Speckled Dace maximum length is approximately 100 mm and they generally
reach reproductive maturity at age 2 (Moyle 1976). Speckled dace spawn in spring and
summer over gravel substrate. Larvae and fry seek out warm, shallow environments in
the river’s margins (Moyle 1976).
Speckled dace are generally benthic foragers, consuming benthic invertebrates
found among rocky substrate, but they are also known to consume zooplankton and

20
terrestrial invertebrates on the surface. Their diets can change seasonally, and may
include large amounts of algae in certain locations and seasons (Moyle 1976).
Fathead minnow (FHM)
Fathead minnow (Pimephales promelas) is non-native to the Colorado River basin
and was likely introduced unintentionally via bait buckets (Tyus and Saunders 2000,
Gloss and Coggins 2005). It is a small-bodied fish, with maximum lengths of around 100
mm TL (Moyle 1976). Fathead minnows can survive in a wide range of environments
and are highly tolerant of poor water quality (Moyle 1976). Fathead minnows spawn in
the summer, are highly fecund and may spawn multiple times in one summer. Males are
territorial and establish nests under debris such as stones or branches (Moyle 1976).
Fathead minnows consume a wide range of food items, including diatoms,
filamentous algae, benthic invertebrates, zooplankton, and other organic matter, often
from the benthic environment (Moyle 1976). However, it is generally believed that they
will consume the most available food items, in any part of the water column (Moyle
1976).
Gut content analysis
Gut contents were analyzed using a modification of the methods described in
Rybczynski et al. (2008). I removed and examined the contents from the anterior portion
of the gut to the first U-bend of cyprinids (fathead minnow and speckled dace) and
juvenile catostomids (flannelmouth and bluehead suckers) because these families lack
true stomachs (Greger and Deacon 1988, Childs et al. 1998, Gido et al. 2006, and
Rybczynski et al. 2008). Gut contents were placed into a Petri dish and sorted into coarse

21
and fine fractions and examined using microscopy. The coarse fraction was composed of
macroscopic invertebrates and large pieces of plant material that were too large to place
on a slide; the fine fraction consisted primarily of diatoms, amorphous detritus, plant
material, and some invertebrate body parts. I spread the gut contents to an even depth and
obtained relative proportions of each food item in the coarse fraction and of the whole
fine fraction as percentages of the total area using a stereo microscope and image analysis
software (ImagePro Plus ® Media Cybernetics, Bethesda, Maryland and Leica
Application Suite © Leica Microsystems Ltd., Heerbrugg, Switzerland). The fine fraction
was filtered onto 0.45 μm grided Metricel® membrane filters (Pall Corp., Ann Arbor,
MI) and preserved on slides using immersion oil type B for further examination. Relative
proportions of each food category in the fine fraction were calculated based on relative
area measurements made using image analysis software (ImagePro Plus ® Media
Cybernetics, Bethesda, Maryland and Leica Application Suite © Leica Microsystems
Ltd., Heerbrugg, Switzerland) and a compound microscope at 100-400x magnification
depending on particle density on the slide.
Because many standard gut content analytic methods are based on mass or
volume rather than on area (Hellawell and Abel 1971, Hynes 1950) I also measured the
relative proportions by mass of all food categories in both the coarse and the fine fraction,
using ash-free dry mass (AFDM) in addition to using the area-based method described
above.
Of the 569 small-bodied fish diets that I analyzed, 290 were analyzed using both
area-based and mass-based methods to compare these methods and validate the area-
22
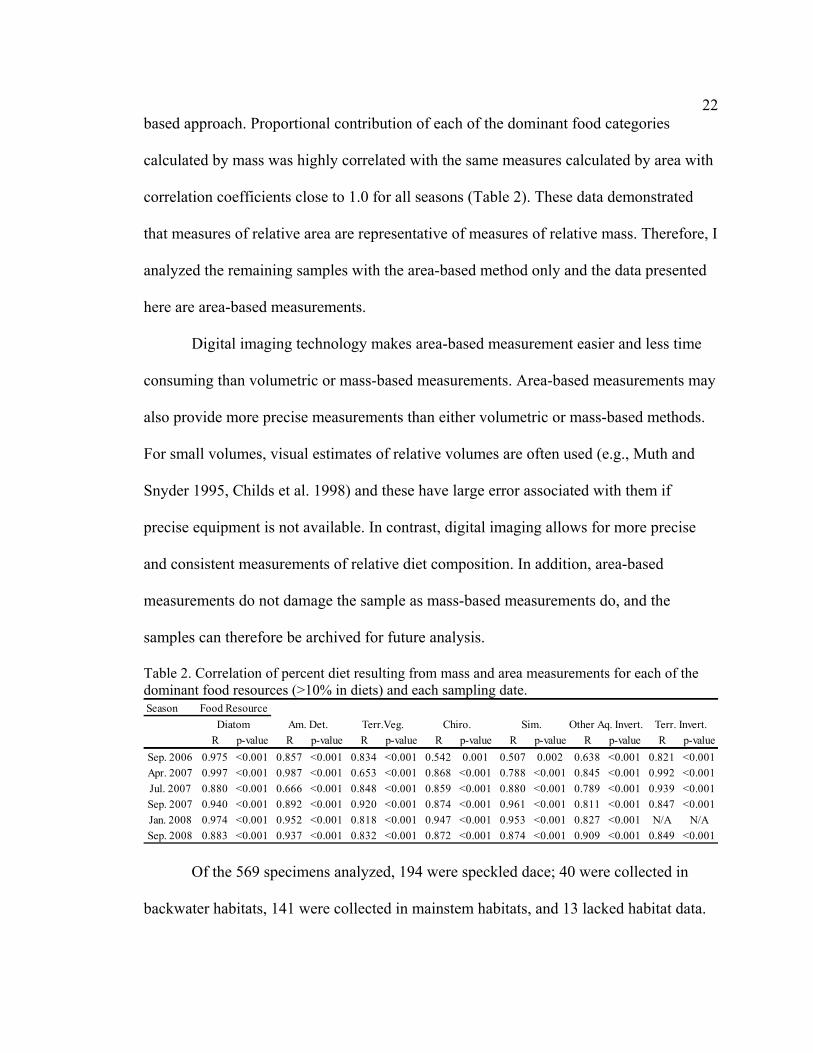
based approach. Proportional contribution of each of the dominant food categories
calculated by mass was highly correlated with the same measures calculated by area with
correlation coefficients close to 1.0 for all seasons (Table 2). These data demonstrated
that measures of relative area are representative of measures of relative mass. Therefore, I
analyzed the remaining samples with the area-based method only and the data presented
here are area-based measurements.
Digital imaging technology makes area-based measurement easier and less time
consuming than volumetric or mass-based measurements. Area-based measurements may
also provide more precise measurements than either volumetric or mass-based methods.
For small volumes, visual estimates of relative volumes are often used (e.g., Muth and
Snyder 1995, Childs et al. 1998) and these have large error associated with them if
precise equipment is not available. In contrast, digital imaging allows for more precise
and consistent measurements of relative diet composition. In addition, area-based
measurements do not damage the sample as mass-based measurements do, and the
samples can therefore be archived for future analysis.
Table 2. Correlation of percent diet resulting from mass and area measurements for each of the dominant food resources (>10% in diets) and each sampling date. Season
R p-value R p-value R p-value R p-value R p-value R p-value R p-valueSep. 2006 0.975 <0.001 0.857 <0.001 0.834 <0.001 0.542 0.001 0.507 0.002 0.638 <0.001 0.821 <0.001Apr. 2007 0.997 <0.001 0.987 <0.001 0.653 <0.001 0.868 <0.001 0.788 <0.001 0.845 <0.001 0.992 <0.001Jul. 2007 0.880 <0.001 0.666 <0.001 0.848 <0.001 0.859 <0.001 0.880 <0.001 0.789 <0.001 0.939 <0.001Sep. 2007 0.940 <0.001 0.892 <0.001 0.920 <0.001 0.874 <0.001 0.961 <0.001 0.811 <0.001 0.847 <0.001Jan. 2008 0.974 <0.001 0.952 <0.001 0.818 <0.001 0.947 <0.001 0.953 <0.001 0.827 <0.001 N/A N/ASep. 2008 0.883 <0.001 0.937 <0.001 0.832 <0.001 0.872 <0.001 0.874 <0.001 0.909 <0.001 0.849 <0.001
Food ResourceTerr. Invert.Diatom Am. Det. Terr.Veg. Chiro. Sim. Other Aq. Invert.
Of the 569 specimens analyzed, 194 were speckled dace; 40 were collected in
backwater habitats, 141 were collected in mainstem habitats, and 13 lacked habitat data.
23
These samples were not included in the habitat analyses. The total lengths of speckled
dace across all sampling dates ranged from 21 mm to 108 mm; length for 16 specimens
was not recorded. The mean TL of speckled dace specimens was greatest in September
2007, but September 2006 and 2008 mean lengths were not different from other sampling
dates. (1-way ANOVA; df = 5; F = 6.64; p-value < 0.001).
Sixty-two juvenile bluehead suckers were collected. Of these, 27 were from
backwater habitats and 34 were from mainstem habitats (one fish did not have its habitat
of origin recorded and was not included in the habitat analyses). For all sampling dates,
bluehead sucker TL ranged from 31 mm to 135 mm. Mean TL was significantly greater
in September 2007 than in January and September 2008 (1-way ANOVA; df = 4; F =
3.84; p-value = 0.008). Specimens collected in January had the smallest mean TL, but
this pattern was not statistically significant.
Of the specimens analyzed, 129 were juvenile flannelmouth suckers; 46 of these
were collected in backwater habitats, 71 were collected in mainstem habitats, and 12
lacked habitat data. These were not included in the habitat analyses. Total length of
flannelmouth suckers ranged from 29 mm to 148 mm across all sampling dates, but 13
specimens were lacking length data. Mean TL was greatest in September 2006 and July
2007, but only TL in September 2006 was significantly different (1-way ANOVA; df = 5;
F = 5.45; p-value <0.001).
I analyzed 184 were fathead minnows diets. Of these 127 were from mainstem
habitats, 47 were from backwater habitats and 10 lacked habitat data and were not
included in the habitat analyses. The range of TL for fathead minnows across all
24
sampling dates was 27 mm to 104 mm, with only one specimen missing length data.
Specimens collected in April and July 2007 had the longest mean TL, and these were
significantly different from the mean TL of specimens collected in September 2007,
which was the smallest mean TL (1-way ANOVA; df = 3; F = 3.70; p-value = 0.003).
This was the only significant difference.
Data analysis
I compared the relative contribution of each food resource to the diet of each fish
species among seasons (April 2007-January 2008) and among years (September 2006-
2008) using 1-way Analysis of Variance (ANOVA). All proportional data were arcsine-
square root transformed to meet the assumptions of ANOVA. I used a Tukey’s post-hoc
pairwise comparison test for all statistically significant ANOVAs (p-value < 0.05).
Turbidity
To examine the relationship between diet composition and turbidity, I used
acoustic sediment data from the USGS Grand Canyon Monitoring and Research Center
(http://www.gcmrc.gov/products/other_data/gcmrc.aspx). This data set was generated
from the Laser Acoustic Monitoring System that records suspended sediment
concentrations at 4 sites through the Grand Canyon every 15 minutes. My collection sites
corresponded to the locations of the four acoustic monitoring stations. Primary
production rates in the Colorado River in the Grand Canyon approach zero when
sediment concentrations are above approximately 316 mg/l (Hall et al. unpublished data).
The number of observations in the 30 days prior to sampling when silt concentrations
were higher than 316 mg/l, and when gross primary production (GPP ) = 0, provides a
25
metric of biologically-relevant turbidity levels. I refer to this metric as MT (metric of
turbidity). When MT is small, this corresponds to few observations of high turbidity and
presumably high rates of GPP. The opposite is true when MT is large. I conducted a
correlation analysis to test if there were associations between the percent of the diet of
each dominant food resource and MT. All univariate statistical analyses were performed
using the software package Systat® (v. 10.0) (SSI San Jose, California).
Diet overlap
The mean proportions of food categories in each species diet were calculated for
all sampling dates. Mean proportions were used to compare the degree of diet overlap
among species using Schoener’s similarity index (Schoener 1970). The proportion of
overlap is calculated with the following formula:
C=1-½(Σ|Px,i-Py,i|)
where Px,i and Py,i are the proportions of food category i in the diets of species x and
species y, respectively. Index values range from 0 (no overlap) to 1 (complete overlap).
Statistical analysis of Schoener’s index is not possible, but index values of greater than
0.6 or less than 0.4 are generally accepted as ecologically important (Wallace 1981,
Childs et al. 1998, Muth and Snyder 1995).
I also assessed patterns of diet overlap within and among species and season using
Bray-Curtis resemblance matrices of square-root-transformed proportional data and non-
metric multidimensional scaling (NMDS; PRIMER v6 © PRIMER-E Ltd., Plymouth,
United Kingdom). The plot generated by NMDS reflects a “best-fit” illustration of the
similarity matrix. The goodness of fit of the NMDS analysis to this similarity matrix is
26
reflected in the stress value. Stress values range from 0 to 1 and any value less than 0.15
generally indicates a good fit to the data. Statistical differences among species groups
(established a priori) in the NMDS analysis were identified using one-way analysis of
similarity (ANOSIM; PRIMER v6 © PRIMER-E Ltd., Plymouth, United Kingdom).
ANOSIM provides a test statistic R that ranges from -1 to 1 and is based on the rank
similarities of samples within a priori groups versus among a priori groups. The R
statistic is an indication of the similarity of samples within a group versus among groups.
A value of R = 0 indicates that the rank similarities are the same within and among
groups; that is, there is no difference in the degree of similarity of samples based on the
groupings. A value of R = 1 indicates that samples within groups are more similar to each
other than to samples in other groups. The significance of R is tested through a
permutation test randomly assigning samples to groups. The significance level is the
percentage (out of 1,000 permutations) of simulated values that are greater than the
observed R value; if only 5% of simulated values are greater than the observed value, the
significance level is 5% (Warwick et al. 1990). Both the value of R and the significance
level must be considered when interpreting ANOSIM results. Proportional diet data were
correlated with NMDS axes scores using Systat® (v. 10.0) (SSI San Jose, California).

27
CHAPTER THREE
RESULTS
Diet composition
The diets of juvenile bluehead and flannelmouth suckers, speckled dace, and
fathead minnows consisted mainly of diatoms, terrestrial vegetation, amorphous detritus,
aquatic insects (especially S. arcticum and chironomids, but including G. lacustris,
Trichopterans, Hemipterans, Coleopterans, and other Dipteran species), and, to a lesser
extent, various terrestrial invertebrates, including Hemipterans and Hymenopterans
(Figure 3).
Seasonal variability
Bluehead sucker
The diets of juvenile bluehead suckers contained mostly fine organic material,
including diatoms (3 – 71%), amorphous detritus (4 – 71%), and coarser material such as
chironomids (0 – 50%), simuliids (0 – 21%) and terrestrial vegetation (0 – 26%) (Figure
3A; Table 3). The diets of juvenile bluehead suckers changed only slightly with season.
The proportion of amorphous detritus in their diets was significantly larger in September
(16%) than in April (4%) (1-way ANOVA; df = 3; F = 3.9; p-value = 0.020; Table 3). No
other food resource in bluehead sucker diets exhibited significant differences among
seasons (1-way ANOVA; Table 4).

28
Per
cent
of D
iet
0
20
40
60
80
100 A
C
B
D
Sampling DateApril 0
7July 07
Sept. 07
Jan. 08
Sampling DateApril 0
7July 07
Sept. 07
Jan. 08
Perc
ent o
f Die
t
0
20
40
60
80
100
Diatom Amorph. Detrit. Fil. Algae Plant Mat.
Chir. Sim. Gamm. Other Aq. IV
Terr. Invert. Misc. Invert Fish
Figure 3. Seasonal variability in the diet composition of the four dominant small-bodied fish species: (A) juvenile bluehead sucker (n=29), (B) juvenile flannelmouth sucker (n=89), (C) speckled dace (n=134), and (D) fathead minnow (n=118). Values are averages across four sites for each sampling date.
29
Table 3: Mean diet composition by percent area with standard error for bluehead sucker (BHS), fathead minnow (FHM), flannelmouth sucker (FMS), and speckled dace (SPD). Date Diet Item
BHS FHM FMS SPD Sep. 2006 Diatom 3.21 N/A 29.35 (3.9) 13.91 (7.8) 5.40 (3.2)
Amorphous Detritus 71.14 N/A 33.32 (3.8) 34.20 (8.0) 18.76 (5.4) Macrophyte 0.00 N/A 4.31 (1.6) 0.00 (0.0) 2.09 (2.0) Filamentous Algae 0.00 N/A 0.00 (0.0) 0.00 (0.0) 0.00 (0.0) Terrestrial Vegetation 25.65 N/A 19.41 (2.2) 29.59 (5.9) 18.73 (4.1) Chironomid 0.00 N/A 4.55 (3.2) 15.36 (8.7) 15.61 (5.1) Simuliid 0.00 N/A 1.75 (1.0) 3.31 (2.6) 9.73 (4.3) Gammarus 0.00 N/A 0.00 (0.0) 0.00 (0.0) 0.29 (0.3) Other Aquatic Invertebrates 0.00 N/A 6.88 (3.3) 3.05 (1.6) 27.78 (5.9) Terrestrial Invertebrates 0.00 N/A 0.00 (0.0) 0.58 (0.3) 1.73 (1.6) Miscellaneous Invertebrates 0.00 N/A 0.57 (0.5) 0.00 (0.0) 0.00 (0.0)
Apr. 2007 Diatom 58.47 (23.4) 61.33 (6.4) 30.86 (6.4) 9.52 (4.0)
Amorphous Detritus 3.63 (1.6) 7.12 (1.2) 14.40 (4.1) 3.46 (1.9) Macrophyte 0.00 (0.0) 0.00 (0.0) 0.00 (0.0) 0.00 (0.0) Filamentous Algae 0.00 (0.0) 0.00 (0.0) 0.00 (0.0) 0.00 (0.0) Terrestrial Vegetation 0.29 (0.1) 4.42 (1.7) 6.59 (2.1) 2.28 (0.7) Chironomid 36.85 (23.5) 15.26 (4.7) 37.53 (8.0) 42.67 (6.4) Simuliid 0.04 (0.0) 2.15 (1.8) 3.28 (2.1) 23.35 (5.4) Gammarus 0.22 (0.2) 0.00 (0.0) 0.21 (0.1) 0.00 (0.0) Other Aquatic Invertebrates 0.49 (0.5) 6.58 (2.8) 1.48 (0.7) 15.43 (4.5) Terrestrial Invertebrates 0.00 (0.0) 2.07 (1.5) 4.33 (3.0) 3.29 (2.1) Miscellaneous Invertebrates 0.00 (0.0) 1.06 (1.1) 1.32 (0.8) 0.00 (0.0)
Jul. 2007 Diatom 43.72 (43.7) 55.45 (7.4) 17.59 (7.4) 13.86 (4.7)
Amorphous Detritus 3.92 (3.9) 9.84 (2.3) 12.11 (5.6) 3.49 (1.5) Macrophyte 0.00 (0.0) 1.00 (0.5) 0.22 (0.1) 0.15 (0.1) Filamentous Algae 0.00 (0.0) 0.45 (0.5) 0.00 (0.0) 0.00 (0.0) Terrestrial Vegetation 2.03 (2.0) 4.51 (1.0) 4.00 (0.9) 5.86 (2.4) Chironomid 50.33 (49.7) 16.43 (5.6) 43.67 (8.2) 35.06 (5.3) Simuliid 0.00 (0.0) 9.89 (4.4) 15.82 (4.8) 24.87 (4.3) Gammarus 0.00 (0.0) 0.00 (0.0) 1.70 (0.6) 0.00 (0.0) Other Aquatic Invertebrates 0.00 (0.0) 2.12 (1.0) 2.59 (1.3) 5.67 (2.6) Terrestrial Invertebrates 0.00 (0.0) 0.31 (0.3) 0.44 (0.3) 11.05 (4.2) Miscellaneous Invertebrates 0.00 (0.0) 0.00 (0.0) 1.84 (1.8) 0.00 (0.0)
Sep. 2007 Diatom 53.51 (8.7) 30.09 (6.6) 13.18 (4.0) 38.85 (5.6)
Amorphous Detritus 15.57 (2.1) 16.49 (3.2) 14.80 (3.2) 11.77 (2.5) Macrophyte 0.92 (0.6) 0.91 (0.9) 0.50 (0.3) 2.47 (1.3) Filamentous Algae 0.00 (0.0) 0.00 (0.0) 0.23 (0.2) 0.00 (0.0) Terrestrial Vegetation 16.47 (6.3) 12.63 (2.2) 21.25 (3.9) 14.66 (3.1) Chironomid 7.06 (3.6) 13.24 (4.4) 27.64 (4.8) 6.17 (3.2) Simuliid 2.58 (1.2) 16.32 (6.8) 11.19 (4.8) 14.79 (4.8) Gammarus 0.42 (0.4) 0.00 (0.0) 1.32 (0.8) 0.00 (0.0) Other Aquatic Invertebrates 2.86 (1.5) 9.21 (3.4) 6.90 (1.9) 6.92 (2.8) Terrestrial Invertebrates 0.61 (0.5) 1.10 (1.1) 2.99 (1.0) 4.37 (2.3) Miscellaneous Invertebrates 0.00 (0.0) 0.00 (0.0) 0.00 (0.0) 0.00 (0.0)
30
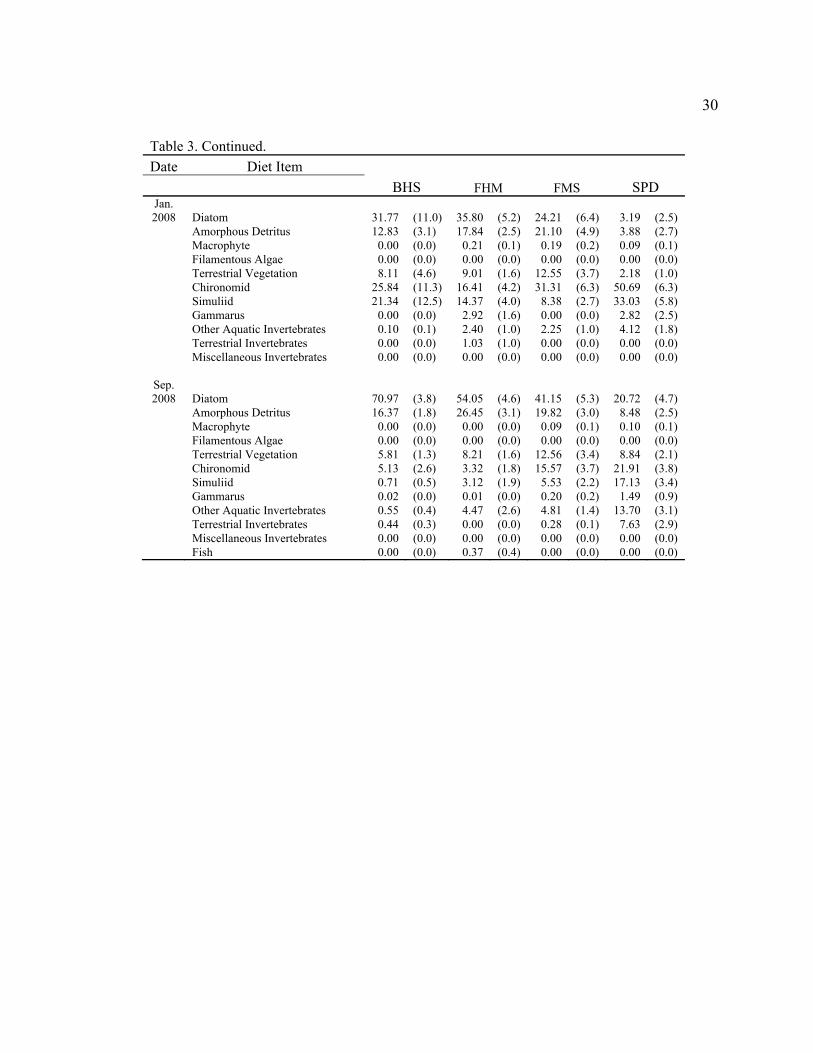
Table 3. Continued. Date Diet Item
BHS FHM FMS SPD Jan. 2008 Diatom 31.77 (11.0) 35.80 (5.2) 24.21 (6.4) 3.19 (2.5)
Amorphous Detritus 12.83 (3.1) 17.84 (2.5) 21.10 (4.9) 3.88 (2.7) Macrophyte 0.00 (0.0) 0.21 (0.1) 0.19 (0.2) 0.09 (0.1) Filamentous Algae 0.00 (0.0) 0.00 (0.0) 0.00 (0.0) 0.00 (0.0) Terrestrial Vegetation 8.11 (4.6) 9.01 (1.6) 12.55 (3.7) 2.18 (1.0) Chironomid 25.84 (11.3) 16.41 (4.2) 31.31 (6.3) 50.69 (6.3) Simuliid 21.34 (12.5) 14.37 (4.0) 8.38 (2.7) 33.03 (5.8) Gammarus 0.00 (0.0) 2.92 (1.6) 0.00 (0.0) 2.82 (2.5) Other Aquatic Invertebrates 0.10 (0.1) 2.40 (1.0) 2.25 (1.0) 4.12 (1.8) Terrestrial Invertebrates 0.00 (0.0) 1.03 (1.0) 0.00 (0.0) 0.00 (0.0) Miscellaneous Invertebrates 0.00 (0.0) 0.00 (0.0) 0.00 (0.0) 0.00 (0.0)
Sep. 2008 Diatom 70.97 (3.8) 54.05 (4.6) 41.15 (5.3) 20.72 (4.7)
Amorphous Detritus 16.37 (1.8) 26.45 (3.1) 19.82 (3.0) 8.48 (2.5) Macrophyte 0.00 (0.0) 0.00 (0.0) 0.09 (0.1) 0.10 (0.1) Filamentous Algae 0.00 (0.0) 0.00 (0.0) 0.00 (0.0) 0.00 (0.0) Terrestrial Vegetation 5.81 (1.3) 8.21 (1.6) 12.56 (3.4) 8.84 (2.1) Chironomid 5.13 (2.6) 3.32 (1.8) 15.57 (3.7) 21.91 (3.8) Simuliid 0.71 (0.5) 3.12 (1.9) 5.53 (2.2) 17.13 (3.4) Gammarus 0.02 (0.0) 0.01 (0.0) 0.20 (0.2) 1.49 (0.9) Other Aquatic Invertebrates 0.55 (0.4) 4.47 (2.6) 4.81 (1.4) 13.70 (3.1) Terrestrial Invertebrates 0.44 (0.3) 0.00 (0.0) 0.28 (0.1) 7.63 (2.9) Miscellaneous Invertebrates 0.00 (0.0) 0.00 (0.0) 0.00 (0.0) 0.00 (0.0)
Fish 0.00 (0.0) 0.37 (0.4) 0.00 (0.0) 0.00 (0.0)

31
Table 4: Seasonal differences in each of the dominant food resources (>10% in diets) in the diets of bluehead sucker (BHS), flannelmouth sucker (FMS), speckled dace (SPD) and fathead minnow (FHM) (One-way ANOVAs with Tukey’s pairwise comparisons). Significant values are bold (p-values <0.05). Non-significant (p-value > 0.05) ANOVA analyses are not shown.
Species Food Resource Date Apr-07 Jul-07 Sep-07 Jan-08 BHS Am. Detritus df: 3; F: 3.9; p: 0.020 Apr-07 1.000 Jul-07 0.998 1.000 Sep-07 0.040 0.119 1.000 Jan-08 0.324 0.434 0.616 1.000 FMS T. Veg. df: 3; F: 8.0; p: <0.001 Apr-07 1.000 Jul-07 0.999 1.000 Sep-07 <0.001 0.001 1.000 Jan-08 0.355 0.388 0.059 1.000 FMS Other Aq. Invert. df: 3; F: 3.8; p: 0.012 Apr-07 1.000 Jul-07 0.847 1.000 Sep-07 0.010 0.195 1.000 Jan-08 0.925 0.994 0.065 1.000 SPD Am. Detritus df: 3; F: 8.4; p: <0.001 Apr-07 1.000 Jul-07 0.986 1.000 Sep-07 <0.001 0.001 1.000 Jan-08 0.999 0.970 <0.001 1.000 SPD Diatom df: 3; F: 13.6; p: <0.001 Apr-07 1.000 Jul-07 0.857 1.000 Sep-07 <0.001 <0.001 1.000 Jan-08 0.736 0.281 <0.001 1.000 SPD T. Veg. df: 3; F: 10.3; p: <0.001 Apr-07 1.000 Jul-07 0.549 1.000 Sep-07 <0.001 0.003 1.000 Jan-08 0.984 0.368 <0.001 1.000 SPD Chironomid df: 3; F: 14.0; p: <0.001 Apr-07 1.000 Jul-07 0.719 1.000 Sep-07 <0.001 <0.001 1.000 Jan-08 0.650 0.131 <0.001 1.000 SPD Other Aq. Invert. df: 3; F: 3.1; p: 0.030 Apr-07 1.000 Jul-07 0.071 1.000 Sep-07 0.204 0.975 1.000 Jan-08 0.032 0.972 0.841 1.000 FHM Am. Detritus df: 3; F: 3.0; p: 0.034 Apr-07 1.000 Jul-07 0.824 1.000 Sep-07 0.192 0.686 1.000 Jan-08 0.031 0.340 0.980 1.000 FHM Diatom df: 3; F: 5.1; p: 0.002 Apr-07 1.000 Jul-07 0.952 1.000 Sep-07 0.013 0.072 1.000 Jan-08 0.017 0.118 0.938 1.000 FHM T. Veg. df: 3; F: 4.9; p: 0.003 Apr-07 1.000 Jul-07 0.930 1.000 Sep-07 0.004 0.032 1.000 Jan-08 0.100 0.433 0.360 1.000
32
Flannelmouth sucker
The diets of juvenile flannelmouth suckers contained fine organic material,
including diatoms (13 – 41%), amorphous detritus (12 – 34%), as well as substantial
amounts of terrestrial vegetation (4 – 30%) and aquatic insects, especially chironomids
(15 – 44%) (Figure 3B; Table 3). The diets of juvenile flannelmouth suckers varied
significantly among seasons. The proportion of terrestrial vegetation increased
significantly in September (21%) compared to April (7%) and July (18%) (1-way
ANOVA; df = 3; F = 8.0; p-value <0.001; Table 3). Aquatic invertebrates other than
chironomids and simuliids also made up a significantly larger portion of flannelmouth
sucker diets in September (7%) than in April (1%) (1-way ANOVA; df = 3; F = 3.8; p-
value = 0.012; Table 3).
Speckled dace
Speckled dace in this study were predominantly invertivorous (Figure 3C).
Aquatic insects, especially chironomids (6 – 51%) and simuliids (10 – 33%), dominated
their diets, but speckled dace also consumed smaller amounts of diatoms (3 – 39%),
amorphous detritus (3 – 19%) and terrestrial vegetation (2 – 19%). The diets of speckled
dace varied significantly among seasons, but did not follow the patterns observed in
juvenile sucker diets. Speckled dace consumed fewer chironomids in September (6%)
than in the April, July and January (43%, 35%, and 51%, respectively) (1-way ANOVA;
df = 3; F = 14.0; p-value <0.001; Table 3). In contrast, the proportion of diatoms in
speckled dace diets was significantly higher in September (39%) than in April, July, and
January (10%, 14%, and 3%, respectively) (1-way ANOVA; df = 3; F = 13.6; p-value <
0.001; Table 3). Similarly, proportions of amorphous detritus were higher in September

33
(12%) than in April July and January (3%, 3%, and 4%, respectively) (1-way ANOVA;
df = 3; F = 8.4; p-value <0.001; Table 3). The proportion of terrestrial vegetation in
speckled dace diets was also higher in September (15%) than in April, July and January
(2%, 6%, and 2%, respectively) (1-way ANOVA; df = 3; F = 10.3; p-value <0.001; Table
3).
Fathead minnow
Like juvenile bluehead suckers, fathead minnow diets were dominated by fine
materials such as diatoms (29 – 61%), amorphous detritus (7 – 33%) and terrestrial
vegetation (4 – 19%) (Figure 3D; Table 3). However, the proportion of fine materials in
the diets of fathead minnows varied significantly among season. Diatoms were found in
significantly higher proportions in April (61%) than in September (30%) and January
(36%) (1-way ANOVA; df = 3; F = 5.1; p-value = 0.002; Table 3). The proportion of
amorphous detritus in fathead minnow diets was significantly higher in January (18%)
than in April (7%) (1-way ANOVA; df = 3; F = 3.0; p-value = 0.034; Table 3) and the
proportion of terrestrial vegetation was significantly higher in September (13%) than in
April (4%) and July (5%) (1-way ANOVA; df = 3; F = 4.9; p-value = 0.003; Table 3).
The proportions of invertebrates in fathead minnow diets did not change significantly
with season and was always less than 40% of their diets (1-way ANOVA; Table 4).
Diet overlap
I assessed diet overlap using Schoener’s similarity index, and NMDS and
ANOSIM and both methods revealed substantial overlap among juvenile bluehead sucker
diets, flannelmouth sucker diets and fathead minnow diets. Speckled dace diets
overlapped less consistently with flannelmouth sucker and fathead minnow diets (Figure

34
4; Tables 5 and 6). The Schoener’s similarity index revealed that juvenile bluehead
sucker diets overlapped substantially (index > 0.6) with fathead minnow diets, except in
September 2006 (Table 5). Bluehead sucker diets overlapped with flannelmouth sucker
diets on all sampling dates except September 2007. Speckled dace diets did not typically
overlap with diets of bluehead sucker or fathead minnow, with the exception of overlap
in September 2007. In contrast, speckled dace diets overlapped with flannelmouth sucker
diets on all sampling dates except for January 2008. Flannelmouth sucker diets
overlapped with fathead minnow diets on all sampling dates (Table 5).
Table 5: Schoener’s similarity matrix for all species-species combinations for each sampling date. Scores are calculated from the mean proportion of each diet item. Scores above 0.600 (substantial overlap) are in bold.
Species SeasonBHS FMS FHM
Sep. 2006 0.631Apr. 2007 0.724Jul. 2007 0.672Sep. 2007 0.585Jan. 2008 0.795Sep. 2008 0.700
Sep. 2006 0.559 0.759Apr. 2007 0.782 0.644Jul. 2007 0.661 0.604Sep. 2007 0.723 0.735Jan. 2008 0.836 0.783Sep. 2008 0.808 0.801
Sep. 2006 0.406 0.651 0.580Apr. 2007 0.514 0.619 0.422Jul. 2007 0.544 0.754 0.508Sep. 2007 0.784 0.673 0.844Jan. 2008 0.565 0.513 0.453Sep. 2008 0.419 0.645 0.483
FMS
FHM
SPD

35
Figure 4. Seasonal changes in diet overlap among species. NMDS based on proportional diet composition of all species: juvenile bluehead suckers (BHS; circles), speckled dace (SPD; squares), juvenile flannelmouth suckers (FMS; diamonds), and fathead minnow (FHM; triangles) in all habitats for each sampling date (A) Sep. 2006 (stress = 0.14), (B) Apr. 2007 (stress = 0.12), (C) Jul. 2007 (stress = 0.10), (D) Sep. 2007 (stress = 0.14), (E) Jan. 2008 (stress = 0.11), and (F) Sep. 2008 (stress = 0.11). Ovals encompass >80% of specimens of species for which there were significant differences in diet (ANOSIM p-value < 0.05; ANOSIM results in Table 6).
36
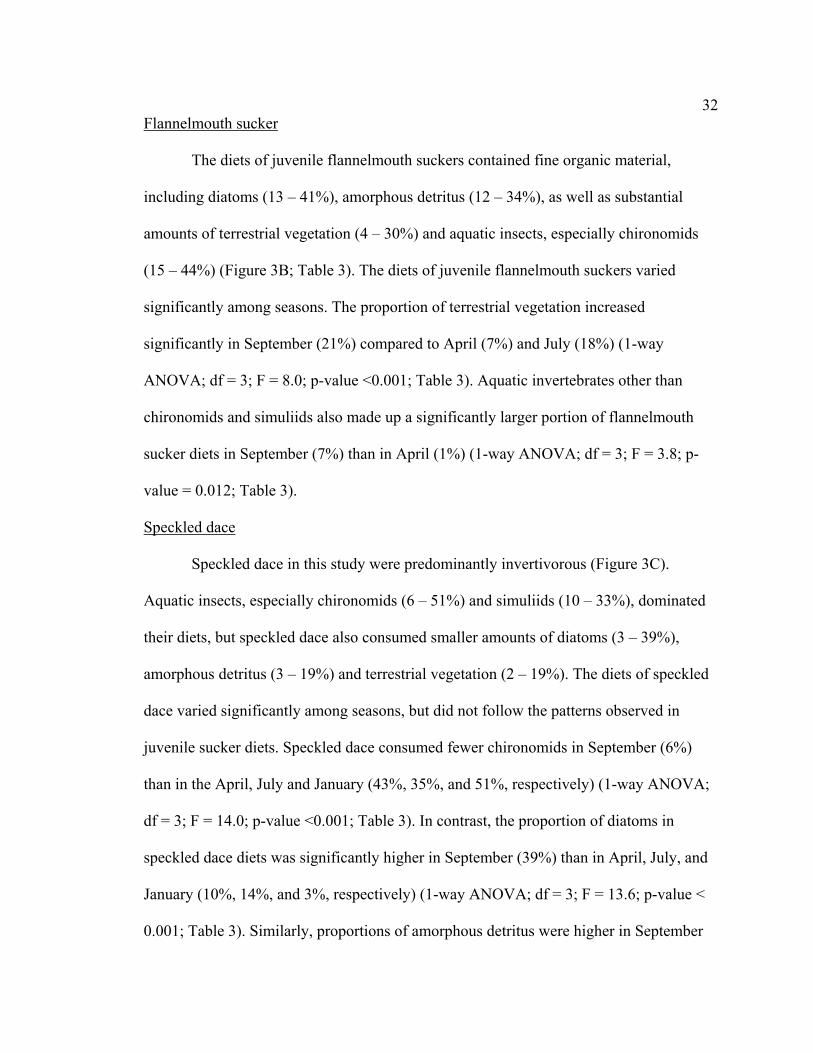
Table 6: Results of one-way ANOSIM examining differences among species for each sampling date. Pairwise comparisons with significant (p-value < 0.05) differences in diet are bold. NS indicates that the global R statistic was not significant (p-value > 0.05).
Species Season
R P-value R P-value R P-valueSep. 2006 -0.089 0.556Apr. 2007 -0.08 0.722Jul. 2007 0.133 0.212Sep. 2007 NS NSJan. 2008 -0.037 0.577Sep. 2008 0.198 0.002
Sep. 2006 0.025 0.367 0.21 0.061Apr. 2007 -0.081 0.51 0.158 0.008Jul. 2007 0.203 0.173 0.185 0.024Sep. 2007 NS NS NS NSJan. 2008 0.014 0.426 0.048 0.134Sep. 2008 0.07 0.02 0.121 0.001
Sep. 2006 0.042 0.5 -0.027 0.574 0.386 0.001Apr. 2007 0.368 0.009 0.269 0.001 0.495 0.001Jul. 2007 0.2 0.105 0.036 0.223 0.236 0.001Sep. 2007 NS NS NS NS NS NSJan. 2008 0.461 0.009 0.383 0.001 0.362 0.001Sep. 2008 0.369 0.001 0.145 0.003 0.37 0.001
FMS
FHM
SPD
g (p )
BHS FMS FHM
There was a substantial amount of overlap in the NMDS plots among all species,
especially fathead minnows, juvenile bluehead suckers, and juvenile flannelmouth
suckers (Figure 4). However, diet overlap patterns were dependent on sampling date
(Figure 4 and Table 6). For example, in September 2006, fathead minnow and speckled
dace diets were moderately different (ANOSIM; R = 0.386, p-value = 0.001; Figure 4A;
Table 6). This difference was associated with aquatic invertebrates in speckled dace diets
and diatoms and amorphous detritus in fathead minnow diets (Figure 4A; Table 7).

37
Table 7: Axis correlation scores for each of the dominant food resources (>10% in diets) in the non-metric multi-dimensional scaling analysis illustrated in Figure 4. Axis 1 corresponds to the x-axis and Axis 2 corresponds to the y-axis in Figure 4.
Date Food item NMDS Axis Axis 1 (x) Axis 2 (y)
R P-value R P-value Sep. 2006
Diatom -0.673 <0.001 -0.218 0.097 Am. Det. -0.676 <0.001 0.302 0.020 Terr. Veg. -0.168 0.203 0.037 0.783 Chironomid 0.616 <0.001 0.382 0.003 Simuliid 0.352 0.006 0.418 0.001 Other Aq. Invert. 0.682 <0.001 -0.569 <0.001
Apr. 2007 Diatom -0.902 <0.001 -0.139 0.180 Am. Detritus -0.477 <0.001 0.201 0.052 Terr. Veg. -0.349 0.001 0.241 0.019 Chironomid 0.723 <0.001 -0.530 <0.001 Simuliid 0.289 0.005 0.685 <0.001 Other Aq. Invert. 0.464 <0.001 0.317 0.002
Jul. 2007 Diatom -0.836 <0.001 0.154 0.178 Am. Detritus -0.462 <0.001 -0.221 0.052 Terr. Veg. -0.054 0.641 -0.166 0.147 Chironomid 0.451 <0.001 -0.622 <0.001 Simuliid 0.506 <0.001 0.594 0.001 Other Aq. Invert. 0.028 0.806 0.456 <0.001
Sep. 2007 Diatom -0.823 <0.001 0.378 <0.001 Am. Detritus -0.472 <0.001 -0.139 0.178 Terr. Veg. 0.073 0.481 -0.599 <0.001 Chironomid 0.508 <0.001 -0.473 <0.001 Simuliid 0.610 <0.001 0.665 <0.001 Other Aq. Invert. 0.225 0.027 -0.395 <0.001
Jan. 2008 Diatom -0.844 <0.001 -0.154 0.121 Am. Detritus -0.562 <0.001 0.187 0.060 Terr. Veg. -0.253 0.010 0.068 0.500 Chironomid 0.705 <0.001 0.543 <0.001 Simuliid 0.566 <0.001 -0.720 <0.001 Other Aq. Invert. 0.120 0.228 -0.110 0.273
Sep. 2008 Diatom 0.849 <0.001 0.301 <0.001 Am. Detritus 0.490 <0.001 -0.352 <0.001 Terr. Veg. -0.197 0.020 0.303 <0.001 Chironomid -0.717 <0.001 -0.222 0.009 Simuliid -0.645 <0.001 0.282 0.001
Other Aq. Invert. -0.258 0.002 -0.669 <0.001
38
In April 2007, speckled dace diets exhibited some overlap with, but were
significantly different than, diets of fathead minnows, bluehead suckers and flannelmouth
suckers (ANOSIM; R = 0.495, 0.269, and 0.368, respectively; p-value = 0.001, 0.001,
and 0.009, respectively; Figure 4B; Table 6). Speckled dace samples occupied the diet
space most closely associated with aquatic invertebrates, especially chironomids and
simuliids. The other species occupied space associated with high proportions of diatoms
and amorphous detritus (Figure 4B; Table 7). In contrast, fathead minnows and
flannelmouth suckers had very similar diets, with only minor differences (ANOSIM; R =
0.158; p-value = 0.008; Figure 4B; Table 6). The difference between flannelmouth sucker
and fathead minnow diets was associated with chironomids and simuliids contributing to
flannelmouth sucker diets, but not fathead minnow diets (Figure 4B; Table 7).
In July 2007, fathead minnow diets were again very similar to flannelmouth
sucker diets with only minor differences (ANOSIM; R = 0.185; p-value = 0.024; Figure
4C; Table 6). However, fathead minnow diets were more substantially different than
speckled dace diets in July 2007 (ANOSIM; R = 0.236; p-value = 0.001; Figure 4C;
Table 6). These were the only significant differences in this sampling date (Figure 4C;
Table 6). Speckled dace and flannelmouth sucker diets were associated with simuliids
and aquatic invertebrates other than chironomids and fathead minnow diets were more
associated with diatoms, amorphous detritus, and terrestrial vegetation (Figure 4C; Table
7).
There were no significant differences among diets in September 2007 (Figure 4D;
Table 6), but speckled dace diets were moderately different from the diets of all other
species in January 2008, mainly due to the predominance of simuliids and chironomids in

39
speckled dace diets (ANOSIM; 0.2 < R < 0.5; p-value < 0.01; Figure 4E; Table 6; Table
7).
In September 2008, fathead minnow diets were very similar to diets of bluehead
suckers and flannelmouth suckers with only minor differences (ANOSIM; R = 0.07 and
0.121, respectively; p-value = 0.02 and 0.001 respectively; Figure 4F; Table 6), but were
different than speckled dace diets (ANOSIM; R = 0.370; p-value = 0.001; Figure 4F;
Table 6). Bluehead sucker and flannelmouth sucker diets were very similar (ANOSIM; R
= 0.198; p-value = 0.002; Figure 4F; Table 6). Flannelmouth sucker diets were also very
similar to speckled dace diets (ANOSIM; R = 0.145; p-value = 0.003; Figure 4F; Table
6), but bluehead sucker diets were different than speckled dace diets (ANOSIM; R =
0.369; p-value = 0.001; Figure 4F; Table 6). These patterns were caused by the
association of speckled dace and flannelmouth sucker diets with aquatic invertebrates,
including simuliids and chironomids, and terrestrial vegetation. In contrast, bluehead
sucker and fathead minnow diets were associated with diatoms and amorphous detritus
(Figure 4F; Table 7).
Inter-annual patterns and dam operations
Diets of small-bodied fish caught during the monsoon season exhibited inter-
annual variability (Figure 5). In general, allochthonous carbon sources, like amorphous
detritus and terrestrial vegetation were more important in September 2006 than in other
years, but this pattern was not always significant (Figure 5 and Table 8). Juvenile
bluehead suckers consumed significantly more amorphous detritus in September 2006
(71%) than in September 2007 (16%) and 2008 (16%) (Table 3; 1-way ANOVA; df = 2;
F = 9.6; p-value <0.001) and juvenile flannelmouth suckers and fathead minnows

40
consumed significantly more amorphous detritus in fluctuating flows in September 2006
(34% and 33%, respectively) than in fluctuating flows in September 2007 (15% and 16%,
respectively) (Table 3; 1-way ANOVA; df = 2; F = 4.4; p-value = 0.017 and F = 5.5; p-
value = 0.006, respectively). In addition, speckled dace and fathead minnows consumed
significantly more terrestrial vegetation in fluctuating flows in September 2006 (19%)
than during steady flows in September 2008 (9% and 8%, respectively) (Table 3; 1-way
ANOVA; df = 2; F = 3.4; p-value = 0.039 and F = 9.2; p-value <0.001, respectively).
Although there was clear inter-annual variability in small-bodied fish diets, I did
not observe a consistent effect of steady flow dam operations in September 2008, when
there were no daily fluctuations in discharge, except that diatoms were generally more
important in September 2008 than in other years (Figure 5). For example, the proportion
of diatoms in the diets of bluehead suckers was greater during steady flows in September
2008 (71%) than in fluctuating flows in 2007 (54%) and was significantly greater than in
fluctuating flows in September 2006 (3%) (Table 3; 1-way ANOVA; df = 2; F = 5.0; p-
value = 0.011). Fathead minnows also consumed significantly more diatoms in
September 2008 (54%) than in September 2006 (29%) and September 2007 (30%) (Table
3; 1-way ANOVA; df = 2; F = 9.0; p-value < 0.001). Likewise, flannelmouth sucker diets
had a significantly larger proportion of diatoms in steady flows in September 2008 (41%)
than in fluctuating flows in September 2007 (13%) (Table 3; 1-way ANOVA; df = 2; F =
9; p-value < 0.001). The proportion of diatoms in flannelmouth sucker diets in September
2008 was also larger than in fluctuating flows in September 2006 (14%), but the
difference was not significant (Table 3). The proportion of diatoms in speckled dace diets
also varied among years, but the proportion was significantly higher in September 2007

41
(39%) than in September 2006 (5%) and in September 2008 (21%) (Table 3; 1-way
ANOVA; df = 2; F = 9.5; p-value <0.001). The importance of invertebrates in small-
bodied fish diets also varied among years, but there were no apparent patterns in their
variability (Figure 5 and Table 8).
Table 8: Inter-annual differences in the proportion of each of the dominant food resources (>10% in diets) in the diets of bluehead sucker (BHS), flannelmouth sucker (FMS), speckled dace (SPD) and fathead minnow (FHM) during the monsoon season (July – September) (one-way ANOVAs). Bold values indicate significant p-values (<0.05). Non-significant ANOVAs (p-value > 0.05) are not shown.
Species Food Resource Date Sep-06 Sep-07BHS Am. Detritus df: 2; F: 9.6; p: <0.001
Sep-06 1.000 Sep-07 <0.001 1.000 Sep-08 <0.001 1.000
BHS Diatom df: 2; F: 5.0; p: 0.011 Sep-06 1.000 Sep-07 0.158 1.000 Sep-08 0.036 0.097
BHS T. Veg. df: 2; F: 3.3; p: 0.044 Sep-06 1.000 Sep-07 0.731 1.000 Sep-08 0.316 0.072
FMS Am. Detritus df: 2; F: 4.4; p: 0.017 Sep-06 1.000 Sep-07 0.013 1.000 Sep-08 0.128 0.300
FMS Diatom df: 2; F: 9.0; p: <0.001 Sep-06 1.000 Sep-07 0.896 1.000 Sep-08 0.064 <0.001
FMS T. Veg. df: 2; F: 3.9; p: 0.026 Sep-06 1.000 Sep-07 0.745 1.000 Sep-08 0.071 0.073
SPD Diatom df: 2; F: 9.5; p: <0.001 Sep-06 1.000 Sep-07 <0.001 1.000 Sep-08 0.167 0.012
SPD T. Veg. df: 2; F: 3.4; p: 0.039 Sep-06 1.000 Sep-07 0.558 1.000 Sep-08 0.038 0.236

42
Table 8. Continued. Species Food Resource Date Sep-06 Sep-07SPD Chironomid df: 2; F: 6.0; p: 0.004
Sep-06 1.000 Sep-07 0.124 1.000 Sep-08 0.616 0.003
SPD Other Aq. Invert. df: 2; F: 7.1; p: 0.001 Sep-06 1.000 Sep-07 0.001 1.000 Sep-08 0.053 0.187
FHM Am. Detritus df: 2; F: 5.5; p: 0.006 Sep-06 1.000 Sep-07 0.004 1.000 Sep-08 0.447 0.056
FHM Diatom df: 2; F: 9.0; p: <0.001 Sep-06 1.000 Sep-07 0.942 1.000 Sep-08 0.002 0.002
FHM T. Veg. df: 2; F: 9.2; p: <0.001 Sep-06 1.000 Sep-07 0.063 1.000 Sep-08 <0.001 0.270
FHM Chironomid df: 2; F: 4.3; p: 0.016 Sep-06 1.000 Sep-07 0.039 1.000 Sep-08 0.989 0.020
FHM Simuliid df: 2; F: 5.0; p: 0.009 Sep-06 1.000 Sep-07 0.016 1.000
Sep-08 0.980 0.017

43
Perc
ent o
f Die
t
0
20
40
60
80
100 A
C
B
D
Sampling DateSept. 2
006
Sept. 2007
Sept. 2008
Perc
ent o
f Die
t
0
20
40
60
80
100
Sampling DateSept. 2
006
Sept. 2007
Sept. 2008
Diatom Amorph. Detrit. Fil. Algae Plant Mat.
Chir. Sim. Gamm. Other Aq. IV
Terr. Invert. Misc. Invert Fish
Figure 5. Inter-annual variability and effects of dam releases on fish diets during the monsoon season. Dam operations in September 2008 were constrained and there were no daily fluctuations in discharge. (A) juvenile bluehead sucker (n=48), (B) juvenile flannelmouth sucker (n=64), (C) speckled dace (n=94), and (D) fathead minnow (n=88). Values are averages across four sites for each sampling date.
Potential drivers of seasonal and inter-annual diet variability
Variation in small-bodied fish diets was associated with the amount of time prior
to sampling that silt concentrations were above the threshold at which primary production
shuts down, described by the metric of turbidity (MT) (Table 9). Silt concentrations
varied significantly among sampling dates (Figure 6). Mean silt concentrations were

44
lowest prior to sampling in April and July 2007 (Figure 6; 1-way ANOVA; df = 5; F =
2140.6; p-value < 0.001) and were highest prior to sampling in September 2006, followed
by September 2007 and September 2008 (Figure 6; 1-way ANOVA; df = 5; F = 2140.6;
p-value < 0.001). Therefore, MT was low in April and July 2007, and higher in
September 2006, 2007, and 2008. When MT was high, amorphous detritus and terrestrial
vegetation were important in flannelmouth sucker diets (Pearson’s correlation coefficient
= 0.234 and 0.357 respectively; p-value = 0.008 and <0.001 respectively) and the
proportions of chironomids and simuliids in flannelmouth sucker diets were small
(Pearson’s correlation coefficient = 0.234 and 0.263 respectively; p-value = 0.003 and
0.008 respectively). Large proportions of amorphous detritus and terrestrial vegetation
were observed in speckled dace diets when MT was high (Pearson’s correlation
coefficient = 0.233 and 0.395 respectively; p-value = 0.001 and <0.001 respectively).
However, the proportions of chironomids, simuliids, and other invertebrates in speckled
dace diets were small when MT was high (Pearson’s correlation coefficient = 0.224,
0.210, and 0.184, respectively; p-value = 0.002, 0.003, and 0.010, respectively). Variation
in fathead minnow diets was also related to MT. When MT was high, proportions of
amorphous detritus and terrestrial vegetation in fathead minnow diets were large
(Pearson’s correlation coefficient = 0.425 and 0.390 respectively; p-value <0.001), but
the proportion of diatoms was small (Pearson’s correlation coefficient = 0.210; p-value =
0.004). Bluehead sucker diets were the exception; no food resources in bluehead sucker
diets were correlated with MT (Table 9).
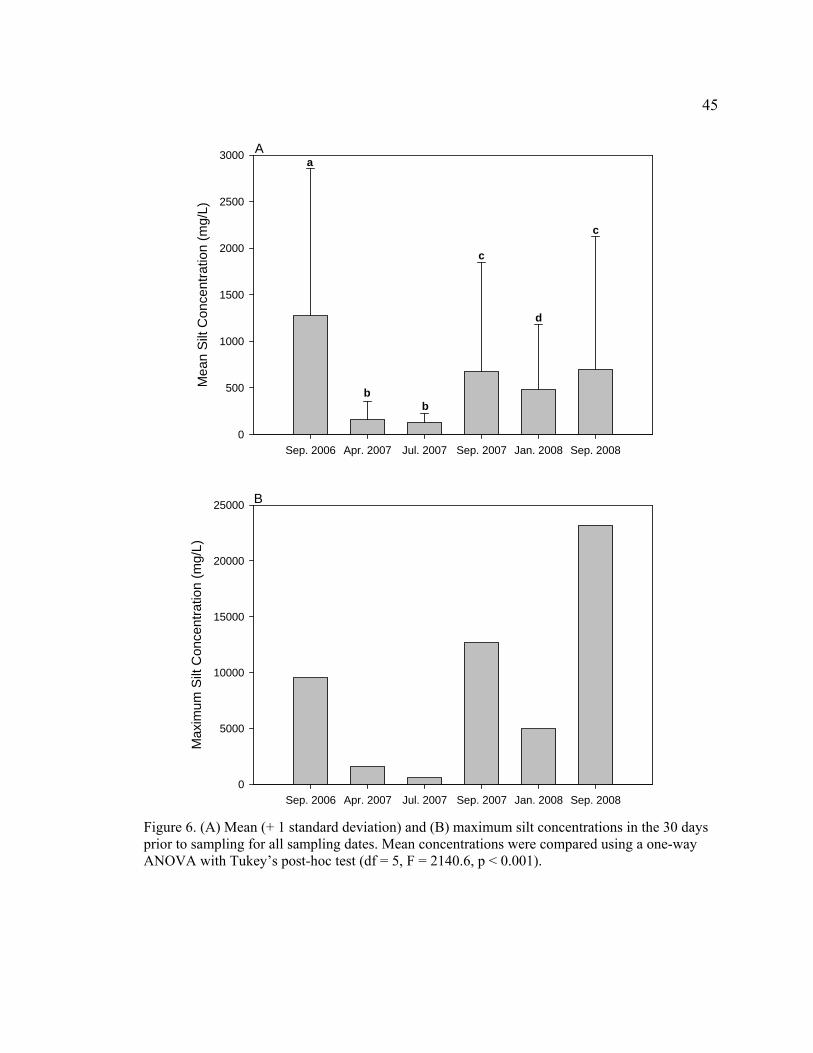
45
Sep. 2006 Apr. 2007 Jul. 2007 Sep. 2007 Jan. 2008 Sep. 2008
Mea
n S
ilt C
once
ntra
tion
(mg/
L)
0
500
1000
1500
2000
2500
3000
Sep. 2006 Apr. 2007 Jul. 2007 Sep. 2007 Jan. 2008 Sep. 2008
Max
imum
Silt
Con
cent
ratio
n (m
g/L)
0
5000
10000
15000
20000
25000
a
bb
c
d
c
A
B
Figure 6. (A) Mean (+ 1 standard deviation) and (B) maximum silt concentrations in the 30 days prior to sampling for all sampling dates. Mean concentrations were compared using a one-way ANOVA with Tukey’s post-hoc test (df = 5, F = 2140.6, p < 0.001).

46
Table 9: Correlations of the metric of turbidity (MT, the number of observations in the 30 days prior to sampling when silt concentrations were higher than 316 mg/l, and when GPP (gross primary production) = 0) with proportions of dominant items in bluehead sucker (BHS), flannelmouth sucker (FMS), speckled dace (SPD), and fathead minnow (FHM) diets. Bold values indicate significant relationships (p-value < 0.05). N/A indicates that data were not available for the analysis. Food Resources
R p-value R p-value R p-value R p-valueDiatom 0.118 0.36 0.004 0.965 -0.01 0.888 -0.21 0.004Am. Det. 0.006 0.964 0.234 0.008 0.233 0.001 0.425 <0.001Terr. Veg. -0.056 0.666 0.357 <0.001 0.395 <0.001 0.39 <0.001Chiro. -0.065 0.615 -0.234 0.008 -0.224 0.002 -0.142 0.055Simuliid -0.175 0.174 -0.263 0.003 -0.21 0.003 -0.098 0.186Other Aq. Invert. N/A N/A 0.134 0.133 -0.184 0.01 N/A N/A
SpeciesBHS FMS SPD FHM
Potential influences of habitat on diet composition
There were limited differences in what fish consumed in mainstem habitats
compared to backwater habitats and there were no consistent patterns either within or
among species (Figure 7). The diets of juvenile bluehead sucker, juvenile flannelmouth
sucker, speckled dace, and fathead minnow were similar regardless of where they were
caught (Figure 8A, B, C, and D, respectively) and ANOSIM supported no significant
differences between habitats (Table 10).
Diet overlap patterns changed only slightly when habitat was considered and
these changes depended on sampling date. In April 2007, patterns of diet overlap were
similar in mainstem and backwater habitats, with few exceptions (Tables 11and 12).
Bluehead sucker diets generally overlapped with flannelmouth sucker and fathead
minnow diets in April 2007, but Schoener’s index scores comparing bluehead and
flannelmouth sucker diets did not indicate overlap in backwaters (Table 11). In addition,
bluehead sucker diets overlapped with speckled dace diets in mainstem habitats, but not
in backwater habitats (Tables 11 and 12). All other diet overlap patterns were the same in

47
mainstem and backwater habitats in April 2007. Patterns of diet overlap in mainstem
habitats compared to backwater habitats were also similar in January 2008, but there were
some differences (Tables 11 and 12). For example, speckled dace diets were more similar
to bluehead sucker and flannelmouth sucker diets in backwater habitats than in mainstem
habitats (Tables 11 and 12). In contrast, fathead minnow diets overlapped with
flannelmouth sucker diets in mainstem habitats, but were more distinct in backwater
habitats (Tables 11 and 12). In addition, fathead minnow diets and speckled dace diets
appear to be different in backwater habitats but not in mainstem habitats (ANOSIM; R =
0.240; p-value = 0.005; Tables 11 and 12).
Table 10: Differences between mainstem and backwater habitats in the diets of bluehead sucker (BHS), flannelmouth sucker (FMS), speckled dace (SPD), and fathead minnow (FHM) (One-way ANOSIMs for each species and for each sampling date). N/A indicates sampling dates and species for which samples from both habitats were not available. Bold values indicate significant results (p-value < 0.05). Season
R P-value R P-value R P-value R P-valueSep. 2006 N/A N/A N/A N/A N/A N/A N/A N/AApr. 2007 -0.375 1.000 -0.017 0.518 0.135 0.044 N/A N/AJul. 2007 N/A N/A N/A N/A -0.045 0.578 0.036 0.369Sep. 2007 N/A N/A 0.117 0.129 N/A N/A 0.094 0.207Jan. 2008 -0.103 0.625 -0.049 0.790 0.063 0.227 0.060 0.076Sep. 2008 0.091 0.121 0.052 0.156 0.148 0.009 0.023 0.198
BHS FMS SPD FHMSpecies
There were also some differences in patterns of diet overlap between mainstem
and backwater habitats in September 2008 (Tables 11 and 12). There was less diet
overlap in backwater habitats than in mainstem habitats. For example, bluehead sucker
diets were different from the diets of speckled dace, and to a lesser extent flannelmouth
suckers, in backwater habitats, but not in mainstem habitats (Tables 11 and 12).
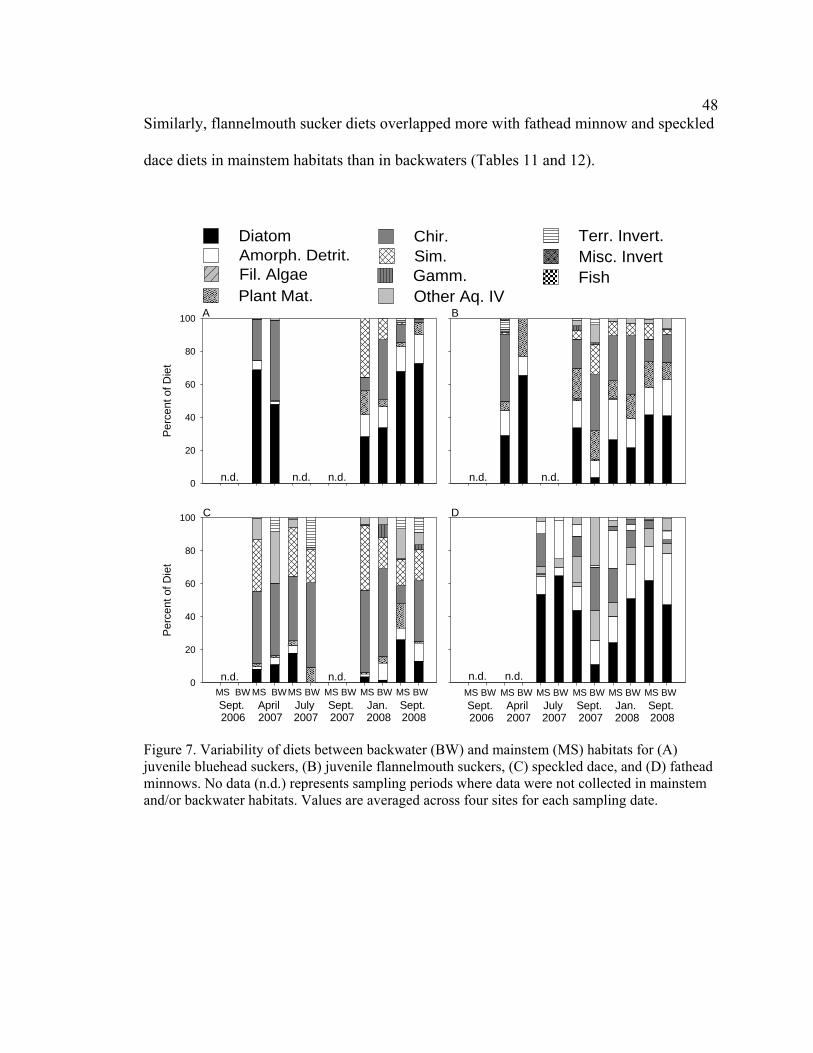
48
Similarly, flannelmouth sucker diets overlapped more with fathead minnow and speckled
dace diets in mainstem habitats than in backwaters (Tables 11 and 12).
Perc
ent o
f Die
t
0
20
40
60
80
100
Perc
ent o
f Die
t
0
20
40
60
80
100
MS BW MS BWMS BW MS BW MS BW MS BWSept. 2006
April 2007
July 2007
Sept. 2007
Jan. 2008
Sept. 2008
n.d. n.d.
n.d.
n.d. n.d.MS BW MS BW MS BW MS BW MS BW MS BWSept. 2006
April 2007
July 2007
Sept. 2007
Jan. 2008
Sept. 2008
n.d. n.d. n.d. n.d.
A B
C D
Diatom Amorph. Detrit. Fil. Algae Plant Mat.
Chir. Sim. Gamm. Other Aq. IV
Terr. Invert. Misc. Invert Fish
Figure 7. Variability of diets between backwater (BW) and mainstem (MS) habitats for (A) juvenile bluehead suckers, (B) juvenile flannelmouth suckers, (C) speckled dace, and (D) fathead minnows. No data (n.d.) represents sampling periods where data were not collected in mainstem and/or backwater habitats. Values are averaged across four sites for each sampling date.

49
Figure 8. Non-metric multidimensional scaling (NMDS) illustrating variability between habitats (solid shapes are mainstem habitats; open shapes are backwater habitats) in (A) juvenile bluehead sucker diets (stress = 0.08), (B) juvenile flannelmouth sucker diets (stress = 0.13), (C) speckled dace diets (stress = 0.17), and (D) fathead minnow diets (stress = 0.12) in 6 sampling periods (NMDS).
Table 11: Schoener’s similarity matrix for all species-species combinations for each sampling date and in mainstem (MS) and backwater (BW) habitats. Scores are calculated from the mean proportion of each diet item. Scores above 0.600 (substantial overlap) are in bold, and scores below 0.400 (substantial differences) are italicized.
Species Season BHS FMS FHM
MS BW MS BW MS BW FMS Sep. 2006 N/A N/A
Apr. 2007 0.601 0.500 Jul. 2007 0.629 N/A Sep. 2007 0.759 N/A Jan. 2008 0.678 0.821 Sep. 2008 0.729 0.682
FHM Sep. 2006 N/A N/A N/A N/A Apr. 2007 0.826 N/A 0.620 N/A Jul. 2007 0.694 N/A 0.690 N/A Sep. 2007 0.837 N/A 0.853 0.697 Jan. 2008 0.766 0.648 0.801 0.645 Sep. 2008 0.857 0.731 0.751 0.505
SPD Sep. 2006 N/A N/A N/A N/A N/A N/A Apr. 2007 0.346 0.577 0.557 0.167 0.362 N/A Jul. 2007 0.631 N/A 0.807 N/A 0.549 0.270 Sep. 2007 0.751 N/A 0.764 N/A 0.848 N/A Jan. 2008 0.501 0.651 0.442 0.621 0.535 0.340 Sep. 2008 0.503 0.274 0.714 0.517 0.503 0.403
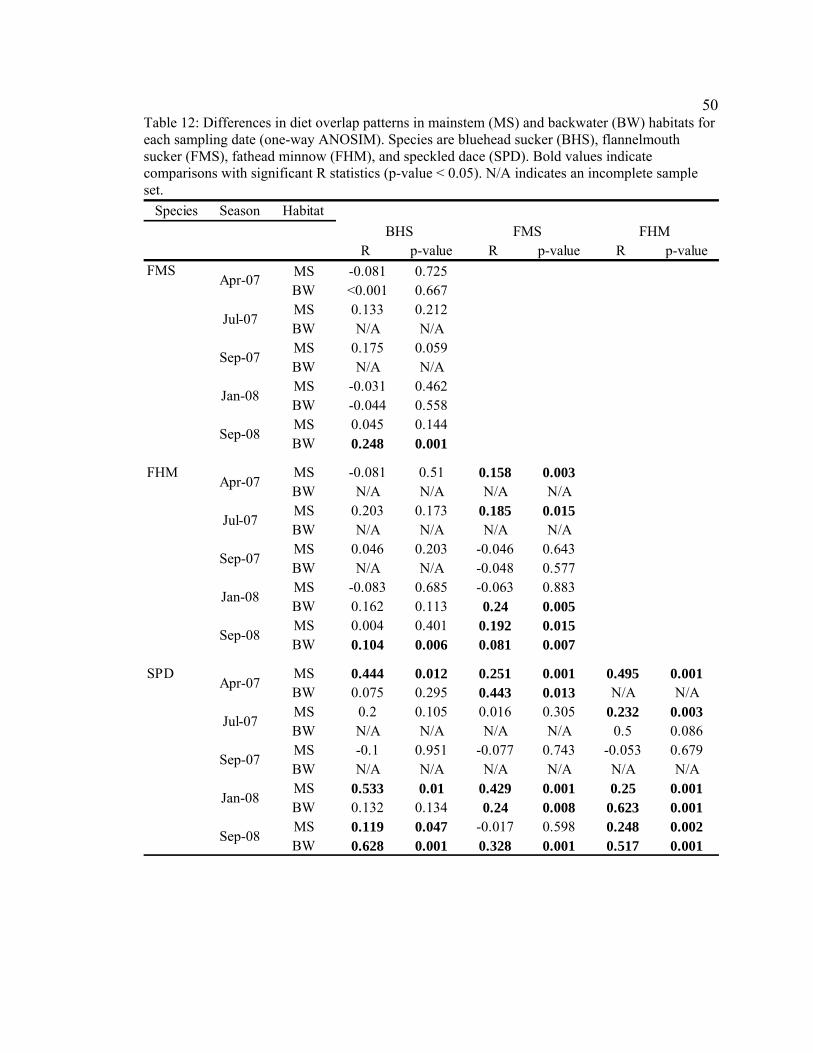
50
Table 12: Differences in diet overlap patterns in mainstem (MS) and backwater (BW) habitats for each sampling date (one-way ANOSIM). Species are bluehead sucker (BHS), flannelmouth sucker (FMS), fathead minnow (FHM), and speckled dace (SPD). Bold values indicate comparisons with significant R statistics (p-value < 0.05). N/A indicates an incomplete sample set.
Species Season Habitat
R p-value R p-value R p-valueFMS MS -0.081 0.725
BW <0.001 0.667MS 0.133 0.212BW N/A N/AMS 0.175 0.059BW N/A N/AMS -0.031 0.462BW -0.044 0.558MS 0.045 0.144BW 0.248 0.001
FHM MS -0.081 0.51 0.158 0.003BW N/A N/A N/A N/AMS 0.203 0.173 0.185 0.015BW N/A N/A N/A N/AMS 0.046 0.203 -0.046 0.643BW N/A N/A -0.048 0.577MS -0.083 0.685 -0.063 0.883BW 0.162 0.113 0.24 0.005MS 0.004 0.401 0.192 0.015BW 0.104 0.006 0.081 0.007
SPD MS 0.444 0.012 0.251 0.001 0.495 0.001BW 0.075 0.295 0.443 0.013 N/A N/AMS 0.2 0.105 0.016 0.305 0.232 0.003BW N/A N/A N/A N/A 0.5 0.086MS -0.1 0.951 -0.077 0.743 -0.053 0.679BW N/A N/A N/A N/A N/A N/AMS 0.533 0.01 0.429 0.001 0.25 0.001BW 0.132 0.134 0.24 0.008 0.623 0.001MS 0.119 0.047 -0.017 0.598 0.248 0.002BW 0.628 0.001 0.328 0.001 0.517 0.001
FHM
Jan-08
Sep-08
Apr-07
Jul-07
Sep-07
Jan-08
Sep-08
Apr-07
Jul-07
Sep-07
Jan-08
Sep-08
Apr-07
Jul-07
Sep-07
BHS FMS

51
CHAPTER FOUR
DISCUSSION
This study represents one of the only comprehensive descriptions of the diets of
small-bodied fishes in the Colorado River in the Grand Canyon. This is especially true
for juveniles of the two native sucker species included in the analysis (C. discobolus and
C. latipinnis). There is evidence that populations of these catostomids are declining
throughout their range, though their populations in the Grand Canyon appear steady
(Clarkson and Childs 2000, Ward et al. 2002, Paukert and Rogers 2004, Ptacek et al.
2005, Gloss and Coggins, 2005). Little is known about the diets of the vulnerable
juvenile stages of these species. In this study, small-bodied fishes in the Grand Canyon
consumed a variety of resources: diatoms, amorphous detritus, terrestrial vegetation,
aquatic invertebrates (including chironomids and simuliids), and terrestrial invertebrates.
These resources encompass most of the available resources in the system, which include
filamentous algae, diatoms, aquatic invertebrates (dominated by chironomids, simuliids,
Gammarus lacustris, and New Zealand mudsnail), and allochthonous carbon (including
terrestrial vegetation and amorphous detritus) (Kennedy et al. unpublished data, Blinn
and Cole 1991; Kennedy and Gloss 2005). I also found that small-bodied fish diets
overlapped, indicating that competition may occur, both among native species and among
native and non-native species. However, the diets and patterns of niche overlap depended
on species and seasonal, inter-annual and habitat heterogeneity in the system.

52
Niche overlap
An important first step in understanding the ongoing declines of native fish
populations in the Colorado River is to describe the ecology of the species, including the
diets of juvenile life stages. A second important step is to understand how these species,
especially the vulnerable early life stages, interact with other species. There are many
types of inter-specific interactions, but I have focused on resource competition. As I
predicted, bluehead sucker diets generally overlapped with flannelmouth sucker and
fathead minnow diets. In contrast, fathead minnow diets were often significantly different
than speckled dace diets. Flannelmouth sucker diets overlapped less consistently with
fathead minnow and speckled dace diets. Significant differences in diet were typically
associated with diatoms and amorphous detritus in bluehead sucker and fathead minnow
diets, and with simuliids and chironomids in speckled dace diets.
Seasonal heterogeneity in diets and niche overlap
Diet overlap patterns changed with season. For instance, bluehead sucker diets
were different than flannelmouth sucker and fathead minnow diets during the monsoon
season and in steady flows in September 2008, when bluehead suckers ate diatoms,
amorphous detritus and terrestrial vegetation more exclusively than did fathead minnows
and flannelmouth suckers. In addition, fathead minnow diets were not significantly
different than speckled dace diets during the monsoon season in fluctuating flows in
September 2007, when there were no differences in diet among any fishes. Fathead
minnow diets and flannelmouth sucker diets were different in April and July 2007, when
turbidity was the lowest (Figure 9). However, fathead minnow and flannelmouth sucker
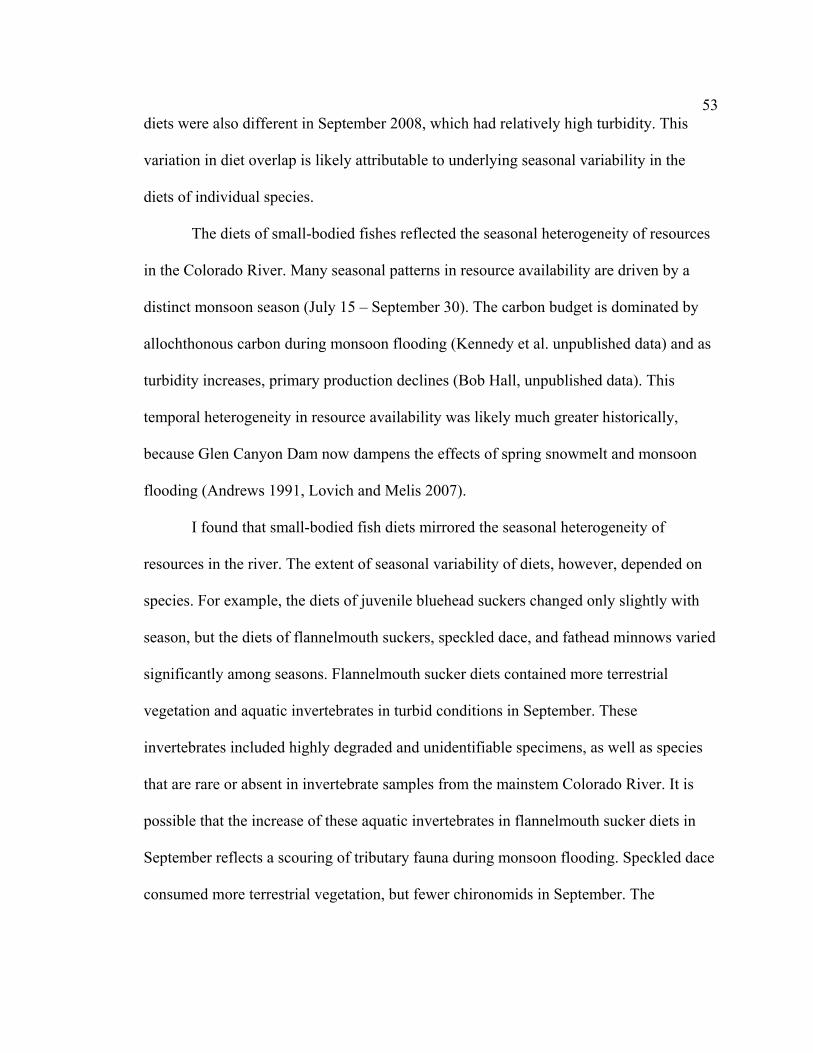
53
diets were also different in September 2008, which had relatively high turbidity. This
variation in diet overlap is likely attributable to underlying seasonal variability in the
diets of individual species.
The diets of small-bodied fishes reflected the seasonal heterogeneity of resources
in the Colorado River. Many seasonal patterns in resource availability are driven by a
distinct monsoon season (July 15 – September 30). The carbon budget is dominated by
allochthonous carbon during monsoon flooding (Kennedy et al. unpublished data) and as
turbidity increases, primary production declines (Bob Hall, unpublished data). This
temporal heterogeneity in resource availability was likely much greater historically,
because Glen Canyon Dam now dampens the effects of spring snowmelt and monsoon
flooding (Andrews 1991, Lovich and Melis 2007).
I found that small-bodied fish diets mirrored the seasonal heterogeneity of
resources in the river. The extent of seasonal variability of diets, however, depended on
species. For example, the diets of juvenile bluehead suckers changed only slightly with
season, but the diets of flannelmouth suckers, speckled dace, and fathead minnows varied
significantly among seasons. Flannelmouth sucker diets contained more terrestrial
vegetation and aquatic invertebrates in turbid conditions in September. These
invertebrates included highly degraded and unidentifiable specimens, as well as species
that are rare or absent in invertebrate samples from the mainstem Colorado River. It is
possible that the increase of these aquatic invertebrates in flannelmouth sucker diets in
September reflects a scouring of tributary fauna during monsoon flooding. Speckled dace
consumed more terrestrial vegetation, but fewer chironomids in September. The

54
increased turbidity may have affected the ability of speckled dace to find their preferred
food resource and forced them to rely on allochthonous carbon sources such as terrestrial
vegetation.
Seasonal patterns in the diets of fish could also be attributable to ontogenetic
shifts in diet associated with seasonal differences in the total length of fish samples. Such
ontogenetic shifts have been documented in many fishes (Werner and Gilliam 1984). If
there were consistent differences in the total lengths of samples from each sampling date
in this study, some of the observed seasonal variation in diet might be due to variation in
sample length. However, there were few differences in mean total length among sampling
dates for all species. In particular, if total length of fish captured varied seasonally, I
would expect fish caught in the same season of different years to vary predictably in
length. This was not the case. Samples from September 2006, 2007, and 2008 were not
consistently different from other sampling dates. Although there were some weak
correlations between total length and diet composition (Table 13), I do not believe that
sample length contributed greatly to the observed seasonal variation in the diets of small-
bodied fishes. However, further research into ontogenetic shifts across a broader size
range for these species, particularly the catostomids, could reveal additional important
diet patterns.

55
Table 13: Correlations of total length and percent diet for each dominant food resource (> 10 % in diet) and each species: bluehead sucker (BHS), flannelmouth sucker (FMS), speckled dace (SPD), and fathead minnow (FHM). Bold values indicate significant relationships (p-value < 0.05). Food Resource
R p-value R p-value R p-value R p-value% Diatom 0.411 <0.001 -0.102 0.280 0.320 <0.001 0.163 0.028% Amorphous Detritus -0.040 0.076 0.197 0.035 0.002 0.983 -0.042 0.577% Terrestrial Vegetation -0.152 0.239 0.188 0.045 0.253 <0.001 0.128 0.085% Chironomid -0.276 0.030 -0.044 0.646 -0.397 <0.001 -0.150 0.042% Simuliid -0.187 0.145 -0.109 0.246 0.167 0.026 -0.036 0.630% Other Aquatic Invertebrates -0.150 0.243 -0.193 0.040 -0.115 0.125 -0.102 0.168% Terrestrial Invertebrates -0.206 0.109 0.041 0.667 -0.048 0.525 0.060 0.418
SpeciesBHS FMS SPD FHM
Inter-annual heterogeneity and dam operations
The diets of small-bodied fish caught during the steady flows in September 2008
were not consistently different than in other years for any species. However, bluehead
suckers, flannelmouth suckers, and fathead minnows consumed more diatoms in the
steady flows of 2008 than in other years. These results suggest that dam operations may
affect small-bodied fish diets during the monsoon season, but could also reflect
variability in the strength and timing of the monsoon seasons among years. Mean silt
concentrations in August and September 2008 were similar to concentrations in August
and September 2007, indicating that 2007 and 2008 experienced similar monsoon
seasons. However, maximum silt concentrations during the same time period were
approximately 4.5 times higher in 2008 than in 2007. The 2008 monsoon was likely
much flashier, consisting of fewer, but stronger storms, resulting in shorter periods of
high turbidity. These conditions may have allowed primary producers to recover more
quickly than the conditions resulting from weaker, but more persistent storms during the

56
2007 monsoon. Inter-annual variability in small-bodied fish diets may be attributed to
variations in the nature of monsoon storms rather than variations in dam operations.
Potential drivers of seasonal and inter-annual diet variability
I observed higher proportions of allochthonous carbon sources (amorphous
detritus and terrestrial vegetation) in small-bodied fish diets during the monsoon season,
and especially in strong monsoon seasons, and these patterns were associated with the
MT (metric of turbidity). The MT describes the amount of time prior to sampling that silt
concentrations were above the threshold at which the rate of primary production
approaches zero. Turbidity could drive the observed diet patterns (decreased diatoms and
increased allochthonous carbon in monsoon seasons) in two ways: 1. low light levels
could limit photosynthesis, resulting in low availability of diatoms to consumers; and 2.
tributary flooding could deliver large amounts of allochthonous carbon sources, such as
terrestrial vegetation, to the mainstem channel.
Importance of backwaters
Backwater habitats may provide refuges from predators, swift currents, and colder
water in mainstem habitats and thus can be important habitats for small-bodied fishes
(Brouder et al. 1999, Bezzerides and Bestgen 2002, Goeking 2003). Because backwaters
can, at times, have high densities of small-bodied fishes, they may be hotspots for diet
overlap and competition (Muth and Snyder 1995). I compared diet and diet overlap
patterns of small-bodied fishes between backwater and mainstem habitats. Despite the
potential importance of backwater habitats, I did not find within-species differences in
small-bodied fish diets between backwater and mainstem habitats. I also examined

57
differences in the extent of diet overlap among species between backwater and mainstem
habitats. During some seasons the extent of diet overlap among species was different in
mainstem habitats than in backwater habitats. For example, in September 2008 species
diet overlap was reduced in backwater habitats compared to mainstem habitats. In
general, there were not consistent differences in the extent of diet overlap in backwaters
versus mainstem habitats. Due to time constraints in the field and low densities of small-
bodied fishes, not all sampling dates had sufficient samples from both mainstem and
backwater habitats, which may have limited my ability to make robust comparisons (e.g.
see Table 11 and Table 12). More sampling in these distinct habitats may elucidate if
there are differences fish diet overlap in backwaters versus mainstem habitats.
Implications of niche overlap
Competition can be difficult and costly to assess directly, especially in remote
field sites such as the Grand Canyon. Direct assessment of competition involves pair-
wise enclosure experiments to measure the effect of controlled resource limitation on the
fitness of each species in the presence and absence of other species. Because it is often
difficult, or sometimes even impossible to conduct these experiments, competition is
often inferred when certain dimensions of the species niches overlap, especially
microhabitat and diet (Schoener 1983). Here, I infer the potential for competition by
niche overlap in the form of diet overlap, and to some degree habitat overlap.
The four dominant small-bodied fishes in the Colorado River in the Grand
Canyon commonly occur in the same habitats, as they are all commonly captured in the
same sampling pass (personal observation and Ralsten et al. 2007). Hence, it is clear that

58
they share similar habitats. For this reason, scenario 1 in Figure 1 is not an accurate
depiction of small-bodied fish interactions in the Grand Canyon. I have also
demonstrated, using two distinct analyses, that the diets of small-bodied fishes overlap,
ruling out scenario 2 in Figure 1 as an accurate depiction of small-bodied fish interaction.
The results presented here suggest that scenario 3 in Figure 1, i.e. niche overlap,
accurately depicts many of the interactions among small-bodied fishes in the Grand
Canyon and demonstrate that there is a large potential for resource competition among
native and non-native fishes, and even among native species, especially among fathead
minnows and juvenile bluehead and flannelmouth suckers.
The fathead minnow is an aggressive invasive species and is wide-spread in the
Colorado River basin. Competition between fathead minnows and juvenile bluehead and
flannelmouth suckers could be particularly harmful because these sucker populations are
declining in much of their range and preservation of Grand Canyon populations may be
important to species conservation. Negative effects of competition with non-natives at the
juvenile stage could have a dramatic effect on bluehead and flannelmouth sucker
recruitment and reproductive success. Although juvenile suckers may compete with
fathead minnows, the diets of speckled dace do not overlap with the diets of fathead
minnows and these species are not likely to compete for resources.
The diets of some native species also overlapped greatly, especially those of
juvenile bluehead and flannelmouth suckers. This is counter-intuitive because these two
closely related species evolved together and should not compete based on ecological
theory. Ecological theory states that two closely related species that share a niche cannot

59
coexist (competitive exclusion principle, Hutchinson 1957). However, these two species
have similar early life histories, and may not diverge ecologically until later life stages.
The juveniles of these two species occupy similar habitats, but the adults occupy different
habitats (Ptacek et al. 2005 and Rees et al. 2005). These species may have evolved to
have similar niches in early life stages, but avoid competition with distinct niches as
adults.
I infer competition based on niche overlap, but cannot definitively conclude that
small-bodied fishes in the Grand Canyon compete without assessing resource limitation
in the system. Competition cannot occur if the shared resources are not limiting (Crombie
1947, Angermeier 1982). Resource limitation is often directly measured in the field via
experimental food additions or exclusions (as in Weisberg and Lotrich 1986, Richardson
1991, and Wallace et al. 1999). If consumers respond positively to the addition of food
(Weisberg and Lotrich 1986 and Richardson 1991), or negatively to food exclusion (as in
Wallace et al. 1999), the consumers are food limited. However, such experiments are
difficult in remote ecosystems, such as the Grand Canyon, and alternative methods of
testing for resource limitation are necessary. An alternative approach to assess resource
limitation is to let nature conduct the experiment. For example, Wellington and Victor
(1985) used a sudden increase in resource availability on coral reefs in response to an El
Niño event to assess resource limitation of damselfish. The damselfish population did not
increase in response to increased resource availability and the authors concluded that the
population was not resource limited (Wellington and Victor 1985). In addition, natural
variation in resource availability is sometimes compared to fish growth. Food limitation
60
can be inferred if resource availability and fish growth are correlated (Noble 1975). Other
studies have relied on energetic calculations to assess resource limitation (e.g.
Montgomerie and Gass 1981, Eadie and Keast 1982, Collie 1987, Rosi-Marshall and
Wallace 2002). These studies use different methods and have focused on diverse taxa, but
essentially all compare consumption rates to resource production rates or availability. If
consumption rates approach or exceed resource production rates, resources are limited
(e.g. Montgomerie and Gass 1981 and Eadie and Keast 1982). In contrast, if resource
production is much greater than consumption rates, resources are not limited (e.g. Collie
1987, Rosi-Marshall and Wallace 2002). The energetic approach to assessing resource
limitation does not require ecosystem manipulation and does not rely on natural
experiments and therefore can be more feasible than other methods. Currently, a research
team is applying the energetic approach to the Grand Canyon to assess resource
limitation.
The specific resources in which diets overlap are also important because these
resources can vary in quality and abundance. Diet overlap in an abundant resource may
not be important for species interactions. Likewise, diet overlap in a poor-quality
resource may not be important even if it is consumed in large quantities. For example,
amorphous detritus is generally a low-quality food resource (i.e. low assimilation
efficiency) and therefore may not be energetically important (Persson 1983). Persson
(1983) found that roach diets overlapped greatly when all food items were considered,
but did not overlap when low-quality amorphous detritus was excluded from the overlap

61
analysis. Therefore, the quality of food resources should be considered in addition to
resource availability when assessing the implications of overlap among fish diets.
Implications for management and recommendations for future research priorities
These results have potential implications for future management and research
priorities. I inferred competition among native and non-native fishes from diet overlap,
but experiments quantifying the extent of competition (i.e resource overlap plus resource
limitation) would benefit managers as they try to understand the effects of non-native
species on native fish populations. In addition, the potential for competition between
juvenile suckers with non-native fathead minnow argues for management actions that
could suppress fathead minnow populations. Although mechanical removal of other non-
native fishes has been relatively successful (Coggins 2008), mechanical removal of
fathead minnows would be difficult due to their small size. Another potential method for
suppressing fathead minnow populations could be the implementation of periods of high
flow releases from Glen Canyon Dam. Previous experimental high flows in the Grand
Canyon have been shown to displace fathead minnows, but not native species (Valdez et
al. 2001). Fathead minnow populations recovered within eight months of the high flow,
but stronger or more frequent high flows may be effective tools to suppress populations
(Valdez et al. 2001).
Dam managers have also implemented experimental periods of steady flows to
improve fish habitat. Managers implemented steady flows during the 2008 monsoon
season. I found that this management action had little effect on small-bodied fish diets.
However, steady flows may benefit small-bodied fishes in other ways, perhaps by

62
improving habitat quality. A low steady summer flow treatment in 2000 resulted in
substantial warming of nearshore and backwater habitats, which would favor juvenile fish
development (Trammell et al. 2002). More research should be conducted to fully
understand the effects of steady flows on small-bodied fishes. This study demonstrates
that inter-annual variability in the system, such as variation in monsoon strength, can
alter fish feeding habits and this variability should be considered when evaluating effects
of experimental dam operations or other management activities.
My results also suggest that more research investigating the importance of
backwaters to small-bodied fish is needed. I did not find differences in small-bodied fish
diets between fishes collected in backwater and mainstem habitats, but my study design
did not allow me to fully address the question. For instance, I could not guarantee that
fish were actively feeding in the habitat from which they were caught. Small-bodied fish
may use backwaters as habitat refuges, but may rely on the mainstem for feeding habitats
and this merits further research.
Conclusion
Competition with non-native fishes has been blamed for the declining populations
of many native fishes in the southwestern United States (Tyus and Saunders 2000,
Minckley et al. 2003). I observed significant diet overlap between native juvenile
bluehead and flannelmouth sucker and non-native fathead minnows in the Grand Canyon
and infer that competition among these species is possible. In contrast, speckled dace
diets did not overlap with fathead minnow diets nor with juvenile flannelmouth sucker
and bluehead sucker diets, and the potential for competition among these species is low.

63
These data provide a first look at the diets of these species in the Grand Canyon and at
the effects of seasonal, inter-annual, and habitat heterogeneity on small-bodied fish diets.
This study reveals the importance of riverine conditions for small-bodied fish diets.
Different patterns emerge when spatial, seasonal, and inter-annual variability is
considered. For example, turbidity can vary among years and is a particularly important
factor for small-bodied fish diets. Future studies in the Colorado River and other systems
should incorporate these sources of variability to develop a comprehensive understanding
of small-bodied fish diets and diet overlap. Although more research in this area is
warranted, managers should consider competition between fathead minnows and juvenile
suckers in the development of management plans for the Colorado River in the Grand
Canyon.

64
APPENDIX A
COMPLETE DIET COMPOSITION TABLE

65
Season Species Food Resource Site
Sep-06 BHS Diatom 3.21 N/A - - - - - -Amorphous Detritus 71.14 N/A - - - - - -Aquatic Vegetation - - - - - - - -Filamentous Algae - - - - - - - -Terrestrial Vegetation 25.65 N/A - - - - - -Aquatic Invertebrate
DipteraChironomid - - - - - - - -Simuliid - - - - - - - -Tipulid - - - - - - - -Ceratopogonid - - - - - - - -Unidentifiable - - - - - - - -
Gammarus - - - - - - - -Aquatic Mite - - - - - - - -Planorbidae - - - - - - - -Trichoptera - - - - - - - -Coleoptera - - - - - - - -Ephemeroptera - - - - - - - -Odonata - - - - - - - -Megaloptera - - - - - - - -Hemiptera - Corixidae - - - - - - - -Copepod - - - - - - - -Cladacera - - - - - - - -Unidentifiable Aquatic Invertebrate - - - - - - - -
Terrestrial InvertebrateHemiptera - Aphid - - - - - - - -Hemiptera - Unidentified - - - - - - - -Thysanoptera - Thrip - - - - - - - -Hymenoptera - - - - - - - -Coleoptera - - - - - - - -Diptera - - - - - - - -Orthoptera - - - - - - - -Terrestrial Mite - - - - - - - -Unidentifiable Terrestrial Invertebrate - - - - - - - -
Miscellaneous Invertebrate - - - - - - - -Fungi - - - - - - - -Fish - - - - - - - -
Appendix 1. Mean (SD) percentage of food resources comprising juvenile bluehead sucker (BHS), juvenile flannelmouth sucker (FMS), speckled dace (SPD) and fathead minnow (FHM) diets on six sampling dates and at 4 sites in the Grand Canyon.
62 127 167 225
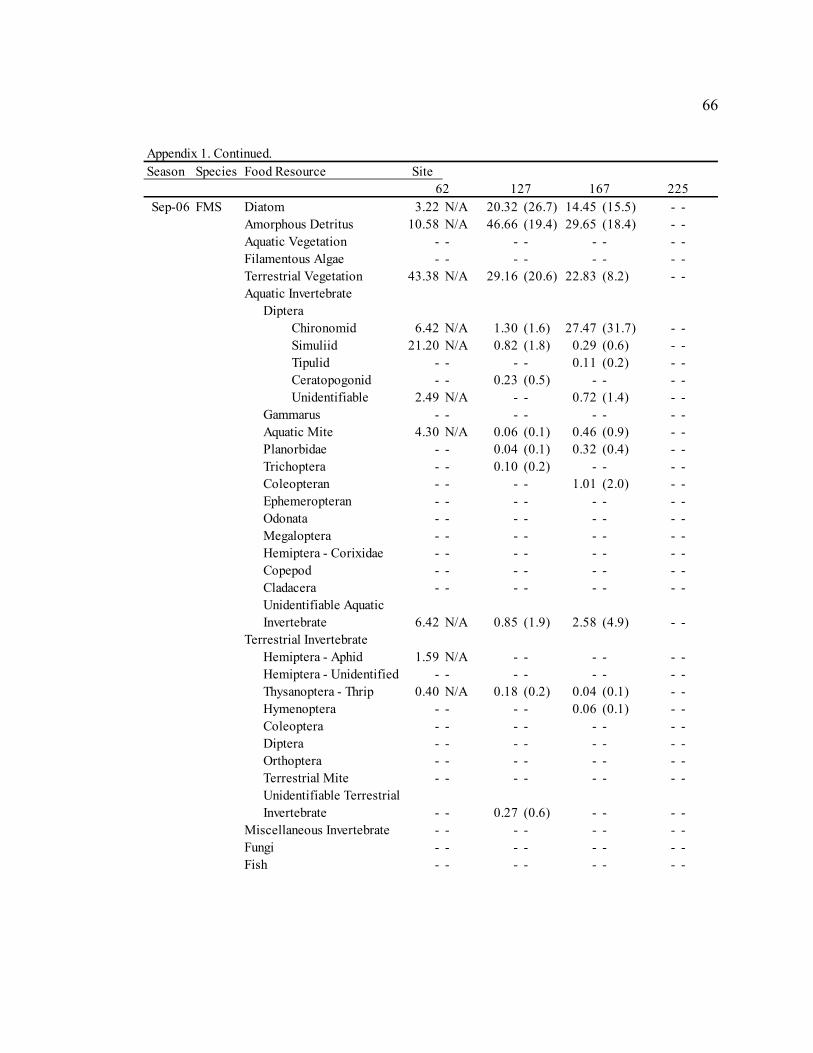
66
Season Species Food Resource Site
Sep-06 FMS Diatom 3.22 N/A 20.32 (26.7) 14.45 (15.5) - -Amorphous Detritus 10.58 N/A 46.66 (19.4) 29.65 (18.4) - -Aquatic Vegetation - - - - - - - -Filamentous Algae - - - - - - - -Terrestrial Vegetation 43.38 N/A 29.16 (20.6) 22.83 (8.2) - -Aquatic Invertebrate
DipteraChironomid 6.42 N/A 1.30 (1.6) 27.47 (31.7) - -Simuliid 21.20 N/A 0.82 (1.8) 0.29 (0.6) - -Tipulid - - - - 0.11 (0.2) - -Ceratopogonid - - 0.23 (0.5) - - - -Unidentifiable 2.49 N/A - - 0.72 (1.4) - -
Gammarus - - - - - - - -Aquatic Mite 4.30 N/A 0.06 (0.1) 0.46 (0.9) - -Planorbidae - - 0.04 (0.1) 0.32 (0.4) - -Trichoptera - - 0.10 (0.2) - - - -Coleopteran - - - - 1.01 (2.0) - -Ephemeropteran - - - - - - - -Odonata - - - - - - - -Megaloptera - - - - - - - -Hemiptera - Corixidae - - - - - - - -Copepod - - - - - - - -Cladacera - - - - - - - -Unidentifiable Aquatic Invertebrate 6.42 N/A 0.85 (1.9) 2.58 (4.9) - -
Terrestrial InvertebrateHemiptera - Aphid 1.59 N/A - - - - - -Hemiptera - Unidentified - - - - - - - -Thysanoptera - Thrip 0.40 N/A 0.18 (0.2) 0.04 (0.1) - -Hymenoptera - - - - 0.06 (0.1) - -Coleoptera - - - - - - - -Diptera - - - - - - - -Orthoptera - - - - - - - -Terrestrial Mite - - - - - - - -Unidentifiable Terrestrial Invertebrate - - 0.27 (0.6) - - - -
Miscellaneous Invertebrate - - - - - - - -Fungi - - - - - - - -Fish - - - - - - - -
62 127 167 225
Appendix 1. Continued.

67
Season Species Food Resource Site
Sep-06 SPD Diatom 4.06 N/A 5.92 (8.4) 7.48 (19.5) 1.27 (1.5)Amorphous Detritus 76.54 N/A 18.93 (26.8) 18.69 (24.0) 9.20 (16.4)Aquatic Vegetation - - - - 3.65 (11.8) - -Filamentous Algae - - - - - - - -Terrestrial Vegetation 1.60 N/A 10.64 (15.0) 27.14 (19.8) 7.47 (8.6)Aquatic Invertebrate
DipteraChironomid 17.80 N/A 50.00 (70.7) 7.39 (11.4) 19.79 (15.3)Simuliid - - - - 13.50 (25.3) 7.06 (6.3)Tipulid - - - - - - - -Ceratopogonid - - - - - - - -Unidentifiable - - - - - - 4.63 (6.5)
Gammarus - - - - 0.50 (1.7) - -Aquatic Mite - - - - 4.71 (16.0) 0.96 (2.4)Planorbidae - - - - 0.30 (0.9) - -Trichoptera - - - - - - - -Coleoptera - - - - 1.67 (5.3) - -Ephemeroptera - - - - 0.69 (2.1) - -Odonata - - - - - - 1.10 (2.7)Megaloptera - - - - - - - -Hemiptera - Corixidae - - - - - - - -Copepod - - - - - - - -Cladacera - - - - - - - -Unidentifiable Aquatic Invertebrate - - 14.51 (20.5) 14.77 (16.7) 42.44 (23.4)
Terrestrial InvertebrateHemiptera - Aphid - - - - - - - -Hemiptera - Unidentified - - - - - - - -Thysanoptera - Thrip - - - - - - - -Hymenoptera - - - - - - - -Coleoptera - - - - - - - -Diptera - - - - - - - -Orthoptera - - - - - - - -Terrestrial Mite - - - - - - - -Unidentifiable Terrestrial Invertebrate - - - - - - 6.07 (13.8)
Miscellaneous Invertebrate - - - - - - - -Fungi - - - - - - - -Fish - - - - - - - -
Appendix 1. Continued.
62 127 167 225

68
Season Species Food Resource Site
Sep-06 FHM Diatom 28.33 (26.0) 32.35 (15.1) 34.26 (23.3) 16.73 (15.6)Amorphous Detritus 22.70 (19.3) 47.97 (16.0) 32.00 (21.2) 30.34 (18.7)Aquatic Vegetation 2.58 (5.7) 2.76 (5.7) 5.10 (7.9) 7.30 (16.0)Filamentous Algae - - - - - - - -Terrestrial Vegetation 14.07 (7.8) 16.92 (10.6) 18.81 (13.9) 31.55 (3.3)Aquatic Invertebrate
DipteraChironomid 5.17 (8.1) - - 9.18 (29.0) - -Simuliid 7.21 (9.8) - - 0.04 (0.1) - -Tipulid - - - - - - - -Ceratopogonid - - - - - - - -Unidentifiable - - - - - - - -
Gammarus - - - - - - - -Aquatic Mite - - - - - - - -Planorbidae - - - - - - - -Trichoptera - - - - - - - -Coleoptera - - - - - - - -Ephemeroptera - - - - - - - -Odonata - - - - - - - -Megaloptera - - - - - - - -Hemiptera - Corixidae - - - - - - - -Copepod - - - - - - - -Cladacera - - - - - - - -Unidentifiable Aquatic Invertebrate 17.76 (26.2) - - 0.49 (1.6) 14.08 (27.0)
Terrestrial Invertebrate - -Hemiptera - Aphid - - - - - - - -Hemiptera - Unidentified - - - - - - - -Thysanoptera - Thrip - - - - - - - -Hymenoptera - - - - - - - -Coleoptera - - - - - - - -Diptera - - - - - - - -Orthoptera - - - - - - - -Terrestrial Mite - - - - - - - -Unidentifiable Terrestrial Invertebrate - - - - - - - -
Miscellaneous Invertebrate 2.18 (5.8) - - 0.11 (0.4) - -Fungi - - - - - - - -Fish - - - - - - - -
Appendix 1. Continued.
62 127 167 225

69
Season Species Food Resource Site
Apr-07 BHS Diatom 68.84 (39.0) - - 48.10 (68.0) - -Amorphous Detritus 5.62 (3.1) - - 1.64 (2.3) - -Aquatic Vegetation - - - - - - - -Filamentous Algae - - - - - - - -Terrestrial Vegetation 0.31 (0.2) - - 0.26 (0.4) - -Aquatic Invertebrate
DipteraChironomid 24.69 (34.9) - - 49.01 (69.3) - -Simuliid 0.09 (0.1) - - - - - -Tipulid - - - - - - - -Ceratopogonid - - - - - - - -Unidentifiable - - - - - - - -
Gammarus 0.45 (0.6) - - - - - -Aquatic Mite - - - - 0.99 (1.4) - -Planorbidae - - - - - - - -Trichoptera - - - - - - - -Coleoptera - - - - - - - -Ephemeroptera - - - - - - - -Odonata - - - - - - - -Megaloptera - - - - - - - -Hemiptera - Corixidae - - - - - - - -Copepod - - - - - - - -Cladacera - - - - - - - -Unidentifiable Aquatic Invertebrate - - - - - - - -
Terrestrial InvertebrateHemiptera - Aphid - - - - - - - -Hemiptera - Unidentified - - - - - - - -Thysanoptera - Thrip - - - - - - - -Hymenoptera - - - - - - - -Coleoptera - - - - - - - -Diptera - - - - - - - -Orthoptera - - - - - - - -Terrestrial Mite - - - - - - - -Unidentifiable Terrestrial Invertebrate - - - - - - - -
Miscellaneous Invertebrate - - - - - - - -Fungi - - - - - - - -Fish - - - - - - - -
62 127 167 225
Appendix 1. Continued.

70
Season Species Food Resource Site
Apr-07 FMS Diatom 44.07 (26.7) 57.06 (49.8) 34.44 (31.4) 13.04 (19.0)Amorphous Detritus 47.92 (33.5) 8.70 (9.8) 9.25 (10.5) 11.18 (18.6)Aquatic Vegetation - - - - - - - -Filamentous Algae - - - - - - - -Terrestrial Vegetation 6.60 (8.6) 9.50 (16.4) 3.18 (2.8) 5.12 (7.3)Aquatic Invertebrate
DipteraChironomid 1.42 (2.5) 5.08 (6.5) 35.33 (37.3) 60.30 (37.0)Simuliid - - 2.38 (4.1) 1.56 (2.4) 6.61 (16.6)Tipulid - - - - - - 0.75 (1.9)Ceratopogonid - - - - - - - -Unidentifiable - - - - - - 0.94 (3.0)
Gammarus - - - - 0.10 (0.3) 0.77 (2.0)Aquatic Mite - - - - 0.96 (2.3) 0.23 (0.7)Planorbidae - - - - - - - -Trichoptera - - - - - - - -Coleoptera - - - - - - - -Ephemeroptera - - - - - - - -Odonata - - - - - - - -Megaloptera - - - - - - - -Hemiptera - Corixidae - - - - - - - -Copepod - - - - - - - -Cladacera - - - - - - - -Unidentifiable Aquatic Invertebrate - - - - 2.40 (5.4) 0.01 (0.0)
Terrestrial InvertebrateHemiptera - Aphid - - - - - - - -Hemiptera - Unidentified - - - - - - - -Thysanoptera - Thrip - - - - - - - -Hymenoptera - - - - - - - -Coleoptera - - - - - - - -Diptera - - - - - - - -Orthoptera - - - - - - - -Terrestrial Mite - - - - - - - -Unidentifiable Terrestrial Invertebrate - - 17.28 (29.9) 9.40 (23.0) - -
Miscellaneous Invertebrate - - - - 3.76 (6.8) 1.06 (3.3)Fungi - - - - - - - -Fish - - - - - - - -
Appendix 1. Continued.
62 127 167 225

71
Season Species Food Resource Site
Apr-07 SPD Diatom - - - - 8.53 (20.6) 21.07 (34.8)Amorphous Detritus - - - - 3.77 (7.9) 6.85 (18.4)Aquatic Vegetation - - - - - - - -Filamentous Algae - - - - - - - -Terrestrial Vegetation - - 2.61 (6.4) 3.05 (4.1) 2.45 (4.2)Aquatic Invertebrate
DipteraChironomid 41.77 (33.1) 33.54 (36.8) 51.43 (38.7) 32.48 (39.8)Simuliid 29.03 (43.3) 50.09 (37.8) 9.50 (15.4) 24.68 (33.5)Tipulid - - - - - - 4.12 (12.3)Ceratopogonid - - - - - - - -Unidentifiable - - - - - - - -
Gammarus - - - - - - - -Aquatic Mite - - - - - - - -Planorbidae - - - - - - - -Trichoptera 3.05 (6.8) - - - - - -Coleoptera - - 9.38 (23.0) - - - -Ephemeroptera - - - - - - - -Odonata - - - - - - - -Megaloptera - - - - - - - -Hemiptera - Corixidae - - - - - - - -Copepod - - - - - - - -Cladacera - - - - - - - -Unidentifiable Aquatic Invertebrate 16.04 (31.6) 4.38 (10.1) 22.96 (32.5) 3.08 (6.9)
Terrestrial InvertebrateHemiptera - Aphid - - - - - - - -Hemiptera - Unidentified - - - - - - - -Thysanoptera - Thrip - - - - - - - -Hymenoptera - - - - - - - -Coleoptera 10.11 (22.6) - - 0.68 (2.5) 5.27 (17.5)Diptera - - - - - - - -Orthoptera - - - - - - - -Terrestrial Mite - - - - - - - -Unidentifiable Terrestrial Invertebrate - - - - 0.08 (0.3) - -
Miscellaneous Invertebrate - - - - - - - -Fungi - - - - - - - -Fish - - - - - - - -
Appendix 1. Continued.
62 127 167 225
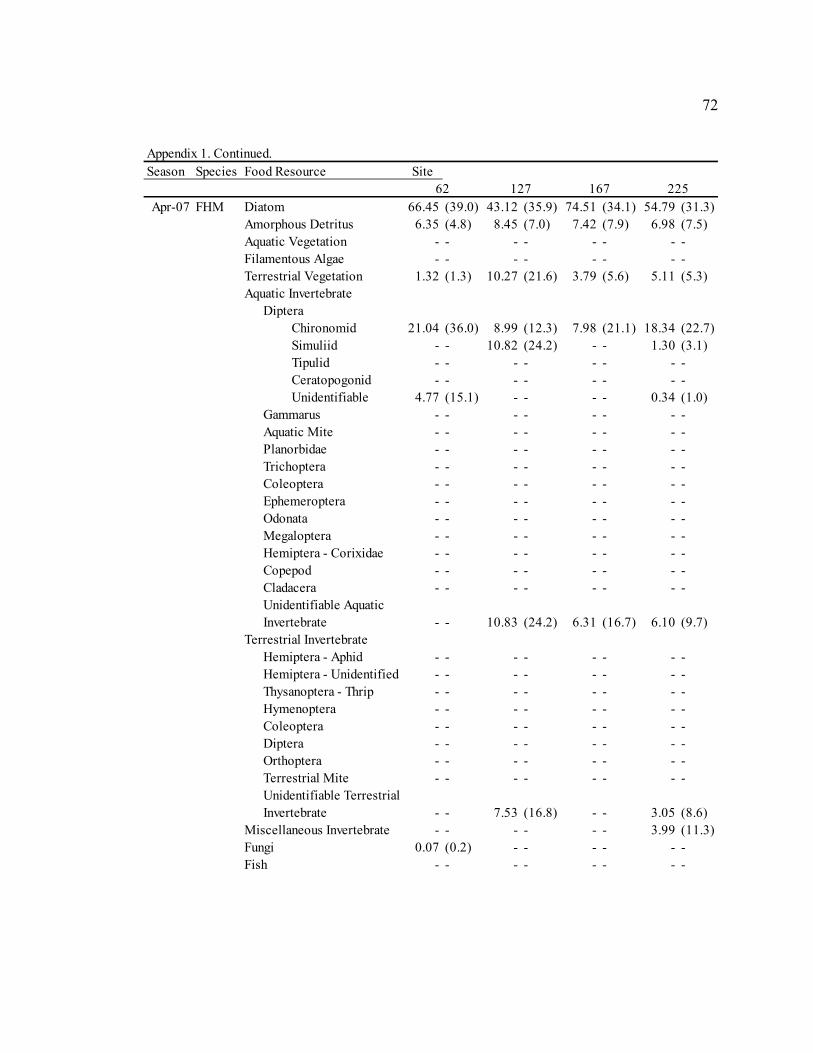
72
Season Species Food Resource Site
Apr-07 FHM Diatom 66.45 (39.0) 43.12 (35.9) 74.51 (34.1) 54.79 (31.3)Amorphous Detritus 6.35 (4.8) 8.45 (7.0) 7.42 (7.9) 6.98 (7.5)Aquatic Vegetation - - - - - - - -Filamentous Algae - - - - - - - -Terrestrial Vegetation 1.32 (1.3) 10.27 (21.6) 3.79 (5.6) 5.11 (5.3)Aquatic Invertebrate
DipteraChironomid 21.04 (36.0) 8.99 (12.3) 7.98 (21.1) 18.34 (22.7)Simuliid - - 10.82 (24.2) - - 1.30 (3.1)Tipulid - - - - - - - -Ceratopogonid - - - - - - - -Unidentifiable 4.77 (15.1) - - - - 0.34 (1.0)
Gammarus - - - - - - - -Aquatic Mite - - - - - - - -Planorbidae - - - - - - - -Trichoptera - - - - - - - -Coleoptera - - - - - - - -Ephemeroptera - - - - - - - -Odonata - - - - - - - -Megaloptera - - - - - - - -Hemiptera - Corixidae - - - - - - - -Copepod - - - - - - - -Cladacera - - - - - - - -Unidentifiable Aquatic Invertebrate - - 10.83 (24.2) 6.31 (16.7) 6.10 (9.7)
Terrestrial InvertebrateHemiptera - Aphid - - - - - - - -Hemiptera - Unidentified - - - - - - - -Thysanoptera - Thrip - - - - - - - -Hymenoptera - - - - - - - -Coleoptera - - - - - - - -Diptera - - - - - - - -Orthoptera - - - - - - - -Terrestrial Mite - - - - - - - -Unidentifiable Terrestrial Invertebrate - - 7.53 (16.8) - - 3.05 (8.6)
Miscellaneous Invertebrate - - - - - - 3.99 (11.3)Fungi 0.07 (0.2) - - - - - -Fish - - - - - - - -
62 127 167 225
Appendix 1. Continued.

73
Season Species Food Resource Site
Jul-07 BHS Diatom 43.72 (61.8) - - - - - -Amorphous Detritus 3.92 (5.5) - - - - - -Aquatic Vegetation - - - - - - - -Filamentous Algae - - - - - - - -Terrestrial Vegetation 2.03 (2.9) - - - - - -Aquatic Invertebrate
DipteraChironomid 50.33 (70.2) - - - - - -Simuliid - - - - - - - -Tipulid - - - - - - - -Ceratopogonid - - - - - - - -Unidentifiable - - - - - - - -
Gammarus - - - - - - - -Aquatic Mite - - - - - - - -Planorbidae - - - - - - - -Trichoptera - - - - - - - -Coleoptera - - - - - - - -Ephemeroptera - - - - - - - -Odonata - - - - - - - -Megaloptera - - - - - - - -Hemiptera - Corixidae - - - - - - - -Copepod - - - - - - - -Cladacera - - - - - - - -Unidentifiable Aquatic Invertebrate - - - - - - - -
Terrestrial InvertebrateHemiptera - Aphid - - - - - - - -Hemiptera - Unidentified - - - - - - - -Thysanoptera - Thrip - - - - - - - -Hymenoptera - - - - - - - -Coleoptera - - - - - - - -Diptera - - - - - - - -Orthoptera - - - - - - - -Terrestrial Mite - - - - - - - -Unidentifiable Terrestrial Invertebrate - - - - - - - -
Miscellaneous Invertebrate - - - - - - - -Fungi - - - - - - - -Fish - - - - - - - -
Appendix 1. Continued.
62 127 167 225
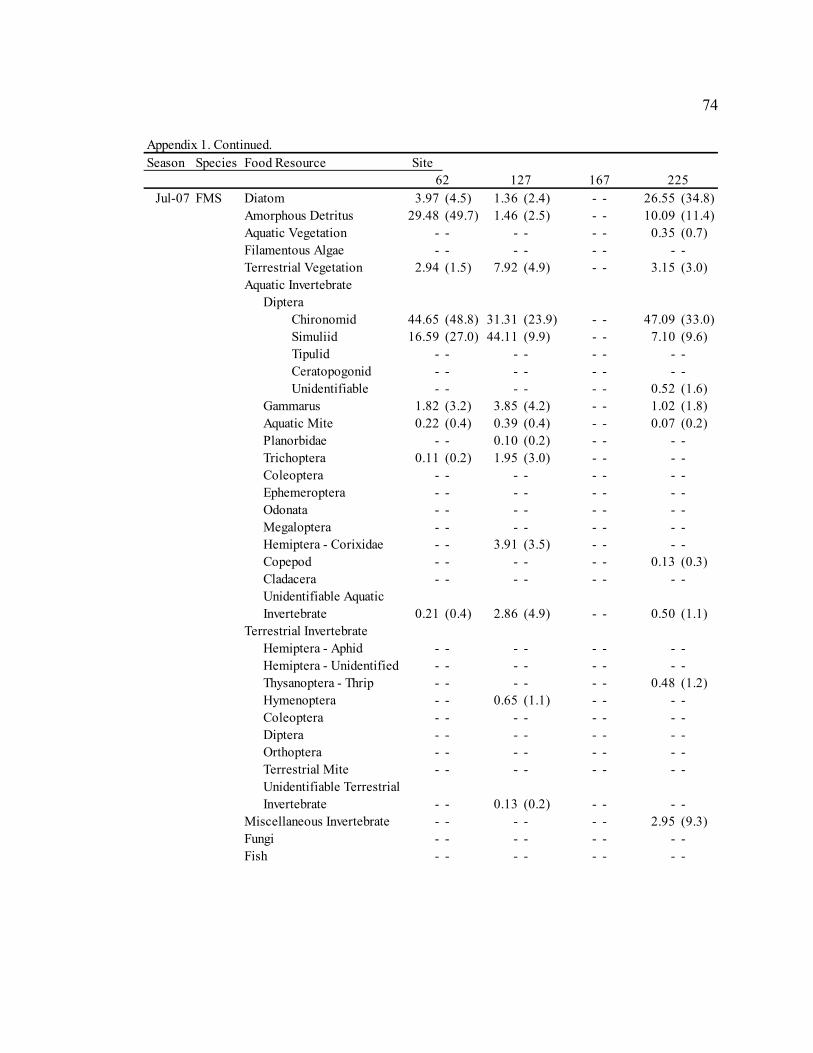
74
Season Species Food Resource Site
Jul-07 FMS Diatom 3.97 (4.5) 1.36 (2.4) - - 26.55 (34.8)Amorphous Detritus 29.48 (49.7) 1.46 (2.5) - - 10.09 (11.4)Aquatic Vegetation - - - - - - 0.35 (0.7)Filamentous Algae - - - - - - - -Terrestrial Vegetation 2.94 (1.5) 7.92 (4.9) - - 3.15 (3.0)Aquatic Invertebrate
DipteraChironomid 44.65 (48.8) 31.31 (23.9) - - 47.09 (33.0)Simuliid 16.59 (27.0) 44.11 (9.9) - - 7.10 (9.6)Tipulid - - - - - - - -Ceratopogonid - - - - - - - -Unidentifiable - - - - - - 0.52 (1.6)
Gammarus 1.82 (3.2) 3.85 (4.2) - - 1.02 (1.8)Aquatic Mite 0.22 (0.4) 0.39 (0.4) - - 0.07 (0.2)Planorbidae - - 0.10 (0.2) - - - -Trichoptera 0.11 (0.2) 1.95 (3.0) - - - -Coleoptera - - - - - - - -Ephemeroptera - - - - - - - -Odonata - - - - - - - -Megaloptera - - - - - - - -Hemiptera - Corixidae - - 3.91 (3.5) - - - -Copepod - - - - - - 0.13 (0.3)Cladacera - - - - - - - -Unidentifiable Aquatic Invertebrate 0.21 (0.4) 2.86 (4.9) - - 0.50 (1.1)
Terrestrial InvertebrateHemiptera - Aphid - - - - - - - -Hemiptera - Unidentified - - - - - - - -Thysanoptera - Thrip - - - - - - 0.48 (1.2)Hymenoptera - - 0.65 (1.1) - - - -Coleoptera - - - - - - - -Diptera - - - - - - - -Orthoptera - - - - - - - -Terrestrial Mite - - - - - - - -Unidentifiable Terrestrial Invertebrate - - 0.13 (0.2) - - - -
Miscellaneous Invertebrate - - - - - - 2.95 (9.3)Fungi - - - - - - - -Fish - - - - - - - -
Appendix 1. Continued.
62 127 167 225

75
Season Species Food Resource Site
Jul-07 SPD Diatom 41.31 (35.7) 2.63 (7.9) - - 10.34 (28.9)Amorphous Detritus 10.01 (15.9) 1.77 (5.3) - - 1.96 (4.3)Aquatic Vegetation 0.09 (0.3) - - - - 0.46 (1.5)Filamentous Algae - - - - - - - -Terrestrial Vegetation 2.89 (6.1) 3.38 (4.0) 4.18 (9.9) 12.09 (24.7)Aquatic Invertebrate
DipteraChironomid 35.85 (41.6) 39.63 (30.3) 48.24 (29.7) 19.69 (22.6)Simuliid 7.66 (12.6) 43.37 (30.6) 35.29 (23.1) 15.37 (20.3)Tipulid - - - - - - - -Ceratopogonid - - - - - - - -Unidentifiable - - 0.91 (2.7) - - 0.91 (2.9)
Gammarus - - - - - - - -Aquatic Mite - - - - 0.19 (0.5) - -Planorbidae - - - - - - - -Trichoptera 2.09 (4.4) 4.93 (14.2) - - - -Coleoptera - - - - - - - -Ephemeroptera - - - - - - - -Odonata - - - - - - - -Megaloptera - - - - 1.02 (2.9) - -Hemiptera - Corixidae - - 2.30 (5.9) - - 4.34 (13.7)Copepod - - - - - - - -Cladacera - - - - - - - -Unidentifiable Aquatic Invertebrate 0.12 (0.4) 0.36 (1.1) 2.33 (3.5) 2.70 (8.5)
Terrestrial InvertebrateHemiptera - Aphid - - - - - - - -Hemiptera - Unidentified - - - - - - 27.96 (35.1)Thysanoptera - Thrip - - - - 4.72 (9.4) - -Hymenoptera - - - - 2.96 (4.3) 0.50 (1.6)Coleoptera - - 0.57 (1.7) 1.08 (3.0) - -Diptera - - - - - - - -Orthoptera - - - - - - - -Terrestrial Mite - - - - - - 0.91 (2.7)Unidentifiable Terrestrial Invertebrate - - 0.16 (0.5) - - 2.77 (8.7)
Miscellaneous Invertebrate - - - - - - - -Fungi - - - - - - - -Fish - - - - - - - -
62 127 167 225
Appendix 1. Continued.

76
Season Species Food Resource Site
Jul-07 FHM Diatom 43.01 (34.7) 29.62 (25.7) 79.46 (28.3) 68.12 N/AAmorphous Detritus 9.54 (5.9) 13.14 (19.9) 6.17 (2.7) 19.11 N/AAquatic Vegetation 1.11 (1.9) 2.29 (3.2) - - 8.35 N/AFilamentous Algae 1.20 (3.6) - - - - - -Terrestrial Vegetation 3.81 (3.7) 6.99 (9.3) 4.37 (4.6) 4.42 N/AAquatic Invertebrate
DipteraChironomid 33.19 (35.6) 20.44 (18.9) - - - -Simuliid 4.55 (8.4) 21.30 (15.7) 9.26 (29.3) - -Tipulid - - - - - - - -Ceratopogonid - - - - - - - -Unidentifiable 1.18 (3.5) 1.65 (3.3) - - - -
Gammarus - - - - - - - -Aquatic Mite - - - - - - - -Planorbidae - - - - - - - -Trichoptera 0.07 (0.2) - - - - - -Coleoptera - - - - - - - -Ephemeroptera - - - - - - - -Odonata - - - - - - - -Megaloptera - - - - - - - -Hemiptera - Corixidae - - - - - - - -Copepod - - - - - - - -Cladacera - - - - - - - -Unidentifiable Aquatic Invertebrate 2.33 (5.3) 4.57 (6.0) - - - -
Terrestrial InvertebrateHemiptera - Aphid - - - - - - - -Hemiptera - Unidentified - - - - - - - -Thysanoptera - Thrip - - - - 0.74 (2.3) - -Hymenoptera - - - - - - - -Coleoptera - - - - - - - -Diptera - - - - - - - -Orthoptera - - - - - - - -Terrestrial Mite - - - - - - - -Unidentifiable Terrestrial Invertebrate - - - - - - - -
Miscellaneous Invertebrate - - - - - - - -Fungi - - - - - - - -Fish - - - - - - - -
Appendix 1. Continued.
62 127 167 225

77
Season Species Food Resource Site
Sep-07 BHS Diatom 70.78 (15.8) 71.22 N/A 36.83 (37.4) - -Amorphous Detritus 20.62 (13.0) 14.61 N/A 15.40 (4.4) - -Aquatic Vegetation 0.50 (0.9) - - 1.63 (3.6) - -Filamentous Algae - - - - - - - -Terrestrial Vegetation 5.82 (7.5) 14.18 N/A 15.35 (14.4) - -Aquatic Invertebrate
DipteraChironomid 0.05 (0.1) - - 17.58 (17.8) - -Simuliid 1.32 (2.5) - - 4.70 (6.5) - -Tipulid - - - - - - - -Ceratopogonid - - - - - - - -Unidentifiable - - - - - - - -
Gammarus - - - - 1.06 (2.6) - -Aquatic Mite - - - - - - - -Planorbidae - - - - - - - -Trichoptera - - - - - - - -Coleoptera - - - - - - - -Ephemeroptera - - - - - - - -Odonata - - - - - - - -Megaloptera - - - - - - - -Hemiptera - Corixidae - - - - - - - -Copepod - - - - 1.80 (3.9) - -Cladacera - - - - - - - -Unidentifiable Aquatic Invertebrate 0.91 (2.6) - - 4.14 (4.9) - -
Terrestrial InvertebrateHemiptera - Aphid - - - - - - - -Hemiptera - Unidentified - - - - - - - -Thysanoptera - Thrip - - - - 0.74 (1.3) - -Hymenoptera - - - - 0.64 (1.6) - -Coleoptera - - - - 0.14 (0.3) - -Diptera - - - - - - - -Orthoptera - - - - - - - -Terrestrial Mite - - - - - - - -Unidentifiable Terrestrial Invertebrate - - - - - - - -
Miscellaneous Invertebrate - - - - - - - -Fungi - - - - - - - -Fish - - - - - - - -
Appendix 1. Continued.
62 127 167 225

78
Season Species Food Resource Site
Sep-07 FMS Diatom 4.08 (6.7) 62.58 N/A 14.32 (21.4) 13.14 (17.9)Amorphous Detritus 4.82 (7.6) 8.58 N/A 15.53 (16.8) 24.76 (14.5)Aquatic Vegetation 0.97 (2.0) - - 0.62 (2.0) 0.48 (0.7)Filamentous Algae - - - - 0.59 (1.9) - -Terrestrial Vegetation 34.31 (39.1) 11.35 N/A 25.84 (12.3) 30.27 (26.4)Aquatic Invertebrate
DipteraChironomid 25.28 (29.4) - - 23.42 (15.8) 23.37 (27.0)Simuliid 24.16 (32.6) - - 2.91 (4.3) 1.56 (2.8)Tipulid - - - - - - - -Ceratopogonid - - - - - - - -Unidentifiable 0.15 (0.3) - - 2.39 (5.1) 0.63 (1.2)
Gammarus 0.71 (1.6) 17.48 N/A 0.77 (2.4) 0.21 (0.6)Aquatic Mite 0.07 (0.2) - - 0.24 (0.8) 0.85 (0.9)Planorbidae 0.06 (0.2) - - 0.04 (0.1) 0.05 (0.1)Trichoptera 0.20 (0.6) - - 1.89 (4.1) - -Coleoptera 0.06 (0.2) - - 0.24 (0.6) - -Ephemeroptera - - - - - - - -Odonata - - - - - - - -Megaloptera - - - - - - - -Hemiptera - Corixidae - - - - 0.26 (0.8) - -Copepod 0.02 (0.1) - - 0.65 (1.1) - -Cladacera 0.10 (0.3) - - - - - -Unidentifiable Aquatic Invertebrate 1.88 (3.4) - - 7.60 (9.6) 2.41 (4.8)
Terrestrial InvertebrateHemiptera - Aphid - - - - - - - -Hemiptera - Unidentified - - - - 0.31 (1.0) 0.29 (0.8)Thysanoptera - Thrip 0.79 (1.7) - - 0.57 (1.0) 0.56 (1.4)Hymenoptera 1.24 (3.0) - - 0.71 (1.9) - -Coleoptera 0.61 (1.5) - - 0.31 (0.5) 0.95 (2.0)Diptera 0.13 (0.4) - - - - - -Orthoptera - - - - - - - -Terrestrial Mite - - - - 0.79 (1.5) - -Unidentifiable Terrestrial Invertebrate 0.36 (1.2) - - - - 0.48 (1.4)
Miscellaneous Invertebrate - - - - - - - -Fungi - - - - - - - -Fish - - - - - - - -
62 127 167 225
Appendix 1. Continued.

79
Season Species Food Resource Site
Sep-07 SPD Diatom 51.36 (36.9) 50.51 (31.1) 19.03 (24.0) 21.03 (19.7)Amorphous Detritus 8.13 (7.1) 9.85 (14.0) 13.89 (13.6) 17.39 (21.6)Aquatic Vegetation 2.57 (4.0) 1.03 (3.2) 0.54 (1.2) 5.36 (13.7)Filamentous Algae - - - - - - - -Terrestrial Vegetation 1.09 (1.7) 17.15 (24.0) 22.95 (16.0) 23.33 (12.7)Aquatic Invertebrate
DipteraChironomid 0.95 (2.2) 0.45 (1.2) 20.06 (44.7) 11.18 (10.8)Simuliid 35.29 (44.0) 10.47 (9.1) 0.25 (0.6) 3.65 (5.4)Tipulid - - - - - - - -Ceratopogonid - - - - - - - -Unidentifiable 0.11 (0.3) - - - - 1.61 (4.5)
Gammarus - - - - - - - -Aquatic Mite - - - - 0.88 (2.0) - -Planorbidae - - - - - - - -Trichoptera 0.16 (0.5) - - - - - -Coleoptera - - - - - - - -Ephemeroptera - - - - - - - -Odonata - - - - - - - -Megaloptera - - - - - - - -Hemiptera - Corixidae - - - - - - - -Copepod - - - - - - - -Cladacera - - - - - - - -Unidentifiable Aquatic Invertebrate 0.35 (0.8) 2.63 (4.0) 22.39 (32.4) 8.33 (13.5)
Terrestrial InvertebrateHemiptera - Aphid - - - - - - - -Hemiptera - Unidentified - - - - - - - -Thysanoptera - Thrip - - - - - - - -Hymenoptera - - 1.07 (2.7) - - 7.02 (14.9)Coleoptera - - - - - - - -Diptera - - - - - - - -Orthoptera - - 2.78 (8.8) - - - -Terrestrial Mite - - - - - - - -Unidentifiable Terrestrial Invertebrate - - 4.06 (10.5) - - 1.11 (3.1)
Miscellaneous Invertebrate - - - - - - - -Fungi - - - - - - - -Fish - - - - - - - -
Appendix 1. Continued.
62 127 167 225

80
Season Species Food Resource Site
Sep-07 FHM Diatom 31.86 (32.1) 35.30 (49.9) 27.28 (30.0) - -Amorphous Detritus 18.83 (18.6) 4.01 (5.7) 16.66 (11.8) - -Aquatic Vegetation 1.97 (6.2) - - 0.04 (0.1) - -Filamentous Algae - - - - - - - -Terrestrial Vegetation 7.75 (9.2) 19.53 (0.1) 16.12 (10.9) - -Aquatic Invertebrate
DipteraChironomid 5.00 (12.3) 11.74 (16.6) 21.78 (25.3) - -Simuliid 29.61 (41.2) 28.52 (40.3) 0.60 (1.7) - -Tipulid - - - - - - - -Ceratopogonid - - - - - - - -Unidentifiable - - 0.90 (1.3) 1.88 (4.2) - -
Gammarus - - - - - - - -Aquatic Mite - - - - - - - -Planorbidae 0.04 (0.1) - - - - - -Trichoptera - - - - 1.22 (3.9) - -Coleoptera - - - - - - - -Ephemeroptera - - - - - - - -Odonata - - - - - - - -Megaloptera - - - - - - - -Hemiptera - Corixidae - - - - - - - -Copepod - - - - - - - -Cladacera - - - - - - - -Unidentifiable Aquatic Invertebrate 2.52 (5.0) - - 14.43 (19.0) - -
Terrestrial InvertebrateHemiptera - Aphid - - - - - - - -Hemiptera - Unidentified - - - - - - - -Thysanoptera - Thrip 0.33 (1.0) - - - - - -Hymenoptera - - - - - - - -Coleoptera - - - - - - - -Diptera 1.38 (4.4) - - - - - -Orthoptera - - - - - - - -Terrestrial Mite - - - - - - - -Unidentifiable Terrestrial Invertebrate 0.72 (2.3) - - - - - -
Miscellaneous Invertebrate - - - - - - - -Fungi - - - - - - - -Fish - - - - - - - -
Appendix 1. Continued.
62 127 167 225
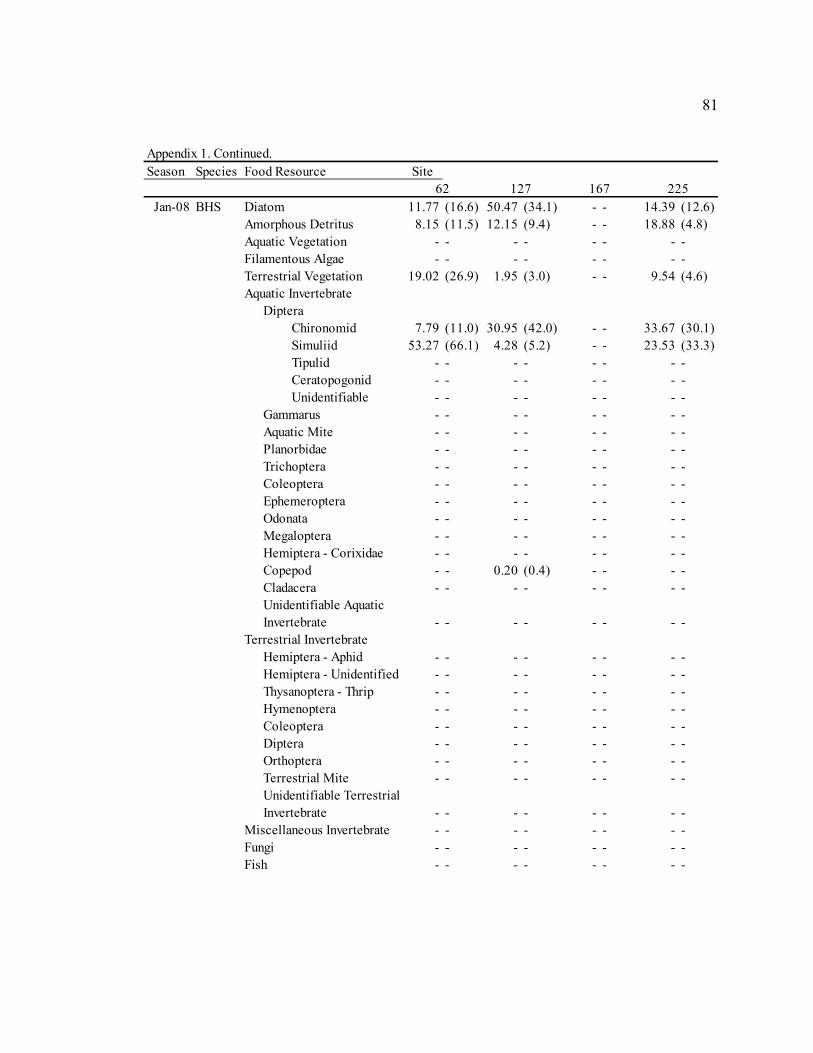
81
Season Species Food Resource Site
Jan-08 BHS Diatom 11.77 (16.6) 50.47 (34.1) - - 14.39 (12.6)Amorphous Detritus 8.15 (11.5) 12.15 (9.4) - - 18.88 (4.8)Aquatic Vegetation - - - - - - - -Filamentous Algae - - - - - - - -Terrestrial Vegetation 19.02 (26.9) 1.95 (3.0) - - 9.54 (4.6)Aquatic Invertebrate
DipteraChironomid 7.79 (11.0) 30.95 (42.0) - - 33.67 (30.1)Simuliid 53.27 (66.1) 4.28 (5.2) - - 23.53 (33.3)Tipulid - - - - - - - -Ceratopogonid - - - - - - - -Unidentifiable - - - - - - - -
Gammarus - - - - - - - -Aquatic Mite - - - - - - - -Planorbidae - - - - - - - -Trichoptera - - - - - - - -Coleoptera - - - - - - - -Ephemeroptera - - - - - - - -Odonata - - - - - - - -Megaloptera - - - - - - - -Hemiptera - Corixidae - - - - - - - -Copepod - - 0.20 (0.4) - - - -Cladacera - - - - - - - -Unidentifiable Aquatic Invertebrate - - - - - - - -
Terrestrial InvertebrateHemiptera - Aphid - - - - - - - -Hemiptera - Unidentified - - - - - - - -Thysanoptera - Thrip - - - - - - - -Hymenoptera - - - - - - - -Coleoptera - - - - - - - -Diptera - - - - - - - -Orthoptera - - - - - - - -Terrestrial Mite - - - - - - - -Unidentifiable Terrestrial Invertebrate - - - - - - - -
Miscellaneous Invertebrate - - - - - - - -Fungi - - - - - - - -Fish - - - - - - - -
62 127 167 225
Appendix 1. Continued.

82
Season Species Food Resource Site
Jan-08 FMS Diatom 63.59 (16.4) 58.46 (50.9) 9.22 (6.3) 13.48 (22.3)Amorphous Detritus 12.50 (5.4) 5.31 (4.9) 28.66 (22.7) 21.75 (30.0)Aquatic Vegetation 1.45 (2.5) - - - - - -Filamentous Algae - - - - - - - -Terrestrial Vegetation 9.98 (10.0) 1.08 (1.0) 10.54 (7.9) 20.07 (27.3)Aquatic Invertebrate
DipteraChironomid 6.65 (11.2) 13.41 (19.3) 40.39 (24.5) 37.06 (38.5)Simuliid 5.07 (4.5) 14.32 (24.1) 9.14 (14.2) 6.53 (9.3)Tipulid - - - - - - - -Ceratopogonid - - - - - - - -Unidentifiable - - 6.65 (11.5) 1.57 (4.7) 0.41 (1.2)
Gammarus - - - - - - - -Aquatic Mite - - - - - - - -Planorbidae - - - - 0.08 (0.2) - -Trichoptera 0.64 (1.1) - - 0.15 (0.4) - -Coleoptera - - - - - - - -Ephemeroptera - - - - - - - -Odonata - - - - - - - -Megaloptera - - - - - - - -Hemiptera - Corixidae - - - - - - - -Copepod 0.12 (0.2) 0.16 (0.1) - - - -Cladacera - - - - - - - -Unidentifiable Aquatic Invertebrate - - 0.60 (1.0) 0.25 (0.5) 0.69 (2.0)
Terrestrial InvertebrateHemiptera - Aphid - - - - - - - -Hemiptera - Unidentified - - - - - - - -Thysanoptera - Thrip - - - - - - - -Hymenoptera - - - - - - - -Coleoptera - - - - - - - -Diptera - - - - - - - -Orthoptera - - - - - - - -Terrestrial Mite - - - - - - - -Unidentifiable Terrestrial Invertebrate - - - - - - - -
Miscellaneous Invertebrate - - - - - - - -Fungi - - - - - - - -Fish - - - - - - - -
Appendix 1. Continued.
62 127 167 225

83
Season Species Food Resource Site
Jan-08 SPD Diatom 8.99 (25.4) - - 0.79 (1.8) 1.28 (4.1)Amorphous Detritus 0.78 (2.2) - - 2.90 (6.1) 7.72 (24.4)Aquatic Vegetation - - - - - - 0.26 (0.8)Filamentous Algae - - - - - - - -Terrestrial Vegetation 1.91 (3.8) - - 0.56 (1.3) 4.24 (7.9)Aquatic Invertebrate
DipteraChironomid 47.85 (31.1) 26.00 N/A 45.23 (33.0) 60.90 (38.9)Simuliid 35.19 (30.1) 74.00 N/A 36.02 (31.6) 24.21 (32.2)Tipulid - - - - - - - -Ceratopogonid - - - - - - - -Unidentifiable - - - - 0.60 (1.9) - -
Gammarus - - - - 8.18 (22.5) - -Aquatic Mite - - - - - - - -Planorbidae - - - - - - - -Trichoptera 0.34 (1.0) - - 3.22 (10.2) - -Coleoptera - - - - - - - -Ephemeroptera - - - - - - - -Odonata - - - - - - - -Megaloptera - - - - - - - -Hemiptera - Corixidae - - - - - - - -Copepod - - - - - - - -Cladacera - - - - - - - -Unidentifiable Aquatic Invertebrate 4.95 (10.2) - - 2.50 (7.8) 1.39 (4.4)
Terrestrial InvertebrateHemiptera - Aphid - - - - - - - -Hemiptera - Unidentified - - - - - - - -Thysanoptera - Thrip - - - - - - - -Hymenoptera - - - - - - - -Coleoptera - - - - - - - -Diptera - - - - - - - -Orthoptera - - - - - - - -Terrestrial Mite - - - - - - - -Unidentifiable Terrestrial Invertebrate - - - - - - - -
Miscellaneous Invertebrate - - - - - - - -Fungi - - - - - - - -Fish - - - - - - - -
Appendix 1. Continued.
62 127 167 225
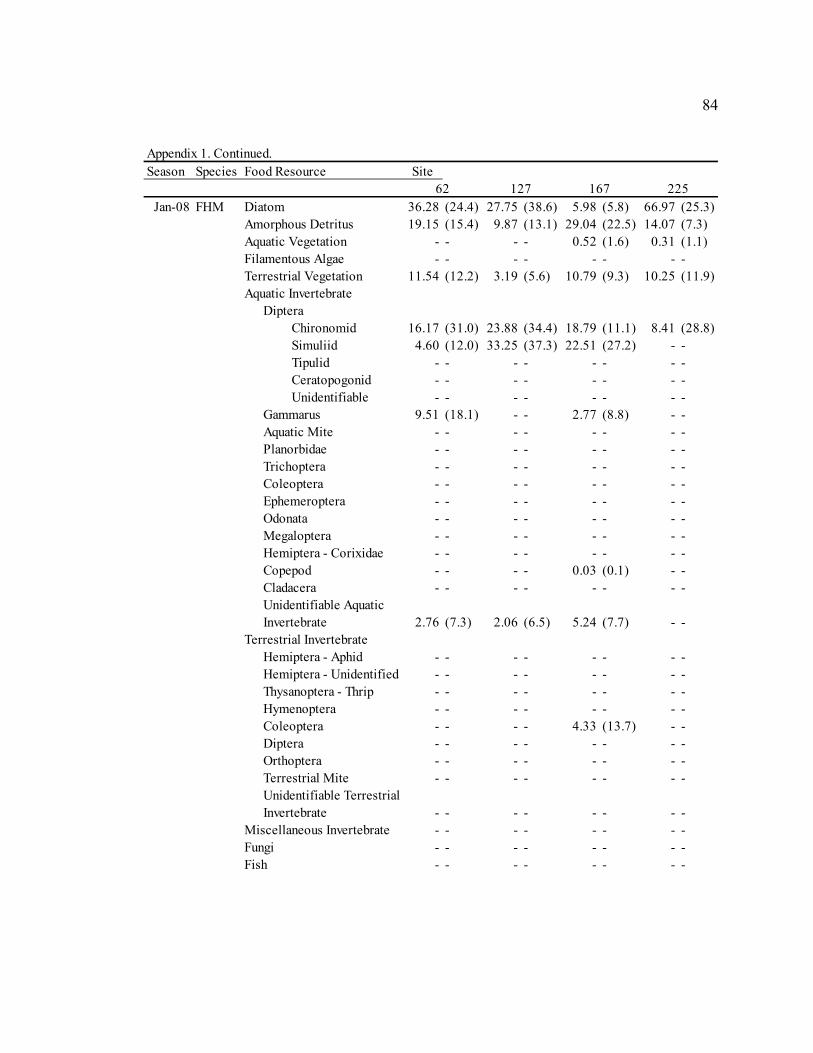
84
Season Species Food Resource Site
Jan-08 FHM Diatom 36.28 (24.4) 27.75 (38.6) 5.98 (5.8) 66.97 (25.3)Amorphous Detritus 19.15 (15.4) 9.87 (13.1) 29.04 (22.5) 14.07 (7.3)Aquatic Vegetation - - - - 0.52 (1.6) 0.31 (1.1)Filamentous Algae - - - - - - - -Terrestrial Vegetation 11.54 (12.2) 3.19 (5.6) 10.79 (9.3) 10.25 (11.9)Aquatic Invertebrate
DipteraChironomid 16.17 (31.0) 23.88 (34.4) 18.79 (11.1) 8.41 (28.8)Simuliid 4.60 (12.0) 33.25 (37.3) 22.51 (27.2) - -Tipulid - - - - - - - -Ceratopogonid - - - - - - - -Unidentifiable - - - - - - - -
Gammarus 9.51 (18.1) - - 2.77 (8.8) - -Aquatic Mite - - - - - - - -Planorbidae - - - - - - - -Trichoptera - - - - - - - -Coleoptera - - - - - - - -Ephemeroptera - - - - - - - -Odonata - - - - - - - -Megaloptera - - - - - - - -Hemiptera - Corixidae - - - - - - - -Copepod - - - - 0.03 (0.1) - -Cladacera - - - - - - - -Unidentifiable Aquatic Invertebrate 2.76 (7.3) 2.06 (6.5) 5.24 (7.7) - -
Terrestrial InvertebrateHemiptera - Aphid - - - - - - - -Hemiptera - Unidentified - - - - - - - -Thysanoptera - Thrip - - - - - - - -Hymenoptera - - - - - - - -Coleoptera - - - - 4.33 (13.7) - -Diptera - - - - - - - -Orthoptera - - - - - - - -Terrestrial Mite - - - - - - - -Unidentifiable Terrestrial Invertebrate - - - - - - - -
Miscellaneous Invertebrate - - - - - - - -Fungi - - - - - - - -Fish - - - - - - - -
62 127 167 225
Appendix 1. Continued.

85
Season Species Food Resource Site
Sep-08 BHS Diatom 70.03 (17.1) 78.07 (15.2) 75.44 (13.1) 61.74 (30.8)Amorphous Detritus 20.91 (13.6) 14.55 (9.3) 15.88 (8.3) 15.76 (10.9)Aquatic Vegetation - - - - - - - -Filamentous Algae - - - - - - - -Terrestrial Vegetation 5.54 (3.8) 3.93 (4.5) 8.40 (6.4) 6.30 (11.0)Aquatic Invertebrate
DipteraChironomid 1.86 (4.6) 2.71 (3.3) 0.10 (0.2) 12.52 (25.6)Simuliid 1.09 (2.4) 0.10 (0.3) - - 1.52 (4.8)Tipulid - - - - - - - -Ceratopogonid - - - - - - - -Unidentifiable 0.46 (1.1) 0.09 (0.3) - - - -
Gammarus 0.09 (0.2) - - - - - -Aquatic Mite - - - - - - 0.27 (0.8)Planorbidae - - - - - - - -Trichoptera - - - - - - - -Coleoptera - - - - - - - -Ephemeroptera - - - - - - - -Odonata - - - - - - - -Megaloptera - - - - - - - -Hemiptera - Corixidae - - - - - - - -Copepod 0.01 (0.0) 0.03 (0.1) 0.16 (0.4) 0.39 (1.1)Cladacera - - - - - - - -Unidentifiable Aquatic Invertebrate - - - - - - 0.62 (2.0)
Terrestrial InvertebrateHemiptera - Aphid - - - - - - - -Hemiptera - Unidentified - - - - - - - -Thysanoptera - Thrip - - 0.51 (1.6) - - 0.89 (2.8)Hymenoptera - - - - - - - -Coleoptera - - - - - - - -Diptera - - - - - - - -Orthoptera - - - - - - - -Terrestrial Mite - - - - - - - -Unidentifiable Terrestrial Invertebrate - - - - - - - -
Miscellaneous Invertebrate - - - - - - - -Fungi - - - - - - - -Fish - - - - - - - -
Appendix 1. Continued.
62 127 167 225
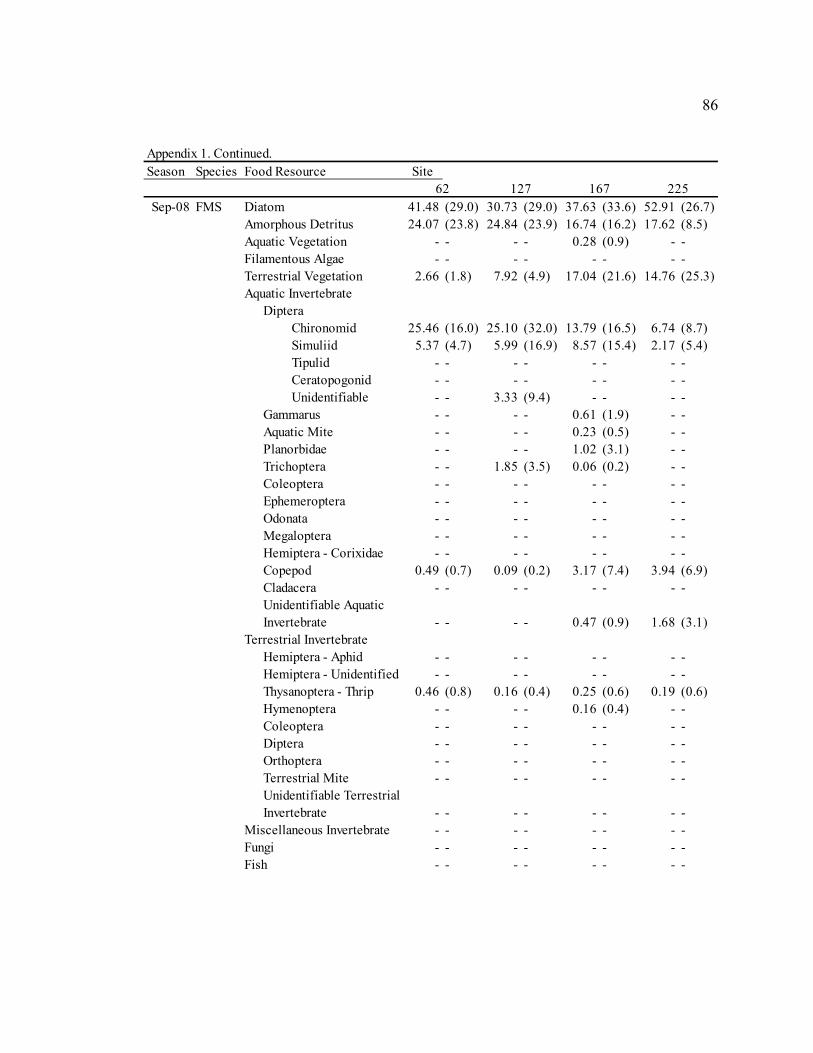
86
Season Species Food Resource Site
Sep-08 FMS Diatom 41.48 (29.0) 30.73 (29.0) 37.63 (33.6) 52.91 (26.7)Amorphous Detritus 24.07 (23.8) 24.84 (23.9) 16.74 (16.2) 17.62 (8.5)Aquatic Vegetation - - - - 0.28 (0.9) - -Filamentous Algae - - - - - - - -Terrestrial Vegetation 2.66 (1.8) 7.92 (4.9) 17.04 (21.6) 14.76 (25.3)Aquatic Invertebrate
DipteraChironomid 25.46 (16.0) 25.10 (32.0) 13.79 (16.5) 6.74 (8.7)Simuliid 5.37 (4.7) 5.99 (16.9) 8.57 (15.4) 2.17 (5.4)Tipulid - - - - - - - -Ceratopogonid - - - - - - - -Unidentifiable - - 3.33 (9.4) - - - -
Gammarus - - - - 0.61 (1.9) - -Aquatic Mite - - - - 0.23 (0.5) - -Planorbidae - - - - 1.02 (3.1) - -Trichoptera - - 1.85 (3.5) 0.06 (0.2) - -Coleoptera - - - - - - - -Ephemeroptera - - - - - - - -Odonata - - - - - - - -Megaloptera - - - - - - - -Hemiptera - Corixidae - - - - - - - -Copepod 0.49 (0.7) 0.09 (0.2) 3.17 (7.4) 3.94 (6.9)Cladacera - - - - - - - -Unidentifiable Aquatic Invertebrate - - - - 0.47 (0.9) 1.68 (3.1)
Terrestrial InvertebrateHemiptera - Aphid - - - - - - - -Hemiptera - Unidentified - - - - - - - -Thysanoptera - Thrip 0.46 (0.8) 0.16 (0.4) 0.25 (0.6) 0.19 (0.6)Hymenoptera - - - - 0.16 (0.4) - -Coleoptera - - - - - - - -Diptera - - - - - - - -Orthoptera - - - - - - - -Terrestrial Mite - - - - - - - -Unidentifiable Terrestrial Invertebrate - - - - - - - -
Miscellaneous Invertebrate - - - - - - - -Fungi - - - - - - - -Fish - - - - - - - -
Appendix 1. Continued.
62 127 167 225
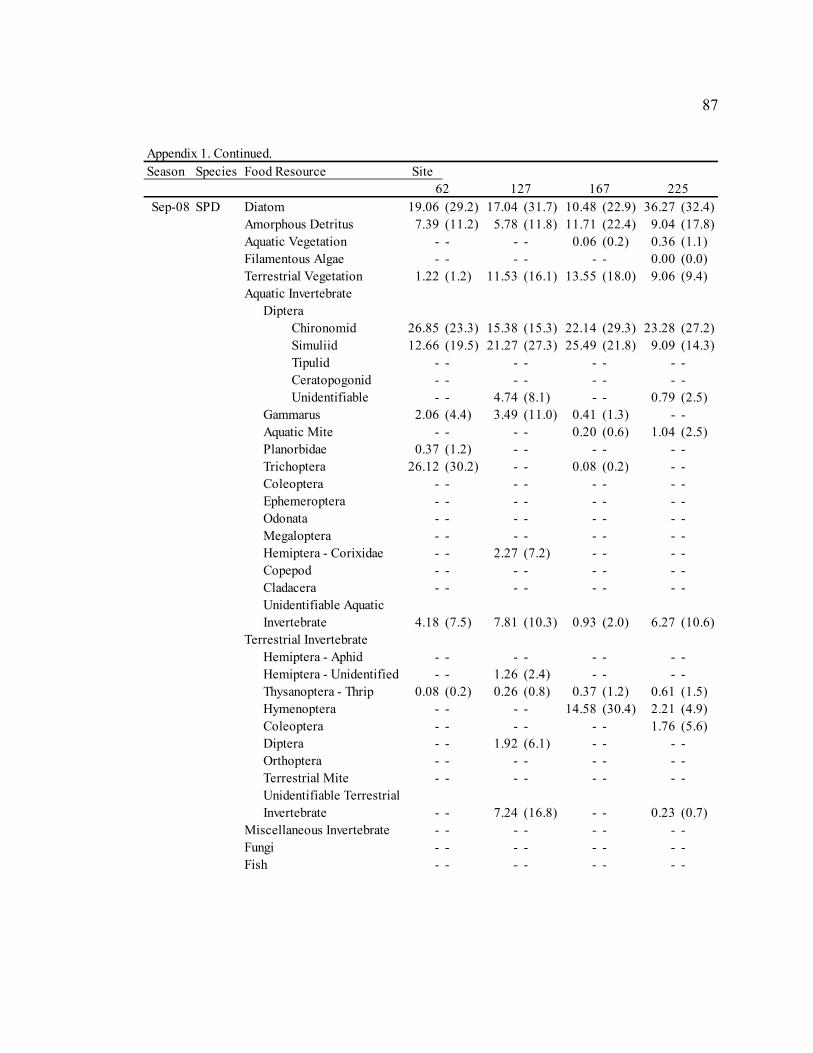
87
Season Species Food Resource Site
Sep-08 SPD Diatom 19.06 (29.2) 17.04 (31.7) 10.48 (22.9) 36.27 (32.4)Amorphous Detritus 7.39 (11.2) 5.78 (11.8) 11.71 (22.4) 9.04 (17.8)Aquatic Vegetation - - - - 0.06 (0.2) 0.36 (1.1)Filamentous Algae - - - - - - 0.00 (0.0)Terrestrial Vegetation 1.22 (1.2) 11.53 (16.1) 13.55 (18.0) 9.06 (9.4)Aquatic Invertebrate
DipteraChironomid 26.85 (23.3) 15.38 (15.3) 22.14 (29.3) 23.28 (27.2)Simuliid 12.66 (19.5) 21.27 (27.3) 25.49 (21.8) 9.09 (14.3)Tipulid - - - - - - - -Ceratopogonid - - - - - - - -Unidentifiable - - 4.74 (8.1) - - 0.79 (2.5)
Gammarus 2.06 (4.4) 3.49 (11.0) 0.41 (1.3) - -Aquatic Mite - - - - 0.20 (0.6) 1.04 (2.5)Planorbidae 0.37 (1.2) - - - - - -Trichoptera 26.12 (30.2) - - 0.08 (0.2) - -Coleoptera - - - - - - - -Ephemeroptera - - - - - - - -Odonata - - - - - - - -Megaloptera - - - - - - - -Hemiptera - Corixidae - - 2.27 (7.2) - - - -Copepod - - - - - - - -Cladacera - - - - - - - -Unidentifiable Aquatic Invertebrate 4.18 (7.5) 7.81 (10.3) 0.93 (2.0) 6.27 (10.6)
Terrestrial InvertebrateHemiptera - Aphid - - - - - - - -Hemiptera - Unidentified - - 1.26 (2.4) - - - -Thysanoptera - Thrip 0.08 (0.2) 0.26 (0.8) 0.37 (1.2) 0.61 (1.5)Hymenoptera - - - - 14.58 (30.4) 2.21 (4.9)Coleoptera - - - - - - 1.76 (5.6)Diptera - - 1.92 (6.1) - - - -Orthoptera - - - - - - - -Terrestrial Mite - - - - - - - -Unidentifiable Terrestrial Invertebrate - - 7.24 (16.8) - - 0.23 (0.7)
Miscellaneous Invertebrate - - - - - - - -Fungi - - - - - - - -Fish - - - - - - - -
62 127 167 225
Appendix 1. Continued.

88
Season Species Food Resource Site
Sep-08 FHM Diatom 63.91 (31.3) 56.30 (27.7) 58.30 (22.2) 39.90 (30.0)Amorphous Detritus 23.18 (21.7) 27.98 (19.5) 20.04 (9.6) 34.10 (23.0)Aquatic Vegetation - - - - - - - -Filamentous Algae - - - - - - - -Terrestrial Vegetation 10.35 (10.6) 2.97 (2.9) 13.18 (15.0) 6.23 (3.9)Aquatic Invertebrate
DipteraChironomid 1.02 (1.6) - - 8.12 (18.8) 3.34 (9.8)Simuliid 1.53 (3.9) - - 0.24 (0.8) 10.06 (21.2)Tipulid - - - - - - - -Ceratopogonid - - - - - - - -Unidentifiable - - - - - - - -
Gammarus - - - - - - 0.03 (0.1)Aquatic Mite - - - - - - - -Planorbidae - - - - - - - -Trichoptera - - - - - - - -Coleoptera - - - - - - - -Ephemeroptera - - - - - - - -Odonata - - - - - - - -Megaloptera - - - - - - - -Hemiptera - Corixidae - - - - - - - -Copepod - - - - - - 2.64 (8.3)Cladacera - - - - - - - -Unidentifiable Aquatic Invertebrate - - 11.22 (30.0) 0.12 (0.4) 3.70 (6.1)
Terrestrial InvertebrateHemiptera - Aphid - - - - - - - -Hemiptera - Unidentified - - - - - - - -Thysanoptera - Thrip - - - - - - - -Hymenoptera - - - - - - - -Coleoptera - - - - - - - -Diptera - - - - - - - -Orthoptera - - - - - - - -Terrestrial Mite - - - - - - - -Unidentifiable Terrestrial Invertebrate - - - - - - - -
Miscellaneous Invertebrate - - - - - - - -Fungi - - - - - - - -Fish - - 1.53 (4.6) - - - -
Appendix 1. Continued.
62 127 167 225

89
LITERATURE CITED
Allan, J.D. & Flecker, A.S. (1993) Biodiversity conservation in running waters. BioScience, 43, 32-43.
Andrews, E.D. (1991) Sediment transport in the Colorado River basin. In: Colorado
River Ecology and Dam Management. pp. 54-74. National Acadamy Press. Angermeier, P.L. (1982) Resource seasonality and fish diets in an Illinois stream.
Evironmental Biology of Fishes, 7, 251-264. Behn, K.E., Kennedy, T.A. & Hall, R.O., Jr. (2010) Basal resources in backwaters of the
Colorado River below Glen Canyon Dam - effects of discharge regimes and comparision within mainstem depositional environments. In: Open-File Report 2010-1075. U.S. Geological Survey.
Benke, A.C. & Wallace, J.B. (1997) Trophic basis of production among riverine
cadissflies: implications for food web analysis. Ecology, 78, 1132-1145. Bezzerides, N. & Bestgen, K. (2002) Status review of roundtail chub Gila robusta,
flannelmouth sucker Catostomus latipinnis and bluehead sucker Catostomus discobolus in the Colorado River basin. T. Chart). Report to the U.S. Department of the Interior Bureau of Reclamation.
Blinn, D.W. & Cole, G.A. (1991) Algal and invertebrate biota in the Colorado River:
comparison of pre-and post-dam conditions. In: Colorado River Ecology and Dam Management. pp. 102-123. National Academy Press, Washington, D.C.
Brouder, M.J., Speas, D.W. & Hoffnagle, T.L. (1999) Changes in number, sediment
composition and benthic invertebrats of backwaters. In: The 1996 Controlled Flood in Grand Canyon. (Eds. R.H. Webb & J.C. Schmidt & G.R. Marzoff & R.A. Valdez), pp. 241-248. American Geophysical Union Geophysical Monograph, Washington, D.C.
Childs, M.R., Clarkson, R.W. & Robinson, A.T. (1998) Resource use by larval and early
juvenile native fishes in the Little Colorado River, Grand Canyon, Arizona. Transactions of the American Fisheries Society, 127, 620-629.

90
Clarkson, R.W. & Childs, M.R. (2000) Temperature effects of hypolimnial-release dams on early life stages of Colorado River basin big-river fishes. Copeia, 2000, 402-412.
Coggins, L.G. (2008) Active adaptive management for native fish conservation in the
Grand Canyon: implementation and evaluation. Doctor of Philosophy Dissertation, University of Florida.
Collie, J.S. (1987) Food consumption by yellowtail flounder in relation to production of
its benthic prey. Marine Ecology - Progress Series, 36, 205-213. Converse, Y.K., Hawkins, C.P. & Valdez, R.A. (1998) Habitat Relationships of Subadult
Humpback Chub in the Colorado River Through Grand Canyon: Spatioal Variability and Implications of Flow Regulation. Regulated Rivers: Research and Management, 14, 267-284.
Crombie, A.C. (1947) Interspecific Competition. The Journal of Animal Ecology, 16, 44-
73. Eadie, J.M. & Keast, A. (1982) Do goldeneye and perch compete for food? Oecologia,
55, 225-230. Elton, C. (1927) Animal Ecology, The MacMillan Company, New York, New York. Gido, K.B. & Brown, J.H. (1999) Invasion of North American drainages by alien fish
species. Freshwater Biology, 42, 387-399. Gido, K.B., Franssen, N.R. & Propst, D.L. (2006) Spatial Variation in delta 15N and delta
13C isotopes in the San Juan River, New Mexico and Utah: implications for the conservation of native fishes. Environmental Biology of Fishes, 75, 197-207.
Gido, K.B. & Propst, D.L. (1999) Habitat use and association of native and nonnative
fishes in the San Juan River, New Mexico and Utah. Copeia, 1999, 321-332. Gloss, S.P., Coggins, L.G. & Lovich, J.E. (2005) Fishes of Grand Canyon. In: The State
of the Colorado River Ecosystem in Grand Canyon: A report of the Grand Canyon Monitoring and Research Center 1991-2004. (Ed^Eds S.P. Gloss & L.G. Coggins & T.S. Melis), pp. 33-56. U.S. Geological Survey Circular 1262.
Goeking, S.A., Schmidt, J.C. & Webb, M.K. (2003) Spatial and temporal trends in the
size and number of backwaters between 1935 and 2000, Marble and Grand Canyons, Arizona. In: Final Report submitted to: Vol. Agreement 01WRAG0059. U.S. Geological Survey, GCMRC, Flagstaff, AZ.

91
Graf, W.L. (1999) Dam nation: A geographic census of American dams and their large-scale hydrologic impacts. Water Resources Research, 35, 1305-1311.
Greger, P.D. & Deacon, J.E. (1988) Food partitioning among fishes of the Virgin River.
Copeia, 1988, 314-323. Grinnell, J. (1917) The niche-relationship of the California thrasher. The Auk, 34, 427-
433. Hellawell, J.M. & Abel, R. (1971) A rapid volumetric method for the analysis of the food
of fishes. Journal of Fish Biology, 3, 29-37. Holden, P.B. & Stalnaker, C.B. (1975) Distributions and abundance of mainstream fishes
of the middle and upper Colorado River basins, 1967-1973. Transactions of the American Fisheries Society, 104, 217-231.
Hutchinson, G.E. (1957) Concluding remarks. Cold Spring Harbor Symposia on
Quantitative Biology, 22, 415-427. Hynes, H.B.N. (1950) The food of fresh-water sticklebacks (Gasterosteus aculeatus and
Pygosteus pungitius), with a review of methods used in studies of the food of fishes. The Journal of Animal Ecology, 19, 36-58.
Karp, C.A. & Tyus, H.M. (1990) Behavioral interactions between young Colorado
squawfish and six fish species. Copeia, 1990, 25-34. Kennedy, T.A. & Gloss, S.P. (2005) Aquatic Ecology: the Role of Organic Matter and
Invertebrates. In: The State of the Colorado River Ecosystem in Grand Canyon: A report of the Grand Canyon Monitoring and Research Center 1991-2004. (Eds S.P. Gloss & J.E. Lovich & T.S. Melis), pp. 87-101. U.S. Geological Survey Circular 1282.
Lovich, J. & Melis, T.S. (2007) The state of the Colorado River ecosystem in Grand
Canyon: Lessons from 10 years of adaptive ecosystem management. International Journal of River Basin Management, 5, 207-221.
Lovich, J.E. (2005) Profiles of selected fish species found in the Grand Canyon
ecosystem. In: The State of the Colorado River Ecosystem in Grand Canyon: A report of the Grand Canyon Monitoring and Research Center 1991-2004. (Ed^Eds S.P. Gloss & J.E. Lovich & T.S. Melis), pp. 50-53. U.S. Geological Survey Circular 1282.
Minckley, W.L. (1991) Native fishes of the Grand Canyon region: an obituary? In:
Colorado River Ecology and Dam Management. pp. 124-165. National Acadamy Press.
92
Minckley, W.L., Marsh, P.C., Deacon, J.E., Dowling, T.E., Hedrick, P.W., Matthews,
W.J. & Mueller, G. (2003) A conservation plan for native fishes of the lower Colorado River. BioScience, 53, 219-232.
Montgomerie, R.D. & Gass, C.L. (1981) Energy limitation of hummingbird populations
in tropical and temperate communities. Oecologia, 50, 162-165. Moyle, P.B. (1976) Inland Fishes of California, University of California Press. Muth, R.T. & Snyder, D.E. (1995) Diets of young Colorado squawfish and other small
fish in backwaters of the Green River, Colorado and Utah. The Great Basin Naturalist, 55, 95-104.
Noble, R.L. (1975) Growth of young yellow perch (Perca flavescens) in relation to
zooplankton populations. Transactions of the American Fisheries Society, 104, 731-741.
Olden, J.D. & Poff, N.L. (2005) Long-term trends of native and non-native fish faunas in
the American Southwest. Animal Biodiversity and Conservation, 28, 75-89. Paukert, C. & Rogers, R.S. (2004) Factors affecting condition of flannelmouth suckers in
the Colorado river, grand canyon, Arizona. North American Journal of Fisheries Management, 24, 648-653.
Persson, L. (1983) Food consumption and the significance of detritus and algae to
intraspecific competition in roach Rutilus rutilus in a shallow eutrophic lake. Oikos, 41, 118-125.
Ptacek, J.A., Rees, D.E. & Miller, W.J. (2005) Bluehead sucker (Catostomus discobolus):
a technical conservation assessment. USDA Forest Service, Rocky Mountain Region.
Quist, M.C., Bower, M.R. & Hubert, W.A. (2006) Summer food habits and trophic
overlap of roundtail chub and creek chub in Muddy Creek, Wyoming. The Southwestern Naturalist, 51, 22-27.
Ralston, B.E., Lauretta, M.V. & Kennedy, T.A. (2007) Comparisons of water quality and
biological variables from Colorado River shoreline habitats in Grand Canyon, Arizona, under steady and fluctuating discharges from Glen Canyon Dam. In: U.S. Geological Survey Open File Report.U.S. Geological Survey Open File Report 2007-1195.
93
Rees, D.E., Ptacek, J.A., Carr, R.J. & Miller, W.J. (2005) Flannelmouth sucker (Catostomus latipinnis): a technical conservation assessment. USDA Forest Service, Rocky Mountain Region.
Richardson, J.S. (1991) Seasonal food limitation of detritivores in a montane stream: an
experimental test. Ecology, 72, 873-887. Rinne, J.N. & Janisch, J. (1995) Coldwater fish stocking and native fishes in Arizona:
past, present, and future. American Fisheries Society Symposium, 15, 397-406. Rogers, R.S., Persons, W.R. & Mckinney, T. (2003) Effects of a 31,000-cfs spike flow
and low steady flows on benthic biomass and drift composition in the Lee's Ferry tailwater. Arizona Game and Fish Department.
Rosi-Marshall, E.J. & Wallace, B.J. (2002) Invertebrate food webs along a stream
resource gradient. Freshwater Biology, 47, 129-141. Rybczynski, S.M., Walters, D.M., Fritz, K.M. & Johnson, B.R. (2008) Comparing
trophic position of stream fishes using stable isotope and gut content analyses. Ecology of Freshwater Fishes, 17, 199-206.
Schoener, T.W. (1970) Nonsynchronous spatial overlap of lizards in patchy habitats.
Ecology, 51, 408-418. Schoener, T.W. (1983) Field experiments on interspecific competition. The American
Naturalist, 122, 240-285. Stevens, L.E., Shannon, J.P. & Blinn, D.W. (1997) Colorado River benthic ecology in
Grand Canyon, Arizona, USA: dam, tributary and geomorphological influences. Regulated Rivers: Research and Management, 13, 129-149.
Trammell, M., Valdez, R., Carothers, S. & Ryel, R. (2002) Effects of a low steady
summer flow experiment on native fishes of the Colorado River in Grand Canyon, Arizona. Final Report prepared by SWCA Environmental Consultants for the USGS Grand Canyon Monitoring and Research Center.
Tyus, H.M. & Saunders, J.F. (2000) Nonnative fish control and endangered fish recovery:
lessons from the Colorado River. Fisheries, 25, 17-24. Valdez, R.A., Hoffnagle, T.L., Mcivor, C., Mckinney, T. & Leibfried, W.C. (2001)
Effects of a Test Flood on Fishes of the Colorado River in Grand Canyon, Arizona. Ecological Applications, 11, 686-700.
Wallace, J.B., Eggert, S.L., Meyer, J.L. & Webster, J.R. (1999) Effects of resource
limitation on a detrital-based ecosystem. Ecological Monographs, 69, 409-442.

94
Wallace, R.K.J. (1981) An assessment of diet-overlap indexes. Transactions of the
American Fisheries Society, 110, 72-76. Ward, D.L., Maughan, O.E., Bonar, S.A. & Matter, W.J. (2002) Effects of temperature,
fish length, and exercise on swimming performance of age-0 flannelmouth sucker. Transactions of the American Fisheries Society, 131, 492-297.
Warwick, R.M., Clarke, K.R. & Suharsono (1990) A statistical analysis of coral
community responses to the 1982-83 El Nino in the Thousand Islands, Indonesia. Coral Reefs, 8, 171-179.
Weisberg, S.B. & Lotrich, V.A. (1986) Food limitation of a Delaware salt marsh
population of the mummichog, Fundulus heteroclitus (L.). Oecologia, 68, 168-173.
Welcomme, R.L. (1988) International introductions of inland aquatic species. In: FAO
Fisheries Technical Paper. p. 318, Vol. 294. Food and Agriculture Organization of the United Nations, Rome.
Wellington, G.M. & Victor, B.C. (1985) El Niño mass coral mortality: a test of resource
limitation in a coral reef damselfish population. Oecologia, 68, 15-19. Werner, E.E. & Gilliam, J.F. (1984) The ontogenetic niche and species interactions in
size-structured populations. Annual Review of Ecology and Systematics, 15, 393-425.
White, M.A., Schmidt, J.C. & Topping, D.J. (2005) Application of wavelet analysis for
monitoring the hydrologic effects of dam operation: Glen Canyon Dam and the Colorado River at Lees Ferry, Arizona. River research and applications, 21, 551-565.

95
VITA
Sarah Seegert was born and raised in Stevens Point, Wisconsin. After graduating
from the local high school in 2003, she enrolled at the University of Wisconsin–Madison.
Sarah graduated in May 2007 with a Bachelor’s of Science in Biology with honors and a
certificate in Environmental Studies. While at UW–Madison , she conducted independent
research for a senior honors thesis, which was titled “Submerged macrophytes in Big
Spring Creek, WI: Distribution and influence on phosphorus dynamics.” She was also
involved in research investigating the influence of light on ecosystem structure and
nutrient and carbon dynamics in the Wisconsin River and its floodplain.
In the summer of 2007, Sarah received a Research Assistantship at Loyola
University Chicago, where she began her Master’s thesis research with Dr. Emma Rosi-
Marshall, investigating small-bodied fish diets in the Colorado River. While at Loyola,
Sarah participated in five sample collection trips in the Grand Canyon, including
sampling during an experimental high flow release from Glen Canyon Dam in 2008. She
also served as teaching assistant for two courses at Loyola and participated in an
intensive short-course in the Fundamentals of Ecosystem Ecology at the Cary Institute for
Ecosystem Studies in January 2009. In August 2009, Sarah took a job with the Great
Lakes Fishery Commission as a research program associate in Ann Arbor, MI, where she
is currently living with her husband Nathan.