Embed Size (px)
Citation preview

Diabetes 2013: Achieving GoalsThrough Comprehensive Treatment
Joshua L. Cohen, M.D., F.A.C.P.
Professor of Medicine
Interim Director, Division of Endocrinology &Metabolism
The George Washington University School ofMedicine

Session 1 Agenda
• Diabetes epidemiology andpathophysiology
• Diagnosis and classification
• Goals of therapy and long-termoutcomes
• Overview of stepped approach topharmacotherapy
• Insulin therapy

The Increasing Global Burdenof Noncommunicable Diseases
1990 2010
Percent attributabledeaths
Communicable, maternal, neonatal and nutritionaldisorders
34.1 24.9
Noncommunicable diseases 57.1 65.3
Injuries 8.8 9.6
Cause of death rank
Diabetes 15 9
93% increase in deaths attributed to diabetes

The Global Burden of Diabetes
• Approximately 371 million people haddiabetes in 2012
» 50% of cases are undiagnosed
• By 2030 there will be about 552 millionpeople living with diabetes (49% increase)

Change in Disability-AdjustedLife Years (DALY) 1990 – 2010
Cause Percent Change
All cause -23.4
Communicable, maternal, neonataland nutritional disorders
-43.5
HIV/AIDS & Tb 26.9
Nutritional Deficiencies -41.3
Noncommunicable diseases -3.8
Cancers -2.1
Cardiovascular -5.7
Diabetes 30.0
Injury -12.7
Murray CJL, et al. Lancet. 2012; 380:2197–2223

Global Disease Risk Factors:Per cent Disability Adjusted Life Years
2010
1990
58% increase inDALY’sattributed tohigh fastingplasma glucose
Lim SS et al.Lancet. 2012;380:2224 - 2260
9
7

Chen, L. et al. Nat. Rev. Endocrinol. 2011; doi:10.1038/nrendo.2011.183
Global Projections for theDiabetes Epidemic: 2010–2030

BMI and Diabetes Risk
0
10
20
30
40
50
60
70
80
90
100
<22* 23-23.9 25-26.9 29-30.9 33-34.9
Body Mass Index (kg/m2)
Relative risk of diabetes
* RR=1.0 for BMI <22 Colditz GA Ann Int Med 1995; 122:481

Obesity and Diabetes in the U.S.Obesity (BMI ≥30 kg/m2)
Diabetes
1994 2000
No Data <14.0% 14.0-17.9% 18.0-21.9% 22.0-25.9% >26.0%
No Data <4.5% 4.5-5.9% 6.0-7.4% 7.5-8.9% >9.0%
CDC’s Division of Diabetes Translation. National Diabetes SurveillanceSystem available at http://www.cdc.gov/diabetes/statistics
2009

Diabetes Mellitus in the US:Health Impact of the Disease
DiabetesBlindness*
Renalfailure*
Amputation*
Life expectancy5 to 10 yr
Cardiovasculardisease 2X to 4X
*Diabetes is the no. 1 cause of renal failure, new cases of blindness, andnontraumatic amputations
Nerve damage in60% to 70% of patients
7th leading cause ofdeath

Diabetes Healthcare Costs
0500
100015002000250030003500
General Health Costs
Additional costs from diabetesUS $/year

PATHOGENESIS ANDNATURAL HISTORY OF
TYPE 2 DIABETES

Hyperglycemia
Metabolic Defects in Diabetes
Pancreas
LiverMuscleFat
Hepatic GlucoseProduction
GlucoseUptake
Progressiveinsulin secretorydefect
Insulinresistance

Main Pathophysiological Defects in T2DM
++
--
--
peripheralglucoseuptake
hepaticglucoseproduction
pancreaticinsulinsecretion
pancreaticglucagonsecretion
gutcarbohydratedelivery &absorption
incretineffect
HYPERGLYCEMIAHYPERGLYCEMIA
?
Inzucchi SE, Sherwin RS in: Cecil Medicine 2011

Insulin Resistance
• Definition: Impaired cellular responses tothe physiological effects of insulin. Forexample, decreased glucose uptake bymuscle in response to insulin.
• A core defect in type 2 diabetes – 92% ofpatients with type 2 diabetes have insulinresistance
• If pancreatic beta cell function is normal,insulin resistance may be associated withhyperinsulinism

From Weyer et al. J Clin Invest. 1999;104:787-794.
EMBS = estimated metabolic body size (or fat-free mass + 17.7 kg)
INSULIN SENSITIVITY ANDINSULIN SECRETION500
400
300
200
100
00 1 2 3 4 5
Insu
lin
Secre
tio
n(
U/m
L)
Insulin Sensitivity (mg/kg EMBS per minute)
Insulin Resistance
-c
ell
Fa
ilure
ProgressorsDIA
IGT
IGT
95% CI
Nonprogressors
NGTNGTNGT

Natural History of Type 2 Diabetes
Obesity IFG* Diabetes Uncontrolled Hyperglycemia
50
100
150
200
250
300
350
50
100
150
200
250
Glu
co
se
(mg
/dL
)R
ela
tive
Fu
ncti
on
(%)
-10-10 -5-5 00 55 1010 1515 2020 2525 3030
Years of DiabetesYears of Diabetes
Post-meal Glucose
Fasting Glucose
Insulin Resistance
Insulin Level-cell Failure
*IFG = impaired fasting glucose

Fat Topography In Type 2Diabetic Subjects
Intramuscular
Intrahepatic
Subcutaneous
Intra-abdominal
Relationship Between VisceralAdipose Tissue and Insulin Action
Banerji M et al. Am J Physiol 1997;273(2 pt 1):E425–E432.
18
16
14
12
10
8
6
4
2
01000 2000 3000 4000 5000
Visceral adipose tissue volumeper unit surface area (mL/m2)
Glu
co
se
dis
po
sa
l(m
g/k
gL
BM
/min
)WomenMen

Signals from Adipose Tissue:Hormones and Cytokines
Leptin
Adiponectin
TNF
IL-6
PAI-1
Fasshauer M, Paschke R. Diabetologia. Nov. 6, 2003 [online].Arner P. Trends in Endo and Met. 2003;14:137-145.
Free FattyAcids
Fat Cells?Resistin
Angiotensinogen
11 hydroxysteroiddehydrogenase

Beta Cell Failure
• Beta cell dysfunction begins early in thedevelopment of type 2 diabetes, eventhough patients may have elevatedinsulin levels
• At the time of diagnosis with diabetes, apatient may already have lost 50% ofinsulin secretory capability (UKPDS)
• Progressive beta cell failure continuesafter diagnosis

Potential Causes of -CellFailure in Type 2 Diabetes
• Genetic factors
• Reduced -cell mass
» Apoptosis
» Reduced proliferation
» Amyloid deposition
• -cell exhaustion
• Glucotoxicity
• Lipotoxicity
• Diminished incretin effect

Beta Cell Volume in Obesityand Diabetes

Costes S et al. Diabetes 2013;62:327-335
Insulin and Amyloid Deposition inNormal and Diabetic Islets

Diabetes Susceptibility Genes
Effect of TCF7L2 T allele oninsulin secretion: Loss ofinsulin secretion over time
Lyssenko V, et al. J Clin Invest. 2007;117:2155

Worldwide Distribution of Type 2Diabetes-Associated TCF7L2 SNP
Guinan KJ. Biochem Genet. 2012; 50:159-179
Odds ratio of rs7903146 SNP associationwith type 2 diabetes = 1.46

Adapted from Saltiel & Olefsky. Diabetes 1996;45:1661–9
Insulin Resistance
Insulin Resistance andHyperinsulinemia
Insulin Resistance andDeclining Insulin Levels:Impaired GlucoseTolerance “Prediabetes”
Further decline in insulin:Type 2 Diabetes
Impaired b-Cell Function
Genes Environment

Neal, 1962.
The Thrifty Gene Hypothesis
• Fuel efficiency
» Evolutionary pressure selected hunter gatherers forefficient fuel storage during times of famine. Whenfood became plentiful and exercise less, this becamea liability
» Examples: Native Americans, Australian Aborigines,Pacific Islanders

PIMA INDIANS LIVING IN MEXICO
24.9BMI
>40 hr/weekWork
>50 gmFiber
23%Fat
63%Carb
Diet
160 cmHeight

PIMA INDIANS LIVING INARIZONA
33.4BMI
3 hr/weekWork
<30 gmFiber
40%Fat
40%Carb
Diet
164 cmHeight

DIABETES PREVALENCE INTHE PIMA INDIANS
10.5%37%Women
6.3%54%Men
MexicoArizona

The Impact of Social and CulturalFactors on Diabetes Prevalence in
Different Ethnic Groups
King H, et al. Diabetes Care. 1993; 16:157
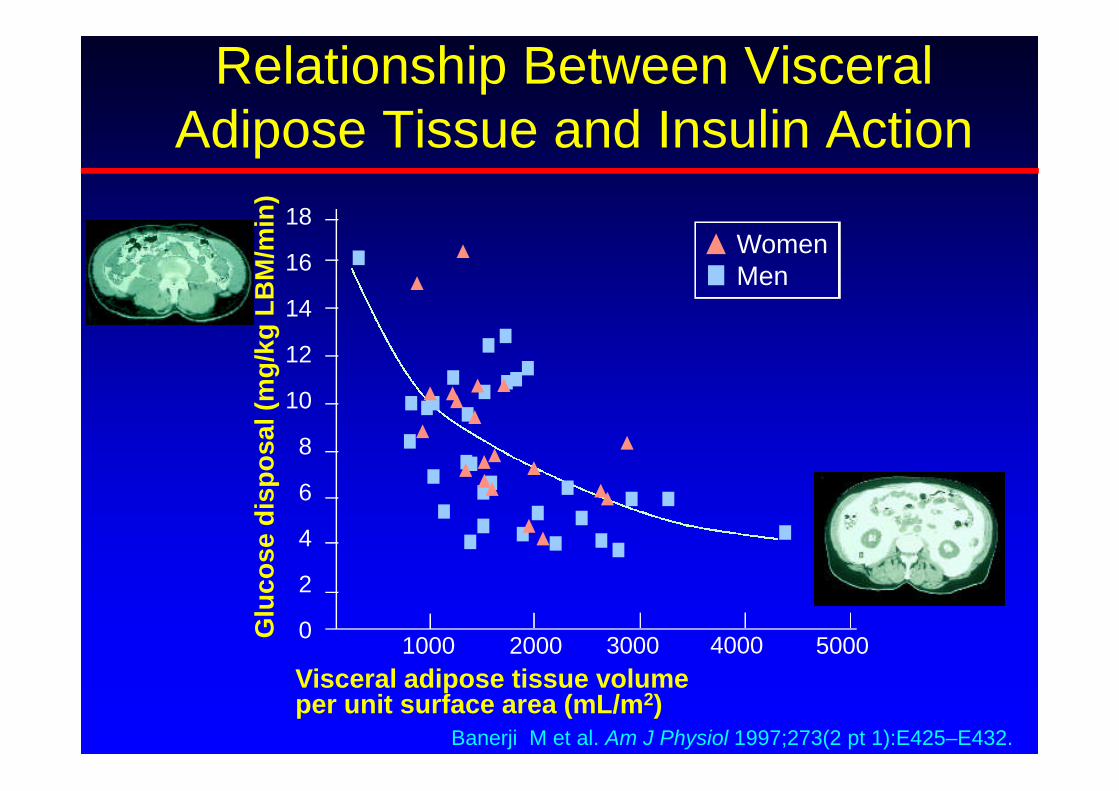
Worldwide Trend in DiabetesCases 2010-2030
0
100
200
300
400
500
600
Total High Low/Middle
Mil
lio
ns
Income
2011 2030

Diabetes: A disease associated withrapid socioeconomic change invulnerable populations
The result of adoption of a high-calorie, low-exercise lifestyle as aresult of emigration oreconomic/cultural changes

Socioeconomic FactorsAssociated with Increased
Obesity• Urbanization
» Women may be more vulnerable than men
• Diet
» Sweetened beverages
» Energy-dense oils
» Increased meat consumption
• Decreased energy expenditure at work
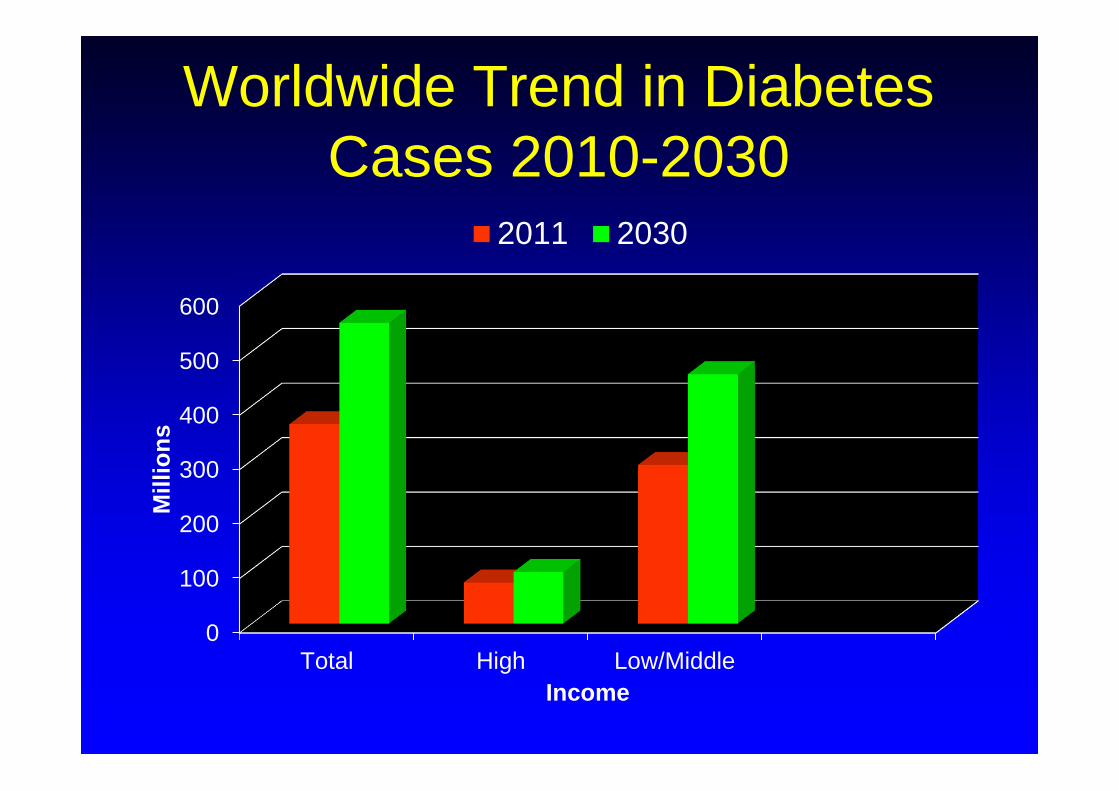
Diabetes Prevalence in the MiddleEast and North Africa 2012
DiabetesPrevalence
IDF Diabetes Atlas.5th edition

Diabetes Prevalence in the MiddleEast and North Africa
0 10 20 30
AlgeriaBahrainEgyptIranIraqJordanKuwaitLebanonLibyaMoroccoOmanPalestinian Terr.PakistanQatarSaudi ArabiaSudanSyriaTunesiaUAEYemen
PercentIDF Diabetes Atlas. 5th edition
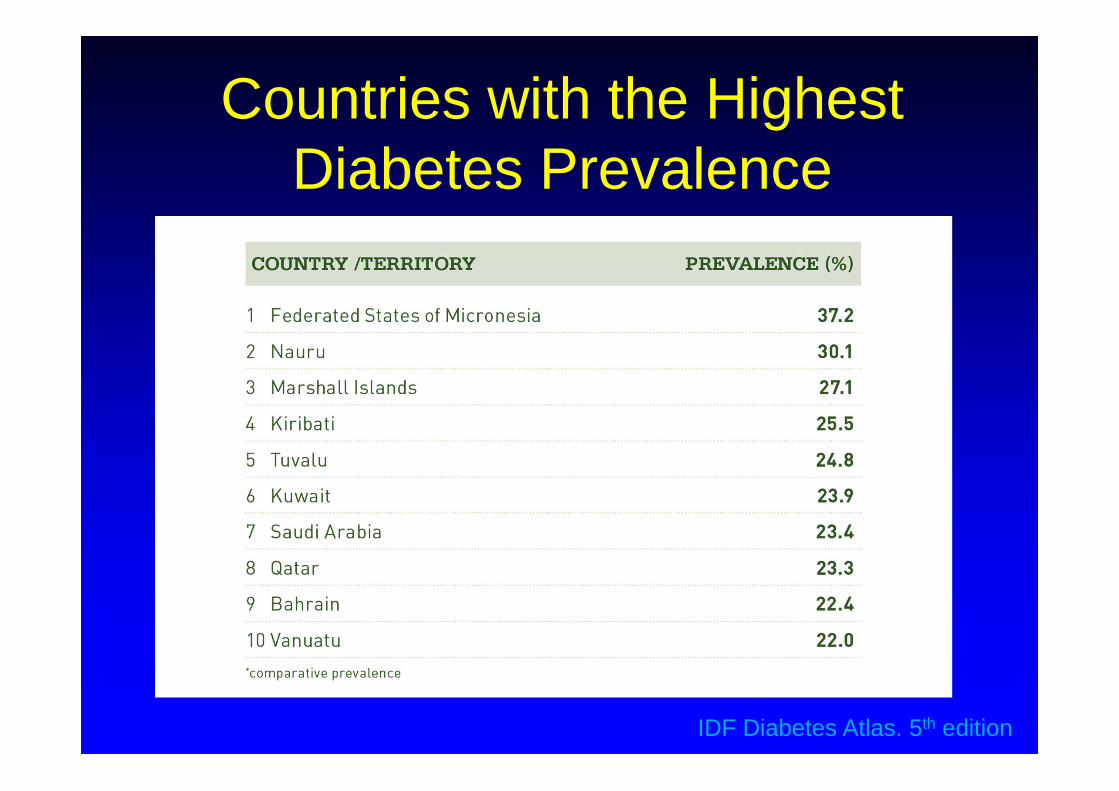
Countries with the HighestDiabetes Prevalence
IDF Diabetes Atlas. 5th edition

Physician Attitudes About Diabetes• It’s considered impolite to turn down a second
helping of food when visiting (Egypt)
• Women were able to be more active whenthey lived in villages than they are in the cities(Saudi Arabia)
• Men don’t go to doctors because they don’twant to be told not to eat sweets (Jordan)
• People are very traditional and won’t takemedications if they feel well (Dubai)
Attitudes About Diabetes(Continued)
• There is nothing to do in the evening exceptto go to restaurants or people’s houses fordinner (Saudi Arabia)
• Women wont lose weight because theirhusbands want them to be heavy. (SaudiArabia)

Prevalence of Overweight andObesity in Gulf StatesChildren and Adolescents Adults (15+ years)
Year Age Sex Overweight(%)
Obesity(%)
Year Sex Overweight(%)
Obesity(%)
Bahrain 2006 15-18M 15.8 13.7
2007M 34.8 32.3
F 17.4 19.4 F 35.1 40.3
Kuwait 2006 10-14M 29.3 14.9
2007M 38.9 39.2
F 32.1 14.2 F 28.9 53.0
Oman 2000M 30.6 15.5
F 27.2 22.3
Qatar20032004
6-9M 16.3 3.5
F 15.5 2.8
KSA 2005 5-12M 19.9 7.8
2005M 43.0 31.5
F 19.2 11.0 F 28.8 50.4
UAE 2005 10-19M 21.2 13.2
F 21.3 11.0
Musaiger AO, et al. Int J Environ Res Public Health. 2011; 8:3637-71

Diabetes Prevalence in theMid East 2012 and 2030
0
5
10
15
20
25 2012 2030
IDF Diabetes Atlas. 5th edition

Age Distribution of Diabetes in theEastern Mediterranean and Middle East
0
10
20
30
40
50
60
70
20-39 40-59 60-79
Age Range
Bahrain
Iran
Iraq
Jordan
Kuwait
Lebanon
Libya
Morocco
Pakistan
Qatar
Saudi Arabia
Syria
Tunesia
Percent of total cases

Diagnosed and UndiagnosedDiabetes in the United States
3.7%
13.7%
26.9%
0%
5%
10%
15%
20%
25%
30%
20-44 45-64 ≥65
Perc
en
t
Age Group, Years
Estimated percentage of people ages ≥20 years with diagnosed and undiagnosed diabetes, by age group, United States, 2005-
2008

Type 2 Diabetes: Diagnosisand Clinical Presentations

Diagnostic Criteria for Diabetesin Nonpregnant Adults
• Fasting plasma glucose 126 mg/dlor
• HbA1C 6.5%or
• Random plasma glucose 200 mg/dltogether with symptoms ofhyperglycemia (polyuria, polydipsia,weight loss, blurred vision, etc.)or
• 2 hour plasma glucose 200 during 75 gOGTT

Undiagnosed Diabetes by WorldRegion
IDF Diabetes Atlas. 5th edition
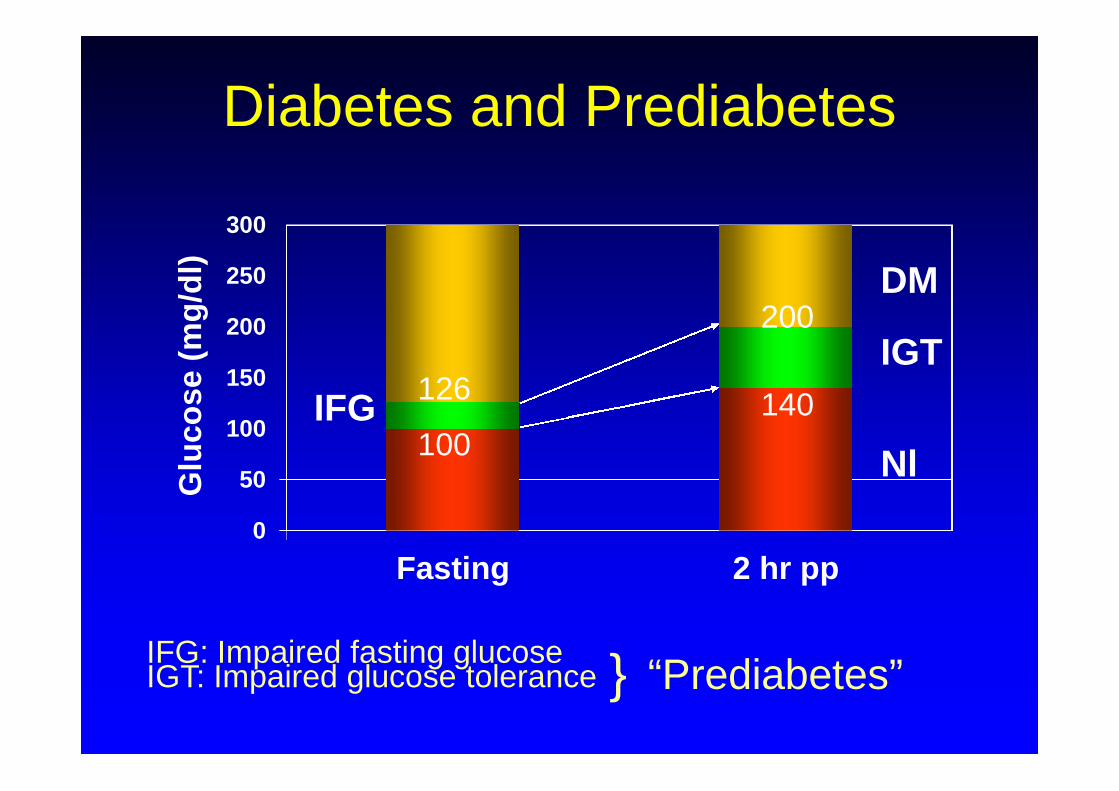
Diabetes and Prediabetes
0
50
100
150
200
250
300
Fasting 2 hr pp
Glu
co
se
(mg
/dl)
Nl
IGT
DM
100
126 140
200
IFG
IFG: Impaired fasting glucoseIGT: Impaired glucose tolerance “Prediabetes”}

Major Indicators of Risk forType 2 Diabetes
• Family history of diabetes (1st degree relatives)
• Obesity
• Sedentary lifestyle
• Ethnic background
• Previously identified IGT or IFG (“Pre-diabetes”)
• History of gestational diabetes
• Polycystic ovary syndrome (PCOS)
• Dyslipidemia ( Triglyceride, HDL, small LDLparticle size)
• Hypertension

Etiologic Classification ofDiabetes Mellitus
I. Type 1 diabetes
II. Type 2 diabetes
III. Gestational diabetes
IV. Secondary forms

Gestational Diabetes Mellitus• Develops in 2-13% of screened populations
• Develops in 3rd trimester
• Asymptomatic, diagnosed by OGTT with specificcriteria
• Neonatal complications of poorly treated GDM:
» Macrosomia, hypoglycemia, hyperbilirubinemia,hypocalcemia
• Often can be treated by diet alone
• Some women may require insulin. Oral agentsgenerally are not used during pregnancy
• Marker of increased risk for the development oftype 2 diabetes

Autoimmunity in Type 1 Diabetes
• Glutamic acid decarboxylase (GAD-65)
• Protein tyrosine phosphatase 2 (IA-2)
• Insulin
• Zinc transporter 8 (ZnT8, Slc30A8)
Major Antigens

Is it type 1 or type 2?
• Adolescents
» Increasing incidence of type 2 diabetes
• Late onset type 1
» LADA: Latent autoimmune diabetes of adults
» May present initially as apparent type 2 diabetes butmay progress rapidly to insulin requiring
• Monogenic diabetes
» Previously called “MODY”: Maturity onset diabetes ofthe young
» Autosomal dominant inheritance
» Rare
You can’t always tell by age.