Embed Size (px)
Citation preview
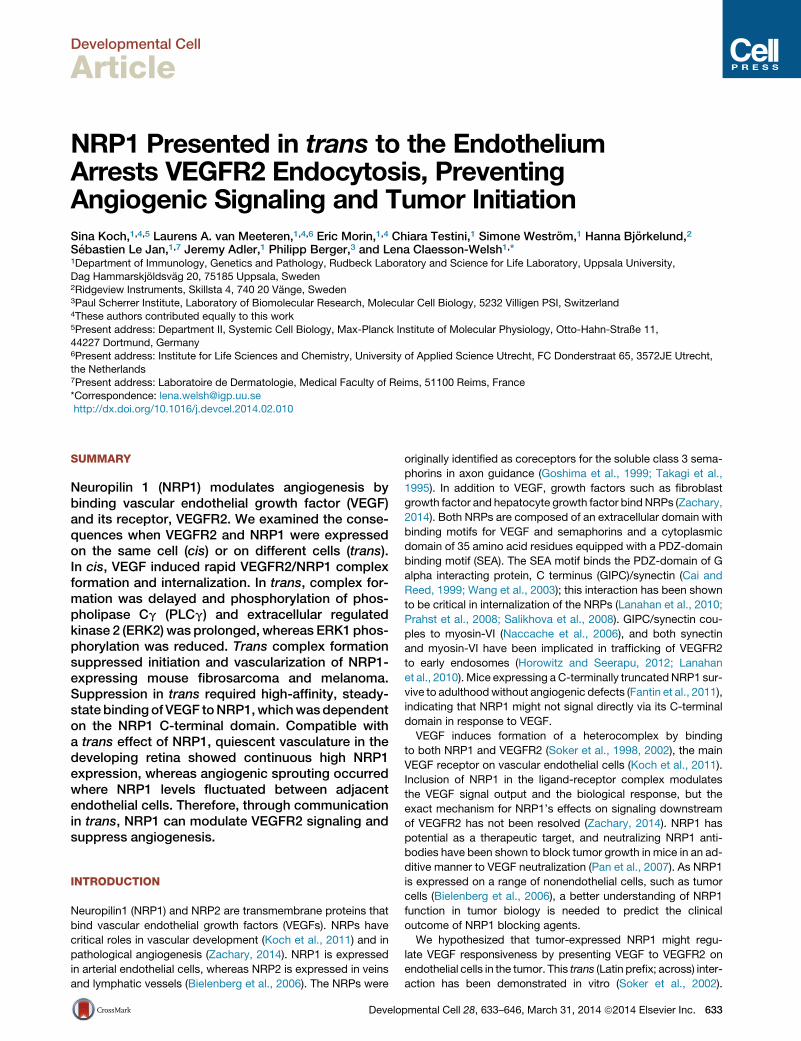
Developmental Cell
Article
NRP1 Presented in trans to the EndotheliumArrests VEGFR2 Endocytosis, PreventingAngiogenic Signaling and Tumor InitiationSina Koch,1,4,5 Laurens A. van Meeteren,1,4,6 Eric Morin,1,4 Chiara Testini,1 Simone Westrom,1 Hanna Bjorkelund,2
Sebastien Le Jan,1,7 Jeremy Adler,1 Philipp Berger,3 and Lena Claesson-Welsh1,*1Department of Immunology, Genetics and Pathology, Rudbeck Laboratory and Science for Life Laboratory, Uppsala University,
Dag Hammarskjoldsvag 20, 75185 Uppsala, Sweden2Ridgeview Instruments, Skillsta 4, 740 20 Vange, Sweden3Paul Scherrer Institute, Laboratory of Biomolecular Research, Molecular Cell Biology, 5232 Villigen PSI, Switzerland4These authors contributed equally to this work5Present address: Department II, Systemic Cell Biology, Max-Planck Institute of Molecular Physiology, Otto-Hahn-Straße 11,44227 Dortmund, Germany6Present address: Institute for Life Sciences and Chemistry, University of Applied Science Utrecht, FC Donderstraat 65, 3572JE Utrecht,
the Netherlands7Present address: Laboratoire de Dermatologie, Medical Faculty of Reims, 51100 Reims, France*Correspondence: [email protected]
http://dx.doi.org/10.1016/j.devcel.2014.02.010
SUMMARY
Neuropilin 1 (NRP1) modulates angiogenesis bybinding vascular endothelial growth factor (VEGF)and its receptor, VEGFR2. We examined the conse-quences when VEGFR2 and NRP1 were expressedon the same cell (cis) or on different cells (trans).In cis, VEGF induced rapid VEGFR2/NRP1 complexformation and internalization. In trans, complex for-mation was delayed and phosphorylation of phos-pholipase Cg (PLCg) and extracellular regulatedkinase 2 (ERK2) was prolonged, whereas ERK1 phos-phorylation was reduced. Trans complex formationsuppressed initiation and vascularization of NRP1-expressing mouse fibrosarcoma and melanoma.Suppression in trans required high-affinity, steady-state bindingof VEGF toNRP1,whichwasdependenton the NRP1 C-terminal domain. Compatible witha trans effect of NRP1, quiescent vasculature in thedeveloping retina showed continuous high NRP1expression, whereas angiogenic sprouting occurredwhere NRP1 levels fluctuated between adjacentendothelial cells. Therefore, through communicationin trans, NRP1 can modulate VEGFR2 signaling andsuppress angiogenesis.
INTRODUCTION
Neuropilin1 (NRP1) and NRP2 are transmembrane proteins that
bind vascular endothelial growth factors (VEGFs). NRPs have
critical roles in vascular development (Koch et al., 2011) and in
pathological angiogenesis (Zachary, 2014). NRP1 is expressed
in arterial endothelial cells, whereas NRP2 is expressed in veins
and lymphatic vessels (Bielenberg et al., 2006). The NRPs were
Develo
originally identified as coreceptors for the soluble class 3 sema-
phorins in axon guidance (Goshima et al., 1999; Takagi et al.,
1995). In addition to VEGF, growth factors such as fibroblast
growth factor and hepatocyte growth factor bindNRPs (Zachary,
2014). Both NRPs are composed of an extracellular domain with
binding motifs for VEGF and semaphorins and a cytoplasmic
domain of 35 amino acid residues equipped with a PDZ-domain
binding motif (SEA). The SEA motif binds the PDZ-domain of G
alpha interacting protein, C terminus (GIPC)/synectin (Cai and
Reed, 1999; Wang et al., 2003); this interaction has been shown
to be critical in internalization of the NRPs (Lanahan et al., 2010;
Prahst et al., 2008; Salikhova et al., 2008). GIPC/synectin cou-
ples to myosin-VI (Naccache et al., 2006), and both synectin
and myosin-VI have been implicated in trafficking of VEGFR2
to early endosomes (Horowitz and Seerapu, 2012; Lanahan
et al., 2010). Mice expressing a C-terminally truncatedNRP1 sur-
vive to adulthoodwithout angiogenic defects (Fantin et al., 2011),
indicating that NRP1 might not signal directly via its C-terminal
domain in response to VEGF.
VEGF induces formation of a heterocomplex by binding
to both NRP1 and VEGFR2 (Soker et al., 1998, 2002), the main
VEGF receptor on vascular endothelial cells (Koch et al., 2011).
Inclusion of NRP1 in the ligand-receptor complex modulates
the VEGF signal output and the biological response, but the
exact mechanism for NRP1’s effects on signaling downstream
of VEGFR2 has not been resolved (Zachary, 2014). NRP1 has
potential as a therapeutic target, and neutralizing NRP1 anti-
bodies have been shown to block tumor growth in mice in an ad-
ditive manner to VEGF neutralization (Pan et al., 2007). As NRP1
is expressed on a range of nonendothelial cells, such as tumor
cells (Bielenberg et al., 2006), a better understanding of NRP1
function in tumor biology is needed to predict the clinical
outcome of NRP1 blocking agents.
We hypothesized that tumor-expressed NRP1 might regu-
late VEGF responsiveness by presenting VEGF to VEGFR2 on
endothelial cells in the tumor. This trans (Latin prefix; across) inter-
action has been demonstrated in vitro (Soker et al., 2002).
pmental Cell 28, 633–646, March 31, 2014 ª2014 Elsevier Inc. 633
Developmental Cell
NRP1 cis and trans Regulation of VEGF Signaling
However, it has remained unclear how the trans complex contrib-
utes to VEGFbiology and if the signaling output differs from that of
the cis (Latin prefix; on the same side) signaling complex contain-
ingVEGFR2andNRP1expressedon the samecell. Here,wehave
investigated the role of the VEGF-bridged VEGFR2/NRP1 trans
complex in vitro and in vivo. Our data support a model where
NRP1modulates VEGFR2 biology differently when the molecules
are expressed on the same cell or on adjacent cells, through regu-
lationofVEGFR2 internalizationand intracellular trafficking.There-
fore, depending on the expression pattern and relative expression
level, NRP1 may either promote or suppress angiogenesis.
RESULTS
VEGFR2 and NRP1 Engage in trans and cis Complexeswith Different KineticsTo investigate if trans presentation of VEGF to VEGFR2 by NRP1
occurs with different kinetics and signaling output compared to
presentation in cis, mixed cultures of porcine aortic endothelial
(PAE) cells individually expressing either VEGFR2 or NRP1 (trans
configuration), were examined by immunoprecipitation/immuno-
blotting. In parallel, we examined cultures of PAE cells coex-
pressing VEGFR2 and NPR1 (cis configuration). PAE cells were
chosen since they are well characterized and lack endogenous
expression of both VEGFR2 and NRP1 (Soker et al., 2002).
VEGFR2/NRP1 complexes in the cis configuration formed
quickly and transiently, with a maximum at 10 min of VEGF stim-
ulation (Figures 1A and 1B). VEGFR2 andNRP1 engaged in com-
plexes also in the trans configuration (Figures 1A and 1B), but
with delayed kinetics compared to cis. Trans complex formation
appeared with a maximum at 120–240 min of VEGF treatment,
when cis complexes had returned to unstimulated levels.
VEGFR2/NRP1 trans Complexes Form at the Cell-CellInterfaceTo examine potential spatial differences between cis and trans
complex formation, we employed the proximity ligation assay
(PLA), which allows visualization of complexes in situ through
oligonucleotide-tagged antibody-mediated rolling circle amplifi-
cation on fixed cells.
In agreement with the coimmunoprecipitation results (Figures
1A and 1B), cells coexpressing VEGFR2 and NRP1 (cis) dis-
played PLA signals representing VEGFR2/NRP1 complexes
quickly after stimulation with VEGF, at approximately 3–10 min
(Figures 1C and 1D). The cis complexes gradually decreased
and returned to basal levels after 60 min.
In the mixed culture, trans VEGFR2/NRP1 complexes ap-
peared with slower kinetics than in cis, from 30min of stimulation
and onward (Figures 1C and 1D). Whereas cis complexes were
distributed evenly over the surface of coexpressing cells (Fig-
ure 1C, upper panels; Figure S1A available online), trans-com-
plexes were confined to and persisted at the interface between
adjacent NRP1- and VEGFR2-expressing cells (Figure 1C, lower
panels; Figure S1).
VEGFR2/NRP1 in cis Internalize VEGF in Rab4/Rab5VesiclesTomonitor internalization kinetics of cis and trans complexes, we
used AlexaFluor 555-labeled VEGF (555-VEGF) in the different
634 Developmental Cell 28, 633–646, March 31, 2014 ª2014 Elsevier
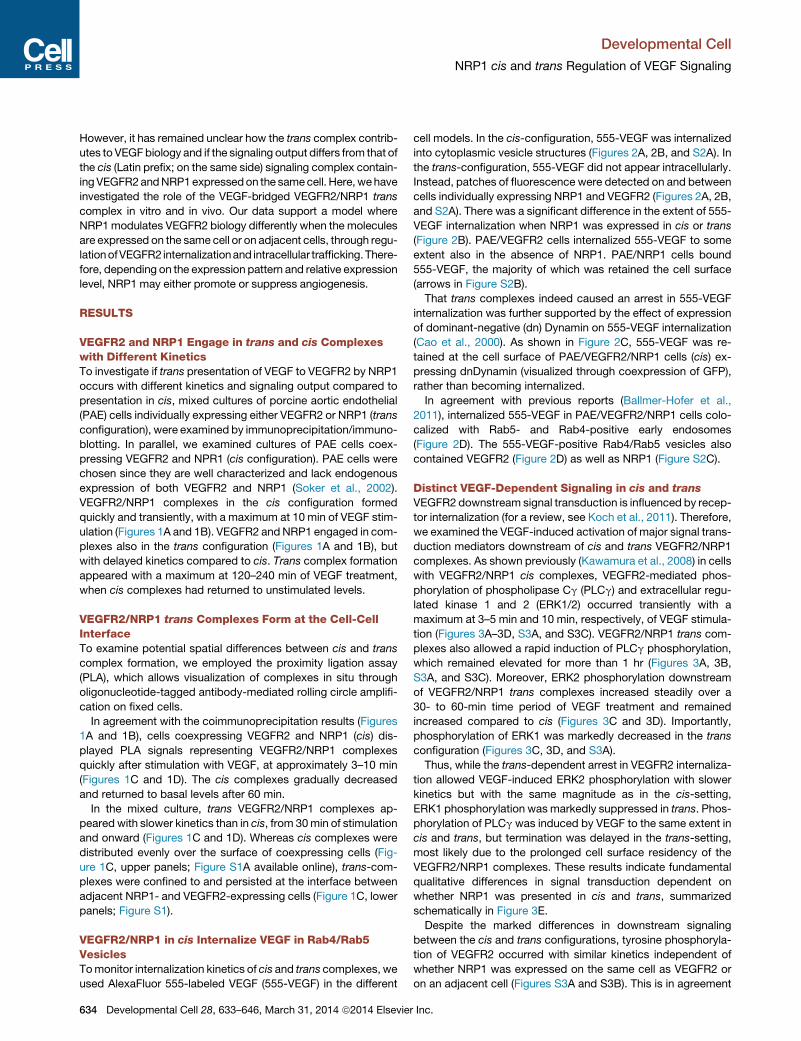
cell models. In the cis-configuration, 555-VEGF was internalized
into cytoplasmic vesicle structures (Figures 2A, 2B, and S2A). In
the trans-configuration, 555-VEGF did not appear intracellularly.
Instead, patches of fluorescence were detected on and between
cells individually expressing NRP1 and VEGFR2 (Figures 2A, 2B,
and S2A). There was a significant difference in the extent of 555-
VEGF internalization when NRP1 was expressed in cis or trans
(Figure 2B). PAE/VEGFR2 cells internalized 555-VEGF to some
extent also in the absence of NRP1. PAE/NRP1 cells bound
555-VEGF, the majority of which was retained the cell surface
(arrows in Figure S2B).
That trans complexes indeed caused an arrest in 555-VEGF
internalization was further supported by the effect of expression
of dominant-negative (dn) Dynamin on 555-VEGF internalization
(Cao et al., 2000). As shown in Figure 2C, 555-VEGF was re-
tained at the cell surface of PAE/VEGFR2/NRP1 cells (cis) ex-
pressing dnDynamin (visualized through coexpression of GFP),
rather than becoming internalized.
In agreement with previous reports (Ballmer-Hofer et al.,
2011), internalized 555-VEGF in PAE/VEGFR2/NRP1 cells colo-
calized with Rab5- and Rab4-positive early endosomes
(Figure 2D). The 555-VEGF-positive Rab4/Rab5 vesicles also
contained VEGFR2 (Figure 2D) as well as NRP1 (Figure S2C).
Distinct VEGF-Dependent Signaling in cis and trans
VEGFR2 downstream signal transduction is influenced by recep-
tor internalization (for a review, see Koch et al., 2011). Therefore,
we examined the VEGF-induced activation of major signal trans-
duction mediators downstream of cis and trans VEGFR2/NRP1
complexes. As shown previously (Kawamura et al., 2008) in cells
with VEGFR2/NRP1 cis complexes, VEGFR2-mediated phos-
phorylation of phospholipase Cg (PLCg) and extracellular regu-
lated kinase 1 and 2 (ERK1/2) occurred transiently with a
maximum at 3–5 min and 10 min, respectively, of VEGF stimula-
tion (Figures 3A–3D, S3A, and S3C). VEGFR2/NRP1 trans com-
plexes also allowed a rapid induction of PLCg phosphorylation,
which remained elevated for more than 1 hr (Figures 3A, 3B,
S3A, and S3C). Moreover, ERK2 phosphorylation downstream
of VEGFR2/NRP1 trans complexes increased steadily over a
30- to 60-min time period of VEGF treatment and remained
increased compared to cis (Figures 3C and 3D). Importantly,
phosphorylation of ERK1 was markedly decreased in the trans
configuration (Figures 3C, 3D, and S3A).
Thus, while the trans-dependent arrest in VEGFR2 internaliza-
tion allowed VEGF-induced ERK2 phosphorylation with slower
kinetics but with the same magnitude as in the cis-setting,
ERK1 phosphorylation was markedly suppressed in trans. Phos-
phorylation of PLCg was induced by VEGF to the same extent in
cis and trans, but termination was delayed in the trans-setting,
most likely due to the prolonged cell surface residency of the
VEGFR2/NRP1 complexes. These results indicate fundamental
qualitative differences in signal transduction dependent on
whether NRP1 was presented in cis and trans, summarized
schematically in Figure 3E.
Despite the marked differences in downstream signaling
between the cis and trans configurations, tyrosine phosphoryla-
tion of VEGFR2 occurred with similar kinetics independent of
whether NRP1 was expressed on the same cell as VEGFR2 or
on an adjacent cell (Figures S3A and S3B). This is in agreement
Inc.

Figure 1. VEGFR2 and NRP1 Engage in cis and trans Complexes with Different Kinetics
(A) Immunoprecipitation (IP) and immunoblotting (IB) to visualize VEGFR2/NRP1 complexes.
(B) Densitometric scanning, showing fold increase compared to the 3 min time point (set to 1). n = 2 (cis), n = 3 (trans); plotted is mean ± SD.
(C and D) PLA (C) and quantification (D) of VEGFR2/NRP1 complexes (in red) in cis (C, upper panel) and trans (C, lower panel). Panels in (C) show high
magnification of representative areas. n = 3–4, up to 14 images per time period in each experiment quantified. Nuclei were visualized using Hoechst 33342 (blue);
cell membraneswere visualized using fluorescentWGA (green) in the cis condition and VEGFR2 immunostaining (green) in the trans condition. Statistical analyses
in (D) were between graph columns (presented as single data points to show non-Gaussian distribution). Scale bar, 50 mm.
See also Figure S1.
Developmental Cell
NRP1 cis and trans Regulation of VEGF Signaling
Developmental Cell 28, 633–646, March 31, 2014 ª2014 Elsevier Inc. 635
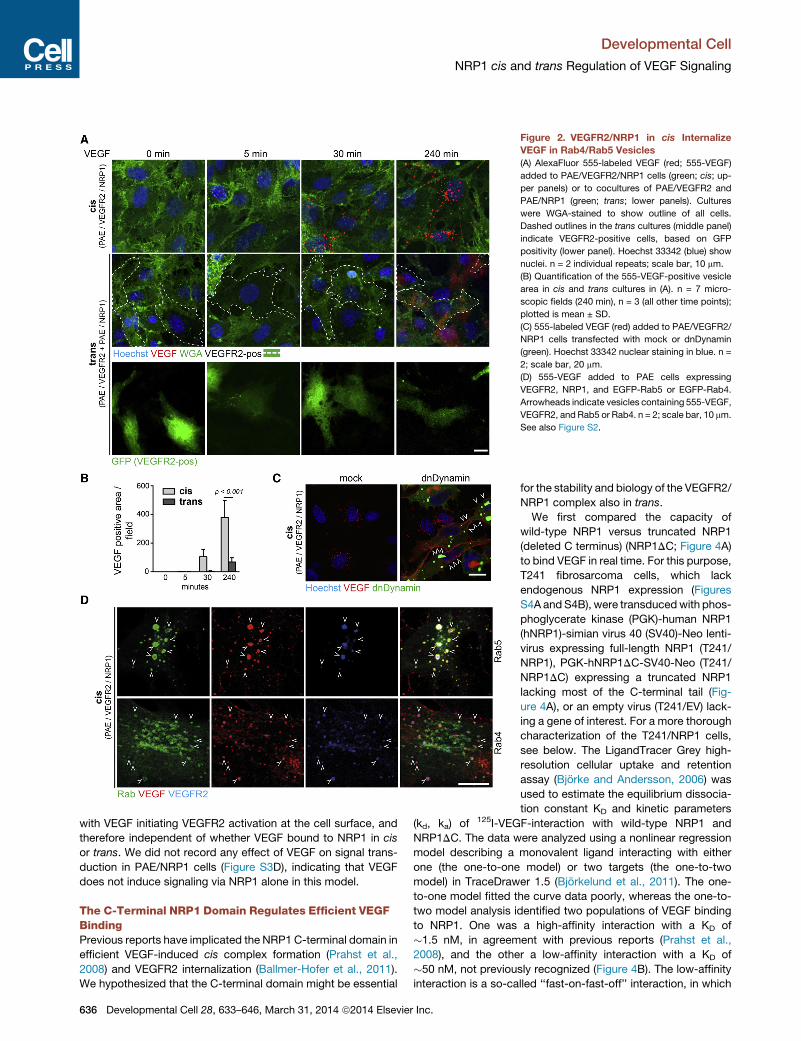
Figure 2. VEGFR2/NRP1 in cis Internalize
VEGF in Rab4/Rab5 Vesicles
(A) AlexaFluor 555-labeled VEGF (red; 555-VEGF)
added to PAE/VEGFR2/NRP1 cells (green; cis; up-
per panels) or to cocultures of PAE/VEGFR2 and
PAE/NRP1 (green; trans; lower panels). Cultures
were WGA-stained to show outline of all cells.
Dashed outlines in the trans cultures (middle panel)
indicate VEGFR2-positive cells, based on GFP
positivity (lower panel). Hoechst 33342 (blue) show
nuclei. n = 2 individual repeats; scale bar, 10 mm.
(B) Quantification of the 555-VEGF-positive vesicle
area in cis and trans cultures in (A). n = 7 micro-
scopic fields (240 min), n = 3 (all other time points);
plotted is mean ± SD.
(C) 555-labeled VEGF (red) added to PAE/VEGFR2/
NRP1 cells transfected with mock or dnDynamin
(green). Hoechst 33342 nuclear staining in blue. n =
2; scale bar, 20 mm.
(D) 555-VEGF added to PAE cells expressing
VEGFR2, NRP1, and EGFP-Rab5 or EGFP-Rab4.
Arrowheads indicate vesicles containing 555-VEGF,
VEGFR2, and Rab5 or Rab4. n = 2; scale bar, 10 mm.
See also Figure S2.
Developmental Cell
NRP1 cis and trans Regulation of VEGF Signaling
with VEGF initiating VEGFR2 activation at the cell surface, and
therefore independent of whether VEGF bound to NRP1 in cis
or trans. We did not record any effect of VEGF on signal trans-
duction in PAE/NRP1 cells (Figure S3D), indicating that VEGF
does not induce signaling via NRP1 alone in this model.
The C-Terminal NRP1 Domain Regulates Efficient VEGFBindingPrevious reports have implicated the NRP1 C-terminal domain in
efficient VEGF-induced cis complex formation (Prahst et al.,
2008) and VEGFR2 internalization (Ballmer-Hofer et al., 2011).
We hypothesized that the C-terminal domain might be essential
636 Developmental Cell 28, 633–646, March 31, 2014 ª2014 Elsevier Inc.
for the stability and biology of the VEGFR2/
NRP1 complex also in trans.
We first compared the capacity of
wild-type NRP1 versus truncated NRP1
(deleted C terminus) (NRP1DC; Figure 4A)
to bind VEGF in real time. For this purpose,
T241 fibrosarcoma cells, which lack
endogenous NRP1 expression (Figures
S4A and S4B), were transducedwith phos-
phoglycerate kinase (PGK)-human NRP1
(hNRP1)-simian virus 40 (SV40)-Neo lenti-
virus expressing full-length NRP1 (T241/
NRP1), PGK-hNRP1DC-SV40-Neo (T241/
NRP1DC) expressing a truncated NRP1
lacking most of the C-terminal tail (Fig-
ure 4A), or an empty virus (T241/EV) lack-
ing a gene of interest. For a more thorough
characterization of the T241/NRP1 cells,
see below. The LigandTracer Grey high-
resolution cellular uptake and retention
assay (Bjorke and Andersson, 2006) was
used to estimate the equilibrium dissocia-
tion constant KD and kinetic parameters
(kd, ka) of 125I-VEGF-interaction with wild-type NRP1 and
NRP1DC. The data were analyzed using a nonlinear regression
model describing a monovalent ligand interacting with either
one (the one-to-one model) or two targets (the one-to-two
model) in TraceDrawer 1.5 (Bjorkelund et al., 2011). The one-
to-one model fitted the curve data poorly, whereas the one-to-
two model analysis identified two populations of VEGF binding
to NRP1. One was a high-affinity interaction with a KD of
�1.5 nM, in agreement with previous reports (Prahst et al.,
2008), and the other a low-affinity interaction with a KD of
�50 nM, not previously recognized (Figure 4B). The low-affinity
interaction is a so-called ‘‘fast-on-fast-off’’ interaction, in which
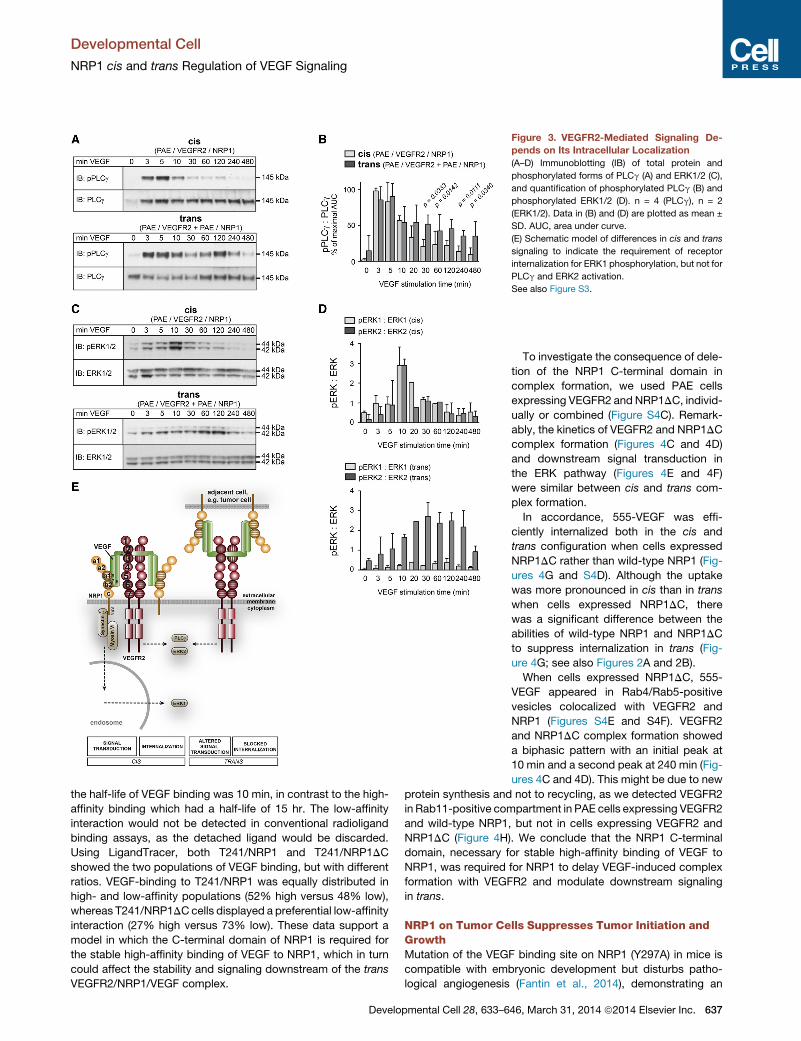
Figure 3. VEGFR2-Mediated Signaling De-
pends on Its Intracellular Localization
(A–D) Immunoblotting (IB) of total protein and
phosphorylated forms of PLCg (A) and ERK1/2 (C),
and quantification of phosphorylated PLCg (B) and
phosphorylated ERK1/2 (D). n = 4 (PLCg), n = 2
(ERK1/2). Data in (B) and (D) are plotted as mean ±
SD. AUC, area under curve.
(E) Schematic model of differences in cis and trans
signaling to indicate the requirement of receptor
internalization for ERK1 phosphorylation, but not for
PLCg and ERK2 activation.
See also Figure S3.
Developmental Cell
NRP1 cis and trans Regulation of VEGF Signaling
the half-life of VEGF binding was 10 min, in contrast to the high-
affinity binding which had a half-life of 15 hr. The low-affinity
interaction would not be detected in conventional radioligand
binding assays, as the detached ligand would be discarded.
Using LigandTracer, both T241/NRP1 and T241/NRP1DC
showed the two populations of VEGF binding, but with different
ratios. VEGF-binding to T241/NRP1 was equally distributed in
high- and low-affinity populations (52% high versus 48% low),
whereas T241/NRP1DCcells displayed a preferential low-affinity
interaction (27% high versus 73% low). These data support a
model in which the C-terminal domain of NRP1 is required for
the stable high-affinity binding of VEGF to NRP1, which in turn
could affect the stability and signaling downstream of the trans
VEGFR2/NRP1/VEGF complex.
Developmental Cell 28, 633–6
To investigate the consequence of dele-
tion of the NRP1 C-terminal domain in
complex formation, we used PAE cells
expressing VEGFR2 and NRP1DC, individ-
ually or combined (Figure S4C). Remark-
ably, the kinetics of VEGFR2 and NRP1DC
complex formation (Figures 4C and 4D)
and downstream signal transduction in
the ERK pathway (Figures 4E and 4F)
were similar between cis and trans com-
plex formation.
In accordance, 555-VEGF was effi-
ciently internalized both in the cis and
trans configuration when cells expressed
NRP1DC rather than wild-type NRP1 (Fig-
ures 4G and S4D). Although the uptake
was more pronounced in cis than in trans
when cells expressed NRP1DC, there
was a significant difference between the
abilities of wild-type NRP1 and NRP1DC
to suppress internalization in trans (Fig-
ure 4G; see also Figures 2A and 2B).
When cells expressed NRP1DC, 555-
VEGF appeared in Rab4/Rab5-positive
vesicles colocalized with VEGFR2 and
NRP1 (Figures S4E and S4F). VEGFR2
and NRP1DC complex formation showed
a biphasic pattern with an initial peak at
10 min and a second peak at 240 min (Fig-
ures 4C and 4D). This might be due to new
protein synthesis and not to recycling, as we detected VEGFR2
in Rab11-positive compartment in PAE cells expressing VEGFR2
and wild-type NRP1, but not in cells expressing VEGFR2 and
NRP1DC (Figure 4H). We conclude that the NRP1 C-terminal
domain, necessary for stable high-affinity binding of VEGF to
NRP1, was required for NRP1 to delay VEGF-induced complex
formation with VEGFR2 and modulate downstream signaling
in trans.
NRP1 on Tumor Cells Suppresses Tumor Initiation andGrowthMutation of the VEGF binding site on NRP1 (Y297A) in mice is
compatible with embryonic development but disturbs patho-
logical angiogenesis (Fantin et al., 2014), demonstrating an
46, March 31, 2014 ª2014 Elsevier Inc. 637
Figure 4. The C-Terminal NRP1 Domain
Regulates Efficient VEGF Binding
(A) Schematic outline of wild-type NRP1 and
NRP1DC structure and C-terminal amino acid
sequence.
(B) Affinity binding kinetics of 125I-VEGFA to T241
fibrosarcoma cells expressing wild-type NRP1 or
NRP1DC as determined by real-time binding mea-
surements using LigandTracer. 125I-VEGFA was
added twice, at 0 hr (5 nM) and at 3 hr (20 nM). Data
were normalized to the end of the second concen-
tration (maximum). CPS, counts per second.
(C and D) Immunoblotting (IB; C) and densitometric
quantification (D) of immunoprecipitated (IP)
VEGFR2/NRP1 complexes from PAE cells ex-
pressing VEGFR2 and NRP1DC individually or in
combination. n = 2. AUC, area under curve.
(E and F) Immunoblotting (IB) of total protein and
phosphorylated forms of ERK1/2 (E), and densito-
metric quantification of pERK1/2/ERK1/2 (F). n = 3.
Data are plotted as mean ± SD. AUC, area under
curve.
(G) Internalization of 555-VEGF quantified as posi-
tive vesicle area in cis and trans cultures expressing
NRP1DC (see Figure S4D). Quantification of 555-
VEGF-positive area in cultures expressing wild-type
NRP1 is shown as a reference (see Figure 2B). n = 7
microscopic fields (240 min), n = 3 (all other time
points); plotted is mean ± SD.
(H) AlexaFluor 555-labeled VEGF (red) added to PAE
cells expressing VEGFR2 (blue), EGFP-Rab11
(green), and NRP1 or NRP1DC. Arrowheads indi-
cate vesicles containing VEGFR2 and Rab11. n = 2;
scale bar, 10 mm.
See also Figure S4.
Developmental Cell
NRP1 cis and trans Regulation of VEGF Signaling
important role for VEGF binding to NRP1, e.g., in tumor angio-
genesis. Therefore, to investigate if the altered VEGFR2/NRP1
trans-complex-mediated signaling could influence tumor angio-
genesis, two different tumor models, B16F10 melanoma and
T241 fibrosarcoma, were used for subcutaneous injection in
mice with tamoxifen-regulated NRP1 expression in endothelial
cells (Acevedo et al., 2008; Figure 5A).
B16F10 melanoma cells express NRP1 endogenously.
Therefore, we stably knocked down (KD) NRP1 expression us-
ing lentiviral small hairpin RNA (shRNA) to create B16F10/KD-
NRP1 cells. A nontargeting shRNA was used to create the
control, B16F10/KD-Ctrl. NRP1 expression in B16F10/KD-Ctrl
and B16F10/KD-NRP1 cells was assessed by flow cytometry
(Figure 5B). Importantly, NRP1 knockdown was not complete
in B16F10/KD-NRP1 cells, resulting in residual NRP1 expres-
sion. There was no significant difference in in vitro growth prop-
638 Developmental Cell 28, 633–646, March 31, 2014 ª2014 Elsevier Inc.
erties of B16F10 tumor cells expressing
NRP1 or not (Figure S5A).
In contrast, T241 fibrosarcoma cells do
not express NRP1 endogenously and
were therefore transduced with PGK-
hNRP1-SV40-Neo lentivirus (T241/NRP1)
or with an empty virus (T241/EV), as
described above (Figures S4A and S4B).
Expression levels of NRP1 were confirmed
and compared between the cell lines by flow cytometry analysis
(Figure 5B). Proliferation in vitro of the different T241 cell lines
with and without NRP1 expression was unaffected by the pres-
ence of VEGF (Figure S5A). Proliferation of T241/NRP1 and
T241/EV cells was also similar with and without Sema3A in the
culture medium (Figure S5A). VEGF was expressed to similar ex-
tents by the different cell lines and tumors. In contrast, there was
little or no expression of Sema3A in vitro and, importantly, no
expression in vivo in tumors (Figure S5B). Furthermore, there
was no expression of vegfr2 transcript (Figure S5C) or protein
(data not shown) in the B16F10 and T241 tumor cells.
Mice with conditional deletion of nrp1 in endothelial cells were
generated by crossing nrp1 floxed (nrp1fl/fl) mice (Gu et al., 2003)
with endothelial-specific stem cell leukemia (EC-SCL)-Cre-ERT
mice (Gothert et al., 2004). Cre recombinase excision of nrp1
was thereby controlled by the 50 endothelial enhancer of the
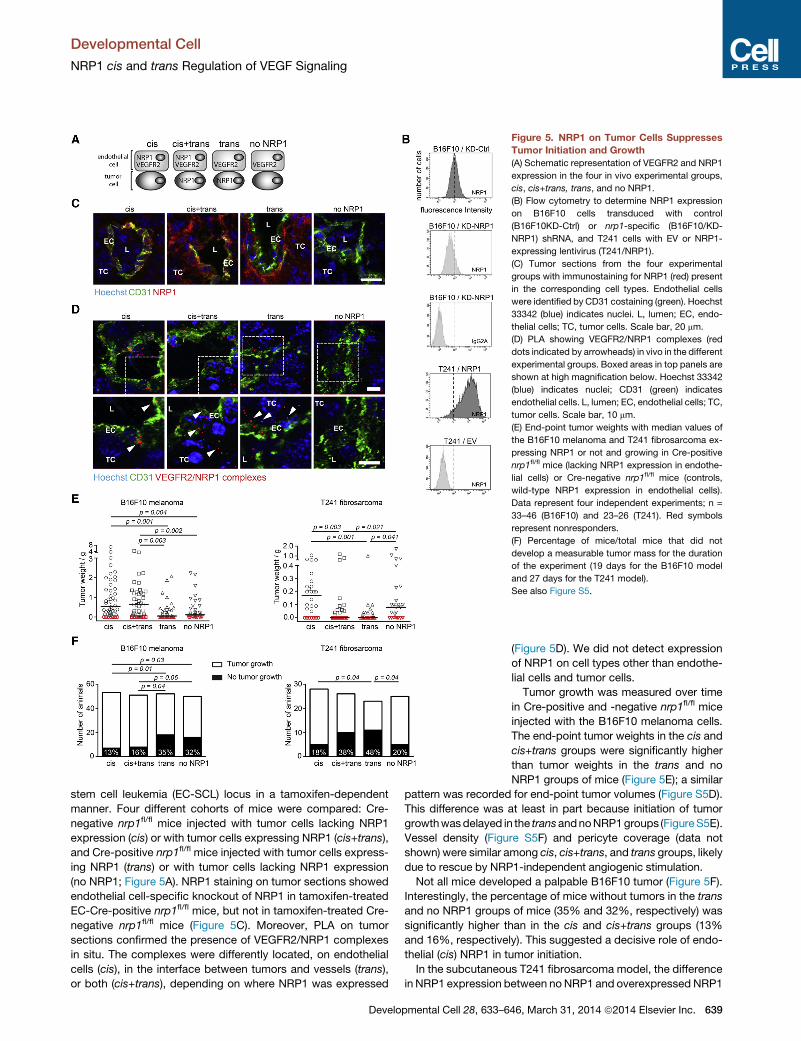
Figure 5. NRP1 on Tumor Cells Suppresses
Tumor Initiation and Growth
(A) Schematic representation of VEGFR2 and NRP1
expression in the four in vivo experimental groups,
cis, cis+trans, trans, and no NRP1.
(B) Flow cytometry to determine NRP1 expression
on B16F10 cells transduced with control
(B16F10KD-Ctrl) or nrp1-specific (B16F10/KD-
NRP1) shRNA, and T241 cells with EV or NRP1-
expressing lentivirus (T241/NRP1).
(C) Tumor sections from the four experimental
groups with immunostaining for NRP1 (red) present
in the corresponding cell types. Endothelial cells
were identified by CD31 costaining (green). Hoechst
33342 (blue) indicates nuclei. L, lumen; EC, endo-
thelial cells; TC, tumor cells. Scale bar, 20 mm.
(D) PLA showing VEGFR2/NRP1 complexes (red
dots indicated by arrowheads) in vivo in the different
experimental groups. Boxed areas in top panels are
shown at high magnification below. Hoechst 33342
(blue) indicates nuclei; CD31 (green) indicates
endothelial cells. L, lumen; EC, endothelial cells; TC,
tumor cells. Scale bar, 10 mm.
(E) End-point tumor weights with median values of
the B16F10 melanoma and T241 fibrosarcoma ex-
pressing NRP1 or not and growing in Cre-positive
nrp1fl/fl mice (lacking NRP1 expression in endothe-
lial cells) or Cre-negative nrp1fl/fl mice (controls,
wild-type NRP1 expression in endothelial cells).
Data represent four independent experiments; n =
33–46 (B16F10) and 23–26 (T241). Red symbols
represent nonresponders.
(F) Percentage of mice/total mice that did not
develop a measurable tumor mass for the duration
of the experiment (19 days for the B16F10 model
and 27 days for the T241 model).
See also Figure S5.
Developmental Cell
NRP1 cis and trans Regulation of VEGF Signaling
stem cell leukemia (EC-SCL) locus in a tamoxifen-dependent
manner. Four different cohorts of mice were compared: Cre-
negative nrp1fl/fl mice injected with tumor cells lacking NRP1
expression (cis) or with tumor cells expressing NRP1 (cis+trans),
and Cre-positive nrp1fl/fl mice injected with tumor cells express-
ing NRP1 (trans) or with tumor cells lacking NRP1 expression
(no NRP1; Figure 5A). NRP1 staining on tumor sections showed
endothelial cell-specific knockout of NRP1 in tamoxifen-treated
EC-Cre-positive nrp1fl/fl mice, but not in tamoxifen-treated Cre-
negative nrp1fl/fl mice (Figure 5C). Moreover, PLA on tumor
sections confirmed the presence of VEGFR2/NRP1 complexes
in situ. The complexes were differently located, on endothelial
cells (cis), in the interface between tumors and vessels (trans),
or both (cis+trans), depending on where NRP1 was expressed
Developmental Cell 28, 633–6
(Figure 5D). We did not detect expression
of NRP1 on cell types other than endothe-
lial cells and tumor cells.
Tumor growth was measured over time
in Cre-positive and -negative nrp1fl/fl mice
injected with the B16F10 melanoma cells.
The end-point tumor weights in the cis and
cis+trans groups were significantly higher
than tumor weights in the trans and no
NRP1 groups of mice (Figure 5E); a similar
pattern was recorded for end-point tumor volumes (Figure S5D).
This difference was at least in part because initiation of tumor
growthwasdelayed in the transandnoNRP1groups (FigureS5E).
Vessel density (Figure S5F) and pericyte coverage (data not
shown) were similar among cis, cis+trans, and trans groups, likely
due to rescue by NRP1-independent angiogenic stimulation.
Not all mice developed a palpable B16F10 tumor (Figure 5F).
Interestingly, the percentage of mice without tumors in the trans
and no NRP1 groups of mice (35% and 32%, respectively) was
significantly higher than in the cis and cis+trans groups (13%
and 16%, respectively). This suggested a decisive role of endo-
thelial (cis) NRP1 in tumor initiation.
In the subcutaneous T241 fibrosarcoma model, the difference
in NRP1 expression between noNRP1 and overexpressed NRP1
46, March 31, 2014 ª2014 Elsevier Inc. 639

Figure 6. Inhibition of Angiogenesis by NRP1 in trans Is Dependent on the NRP1 C-Terminal Tail
(A) Schematic overview of the experimental setups for the T241 tumor and tumor-matrigel studies.
(B–D) Quantification (B), representative overview (C), and high-magnification images (D) of CD31-positive vessels in matrigel tumors containing T241 cells.
(B) CD31-positive area normalized to total section area with data pooled from two independent experiments. Four to eight animals (with two matrigel tumors per
animal) were used per experimental group in each experiment.
(C) Nuclei visualized by Hoechst 33342 staining show cell contents in the matrigel tumors (arrowheads). Scale bar, 500 mm.
(D) High magnification of images in (C). Blue, Hoechst 33342; green, CD31. Scale bar, 50 mm.
(legend continued on next page)
Developmental Cell
NRP1 cis and trans Regulation of VEGF Signaling
640 Developmental Cell 28, 633–646, March 31, 2014 ª2014 Elsevier Inc.

Developmental Cell
NRP1 cis and trans Regulation of VEGF Signaling
was substantial (Figure 5B), which might explain why the T241
tumor weights in cis+trans and trans groups were significantly
decreased compared to the cis and no NRP1 groups (Figures
5E and S5D). The difference was at least in part due to delayed
initiation of tumor growth in the cis+trans and trans groups (Fig-
ure S5E). These results confirm that tumor cell NRP1 in trans
does not compensate for the loss of endothelial cisNRP1. Vessel
density (Figure S5F) and pericyte coverage (data not shown) in
the T241 tumors were not significantly different between cis
and trans groups. We verified significant Cre-mediated excision
of nrp1 from endothelial cells in the T241 tumors (Figure S5G).
These observations suggested that once tumor growth was initi-
ated, any potential difference in vessel parameters due to loss of
NRP1 in endothelial cells was compensated by NRP1-indepen-
dent angiogenic stimulation.
As shown in Figure 5F, the number of T241-injected mice
without tumors in the cis+trans and trans groups (38% and
48%, respectively) was significantly higher than in the cis and
no NRP1 groups (18% and 20%, respectively). These data indi-
cate that the trans-expressed NRP1 (in the cis+trans and trans
cohorts) efficiently suppressed tumor formation, irrespective of
whether NRP1 was expressed in endothelial cells or not.
NRP1 on Tumor Cells in trans Suppresses Early TumorVascularizationAs shown in Figure 5F, NRP1 expressed in trans on tumor cells
suppressed tumor initiation. However, in the subcutaneous
B16F10 and T241 models, this suppressive trans effect of
NRP1 was rescued by NRP1-independent angiogenesis in a
large proportion of the cohorts, resulting in tumors that eventu-
ally showed no difference in vascular density regardless of
whether VEGFwas presented in cis or in trans. To study the early
stage of tumor development under cis and trans conditions, we
injected tumor cells suspended in matrigel and harvested the
matrigel tumors after 7 days. Thereby, we could monitor early tu-
mor vascularization before tumor takeoff and non-NRP1-depen-
dent growth. See Figure 6A for design of long-term tumor studies
shown in Figure 5 versus the short-term matrigel tumor studies
shown in Figure 6.
T241 cells expressing wild-type NRP1, NRP1DC, or trans-
duced with empty lentivirus (EV) were suspended in matrigel
and injected subcutaneously in Cre-positive and -negative
nrp1fl/fl mice, treated with tamoxifen. After 7 days, the matrigel
tumors were removed. Macroscopically, T241/EV matrigel tu-
mors (cis) often appeared red, while T241/NRP1 matrigel tumors
(trans) were paler (Figures S6A and S6B). Quantification of vessel
density in the matrigel tumors showed that wild-type trans NRP1
inhibited CD31-positive vascularization in Cre-negative nrp1fl/fl
mice (cis+trans). Vascularization in matrigel tumors where tumor
cells expressed the truncated NRP1DC was significantly higher
(E) Immunodetection of VEGF using a sFlt1 domain (red) and antibodies against C
Scale bar, 10 mm.
(F) Complex formation between VEGFR2 and NRP1 or NRP1DC in T241 matrigel
NRP1 or NRP1DC in trans (in tumor cells). Tumor lysates were immunoprecipitate
Each lane represents the NRP1:VEGFR2 ratio in an individual tumor. Bars indica
(G) Immunoblotting (IB) of individual tumor-matrigel tissue lysates (each lane repr
(H) Quantification of data in (G) showing the normalized pERK1/pERK2 ratio. n =
See also Figure S6.
Develo
than when tumor cells expressed wild-type NRP1 (compare
cis+trans with cis+trans DC versus cis; Figure 6B). These data
confirm an important role for the NRP1 C-terminal tail in estab-
lishment of the trans effect (see Figure 4). Matrigel tumors from
Cre-positive nrp1fl/fl mice (no NRP1 in endothelial cells) showed
similar, limited vascularization, irrespective of whether tumor
cells expressed no NRP1, wild-type NRP1, or NRP1DC. All con-
ditions showed tumor growth in the matrigel (Figure 6C); still the
CD31-positive area within the tumor-dense regions was signifi-
cantly lower when NRP1 was presented in trans (Figures 6B
and 6D).
The reduced vascularization of the cis+trans and transmatrigel
tumors was not due to differences in VEGF accessibility. A solu-
ble Flt1 extracellular domain (sFlt1), known to bind VEGF with
high affinity (Koch et al., 2011), was used to detect VEGF in the
matrigel tumors. Binding of sFlt1 showed an equal and broad
expression of VEGF regardless of the expression pattern of
NRP1 (Figure 6E).
Taken together, these data indicate that the mechanism of
tumor inhibition through trans NRP1 might be mediated by inhi-
bition of vessel recruitment into the tumor. We asked whether
this inhibition might involve the nonpermissive signal trans-
duction regulated by VEGF binding in trans to NRP1 as was
observed in vitro (see Figure 3). Analysis by immunoprecipita-
tion/immunoblotting showed that complex formation between
VEGFR2 and NRP1 was low, probably reflecting turnover, and
similar in the different conditions (Figure 6F). On the other
hand, immunoblotting of the tumor lysates revealed that accu-
mulation of phospho ERK1 (pERK1) was significantly sup-
pressed in vivo in the trans matrigel tumors (Figures 6G and
6H). All other conditions showed a higher pERK1/pERK2 ratio
compared to trans, in agreement with the in vitro data on
trans-modulated VEGFR2 signaling (see Figure 3). It is conceiv-
able that this trans-effect on the pErk1/pErk2 ratio was exerted
on low levels of remaining cis-expressed NRP1 activity in the
tamoxifen-treated mice, explaining the higher pErk1/pErk2 ratio
in the no NRP1 than in the trans condition.
NRP1 in Regulation of Endothelial SproutingDevelopmental angiogenesis in the retina follows a strictly
patterned radial outgrowth of vessels headed by sprouting tip
cells followed by nonsprouting stalk cells (Phng and Gerhardt,
2009). We hypothesized that NRP1 might suppress sprouting
in the stalk region by trans-modulation of VEGFR2 signaling be-
tween adjacent endothelial cells. We therefore studied retinas of
Cre-positive nrp1fl/fl p5 pups after suboptimal treatment with
tamoxifen to create a condition of mosaic expression of NRP1.
Tamoxifen-treated Cre-negative pups were examined in parallel
(wild-type). The extent of angiogenic sprouting in the stalk
region of the retina was determined in areas expressing NRP1
D31 (green). Hoechst 33342 stain shows nuclei (blue). L, lumen; Ma, matrigel.
tumors from cohorts expressing NRP1 in cis (in endothelial cells) or expressing
d with anti-VEGFR2 antiserum followed by blotting with anti-NRP1 antiserum.
te mean value ± SD; n = 8.
esents one tumor) showing total protein and phosphorylated forms of ERK1/2.
7–8; data are plotted as mean ± SD.
pmental Cell 28, 633–646, March 31, 2014 ª2014 Elsevier Inc. 641
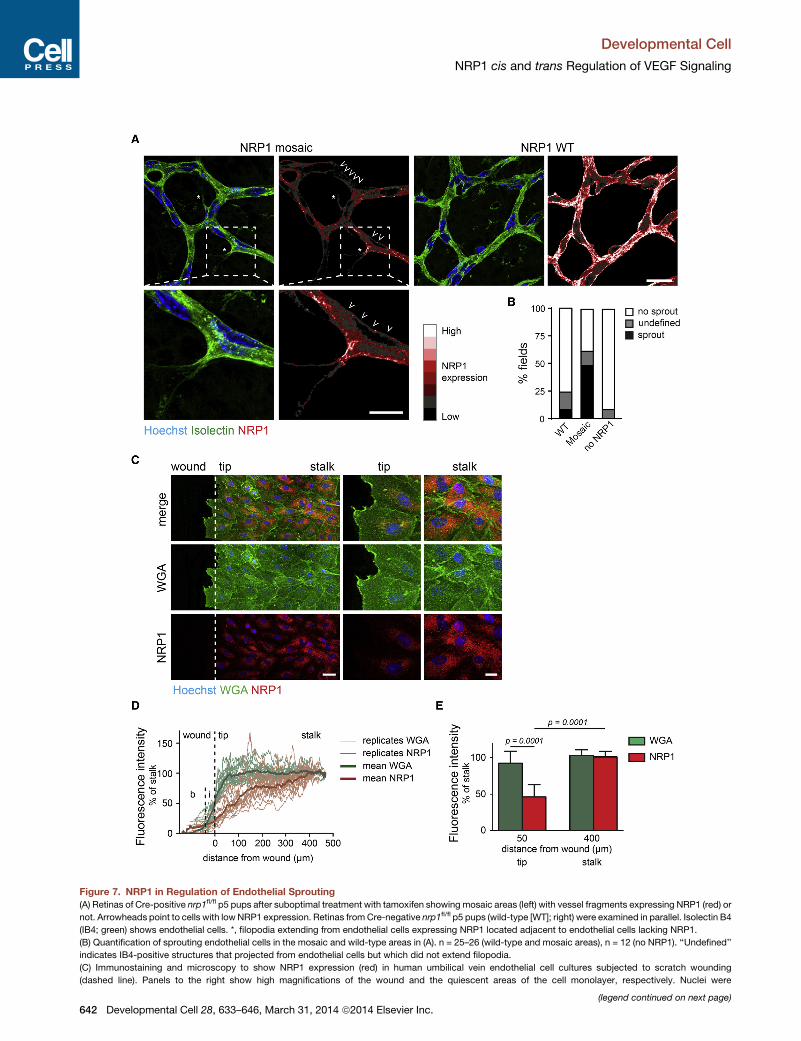
Figure 7. NRP1 in Regulation of Endothelial Sprouting
(A) Retinas of Cre-positive nrp1fl/fl p5 pups after suboptimal treatment with tamoxifen showing mosaic areas (left) with vessel fragments expressing NRP1 (red) or
not. Arrowheads point to cells with lowNRP1 expression. Retinas fromCre-negative nrp1fl/fl p5 pups (wild-type [WT]; right) were examined in parallel. Isolectin B4
(IB4; green) shows endothelial cells. *, filopodia extending from endothelial cells expressing NRP1 located adjacent to endothelial cells lacking NRP1.
(B) Quantification of sprouting endothelial cells in the mosaic and wild-type areas in (A). n = 25–26 (wild-type and mosaic areas), n = 12 (no NRP1). ‘‘Undefined’’
indicates IB4-positive structures that projected from endothelial cells but which did not extend filopodia.
(C) Immunostaining and microscopy to show NRP1 expression (red) in human umbilical vein endothelial cell cultures subjected to scratch wounding
(dashed line). Panels to the right show high magnifications of the wound and the quiescent areas of the cell monolayer, respectively. Nuclei were
(legend continued on next page)
Developmental Cell
NRP1 cis and trans Regulation of VEGF Signaling
642 Developmental Cell 28, 633–646, March 31, 2014 ª2014 Elsevier Inc.
Developmental Cell
NRP1 cis and trans Regulation of VEGF Signaling
(wild-type), in the borders between areas expressing NRP1 or
not (mosaic regions), and within the NRP1-deficient area (no
NRP1). Sprouting was induced in the mosaic areas of the stalk
region and occurred in endothelial cells expressing NRP1 in
close proximity to non-NRP1-expressing cells (Figure 7A; quan-
tification in Figure 7B). In contrast, sprouting was efficiently sup-
pressed in the wild-type retina as well as in areas lacking NPR1
expression.
Differences in relative expression of NRP1 may occur physio-
logically. NRP1 was efficiently downregulated in cells bordering
the wound in a monolayer of VEGF-treated primary endothelial
cell cultures (Figures 7C–7E). These data are compatible with a
model where NRP1 expression suppresses induction of angio-
genic sprouting between adjacent endothelial cells in a cis+trans
configuration, dependent on the relative expression levels
of NRP1. Moreover, endothelial quiescence can be overcome
through downregulation of NRP1 on adjacent endothelial cells.
DISCUSSION
The data presented here support a model where expression of
NRP1 on nonendothelial cells can suppress angiogenesis and
reduce initiation of tumor growth via altered VEGFR2 internaliza-
tion and signaling. This could be a critical mechanism in tumor
dormancy where healthy individuals can harbor microscopic tu-
mors and dysplastic foci for many years, which do not progress
without angiogenesis (Albini et al., 2012). Moreover, our data
indicate that downregulation of NRP1 expression might over-
come vascular quiescence. The relative expression levels of
NRP1 between neighboring endothelial cells will determine the
ability of NRP1 to promote or arrest productive VEGFR2
signaling. Combined, our data identify an important trans-regu-
lating effect of nonendothelial- and endothelial-cell-expressed
NRP1 (Figure 8).
The need for VEGFR2 internalization for proper signaling has
been recognized in several reports (Lanahan et al., 2010; for ref-
erences, see Koch et al., 2011). Indeed, signaling in the AKT and
ERK pathways can be initiated from the endosomal compart-
ment (Sorkin and von Zastrow, 2009). We show that arrest of
VEGFR2 at the endothelial cell surface by VEGF/NRP1 in trans
resulted in loss of ERK1 activation, whereas ERK2 activity was
prolonged. While ERK1 and ERK2 proteins are coexpressed in
most tissues and have been regarded as redundant, recent
data indicate that ERK2, but not ERK1, contributes to Ras-
induced oncogenic signaling (Shin et al., 2010) and that ERK1
may have an inhibitory effect on ERK2 (Lloyd, 2006). Our
in vitro and in vivo data indicate that balanced ERK1/ERK2
signaling might be critical in initiation of angiogenesis. In agree-
ment, signaling in the Ras pathway is critical for angiogenic
sprouting (Westenskow et al., 2013).
Less is known about sustained PLCg activation, which was
present in trans but not in cis, probably due to internalization
and degradation of cis signaling complexes. PLCg competes
stained with Hoechst 33342 (blue); plasma membranes were stained with Alexa
(right).
(D) Relative fluorescence intensity measured in microscopy images as shown
experiment. b, background; i, invading front.
(E) Relative fluorescence intensity at 50 mm (tip) and 400 mm (stalk) distance from
Develo
with phosphatidylinositol 3-kinase (PI3K) for the same sub-
strate, phosphatidyl-inositol 4,5 bisphosphate (PIP2). Interest-
ingly, PI3K is essential for tube formation in vitro, whereas
PLCg promotes regression of tubes by competing for PIP2 (Im
and Kazlauskas, 2006). Therefore, trans presentation of VEGF
and sustained PLCg activation might have contributed to the
reduced vascular density in matrigel tumors.
NRP1 expression has been linked to tumor aggressiveness
and progression; however, information is often lacking with re-
gard to which cell type in the tumor microenvironment expresses
NRP1. A recent report (Jubb et al., 2012) confirms the expression
of NRP1 in tumor cells on a subset of human cancers, such as
non-small-cell lung cancer. Previous studies have addressed
the consequence of NRP1 expression in tumor cells with con-
flicting results. NRP1 overexpression promotes tumor vascular-
ization and growth, for example in rat prostate carcinoma (Miao
et al., 2000) and U87MG glioblastoma (Hu et al., 2007). In
contrast, growth of PANC-1 pancreatic cancer is reduced with
NRP1 overexpression and enhanced with NRP1 suppression
(Gray et al., 2005). One confounding factor may be the potential
expression of class 3 semaphorins, which bind to NRP1 and
induce antiangiogenic effects (for a review, see Muratori and
Tamagnone, 2012). Sema3a might influence vascular properties
in a NRP1-dependent manner resulting, e.g., in excess vascular
permeability in diabetic retinopathy (Cerani et al., 2013). Impor-
tantly, therewas no effect of Sema3a onNRP1-expressing tumor
cell lines in vitro and Sema3a was not expressed in vivo in the
tumors. Moreover, cells expressing NRP1 but not VEGFR2
lacked signs of VEGF-induced NRP1 signaling or biological
responsiveness. Thus, in the vasculature, NRP1 modulates
VEGFR2 signaling in response to VEGF but does not directly
transduce signals upon binding of VEGF.
Trans expression of NRP1 in subcutaneous tumors reduced
the incidence of tumor establishment (tumor initiation). Hanahan
and Folkman (1996) coined the expression ‘‘angiogenic switch’’
to indicate the critical role for angiogenesis during tumor initia-
tion. The ability of cells undergoing epithelial-mesenchymal
transition to produce VEGF and promote angiogenesis is critical
for tumor initiation (Fantozzi et al., 2014). Trans-presentation of
VEGF by NRP1 expressed on tumor cells offers a mechanism
whereby the switch might be delayed, e.g., to maintain tumor
dormancy. It is unlikely that antitumor immunity and inflamma-
tion contributed to the NRP1-dependent tumor suppression,
as there was no NRP1 expression on cells other than the endog-
enous expression on endothelial cells or on B16F10 tumor cells
or transduced expression on T241 tumor cells. Furthermore, dif-
ferences in tumor initiation were observed early (7 days after
inoculation) in the subcutaneous tumor models.
Once tumors started to grow, there was no difference in the
growth rate or in vascular density between the different groups
(cis, cis+trans, trans, or no NRP1 expression), most likely due
to compensation by other NRP1- and VEGF-independent,
angiogenic stimuli. In order to facilitate the early phase of tumor
Fluor 488-labeled WGA (green). Scale bars represent 50 mm (left) and 20 mm
in (A) at different positions relative to the wound. n = 3 with five images per
the wound. Statistical analysis from (B); plotted are mean values ± SD.
pmental Cell 28, 633–646, March 31, 2014 ª2014 Elsevier Inc. 643

Figure 8. Summary of Consequences of Presenting NRP1 in cis and in trans
Schematic outline concluding the data presented in the study, listing the parameters assessed and the different outcomes dependent on whether NRP1 was
expressed in cis or in trans.
Developmental Cell
NRP1 cis and trans Regulation of VEGF Signaling
establishment, we injected tumor cells with or without NRP1
expression suspended in matrigel as a size-standardized matrix,
which allowed growth of tumor cells during the early, decisive
phase. Thereby, we could analyze also the noncompensated
trans and cis+trans conditions, which were characterized by
reduced vascular density. Our data firmly support the conclu-
sion that NRP1 might suppress VEGF-dependent processes
through a trans-dependent mechanism. Interestingly, tumors
expressing a mutant NRP1 missing most of its C-terminal
domain did not show trans-suppressed angiogenesis, probably
due to the short half-life of VEGF retention. VEGF was released
within a few minutes from the truncated NRP1, whereas most of
VEGF bound to wild-type NRP1 was very stably retained for
many hours. These data raise the question why there is only a
very mild angiogenic phenotype in the NRP1DC mouse (Fantin
et al., 2011). The expression level of NRP1DC is elevated
compared to that of full-length NRP1 in wild-type mice (data
not shown); the elevated expression as well as other molecular
changes in the NRP1DC mouse might allow a compensatory
escape that conceals the consequence of the reduced VEGF
retention by truncated NRP1. Moreover, although development
644 Developmental Cell 28, 633–646, March 31, 2014 ª2014 Elsevier
proceeds essentially undisturbed in the NRP1DC mouse, tumor
angiogenesis remains to be analyzed. We cannot exclude other
effects of deleting the NRP1 C-terminal domain that might have
influenced results presented here, such as loss of other molec-
ular interactions and changes in the cell surface distribution.
Such potential changes might underlie the rapid kinetics of
VEGFR2/NRP1DC complex formation both in cis and in trans.
In another study from Fantin and colleagues, NRP1 expressed
on macrophages or neuronal cells was shown not to influence
vascular branching in E11 hindbrains (Fantin et al., 2013),
implying that trans-effect of NRP1 described here would not
play a role during development. A more recent study (Fantin
et al., 2014) on the phenotype of a mouse expressing mutant
NRP1 (Y297A) unable to bind VEGF shows that postnatal and
pathological angiogenesis, but not embryonic development, de-
pends on VEGF binding to NRP1. This is in agreement with the
model presented here (Figure 8). Notch pathway signaling is a
major determinant in the switch between angiogenic sprouting
and vascular quiescence (Phng and Gerhardt, 2009). It
is an interesting possibility that dynamic regulation of NRP1
expression is influenced by Notch.
Inc.
Developmental Cell
NRP1 cis and trans Regulation of VEGF Signaling
Overall, our data indicate that cis presentation of VEGF by
NRP1 to VEGFR2 is favored over trans due to the rapid kinetics
of complex formation in cis, at least as represented in vitro
by feeding of starved cells with saturating concentrations of
VEGF. However, internalization of cis complexes consisting
of VEGFR2/NRP1/VEGF might reduce cell surface expression
of NRP1 on the endothelial cell. VEGF produced by an adjacent
cell, such as a tumor cell that also expresses NRP1, might be re-
tained by NRP1 on the producer cell. In the NRP1-transduced
T241 tumors, trans presentation of VEGF suppressed the cis
response, indicating a higher trans than cis presentation. In
contrast, in the B16F10 tumors where NRP1 had been silenced
but not completely suppressed, cis dominated over trans. More-
over, in the developing retinal vasculature, the relative expres-
sion levels of NRP1 on adjacent endothelial cells determined
the extent of angiogenic sprouting. Therefore, dependent on
the local, potentially dynamically regulated ratio of NRP1 ex-
pressed in trans relative to cis, trans presentation might domi-
nate and suppress VEGFR2 function in a manner relevant for
both physiological and pathological angiogenesis.
EXPERIMENTAL PROCEDURES
Animal Studies
Animal work was approved by the Uppsala University board of animal
experimentation.Endothelial-cell-specific, tamoxifen-inducibleNRP1knockout
mice were obtained by crossing nrp1fl/fl mice (Gu et al., 2003) with transgenic
miceexpressing tamoxifen-inducibleCrecontrolledby theEC-SCL locus (Goth-
ert et al., 2004). B16F10/KD-Ctrl (control), B16F10/KD-NRP1, T241/EV (empty
vector), or T241/NRP1 cells were injected subcutaneously. Tumor size was
measured with a caliper in a blinded procedure. T241/NRP1, T241/NRP1DC,
or T241/EV were mixed with matrigel and injected into the left and right flank
of the EC-SCL-Cre-ERT-positive (or -negative as control) nrp1fl/fl mice. Matrigel
plugs were dissected after 7 days. All groups of mice received tamoxifen.
Fluorescent VEGF Ligand
Murine VEGFA164 (Peprotech), denoted VEGF in this study, was labeled with
AlexaFluor 555 (Microscale Protein Labeling Kit; Invitrogen) and incubated
with serum-starved PAE cells. The cell membrane was stained on ice with
AlexaFluor 647-conjugated wheat germ agglutinin (WGA). After fixation and
permeabilization, nuclei were stained with Hoechst 33342. The VEGF-positive
vesicle area was estimated using ImageJ Software (National Institutes of
Health) and normalized to the total image area (field). For endocytosis studies,
cells were transfected with EGFP-tagged Rab4, Rab5, or Rab11 prior to stim-
ulation with 555-labeled VEGF and staining for VEGFR2.
Immunofluorescent Staining
Microscopy was done on a Zeiss LSM700 microscope with the Zen software
(Zeiss) or on a Zeiss AxioImager M2 microscope with the Zeiss AxioVision Rel.
4.8 software. Image acquisition was done with a 633 objective for cells and
retinas and 203 objective for tissue sections. Processing of microphotographs
was done using Adobe Photoshop (Adobe Systems).
In Situ PLA
Cells were stimulated with VEGF fixed with 4% paraformaldehyde. Protein-
protein complexes were visualized by in situ PLA using the Duolink Detection
kit (Olink Bioscience) with Duolink Blocking solution and Detection protocol.
The number of PLA signals was quantified using Image analysis tool software
(Olink Bioscience) and normalized to the number of nuclei.
Lentiviral Transductions
Full-length and C-terminal-truncated hNRP1 cDNAs were cloned in a lentiviral
backbone, carrying an SV40-driven G418 resistance gene (see Supplemental
Experimental Procedures for details). Lentiviral hNRP1 knockdown plasmids
were obtained from Sigma. PAE, T241, or B16F10 cells were transduced
Develo
with indicated lentiviruses and subsequently selected with the appropriate
antibiotic.
Real-Time Binding Measurements to Estimate Affinity on Cells
Estimations of the affinity and kinetic properties of the interaction between125I-labeled VEGF and T241 cells expressing either wild-type NRP1 (T241/
NRP1) or C-terminally truncated NRP1 (T241/NRP1DC) were performed using
LigandTracer Grey (Ridgeview Instruments) at room temperature, as described
(Bjorkelund et al., 2011). To determine the contribution of the two separate
interactions to the measured curve, the one-to-two model in TraceDrawer 1.5
(Ridgeview Instruments) was employed to obtain the best curve fit.
Statistics
Tumor size and weight were compared between the experimental groups us-
ing the Kruskal-Wallis test. When the p value from this overall test was <0.05,
pair-wise comparisons between the groups were performed using the Mann-
Whitney test. All tests were two-tailed and p < 0.05 was considered a statisti-
cally significant result. The statistical package SAS for Windows version 9.2
was used for the calculations.
See Supplemental Experimental Procedures for additional procedures.
SUPPLEMENTAL INFORMATION
Supplemental Information includes Supplemental Experimental Procedures
and six figures and can be found with this article online at http://dx.doi.org/
10.1016/j.devcel.2014.02.010.
ACKNOWLEDGMENTS
We would like to thank Lars Berglund (Uppsala University) for statistical anal-
ysis and Mark A. McNiven (Mayo Clinic, Rochester, MN) for providing domi-
nant-negative dynamin cDNA. Imaging and flow cytometry were performed
with support of the BioVis SciLife Platform and its expert personnel Sara Pe-
tersson, Matyas Molnar, and Dirk Pacholsky. We also gratefully acknowledge
Weilan Ye (Genentech, South San Francisco, CA) for providing antibodies
against the NRP1 extracellular domain (anti-NRP1b). We thank Christina
Welsh for critical reading of the manuscript and Ronny Gerbach for mathemat-
ically correct presentation of statistics according to norms by the Deutsches
Institut fur Normung e.V. This study was supported by grants to L.C.-W.
from the Swedish Cancer Foundation, the Swedish Science Council, and the
Knut and Alice Wallenberg Foundation, to S.K. from Uppsala University, and
to L.A.v.M. from the Dutch Cancer Society. H.B. is employed by and owns
shares in Ridgeview Instruments.
Received: January 4, 2013
Revised: November 4, 2013
Accepted: February 13, 2014
Published: March 20, 2014
REFERENCES
Acevedo, L.M., Barillas, S., Weis, S.M., Gothert, J.R., and Cheresh, D.A.
(2008). Semaphorin 3A suppresses VEGF-mediated angiogenesis yet acts
as a vascular permeability factor. Blood 111, 2674–2680.
Albini, A., Tosetti, F., Li, V.W., Noonan, D.M., and Li, W.W. (2012). Cancer pre-
vention by targeting angiogenesis. Nat. Rev. Clin. Oncol. 9, 498–509.
Ballmer-Hofer, K., Andersson, A.E., Ratcliffe, L.E., and Berger, P. (2011).
Neuropilin-1 promotes VEGFR-2 trafficking through Rab11 vesicles thereby
specifying signal output. Blood 118, 816–826.
Bielenberg, D.R., Pettaway, C.A., Takashima, S., and Klagsbrun, M. (2006).
Neuropilins in neoplasms: expression, regulation, and function. Exp. Cell
Res. 312, 584–593.
Bjorke, H., and Andersson, K. (2006). Automated, high-resolution cellular
retention and uptake studies in vitro. Appl. Radiat. Isot. 64, 901–905.
Bjorkelund, H., Gedda, L., and Andersson, K. (2011). Comparing the epidermal
growth factor interaction with four different cell lines: intriguing effects imply
strong dependency of cellular context. PLoS ONE 6, e16536.
pmental Cell 28, 633–646, March 31, 2014 ª2014 Elsevier Inc. 645
Developmental Cell
NRP1 cis and trans Regulation of VEGF Signaling
Cai, H., and Reed, R.R. (1999). Cloning and characterization of neuropilin-1-in-
teracting protein: a PSD-95/Dlg/ZO-1 domain-containing protein that interacts
with the cytoplasmic domain of neuropilin-1. J. Neurosci. 19, 6519–6527.
Cao, H., Thompson, H.M., Krueger, E.W., and McNiven, M.A. (2000).
Disruption of Golgi structure and function in mammalian cells expressing a
mutant dynamin. J. Cell Sci. 113, 1993–2002.
Cerani, A., Tetreault, N., Menard, C., Lapalme, E., Patel, C., Sitaras, N.,
Beaudoin, F., Leboeuf, D., De Guire, V., Binet, F., et al. (2013). Neuron-derived
semaphorin 3A is an early inducer of vascular permeability in diabetic retinop-
athy via neuropilin-1. Cell Metab. 18, 505–518.
Fantin, A., Schwarz, Q., Davidson, K., Normando, E.M., Denti, L., and
Ruhrberg, C. (2011). The cytoplasmic domain of neuropilin 1 is dispensable
for angiogenesis, but promotes the spatial separation of retinal arteries and
veins. Development 138, 4185–4191.
Fantin, A., Vieira, J.M., Plein, A., Denti, L., Fruttiger, M., Pollard, J.W., and
Ruhrberg, C. (2013). NRP1 acts cell autonomously in endothelium to promote
tip cell function during sprouting angiogenesis. Blood 121, 2352–2362.
Fantin, A., Herzog, B., Mahmoud, M., Yamaji, M., Plein, A., Denti, L., Ruhrberg,
C., and Zachary, I. (2014). Neuropilin 1 (NRP1) hypomorphism combined with
defective VEGF-A binding reveals novel roles for NRP1 in developmental and
pathological angiogenesis. Development 141, 556–562.
Fantozzi, A., Gruber, D.C., Pisarsky, L., Heck, C., Kunita, A., Yilmaz, M.,
Meyer-Schaller, N., Cornille, K., Hopfer, U., Bentires-Alj, M., and Christofori,
G. (2014). VEGF-mediated angiogenesis links EMT-induced cancer stemness
to tumor initiation. Cancer Res. . Published online January 10, 2014. http://dx.
doi.org/10.1158/0008-5472. CAN-13-1641.
Goshima, Y., Hori, H., Sasaki, Y., Yang, T., Kagoshima-Maezono, M., Li, C.,
Takenaka, T., Nakamura, F., Takahashi, T., Strittmatter, S.M., et al. (1999).
Growth cone neuropilin-1 mediates collapsin-1/Sema III facilitation of antero-
and retrograde axoplasmic transport. J. Neurobiol. 39, 579–589.
Gothert, J.R., Gustin, S.E., van Eekelen, J.A., Schmidt, U., Hall, M.A., Jane,
S.M., Green, A.R., Gottgens, B., Izon, D.J., and Begley, C.G. (2004).
Genetically tagging endothelial cells in vivo: bone marrow-derived cells do
not contribute to tumor endothelium. Blood 104, 1769–1777.
Gray, M.J., Wey, J.S., Belcheva, A., McCarty, M.F., Trevino, J.G., Evans, D.B.,
Ellis, L.M., and Gallick, G.E. (2005). Neuropilin-1 suppresses tumorigenic
properties in a human pancreatic adenocarcinoma cell line lacking neuropi-
lin-1 coreceptors. Cancer Res. 65, 3664–3670.
Gu, C., Rodriguez, E.R., Reimert, D.V., Shu, T., Fritzsch, B., Richards, L.J.,
Kolodkin, A.L., and Ginty, D.D. (2003). Neuropilin-1 conveys semaphorin and
VEGF signaling during neural and cardiovascular development. Dev. Cell 5,
45–57.
Hanahan, D., and Folkman, J. (1996). Patterns and emerging mechanisms of
the angiogenic switch during tumorigenesis. Cell 86, 353–364.
Horowitz, A., and Seerapu, H.R. (2012). Regulation of VEGF signaling bymem-
brane traffic. Cell. Signal. 24, 1810–1820.
Hu, B., Guo, P., Bar-Joseph, I., Imanishi, Y., Jarzynka, M.J., Bogler, O.,
Mikkelsen, T., Hirose, T., Nishikawa, R., and Cheng, S.Y. (2007). Neuropilin-
1 promotes human glioma progression through potentiating the activity of
the HGF/SF autocrine pathway. Oncogene 26, 5577–5586.
Im, E., and Kazlauskas, A. (2006). Regulating angiogenesis at the level of
PtdIns-4,5-P2. EMBO J. 25, 2075–2082.
Jubb, A.M., Strickland, L.A., Liu, S.D., Mak, J., Schmidt, M., and Koeppen, H.
(2012). Neuropilin-1 expression in cancer and development. J. Pathol. 226,
50–60.
Kawamura, H., Li, X., Goishi, K., van Meeteren, L.A., Jakobsson, L., Cebe-
Suarez, S., Shimizu, A., Edholm, D., Ballmer-Hofer, K., Kjellen, L., et al.
646 Developmental Cell 28, 633–646, March 31, 2014 ª2014 Elsevier
(2008). Neuropilin-1 in regulation of VEGF-induced activation of p38MAPK
and endothelial cell organization. Blood 112, 3638–3649.
Koch, S., Tugues, S., Li, X., Gualandi, L., andClaesson-Welsh, L. (2011). Signal
transduction by vascular endothelial growth factor receptors. Biochem. J. 437,
169–183.
Lanahan, A.A., Hermans, K., Claes, F., Kerley-Hamilton, J.S., Zhuang, Z.W.,
Giordano, F.J., Carmeliet, P., and Simons, M. (2010). VEGF receptor 2 endo-
cytic trafficking regulates arterial morphogenesis. Dev. Cell 18, 713–724.
Lloyd, A.C. (2006). Distinct functions for ERKs? J. Biol. 5, 13.
Miao, H.Q., Lee, P., Lin, H., Soker, S., and Klagsbrun, M. (2000). Neuropilin-1
expression by tumor cells promotes tumor angiogenesis and progression.
FASEB J. 14, 2532–2539.
Muratori, C., and Tamagnone, L. (2012). Semaphorin signals tweaking the
tumor microenvironment. Adv. Cancer Res. 114, 59–85.
Naccache, S.N., Hasson, T., and Horowitz, A. (2006). Binding of internalized
receptors to the PDZ domain of GIPC/synectin recruits myosin VI to endocytic
vesicles. Proc. Natl. Acad. Sci. USA 103, 12735–12740.
Pan, Q., Chanthery, Y., Liang, W.C., Stawicki, S., Mak, J., Rathore, N., Tong,
R.K., Kowalski, J., Yee, S.F., Pacheco, G., et al. (2007). Blocking neuropilin-
1 function has an additive effect with anti-VEGF to inhibit tumor growth.
Cancer Cell 11, 53–67.
Phng, L.K., and Gerhardt, H. (2009). Angiogenesis: a team effort coordinated
by notch. Dev. Cell 16, 196–208.
Prahst, C., Heroult, M., Lanahan, A.A., Uziel, N., Kessler, O., Shraga-Heled, N.,
Simons, M., Neufeld, G., and Augustin, H.G. (2008). Neuropilin-1-VEGFR-2
complexing requires the PDZ-binding domain of neuropilin-1. J. Biol. Chem.
283, 25110–25114.
Salikhova, A., Wang, L., Lanahan, A.A., Liu, M., Simons, M., Leenders, W.P.,
Mukhopadhyay, D., and Horowitz, A. (2008). Vascular endothelial growth fac-
tor and semaphorin induce neuropilin-1 endocytosis via separate pathways.
Circ. Res. 103, e71–e79.
Shin, S., Dimitri, C.A., Yoon, S.O., Dowdle, W., and Blenis, J. (2010). ERK2 but
not ERK1 induces epithelial-to-mesenchymal transformation via DEF motif-
dependent signaling events. Mol. Cell 38, 114–127.
Soker, S., Takashima, S., Miao, H.Q., Neufeld, G., and Klagsbrun, M. (1998).
Neuropilin-1 is expressed by endothelial and tumor cells as an isoform-spe-
cific receptor for vascular endothelial growth factor. Cell 92, 735–745.
Soker, S., Miao, H.Q., Nomi, M., Takashima, S., and Klagsbrun, M. (2002).
VEGF165 mediates formation of complexes containing VEGFR-2 and
neuropilin-1 that enhance VEGF165-receptor binding. J. Cell. Biochem. 85,
357–368.
Sorkin, A., and von Zastrow, M. (2009). Endocytosis and signalling: intertwin-
ing molecular networks. Nat. Rev. Mol. Cell Biol. 10, 609–622.
Takagi, S., Kasuya, Y., Shimizu, M., Matsuura, T., Tsuboi, M., Kawakami, A.,
and Fujisawa, H. (1995). Expression of a cell adhesion molecule, neuropilin,
in the developing chick nervous system. Dev. Biol. 170, 207–222.
Wang, L., Zeng, H., Wang, P., Soker, S., and Mukhopadhyay, D. (2003).
Neuropilin-1-mediated vascular permeability factor/vascular endothelial
growth factor-dependent endothelial cell migration. J. Biol. Chem. 278,
48848–48860.
Westenskow, P.D., Kurihara, T., Aguilar, E., Scheppke, E.L., Moreno, S.K.,
Wittgrove, C., Marchetti, V., Michael, I.P., Anand, S., Nagy, A., et al. (2013).
Ras pathway inhibition prevents neovascularization by repressing endothelial
cell sprouting. J. Clin. Invest. 123, 4900–4908.
Zachary, I. (2014). Neuropilins: role in signalling, angiogenesis and disease.
Chem. Immunol. Allergy 99, 37–70.
Inc.