Embed Size (px)
Citation preview

VIRGINIA CENTER FOR TRANSPORTATION INNOVATION AND RESEARCH
530 Edgemont Road, Charlottesville, VA 22903-2454
www. VTRC.net
Development of Safety Performance Functions for Multilane Highway and Freeway Segments Maintained by the Virginia Department of Transportation http://www.virginiadot.org/vtrc/main/online_reports/pdf/14-r14.pdf
YOUNG-JUN KWEON, Ph.D., P.E. Research Scientist Virginia Center for Transportation Innovation and Research IN-KYU LIM, Ph.D., P.E. Senior Highway Safety Engineer Traffic Engineering Division Virginia Department of Transportation
Final Report VCTIR 14-R14

Standard Title Page - Report on Federally Funded Project
1. Report No.: 2. Government Accession No.: 3. Recipient’s Catalog No.:
FHWA/VCTIR 14-R14
4. Title and Subtitle: 5. Report Date:
Development of Safety Performance Functions for Multilane Highway and Freeway
Segments Maintained by the Virginia Department of Transportation
May 2014
6. Performing Organization Code:
7. Author(s):
Young-Jun Kweon, Ph.D., P.E., and In-Kyu Lim, Ph.D., P.E.
8. Performing Organization Report No.:
VCTIR 14-R14
9. Performing Organization and Address:
Virginia Center for Transportation Innovation and Research
530 Edgemont Road
Charlottesville, VA 22903
10. Work Unit No. (TRAIS):
11. Contract or Grant No.:
99048
12. Sponsoring Agencies’ Name and Address: 13. Type of Report and Period Covered:
Virginia Department of Transportation
1401 E. Broad Street
Richmond, VA 23219
Federal Highway Administration
400 North 8th Street, Room 750
Richmond, VA 23219-4825
Final
14. Sponsoring Agency Code:
15. Supplementary Notes:
16. Abstract:
The Virginia Department of Transportation (VDOT) adopted the software Safety Analyst™ as its highway safety
management tool in 2009. One of the requirements for implementation of Safety Analyst is to have appropriate safety
performance functions (SPFs) reflecting Virginia conditions. The purpose of this study was to develop such SPFs for multilane
highway and freeway segments that could replace Safety Analyst’s default SPFs. Five years (2004-2008) of data collected from
20,235 multilane highway segments and 2,905 directional freeway segments in Virginia were used in the development of the
SPFs. Statewide SPFs were developed for 4 subtypes of multilane highway segments and 10 subtypes of freeway segments.
VDOT district-group SPFs were developed for 4 subtypes of multilane highway segments.
The default SPFs in Safety Analyst were found to be different than the developed Virginia SPFs with respect to their
curve shapes, and, as a result, adjusting the default SPFs to Virginia conditions by calibration factors resulted in inaccurate crash
predictions at low and high volumes of annual average daily traffic. Thus, the Virginia-specific statewide SPFs developed in this
study should be used when implementing Safety Analyst in Virginia.
Although the shapes of the multilane highway segment SPFs were found to vary across VDOT districts, incorporating
variations through the creation of new subtypes was found to be inappropriate for the current version of Safety Analyst. As a
consequence, district-group SPFs for the multilane highway segments cannot be implemented in Safety Analyst. However, all
SPFs developed in this study, including district-group SPFs, can be implemented without the use of Safety Analyst. Therefore,
use of the statewide SPFs developed in this study is recommended when Safety Analyst can be used and use of the statewide or
district-group SPFs developed in this study is recommended when implementation of Safety Analyst is not feasible.
17 Key Words: 18. Distribution Statement:
Safety performance function, Safety Analyst, freeway, multilane
highway
No restrictions. This document is available to the public
through NTIS, Springfield, VA 22161.
19. Security Classif. (of this report): 20. Security Classif. (of this page): 21. No. of Pages: 22. Price:
Unclassified Unclassified 40
Form DOT F 1700.7 (8-72) Reproduction of completed page authorized

FINAL REPORT
DEVELOPMENT OF SAFETY PERFORMANCE FUNCTIONS FOR MULTILANE
HIGHWAY AND FREEWAY SEGMENTS MAINTAINED BY THE VIRGINIA
DEPARTMENT OF TRANSPORTATION
Young-Jun Kweon, Ph.D., P.E.
Research Scientist
Virginia Center for Transportation Innovation and Research
In-Kyu Lim, Ph.D., P.E.
Senior Highway Safety Engineer
Traffic Engineering Division
Virginia Department of Transportation
In Cooperation with the U.S. Department of Transportation
Federal Highway Administration
Virginia Center for Transportation Innovation and Research
(A partnership of the Virginia Department of Transportation
and the University of Virginia since 1948)
Charlottesville, Virginia
May 2014
VCTIR 14-R14

ii
DISCLAIMER
The contents of this report reflect the views of the authors, who are responsible for the
facts and the accuracy of the data presented herein. The contents do not necessarily reflect the
official views or policies of the Virginia Department of Transportation, the Commonwealth
Transportation Board, or the Federal Highway Administration. This report does not constitute a
standard, specification, or regulation. Any inclusion of manufacturer names, trade names, or
trademarks is for identification purposes only and is not to be considered an endorsement.
Copyright 2014 by the Commonwealth of Virginia.
All rights reserved.

iii
ABSTRACT
The Virginia Department of Transportation (VDOT) adopted the software Safety
Analyst™ as its highway safety management tool in 2009. One of the requirements for
implementation of Safety Analyst is to have appropriate safety performance functions (SPFs)
reflecting Virginia conditions. The purpose of this study was to develop such SPFs for multilane
highway and freeway segments that could replace Safety Analyst’s default SPFs. Five years
(2004-2008) of data collected from 20,235 multilane highway segments and 2,905 directional
freeway segments in Virginia were used in the development of the SPFs. Statewide SPFs were
developed for 4 subtypes of multilane highway segments and 10 subtypes of freeway segments.
VDOT district-group SPFs were developed for 4 subtypes of multilane highway segments.
The default SPFs in Safety Analyst were found to be different than the developed
Virginia SPFs with respect to their curve shapes, and, as a result, adjusting the default SPFs to
Virginia conditions by calibration factors resulted in inaccurate crash predictions at low and high
volumes of annual average daily traffic. Thus, the Virginia-specific statewide SPFs developed in
this study should be used when implementing Safety Analyst in Virginia.
Although the shapes of the multilane highway segment SPFs were found to vary across
VDOT districts, incorporating variations through the creation of new subtypes was found to be
inappropriate for the current version of Safety Analyst. As a consequence, district-group SPFs
for the multilane highway segments cannot be implemented in Safety Analyst. However, all
SPFs developed in this study, including district-group SPFs, can be implemented without the use
of Safety Analyst. Therefore, use of the statewide SPFs developed in this study is recommended
when Safety Analyst can be used and use of the statewide or district-group SPFs developed in
this study is recommended when implementation of Safety Analyst is not feasible.
1
FINAL REPORT
DEVELOPMENT OF SAFETY PERFORMANCE FUNCTIONS FOR MULTILANE
HIGHWAY AND FREEWAY SEGMENTS MAINTAINED BY THE VIRGINIA
DEPARTMENT OF TRANSPORTATION
Young-Jun Kweon, Ph.D., P.E.
Research Scientist
Virginia Center for Transportation Innovation and Research
In-Kyu Lim, Ph.D., P.E.
Senior Highway Safety Engineer
Traffic Engineering Division
Virginia Department of Transportation
INTRODUCTION
In 2009, the Virginia Department of Transportation (VDOT) adopted the software Safety
Analyst™ as the state’s highway safety management tool. Safety Analyst was developed by the
Federal Highway Administration (FHWA) with participation from selected state and local
agencies and is distributed by the American Association of State Highway and Transportation
Officials (AASHTO) (FHWA, 2009a). Safety Analyst has the capability to identify sites at a
high risk for crashes, prioritize the identified sites based on different criteria, recommend proper
crash countermeasures, and perform economic appraisals (FHWA, 2009b).
One of the core requirements for Safety Analyst is appropriate safety performance
functions (SPFs) (FHWA, 2009c). An SPF is a function of annual average daily traffic (AADT)
and length for segments and two AADTs of crossing streets for intersections, and it is used to
predict the number of crashes at a site under given conditions (e.g., AADT and segment length)
so that the safety performance of the site can be assessed. Safety Analyst is equipped with
default SPFs developed with the use of data from several states participating in the Highway
Safety Information System. Since Virginia does not participate in this system, no Virginia data
were used in the development of Safety Analyst’s default SPFs (hereinafter “default SPFs”). For
multilane highways, the default SPFs were developed with the use of data from four states:
Minnesota, North Carolina, Ohio, and Washington. For freeways, the default SPFs were
developed with the use of data from three states: Minnesota, California, and Washington.
In order to use the default SPFs in Virginia, one would need to assume that driving
environments and behaviors related to traffic safety in Virginia were similar to those in the states
whose data were used to develop the default SPFs. If it is the case that they are not similar, use
of the default SPFs would entail the risk that the resulting safety evaluation would lead to
inappropriate identification and prioritization of sites for safety improvements in Virginia. To
ensure that Virginia conditions are properly reflected, SPFs for Safety Analyst need to be
customized using local data.

2
There are two ways of customizing SPFs, both using local data: (1) calibrating the default
SPFs and (2) developing a new set of SPFs. When Safety Analyst is installed and connected to a
local database, it automatically calibrates the default SPFs (FHWA, 2009c). However, this
calibration does not change the fundamental shapes of the curves of the default SPFs but instead
shrinks or enlarges the curves vertically to fit to the local conditions while keeping the shapes of
the SPF curves. Research (e.g., Garber et al. [2010]; Garber and Rivera [2010]) has shown that
the shapes of SPF curves could vary significantly from state to state.
The second way of customizing SPFs using local data would require additional effort
since an entirely new set of SPFs would need to be developed (FHWA, 2009c). However, this
method guarantees that the developed SPFs would reflect driving environments and behaviors
associated with traffic safety in Virginia. A Virginia study on intersections (Garber and Rivera,
2010) found that SPFs developed using Virginia data are significantly different from those of
other states. Thus, it is anticipated that SPFs developed using Virginia data for freeways and
multilane highways would be different from the default SPFs of Safety Analyst.
There are three predefined facility types in Safety Analyst: intersection, segment, and
ramp (FHWA, 2009c). Varying numbers of subtypes are defined for each facility type, and one
SPF is desirable for each subtype in each facility type. Under the segment facility type, there are
17 subtypes defined in Safety Analyst as follows (FHWA, 2009c):
1. rural two-lane highway segments
2. rural multilane undivided highway segments
3. rural multilane divided highway segments
4. rural freeway segments―4 lanes
5. rural freeway segments―6+ lanes
6. rural freeway segments within an interchange area―4 lanes
7. rural freeway segments within an interchange area―6+ lanes
8. urban two-lane arterial segments
9. urban multilane undivided arterial segments
10. urban multilane divided arterial segments
11. urban one-way arterial segments
12. urban freeway segments―4 lanes
13. urban freeway segments―6 lanes
14. urban freeway segments―8+ lanes
15. urban freeway segments within an interchange area―4 lanes
16. urban freeway segments within an interchange area―6 lanes
17. urban freeway segments within an interchange area―8+ lanes.
Of the 17 subtypes, Virginia-specific SPFs have already been developed (Garber et al.,
2010) for 2 subtypes: rural two-lane highway segments, and urban two-lane arterial segments.
Since a third subtype, urban one-way arterial segments, is mostly found in roadway networks
within cities and VDOT does not have AADT and roadway inventory data for these segments,
development of SPFs for this subtype is not being considered at present. This study focused on
the remaining 14 subtypes of multilane highways and freeways.
3
PURPOSE AND SCOPE
The purpose of this study was to develop SPFs for 14 freeway and multilane highway
segments in Virginia that can replace the default SPFs in Safety Analyst.
Specifically, the scope of the study was limited to the following 14 subtypes of segment
facility type:
For multilane highways:
• rural multilane undivided highway segments
• rural multilane divided highway segments
• urban multilane undivided arterial segments
• urban multilane divided arterial segments.
For freeway highways:
• rural freeway segments―4 lanes
• rural freeway segments―6+ lanes
• rural freeway segments within an interchange area―4 lanes
• rural freeway segments within an interchange area―6+ lanes
• urban freeway segments―4 lanes
• urban freeway segments―6 lanes
• urban freeway segments―8+ lanes
• urban freeway segments within an interchange area―4 lanes
• urban freeway segments within an interchange area―6 lanes
• urban freeway segments within an interchange area―8+ lanes.
Arterials are called “highways” hereinafter in this study.
METHODS
Data Preparation
Overview
The researchers obtained data from VDOT’s Oracle-based roadway management system,
i.e., Roadway Network System (RNS), which recently replaced the Highway Traffic Records
Information System. RNS currently serves as the official repository of VDOT’s business data
for internal management and reporting. RNS facilitates a relational database that provides
universal enterprise data access and links geospatial data and business attributes to the roadway
centerlines.

4
Records from three RNS subsystems, i.e., Roadway Inventory (RDI), Accident (ACC),
and Traffic Monitoring System (TMS), were used to produce data for this study. RDI contains
information on about 62,000 centerline miles of public roadways in Virginia including cross-
section characteristics, functional classification, administrative information, and ownership.
ACC contains historical crash records including more than 70 elements of crash-, occupant-, and
vehicle-related characteristics extracted from police crash reports (i.e., the FR300 form). TMS
contains historical traffic count data (e.g., AADT) and the locations of the traffic counters. To
extract the study data, the researchers identified eligible segments of multilane highways and
freeways by screening the RDI records for data for 5 years (2004–2008) and then merging the
TMS and ACC records for those years to the identified segments.
Identification of Segment Crash and Facility Type
Identify Segment Crashes
An intersection crash is defined as a crash inside 250 feet from the center of an
intersection in Virginia. Thus, all crashes excluding intersection crashes were identified as
segment crashes.
Identify Multilane Highways
A multilane highway in Safety Analyst refers to a road with four or more through lanes
excluding one-way roads, bridges, tunnels, causeways, transitions, and the primary forms of
access and egress. A multilane highway segment is classified into the four subtypes (rural/urban/
undivided/divided) according to the level of mobility, land access, and physical location. A
specific procedure in RNS for identifying and classifying multilane highway segments is
presented later.
Identify Freeways and Interchange Areas
A freeway is generally defined as a controlled-access highway designed exclusively for
high-speed vehicle traffic that is free of at-grade crossings with other roads, railways, or
pedestrian paths. In Virginia, freeway generally refers to an interstate highway. For
implementing Safety Analyst, a freeway segment should be classified as either a segment within
an interchange area or a segment outside an interchange area; an interchange area is defined as
the area between gores of entrance/exit ramps. To classify each segment, a set of special
Structured Query Language (SQL) codes was developed. An interchange area identified by the
SQL codes may not be exactly matched with the definition of an interchange area since the area
identification was performed based on highway links established in RDI. A specific procedure
in RNS for identifying and classifying freeway segments is presented later.
Data Analysis
A regression analysis was used to develop SPFs with the functional form required for
Safety Analyst. The required form of SPFs and the regression model used in this study are
described here.

5
Functional Form of SPFs
The following functional form of a segment SPF was used in this study because it is
required for Safety Analyst (Exelis Inc., 2013):
������ℎ��� ���,�� = ���� + �� × ln���� �,�� + ln(" #$ℎ�,�)� [Eq. 1]
= & × ��� �,�'( × " #$ℎ�,�
where
i = segment index
t = year index
�(∙) = expectation
����ℎ��� ���,� = total number of crashes on segment i in year t
��� �,� = annual average daily traffic volume on segment i in year t
" #$ℎ�,� = length of segment i in year t
� and ��= coefficient parameters to be estimated.
When the AADT and length of a segment are given, a predicted annual crash frequency
per mile per year of that segment can be computed by entering the given AADT and segment
length into Equation 1 with estimated parameters. Since the data on crash frequency, AADT,
and length for freeway segments are directional, the AADT and length entered into the equation
should be for one direction; thus, the resulting predicted crash frequency will be for one direction.
Otherwise, all the entering input values for multilane highway segments are for two directions.
Thus, the resulting predicted frequency is for two directions. The coefficient parameters are
estimated by a regression analysis described next.
Regression Analysis for SPFs
An SPF with the functional form specified in Equation 1 can be estimated with the use of
a few regression model types such as a classical linear model with a log-transformed dependent
variable and the Poisson model. Among them, a negative binomial model was selected for this
study in accordance with a recommendation in Safety Analyst User's Manual (Exelis Inc., 2013).
The negative binomial regression model is the most often used model in performing a regression
analysis on traffic crash data of individual sites because the dependent variable (e.g., annual
crash frequency at a site) is a non-negative integer and a conditional variance of the dependent
variable is often larger than a conditional mean, known as overdispersion. The specification of
the negative binomial regression model used in this study is written as follows:
*������ℎ��� ���,�+��� �,�, " #$ℎ�,�� = ,-./01�2345673,89,:;<=,>�×9=,>?×/1�2345673,89,:;<=,>�×9=,>?
@ABCDEAFGHFIJK=,>
�2345673,89,:;<=,>�! [Eq. 2]
and ��,�~N�OO�(1 Q⁄ , 1 Q⁄ )
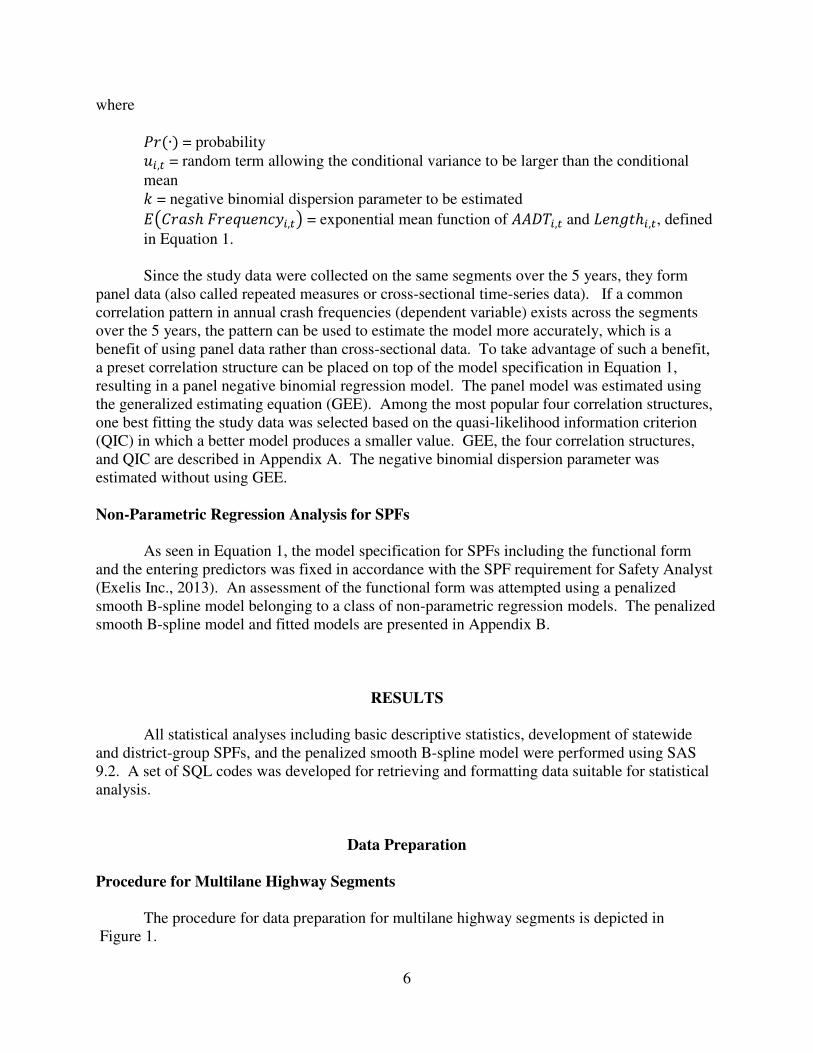
6
where
*�(∙) = probability
��,� = random term allowing the conditional variance to be larger than the conditional
mean
Q = negative binomial dispersion parameter to be estimated
������ℎ��� ���,�� = exponential mean function of ��� �,�and " #$ℎ�,�, defined
in Equation 1.
Since the study data were collected on the same segments over the 5 years, they form
panel data (also called repeated measures or cross-sectional time-series data). If a common
correlation pattern in annual crash frequencies (dependent variable) exists across the segments
over the 5 years, the pattern can be used to estimate the model more accurately, which is a
benefit of using panel data rather than cross-sectional data. To take advantage of such a benefit,
a preset correlation structure can be placed on top of the model specification in Equation 1,
resulting in a panel negative binomial regression model. The panel model was estimated using
the generalized estimating equation (GEE). Among the most popular four correlation structures,
one best fitting the study data was selected based on the quasi-likelihood information criterion
(QIC) in which a better model produces a smaller value. GEE, the four correlation structures,
and QIC are described in Appendix A. The negative binomial dispersion parameter was
estimated without using GEE.
Non-Parametric Regression Analysis for SPFs
As seen in Equation 1, the model specification for SPFs including the functional form
and the entering predictors was fixed in accordance with the SPF requirement for Safety Analyst
(Exelis Inc., 2013). An assessment of the functional form was attempted using a penalized
smooth B-spline model belonging to a class of non-parametric regression models. The penalized
smooth B-spline model and fitted models are presented in Appendix B.
RESULTS
All statistical analyses including basic descriptive statistics, development of statewide
and district-group SPFs, and the penalized smooth B-spline model were performed using SAS
9.2. A set of SQL codes was developed for retrieving and formatting data suitable for statistical
analysis.
Data Preparation
Procedure for Multilane Highway Segments
The procedure for data preparation for multilane highway segments is depicted in
Figure 1.

7
Figure 1. Procedure for Data Preparation for Multilane Highway Segments. RNS = Roadway Network System;
RDI = Roadway Inventory; TMS = Traffic Management System; ACC = Accident.

8
The steps in the procedure are as follows.
1. Access records of road segments in RDI.
2. Select segments with four or more through lanes. This extracts multilane segments
on all public roads.
3. Select segments on primary or secondary roads and not connected to ramps. This
excludes segments on interstate highways and segments with the primary forms of
access or egress points.
4. Select two-way segments being divided or undivided. This excludes segments of one-
way roads, bridges, tunnels, causeways, or transitions.
5. Extract 2004-2008 AADT records from TMS and merge the extracted AADTs to the
multilane segments selected in Step 4.
6. Eliminate segments with missing or invalid records of AADTs.
7. Extract 2004-2008 crash records from ACC and merge the extracted records to the
remaining segments selected in Step 6. In extracting crash records, crashes inside 250
feet from the center of intersections, defined as intersection crashes in Virginia, are
excluded.
8. Classify the segments into four subtypes using information in AREA (urban and rural)
and FACILITYTYPE (divided and undivided).
9. Five-year data for multilane highway segments are formed.
Procedure for Freeway Segments
The data preparation procedure for freeway segments is depicted in Figure 2.
The steps in the procedure are as follows:
1. Access records of road segments in RDI.
2. Select segments on interstate highways. In general, freeways refer to interstate
highways in Virginia.
3. Classify the segments into two types: within and outside interchange areas. A special
SQL code was developed for this classification.
4. Extract 2004-2008 AADT records from TMS and merge the extracted AADTs to the
freeway segments selected in Step 3.
5. Eliminate segments with missing or invalid records of AADTs.

9
6. Extract 2004-2008 crash records from ACC and merge the extracted records to the
remaining segments selected in Step 5.
7. Classify the segments into 10 subtypes using AREA (Urban and Rural),
FACILITYTYPE (Divided and Undivided), NUMBEROFLANES (Number of through
lanes), and the classification made in Step 3.
8. Five-year data for freeway segments are formed.
Figure 2. Procedure for Data Preparation for Freeway Segments. RNS = Roadway Network System; RDI =
Roadway Inventory; TMS = Traffic Management System; ACC = Accident.

10
Data Summary
The study data were formed through the procedures depicted in Figures 1 and 2 and were
further prepared for statistical analysis using SAS 9.2. Table 1 shows summary statistics of the
final data by subtype in the order of the subtype code to be in line with the default SPF tables in
Safety Analyst User’s Manual (Exelis Inc., 2013). The 5-year (2004-2008) data were used to
calculate the statistics, whereas 1-year (2008) data were used to calculate the number and total
mileage of segments because the same segments were found five times in the 5-year data.
Table 1. Basic Descriptive Statistics of the Study Data (2004-2008)
Site
Subtype Code
Site Subtype Description
No. of Sites
(Total Mileage)
a
No. of Records
Variableb
Mean
Std. Dev.
Min.
Max.
102 Rural multilane undivided highway segments
850 (168 mi)
4,249 AADT 11,002 6,215 8 39,520
LENGTH 0.20 0.31 0.01 3.83
TOTCRH 0.39 1.04 0 17
FIJCRH 0.15 0.52 0 8
103 Rural multilane divided highway segments
4,689 (1,531 mi)
23,443 AADT 12,725 7,380 81 55,026
LENGTH 0.33 0.43 0.01 8.59
TOTCRH 0.75 1.56 0 27
FIJCRH 0.30 0.76 0 14
104 Rural freeway segments―4 lanes
639 (1,088 mi)
3,195 AADT 17,052 5,956 3,745 36,638
LENGTH 1.70 1.58 0.01 8.54
TOTCRH 4.57 5.28 0 43
FIJCRH 1.60 2.12 0 22
105 Rural freeway segments―6+ lanes
44 (89 mi)
220 AADT 36,548 11,132 16,807 58,820
LENGTH 2.03 1.81 0.02 7.17
TOTCRH 10.32 12.75 0 83
FIJCRH 3.41 4.46 0 34
106 Rural freeway segments within an interchange area―4 lanes
369 (113 mi)
1,845 AADT 17,570 6,039 3,258 36,638
LENGTH 0.31 0.16 0.01 1.31
TOTCRH 1.29 1.62 0 15
FIJCRH 0.42 0.74 0 6
107 Rural freeway segments within an interchange area―6+ lanes
22 (6 mi)
110 AADT 39,187 9,878 21,720 58,820
LENGTH 0.27 0.10 0.05 0.43
TOTCRH 2.58 2.87 0 18
FIJCRH 0.82 1.12 0 5
152 Urban multilane undivided arterial segments
4,280 (508 mi)
21,401 AADT 16,007 10,799 19 71,444
LENGTH 0.12 0.13 0.01 2.41
TOTCRH 0.37 1.29 0 30
FIJCRH 0.14 0.57 0 14
153 Urban multilane divided arterial segments
10,416 (1,448 mi)
52,082 AADT 26,309 16,571 23 113,552
LENGTH 0.14 0.19 0.01 4.4
TOTCRH 0.69 2.10 0 50
FIJCRH 0.24 0.83 0 16
155 Urban freeway segments―4 lanes
362 (254 mi)
1,810 AADT 29,546 12,691 4,902 74,102
LENGTH 0.70 0.76 0.01 5.56
TOTCRH 5.62 9.18 0 124
FIJCRH 1.72 2.76 0 37
156 Urban freeway segments―6 lanes
403 (223 mi)
2,015 AADT 46,739 21,865 9,184 97,868
LENGTH 0.58 0.68 0.01 4.17
TOTCRH 7.54 11.55 0 88
FIJCRH 2.42 3.91 0 33

11
157 Urban freeway segments―8+ lanes
207 (104 mi)
1,035 AADT 65,874 16,629 23,937 100,735
LENGTH 0.50 0.49 0.01 2.1
TOTCRH 8.77 9.88 0 75
FIJCRH 3.06 3.65 0 31
158 Urban freeway segments within an interchange area―4 lanes
326 (73 mi)
1,630 AADT 29,803 14,976 5,163 88,893
LENGTH 0.22 0.19 0.01 1.28
TOTCRH 2.69 4.46 0 45
FIJCRH 0.82 1.50 0 17
159 Urban freeway segments within an interchange area―6 lanes
369 (90 mi)
1,845 AADT 49,973 20,971 10,118 97,868
LENGTH 0.24 0.26 0.01 2.21
TOTCRH 6.01 9.84 0 116
FIJCRH 1.90 3.60 0 46
160 Urban freeway segments within an interchange area―8+ lanes
164 (37 mi)
820 AADT 67,745 16,312 23,937 102,973
LENGTH 0.22 0.25 0.01 2.05
TOTCRH 6.38 6.35 0 38
FIJCRH 2.25 2.50 0 15
All values of multilane highways are for two directions (except LENGTH being a centerline length), and those of
freeways are for one direction. Std. Dev. = standard deviation; Min. = minimum; Max. = maximum. a All segments were found in each of 5 years and counted only once to calculate the number of segments and total
mileage. For freeways, the number of directional segments and total directional mileage are reported. b AADT = annual average daily traffic (vehicles per day); TOTCRH = annual number of total crashes per year per
segment; FIJCRH = annual number of fatal and injury crashes per year per segment.
It should be emphasized that data for multilane highway segments are for two directions
and those for freeway segments are for one direction. Thus, for example, the total mileage for
multilane highways is in centerline miles and that for freeways is in directional miles. As
another example, TOTCRH (total crash frequency per year per segment) and AADT of freeways
are for one direction and those of multilane highways are for both directions combined. The
study data included 20,235 multilane highway segments totaling 3,655 centerline miles and
2,905 directional freeway segments (1,655 and 1,250 outside and within an interchange area,
respectively) totaling 2,087 directional miles (1,768 and 319 miles outside and within an
interchange area, respectively).
SPF Development
Statewide SPFs
Statewide SPFs were developed using the panel negative binomial regression models
described previously. GEE was employed to estimate the panel models, and the best correlation
structure was selected based on the QIC value for each subtype. The final statewide SPFs for
multilane highway and freeway segments are presented in Table 2 (for total crashes) and Table 3
(for fatal and injury crashes). Corresponding default SPFs of Safety Analyst (FHWA, 2010) are
also presented for comparison. The SPFs shown for Virginia can replace the default SPFs shown
for the other states.
Most of the coefficient parameters (i.e., α, β1, and d) of the Virginia-specific SPFs are
statistically significant at the 0.05 significance level (i.e., 95% confidence level). The parameter
α in total crash SPFs of (1) rural freeway segments within an interchange area―6+ lanes and (2)
urban freeway segments―8+ lanes is not statistically significant at the 0.05 level. The

12
parameters α and β1 in the fatal and injury crash SPF of rural freeway segments within an
interchange area―6+ lanes are not statistically significant at the 0.1 level.
The parameter α is not of much concern since it acts as a calibration factor adjusting the
SPF predictions toward observed crash frequencies under average existing conditions. It is
somewhat similar to an intercept term in a classical linear regression and usually remains in the
model although not being statistically significant unless there is a strong reason for exclusion.
The parameter β1, however, determines the SPF shape, and thus its statistical significance is of
importance. The parameter being statistically non-significant means that AADT is not
associated with the crash frequency. This means that the prediction curve corresponding to
AADTs is flat at an average of observed crash frequencies.
The parameter β1 in the fatal and injury crash SPF of rural freeway segments within an
interchange area―6+ lanes is statistically not significant at the significance level recommended
for segments (i.e., 0.1) when agency-specific SPFs are developed (AASHTO, 2013a); it is
statistically significant at the 0.2 level that is recommended for the minor road AADT term of
intersection SPFs. This is presumably because of a small sample size (i.e., 22 directional
segments totaling 6 directional miles). This means that the p-value of the parameter estimate
(i.e., 0.18) would likely become smaller, thus statistically more significant, if more such
segments were included in the study data.
With the current sample size, a choice should be made between a flat prediction curve
meaning the removal of AADT from the model and a positive-slope prediction curve meaning
the inclusion of AADT in the model although the p-value of β1 does not meet the recommended
cutoff p-value of 0.1. The latter was selected for this study because the current p-value of β1 (i.e.,
0.18) is (1) still below the level recommended for the minor road AADT of intersection SPFs
and (2) unlikely attributable to the absence of the crash frequency–AADT relationship but likely
attributable to the small sample size, which is supported by all other SPFs showing a statistically
significant β1 at the 0.05 level. Thus, the model having both constant and AADT terms was
determined to be final for the fatal and injury crash SPF of rural freeway segments.
In general, Virginia models have lower Freeman-Tukey R2 (RFT
2) values than the default
models for the same subtype. This indicates that AADT plays a greater role in predicting crash
frequencies of multilane and freeway segments in the other states whose data were used to
develop the default SPFs than in Virginia. In other words, predicting crash frequencies using
AADT is more difficult in Virginia than in the other states. This implies that factors other than
AADT may be more influential on crash occurrence in Virginia than in those states. It should be
noted that the higher RFT2 values of the default models compared to Virginia models do not mean
that the default models would perform better in Virginia but do mean that AADT is more closely
associated with crash frequency in those states than in Virginia.
Among the Virginia models, the RFT2 values varied considerably across subtypes within
each functional class (i.e., freeway and multilane highway), and this also should be interpreted as
similar to the previous case. For the example of freeway SPFs, a change in AADT reflects quite
well a change in the observed total crash frequency for rural segments with 6+ lanes (RFT2
= 70.5)
but does not do so for urban segments with 6 lanes (RFT2
= 5 1.9) or 8+ lanes (RFT2
= 25.9).
13
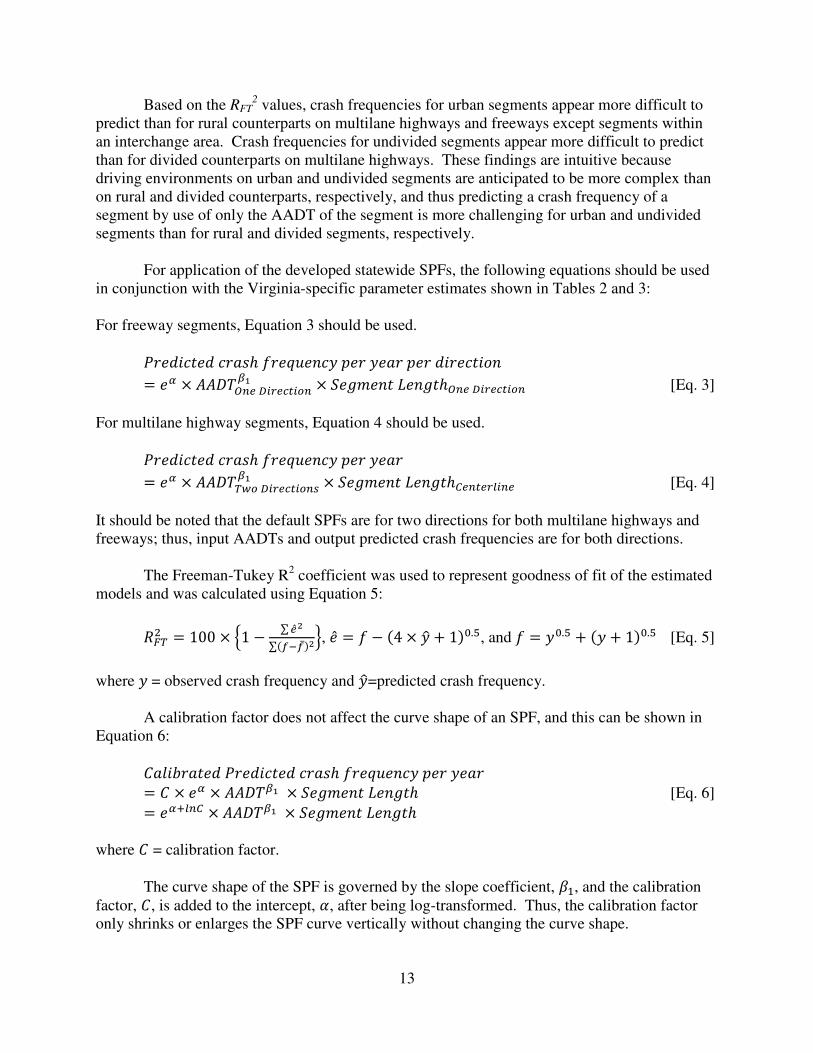
Based on the RFT2 values, crash frequencies for urban segments appear more difficult to
predict than for rural counterparts on multilane highways and freeways except segments within
an interchange area. Crash frequencies for undivided segments appear more difficult to predict
than for divided counterparts on multilane highways. These findings are intuitive because
driving environments on urban and undivided segments are anticipated to be more complex than
on rural and divided counterparts, respectively, and thus predicting a crash frequency of a
segment by use of only the AADT of the segment is more challenging for urban and undivided
segments than for rural and divided segments, respectively.
For application of the developed statewide SPFs, the following equations should be used
in conjunction with the Virginia-specific parameter estimates shown in Tables 2 and 3:
For freeway segments, Equation 3 should be used.
*�ST�$S����ℎU��� ���������ST��$TV
= & × ��� W:,X�3,;��Y:'( × Z#O $" #$ℎW:,X�3,;��Y: [Eq. 3]
For multilane highway segments, Equation 4 should be used.
*�ST�$S����ℎU��� ������� = & × ��� [\YX�3,;��Y:5
'( × Z#O $" #$ℎ2,:�,3]�:, [Eq. 4]
It should be noted that the default SPFs are for two directions for both multilane highways and
freeways; thus, input AADTs and output predicted crash frequencies are for both directions.
The Freeman-Tukey R2 coefficient was used to represent goodness of fit of the estimated
models and was calculated using Equation 5:
^7[_ = 100 × a1 − ∑ ,̂e∑(f0f̅)eh, ̂ = U − (4 × �j + 1)k.m, and U = �k.m + (� + 1)k.m [Eq. 5]
where �= observed crash frequency and �j=predicted crash frequency.
A calibration factor does not affect the curve shape of an SPF, and this can be shown in
Equation 6:
��nTo��$S*�ST�$S����ℎU��� �������
= � × & × ��� '( × Z#O $" #$ℎ [Eq. 6]
= &p]:2 × ��� '( × Z#O $" #$ℎ
where � = calibration factor.
The curve shape of the SPF is governed by the slope coefficient, ��, and the calibration
factor, �, is added to the intercept, �, after being log-transformed. Thus, the calibration factor
only shrinks or enlarges the SPF curve vertically without changing the curve shape.

14
Table 2. Statewide Safety Performance Functions for Multilane Highway and Freeway Segments (Total Crashes)
Site Subtype
Code
Site Subtype Description
State
Correlation Structure
a
αααα
ββββ1111
d
RFT2 b
Total No. of Sites
Total Length of Sites
(mi)
Max. AADT
102 Rural multilane undivided highway segments VA UN -6.91 0.82 0.81 32.5 850 168 39,520
103 Rural multilane divided highway segments AR -7.47 0.88 0.46 42.4 4,689 1,531 55,026
104 Rural freeway segments―4 lanes CS -6.75 0.80 0.19 64.0 639 1088 36,638
105 Rural freeway segments―6+ lanes IN -12.65 1.36 0.27 70.5 44 89 58,820
106 Rural freeway segments within an interchange area―4 lanes UN -7.56 0.93 0.50 12.2 369 113 36,638
107 Rural freeway segments within an interchange area―6+ lanes IN -13.11* 1.45 0.39 24.4 22 6 58,820
152 Urban multilane undivided arterial segments CS -7.88 0.94 5.30 4.6 4,280 508 71,444
153 Urban multilane divided arterial segments IN -9.14 1.07 3.92 10.6 10,416 1,448 113,552
155 Urban freeway segments―4 lanes AR -18.05 1.98 0.65 37.5 362 254 74,102
156 Urban freeway segments―6 lanes CS -12.85 1.45 0.59 51.9 403 233 97,868
157 Urban freeway segments―8+ lanes CS -2.17* 0.48 0.58 25.9 207 104 100,735
158 Urban freeway segments within an interchange area―4 lanes IN -12.05 1.43 0.85 21.9 326 73 88,893
159 Urban freeway segments within an interchange area―6 lanes IN -11.87 1.40 0.64 44.9 369 90 97,868
160 Urban freeway segments within an interchange area―8+ lanes IN -13.59 1.54 0.53 10.5 164 37 102,973
102 Rural multilane undivided highway segments NC CS -3.17 0.49 0.53 46.5 NAc 308 42,638
103 Rural multilane divided highway segments MN -5.05 0.66 0.32 49.8 467 31,188
104 Rural freeway segments―4 lanes MN -6.82 0.81 0.17 88.0 379 60,621
105 Rural freeway segments―6+ lanes CA -8.28 0.94 0.09 84.3 201 190,403
106 Rural freeway segments within an interchange area―4 lanes MN -7.76 0.97 0.15 65.0 90 60,621
107 Rural freeway segments within an interchange area―6+ lanes CA -9.63 1.06 0.21 46.1 238 197,798
152 Urban multilane undivided arterial segments WA -10.24 1.29 0.85 23.5 194 57,901
153 Urban multilane divided arterial segments OH -11.85 1.34 5.91 1.4 327 77,735
155 Urban freeway segments―4 lanes WA -7.85 1.00 0.99 9.2 126 151,038
156 Urban freeway segments―6 lanes WA -5.96 0.78 0.48 53.5 35 241,255
157 Urban freeway segments―8+ lanes WA -16.24 1.67 0.45 43.1 15 223,088
158 Urban freeway segments within an interchange area―4 lanes WA -11.23 1.30 0.81 40.9 156 241,255
159 Urban freeway segments within an interchange area―6 lanes WA -11.25 1.28 0.60 56.1 83 255,154
160 Urban freeway segments within an interchange area―8+ lanes WA -26.76 2.58 0.52 51.6 31 233,323
Equations 3 (freeways) and 4 (multilane highways) should be used for Virginia SPFs. Max. = maximum; AADT = annual average daily traffic (vehicles per day).
For freeways, the AADT and predicted crash frequency for Virginia are for one direction whereas those for the other states are for two directions. a Correlation structure specified for each model: AR = autoregressive order 1; CS = compound symmetry (also known as exchangeable); IN = independent; and UN =
unstructured (see Appendix A). b Freeman-Tukey R
2.
c Not available.
* Statistically not significant at the 0.05 level.

15
Table 3. Statewide Safety Performance Functions for Multilane Highway and Freeway Segments (Fatal and Injury Crashes)
Site Subtype
Code
Site Subtype Description
State
Correlation Structure
a
αααα
ββββ1111
d
RFT2b
Total No. of Sites
Total Length of Sites
(mi)
Max. AADT
102 Rural multilane undivided highway segments VA UN -8.03 0.84 0.00 21.2 850 168 39,520
103 Rural multilane divided highway segments AR -8.05 0.84 0.50 27.5 4,689 1,531 55,026
104 Rural freeway segments―4 lanes UN -6.89 0.70 0.16 48.9 639 1,088 36,638
105 Rural freeway segments―6+ lanes IN -7.13 0.72 0.14 62.2 44 89 58,820
106 Rural freeway segments within an interchange area―4 lanes UN -8.01 0.86 0.44 3.7 369 113 36,638
107 Rural freeway segments within an interchange area―6+ lanes IN -11.87* 1.22
* 0.30 11.7 22 6 58,820
152 Urban multilane undivided arterial segments CS -10.36 1.09 4.25 4.5 4,280 508 71,444
153 Urban multilane divided arterial segments IN -10.19 1.06 3.40 9.2 10,416 1,448 113,552
155 Urban freeway segments―4 lanes IN -18.27 1.88 0.53 35.2 362 254 74,102
156 Urban freeway segments―6 lanes IN -15.64 1.60 0.47 45.6 403 233 97,868
157 Urban freeway segments―8+ lanes AR -5.94 0.71 0.50 32.2 207 104 100,735
158 Urban freeway segments within an interchange area―4 lanes UN -12.53 1.35 0.74 20.6 326 73 88,893
159 Urban freeway segments within an interchange area―6 lanes AR -12.44 1.34 0.64 38.8 369 90 97,868
160 Urban freeway segments within an interchange area―8+ lanes AR -12.74 1.37 0.46 14.1 164 37 102,973
102 Rural multilane undivided highway segments NC CS -4.20 0.50 0.53 45.9 NAc 308 42,638
103 Rural multilane divided highway segments MN -7.46 0.72 0.09 37.2 467 31,188
104 Rural freeway segments―4 lanes MN -8.82 0.89 0.16 82.2 379 60,621
105 Rural freeway segments―6+ lanes CA -10.25 1.03 0.09 82.8 201 190,403
106 Rural freeway segments within an interchange area―4 lanes MN -8.86 0.96 0.24 53.1 90 60,621
107 Rural freeway segments within an interchange area―6+ lanes CA -10.48 1.04 0.20 45.3 238 197,798
152 Urban multilane undivided arterial segments WA -12.07 1.39 0.81 25.8 194 57,901
153 Urban multilane divided arterial segments OH -14.87 1.52 5.81 2.2 327 77,735
155 Urban freeway segments―4 lanes WA -8.82 1.02 1.15 12.8 126 151,038
156 Urban freeway segments―6 lanes WA -7.60 0.85 0.54 46.4 35 241,255
157 Urban freeway segments―8+ lanes WA -19.16 1.85 0.52 39.9 15 223,088
158 Urban freeway segments within an interchange area―4 lanes WA -12.89 1.38 0.79 38.1 156 241,255
159 Urban freeway segments within an interchange area―6 lanes WA -13.62 1.42 0.55 56.0 83 255,154
160 Urban freeway segments within an interchange area―8+ lanes WA -25.63 2.42 0.53 48.9 31 233,323
Equations 3 (freeways) and 4 (multilane highways) should be used for Virginia SPFs. Max. = maximum; AADT = annual average daily traffic (vehicles per day).
For freeways, the AADT and predicted crash frequency for Virginia are for one direction whereas those for the other states are for two directions. a Correlation structure specified for each model: AR = autoregressive order 1; CS = compound symmetry (also known as exchangeable); IN = independent; and UN =
unstructured (see Appendix A). b Freeman-Tukey R
2.
c Not available.
* Statistically not significant at the 0.05 level.

16
Since the calibration factors only shrink or enlarge the default SPFs vertically without
changing the curve shapes of the SPFs, the default SPFs even after being adjusted by the
calibration factors are expected to be considerably different from Virginia SPFs in some
subtypes such as urban freeway segments outside an interchange area. For example, Figure 3
shows a case of urban freeway segments―8+ lanes. The SPF shapes of Virginia and
Washington (default) are notably different. For a fair comparison between Virginia and default
SPFs, the default SPF should be calibrated using Virginia data.
A calibration factor adjusting the default SPF to Virginia conditions was calculated.
Before the calculation, a multiplication factor was calculated to convert the two-direction default
SPF to a one-direction SPF applicable to Virginia data and it was exp(0.20) = 1.22. The default
SPF for two directions was converted for one direction by multiplying the default SPF by the
conversion factor of 1.22. Using the converted default SPF, the calibration factor was calculated
to be exp(1.932) = 2.36. The curve labeled “Virginia (Calibrated Default)” in Figure 3 represents
the calibrated converted default SPF that was created by multiplying the converted default SPF
by the calibration factor of 2.36. When compared with the Virginia SPF, the calibrated default
SPF underpredicted crash frequencies at AADTs less than about 45,000 and overpredicted at
AADTs more than about 45,000.
If the calibrated default SPF were used in selecting potential sites for safety improvement
in Virginia, high crash-risk urban freeway segments with 8+ lanes carrying more than 45,000
AADT would likely not be selected whereas low-to-medium crash-risk segments carrying less
than 45,000 AADT would likely be selected for safety improvement. This means that
customizing SPFs by calibration factors will not be satisfactory from the standpoint of predicting
crash frequencies in Virginia for some subtypes. Since predicting crash frequencies is the most
important use of the SPFs in Safety Analyst for Virginia, use of the set of SPFs developed in this
study based on Virginia data would be better for implementing Safety Analyst in Virginia than
adjustment of the default SPFs through calibration factors.
Figure 3. Developed Versus Calibrated Safety Performance Functions of Urban Freeway Segments―8+
Lanes. AADT and predicted crash frequency are for two directions for the default SPF and for one direction for
Virginia and the calibrated default SPFs. SPF = safety performance function; AADT = annual average daily traffic
(vehicles per day).
0
10
20
30
40
50
60
0 20 40 60 80 100
Pre
dic
ted
Nu
mb
er
of
Cra
she
s P
er
Mile
AADT in 1,000
Virginia (Calibrated Default)

17
Figures 4 through 7 illustrate the default and Virginia SPFs of Tables 2 and 3 to show the
differences between the two sets of SPFs. At a given AADT, crash frequencies predicted by the
default SPFs were greater than those predicted by Virginia SPFs for multilane highway segments.
The reverse pattern was noted in general for freeway segments. However, the default SPFs
shown were not adjusted for Virginia conditions; for freeways, the default SPFs are for two
directions whereas the Virginia SPFs are for one direction. Thus, to make a direct comparison
between the default and Virginia SPFs, a calibration factor and a conversion factor should be
applied. The figures in Appendix C show the Virginia SPFs on scatter plots of observed crash
frequencies in Virginia and are helpful in understanding how widely observed crash frequencies
are distributed around each SPF curve.
District-Group SPFs
Replacing the default SPFs in Safety Analyst with Virginia SPFs (Tables 2 and 3) will
enhance accuracy in predicting crash frequencies. However, as expected, the statewide SPFs
will not reflect variation across Virginia. If regional differences are large, customizing SPFs in a
way to reflect the variation will further enhance the prediction accuracy. Reflecting the variation
is possible by creating new subtypes in Safety Analyst. For example, when a state can be
divided into two regions, eastern and western, where driving environments and behaviors related
to traffic safety are different, “region” subtypes can be created and permutated with the existing
subtypes. In the case of multilane highway segments, a total of eight subtypes can be defined:
urban/rural divided/undivided eastern/western subtypes. Then, a separate SPF can be developed
for each of the eight subtypes.
In Virginia, districts have been frequently tied with variations across the state from a
traffic safety perspective and are considered to be the most efficient unit for data preparation
from a viewpoint of implementing Safety Analyst. Thus, a district can serve as a geographical
base unit for exploring new subtypes that can reflect variations across the state. However,
creating too many new subtypes should be discouraged because it will greatly complicate
implementation of Safety Analyst, and therefore opportunities to combine several districts
together should be explored. To explore appropriate ways of grouping districts, a comparative
analysis was performed using total crash SPFs for multilane highways.
For each of the four existing subtypes in multilane highway segments, district-specific
SPFs were first developed, resulting in nine separate SPFs. The coefficient estimates of the nine
SPFs were then statistically compared to determine which coefficients could be combined
together based on Welch’s t-test with the 0.05 significance level. Through an iterative process of
comparing and merging districts, the final grouping schemes were generated. The final SPFs
estimated following the final grouping schemes are presented in Table 4 by VDOT district.
When two districts belong to the same group, the coefficients of these districts are identical in
Table 4. For example, for rural undivided segments, the coefficients for Districts 2, 3, 4, 8, and 9
(Salem, Lynchburg, Richmond, Staunton, and Northern Virginia, respectively) were found to be
statistically identical; thus, these districts were combined to form one group. Although their
coefficients are presented in separate rows in Table 4, their values are identical.

18
Figure 4. Statewide Safety Performance Functions of Multilane Highways in Virginia and Other States. AADT and predicted crash frequency are for two
directions combined. AADT = annual average daily traffic (vehicles per day).
Maximum AADT: 39,520 vehicles per day Maximum AADT for Minnesota: 31,188 vehicles per day
(a) Rural undivided segments (b) Rural divided segments
Maximum AADT for Washington: 57,901 vehicles per day Maximum AADT for Ohio: 77,735 vehicles per day
(c) Urban undivided segments (d) Urban divided segments
0
1
2
3
4
5
6
7
8
9
0 10 20 30 40 50
Pre
dic
ted
Nu
mb
er
of
Cra
she
s P
er
Mile
AADT in 1,000
Total Crash
Fatal & Injury Crash
0
1
2
3
4
5
6
7
8
9
0 10 20 30 40 50 60
Pre
dic
ted
Nu
mb
er
of
Cra
she
s P
er
Mile
AADT in 1,000
Total Crash
Fatal & Injury Crash
0
10
20
30
40
50
60
0 10 20 30 40 50 60 70
Pre
dic
ted
Nu
mb
er
of
Cra
she
s P
er
Mile
AADT in 1,000
Total Crash
Fatal & Injury Crash
0
5
10
15
20
25
30
35
40
45
0 20 40 60 80 100
Pre
dic
ted
Nu
mb
er
of
Cra
she
s P
er
Mile
AADT in 1,000
Total Crash
Fatal & Injury Crash
19
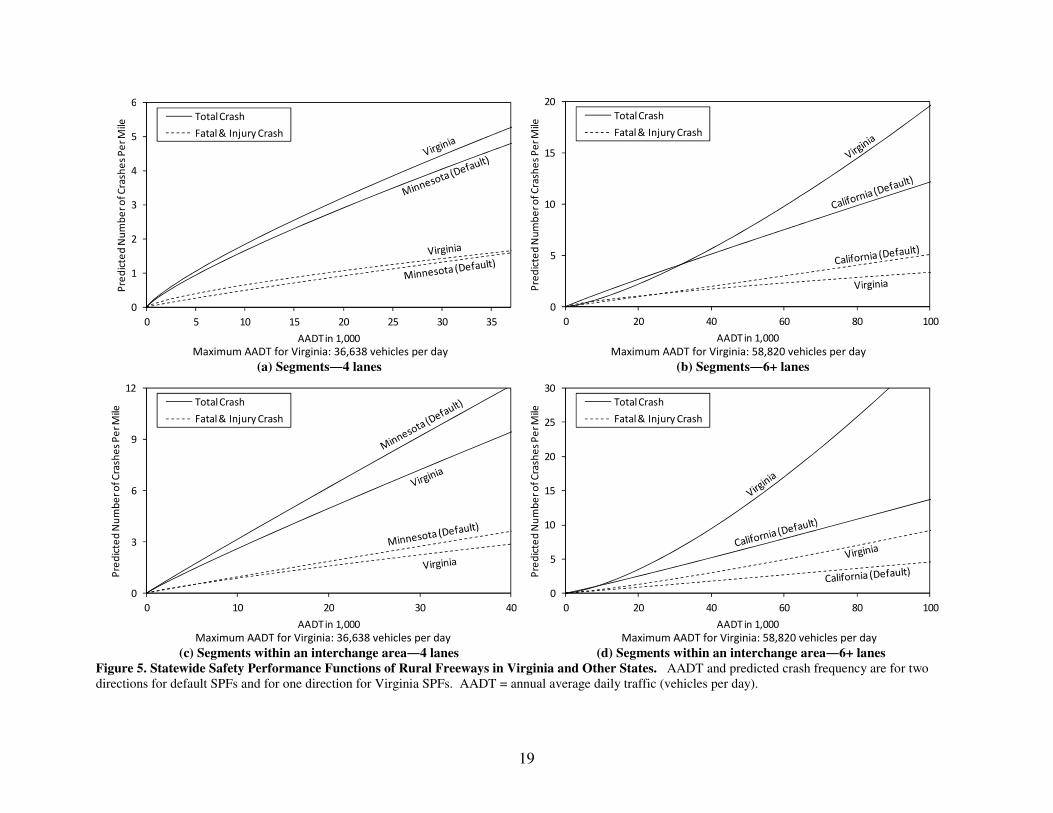
Figure 5. Statewide Safety Performance Functions of Rural Freeways in Virginia and Other States. AADT and predicted crash frequency are for two
directions for default SPFs and for one direction for Virginia SPFs. AADT = annual average daily traffic (vehicles per day).
Maximum AADT for Virginia: 36,638 vehicles per day Maximum AADT for Virginia: 58,820 vehicles per day
(a) Segments―4 lanes (b) Segments―6+ lanes
Maximum AADT for Virginia: 36,638 vehicles per day Maximum AADT for Virginia: 58,820 vehicles per day
(c) Segments within an interchange area―4 lanes (d) Segments within an interchange area―6+ lanes
0
1
2
3
4
5
6
0 5 10 15 20 25 30 35
Pre
dic
ted
Nu
mb
er
of
Cra
she
s P
er
Mile
AADT in 1,000
Total Crash
Fatal & Injury Crash
0
5
10
15
20
0 20 40 60 80 100
Pre
dic
ted
Nu
mb
er
of
Cra
she
s P
er
Mile
AADT in 1,000
Total Crash
Fatal & Injury Crash
0
3
6
9
12
0 10 20 30 40
Pre
dic
ted
Nu
mb
er
of
Cra
she
s P
er
Mile
AADT in 1,000
Total Crash
Fatal & Injury Crash
0
5
10
15
20
25
30
0 20 40 60 80 100
Pre
dic
ted
Nu
mb
er
of
Cra
she
s P
er
Mile
AADT in 1,000
Total Crash
Fatal & Injury Crash

20
Figure 6. Statewide Safety Performance Functions of Urban Freeways Outside an Interchange Area in Virginia and Other States. AADT and predicted
crash frequency are for two directions for default SPFs and for one direction for Virginia SPFs. AADT = annual average daily traffic (vehicles per day).
Maximum AADT for Virginia: 74,102 vehicles per day Maximum AADT for Virginia: 97,868 vehicles per day
(a) Segments―4 lanes (b) Segments―6 lanes
Maximum AADT for Virginia: 100,735 vehicles per day
(c) Segments―8+ lanes
0
20
40
60
80
0 20 40 60 80 100
Pre
dic
ted
Nu
mb
er
of
Cra
she
s P
er
Mile
AADT in 1,000
Total Crash
Fatal & Injury Crash
0
10
20
30
40
50
0 20 40 60 80 100 120
Pre
dic
ted
Nu
mb
er
of
Cra
she
s P
er
Mile
AADT in 1,000
Total Crash
Fatal & Injury Crash
0
10
20
30
40
0 20 40 60 80 100
Pre
dic
ted
Nu
mb
er
of
Cra
she
s P
er
Mile
AADT in 1,000
Total Crash
Fatal & Injury Crash

21
Figure 7. Statewide Safety Performance Functions of Urban Freeways Within an Interchange Area in Virginia and Other States. AADT and predicted
crash frequency are for two directions for default SPFs and for one direction for Virginia SPFs. AADT = annual average daily traffic (vehicles per day).
Maximum AADT for Virginia: 88,893 vehicles per day Maximum AADT for Virginia: 97,868 vehicles per day
(a) Segments within an interchange area―4 lanes (b) Segments within an interchange area―6 lanes
Maximum AADT for Virginia: 102,973 vehicles per day
(c) Segments within an interchange area―8+ lanes
0
20
40
60
80
0 20 40 60 80 100 120
Pre
dic
ted
Nu
mb
er
of
Cra
she
s P
er
Mile
AADT in 1,000
Total Crash
Fatal & Injury Crash
0
20
40
60
80
0 20 40 60 80 100 120
Pre
dic
ted
Nu
mb
er
of
Cra
she
s P
er
Mile
AADT in 1,000
Total Crash
Fatal & Injury Crash
0
20
40
60
80
0 20 40 60 80 100 120
Pre
dic
ted
Nu
mb
er
of
Cra
she
s P
er
Mile
AADT in 1,000
Total Crash
Fatal & Injury Crash

22
Table 4. VDOT District-Group Safety Performance Functions of Multilane Highway Segments in Virginia (Total Crashes)
Site Subtype
Code
Site Subtype Description
District
Correlation
Structurea
αααα
ββββ1111
d
RFT2 b
Total No.
of Sites
Total Length
of Sites (mi)
Max.
AADT
102 Rural multilane undivided
highway segments
1 (Bristol) UN 0.00 0.09 0.64 35.5 56 7 18,821
2 (Salem) -7.03 0.83 173 29 28,540
3 (Lynchburg) -7.03 0.83 45 5 18,004
4 (Richmond) -7.03 0.83 83 19 16,495
5 (Hampton Roads) -16.86 1.86 167 46 28,748
6 (Fredericksburg) -4.49 0.57 170 34 23,036
7 (Culpeper) 0.00 0.00 25 2 39,520
8 (Staunton) -7.03 0.83 121 22 27,657
9 (Northern Virginia) -7.03 0.83 10 2 6,374
103 Rural multilane divided
highway segments
1 (Bristol) AR -6.14 0.74 0.45 42.7 641 218 23,945
2 (Salem) -6.14 0.74 814 192 28,540
3 (Lynchburg) -7.82 0.92 560 233 21,991
4 (Richmond) -6.14 0.74 548 196 42,505
5 (Hampton Roads) -10.08 1.15 450 159 26,640
6 (Fredericksburg) -10.08 1.15 571 217 43,748
7 (Culpeper) -7.82 0.92 486 154 49,185
8 (Staunton) -6.14 0.74 549 141 35,924
9 (Northern Virginia) -10.08 1.15 69 22 55,026
152 Urban multilane undivided
arterial segments
1 (Bristol) CS -23.69 2.54 5.23 5.5 97 11 25,623
2 (Salem) 0.00 0.10 417 47 27,124
3 (Lynchburg) -10.97 1.27 321 33 35,117
4 (Richmond) -10.97 1.27 650 74 47,057
5 (Hampton Roads) -6.89 0.84 1,022 141 71,444
6 (Fredericksburg) -10.97 1.27 132 20 56,982
7 (Culpeper) -23.69 2.54 34 5 43,236
8 (Staunton) -10.97 1.27 147 22 27,657
9 (Northern Virginia) -6.89 0.84 1,461 156 64,334
153 Urban multilane divided
arterial segments
1 (Bristol) IN -10.70 1.22 3.54 16.4 194 29 32,639
2 (Salem) -13.76 1.56 770 115 65,081
3 (Lynchburg) -10.70 1.22 410 58 51,439
4 (Richmond) -13.76 1.56 2,371 313 100,111
5 (Hampton Roads) -5.97 0.70 2,774 422 92,201
6 (Fredericksburg) -5.97 0.70 233 35 92,399
7 (Culpeper) -10.70 1.22 209 28 59,667
8 (Staunton) -13.76 1.56 339 50 37,870
9 (Northern Virginia) -7.28 0.89 3,115 400 113,552
Equation 4 should be used for multilane highway segment SPFs. Max. = maximum; AADT = annual average daily traffic (vehicles per day). a Correlation structure specified for each model: AR = autoregressive order 1; CS = compound symmetry (also known as exchangeable); IN = independent; and
UN = unstructured b
Freeman-Tukey R2.

23
It should be noted that an SPF for each district-group was not obtained from a separate
estimation of an SPF for each group but was rearranged after a single SPF containing all
statistically significant differential coefficients across the groups was estimated. For example,
for rural undivided segments, Districts 2, 3, 4, 8, and 9 (Salem, Lynchburg, Richmond, Staunton,
and Northern Virginia, respectively) were combined to form a group and one set of coefficient
estimates was obtained for the group so that the estimates were identical for all five districts in
the group. Then, a separate SPF for each of the five districts was written using the estimates,
resulting in five identical SPFs, one for each district. This is why one estimate of the dispersion
parameter (d) and one RFT2 value are reported for each subtype in Table 4 and different estimates
of coefficients (a and b1) varying across districts are found. The correlation structures found to
perform the best for the statewide SPFs (Table 2) were retained.
Figure 8 shows the district-group SPFs for rural multilane highways and their
corresponding statewide SPFs. There are three district groups for rural segments and four for
urban segments. The number of districts in one group varies from one (e.g., District 6
[Fredericksburg] for rural undivided segments) to five (e.g., Districts 2, 3, 4, 8, and 9 [Salem,
Lynchburg, Richmond, Staunton, and Northern Virginia, respectively] for rural undivided
segments). Although some district-group SPFs look drastically different from the rest of the
district-group SPFs, the actual ranges of AADTs should be considered. For example, for rural
undivided segments, the SPF for District 5 (Hampton Roads) (not combined with any other
district) looks very different from the SPFs of the other district-groups. However, the maximum
AADT on rural undivided segments in District 5 (Hampton Roads) was 28,748 vehicles per day.
This means that although the curve of District 5 (Hampton Roads) can run well beyond 30,000
AADT, using the curve (i.e., SPF) for predicting crash frequencies for conditions above 30,000
AADT would be inappropriate.
The number of segments and total length of those segments should also be considered
when the district-group SPFs are applied. For example, for rural undivided segments, District 1
(Bristol) formed a separate group by itself. However, there are only 56 rural undivided segments
totaling 7 miles in District 1 (Bristol). The curves constructed from this relatively small sample
size could be substantially impacted by the addition of segments with crash characteristics that
were different from those of the original segments.
As seen in Figure 8, the number and composition of district-groups were not consistent
across the four subtypes. Some consistency was found such as District 1 (Bristol) being
separated from Districts 5, 6, and 9 (Hampton Roads, Fredericksburg, and Northern Virginia,
respectively) in all four subtypes, but general rules for grouping districts could not be developed.
To create new subtypes based on the district-groups, different numbers and definitions of new
subtypes varying across the four existing subtypes should be created. For example, four new
subtypes would be created for rural undivided segments, the first containing District 5 (Hampton
Roads); the second containing Districts 2, 3, 4, 8, and 9 (Salem, Lynchburg, Richmond, Staunton,
and Northern Virginia, respectively); the third containing District 6 (Fredericksburg); and the
fourth containing District 1 (Bristol). Three new subtypes would be created for rural divided
segments, the first containing Districts 5, 6, and 9 (Hampton Roads, Fredericksburg, and
Northern Virginia, respectively); the second containing Districts 3 and 7 (Lynchburg and
Culpeper, respectively); and the third containing Districts 1, 2, 4, and 8 (Bristol, Salem,

24
Richmond, and Staunton, respectively). This lack of general consistency in district-grouping
results causes difficulty in incorporating the developed district-group SPFs into Safety Analyst.
Thus, it seems practically reasonable to implement Safety Analyst with the statewide SPFs for
multilane highway segments. For freeways, the district-grouping approach was not considered
because not all districts had freeway routes.
Implementation Aspects of Freeway Segment SPFs in Safety Analyst
VDOT’s RNS maintains freeway segment data directionally, as separate sites. This is
also true for a small portion of multilane highways. Meanwhile, procedures of Safety Analyst
such as those applying SPFs and the empirical Bayes method are basically designed for both
directions combined. To accommodate two different practices in recording directional segments
across the United States, Safety Analyst provides separate ways for the two practices: (1) treating
the separate directions of travel as separate sites (corresponding to the one-way operation data
element) and (2) treating the separate directions as the same site (corresponding to the two-way
operation data element (AASHTO, 2013b).
However, the two ways that Safety Analyst currently provides do not seem suitable for
RNS without modification since they seem to require a database structure matching separate
directions on the same segment; the freeway segments in RNS are currently not aligned in such a
manner. To satisfy such a matching structure, a new roadway inventory table needs to be created
for freeway segments. The new table can be created for treating the separate directions as either
(1) separate sites or (2) the same site. The former would record the combined AADT and crash
frequency of the two directions, and the latter would record the directional AADT and crash
frequency with Safety Analyst summing the two directions internally. A table created from the
latter approach would need a segment identifier where the separate directions of the same
segment have the same value while being in separate records.
CONCLUSIONS
• Default SPFs in Safety Analyst are different from the Virginia SPFs for multilane highway
and freeway segments developed in this study. The curve shapes of the default SPFs were
not well matched with the Virginia statewide SPFs developed using local data. This means
that the default SPFs do not properly represent the relationships between annual crash
frequencies and AADT on such segments in Virginia. If calibration factors adjusting the
default SPFs to Virginia conditions were applied, the adjusted default SPFs would be
matched with the Virginia SPFs for conditions with average AADT levels but would either
overpredict or underpredict crash frequencies at low or high AADTs. The extent of the
overprediction or underprediction would vary by subtype.

25
Figure 8. VDOT District-Group Safety Performance Functions of Multilane Highways in Virginia (Total Crashes). A safety performance function (SPF)
curve of a district is valid within the maximum AADT indicated for the district. An SPF for District 7 on rural undivided segments is not presented in (a) because it was
not statistically significant. AADT = annual average daily traffic (vehicles per day); District 1 (Bristol); District 2 (Salem); District 3 (Lynchburg); District 4 (Richmond);
District 5 (Hampton Roads); District 6 (Fredericksburg); District 7 (Culpeper); District 8 (Staunton); District 9 (Northern Virginia).
(a) Rural undivided segments (b) Rural divided segments
(c) Urban undivided segments (d) Urban divided segments
0
2
4
6
8
10
12
14
16
18
0 10 20 30 40 50
Pre
dic
ted
Nu
mb
er
of
Cra
she
s P
er
Mile
AADT in 1,000
D1 D2 D3
D4 D5 D6
D7 D8 D9
State
District 1
Max. AADT (veh/day)
D1(18,821) D2(28,540) D3(18,004)
D4(16,495) D5(28,748) D6(23,036)
D7(39,520) D8(27,657) D9(6,374)
0
2
4
6
8
10
12
0 10 20 30 40 50 60
Pre
dic
ted
Nu
mb
er
of
Cra
she
s P
er
Mile
AADT in 1,000
D1 D2 D3
D4 D5 D6
D7 D8 D9
State
Max. AADT (veh/day)
D1(23,945) D2(28,540) D3(21,991)
D4(42,505) D5(26,640) D6(43,748)
D7(49,185) D8(35,924) D9(55,026)
0
10
20
30
40
50
60
0 10 20 30 40 50 60 70
Pre
dic
ted
Nu
mb
er
of
Cra
she
s P
er
Mile
AADT in 1,000
D1 D2 D3
D4 D5 D6
D7 D8 D9
State
Districts 2
Max. AADT (veh/day)
D1(25,623) D2(27,124) D3(35,117)
D4(47,057) D5(71,444) D6(56,982)
D7(43,236) D8(27,657) D9(64,334)
0
5
10
15
20
25
30
35
40
45
0 20 40 60 80 100
Pre
dic
ted
Nu
mb
er
of
Cra
she
s P
er
Mile
AADT in 1,000
D1 D2 D3
D4 D5 D6
D7 D8 D9
State
Max. AADT (veh/day)
D1(32,639) D2(65,081) D3(51,439)
D4(100,111) D5(92,201) D6(92,399)
D7(59,667) D8(37,870) D9(113,552)

26
• Sizable variations in the curve shapes of the Virginia SPFs for multilane highway segments
exist across Virginia. District-group SPFs developed using the VDOT district-based data
revealed that the shapes of the Virginia SPFs vary across VDOT’s districts on multilane
highway segments and the level of variations varies by subtype.
• Creating new subtypes based on VDOT district-groups resulting from this study for multilane
highway segments is not suitable for the current version of Safety Analyst. According to the
district-group SPFs developed using Virginia data, the number and composition of district-
groups vary by existing subtype of multilane highway segments. The lack of consistency in
grouping districts in this facility type cannot be accommodated in the current version of
Safety Analyst.
• Modifications to RNS are needed to support the implementation of freeway segment SPFs in
Safety Analyst. VDOT’s practice of maintaining roadway inventory data for freeway
segments does not appear to fit either of the two data loading approaches that Safety Analyst
currently provides. Thus, to implement Virginia freeway segment SPFs in Safety Analyst,
either a new inventory table needs to be created or data management of the current table
needs to be modified to comply with a database format required for Safety Analyst.
RECOMMENDATIONS
1. VDOT’s Traffic Engineering Division should use the Virginia statewide SPFs for multilane
highway and freeway segments developed in this study for implementing Safety Analyst. The
Virginia statewide SPFs in Tables 2 and 3 are different from the default SPFs embedded in
Safety Analyst for these segments. If the default SPFs were adjusted to Virginia conditions
by calibration factors, inaccurate prediction of crash frequencies would be expected at low
and high AADTs, which was illustrated with urban freeway segments with 8+ lanes (Figure
3).
2. VDOT’s Traffic Engineering Division should use the Virginia statewide or district-group
SPFs for multilane highway segments and the statewide SPFs for freeway segments
developed in this study when implementation of Safety Analyst is not feasible. The district-
group SPFs for multilane highway segments cannot be implemented in Safety Analyst.
However, all SPFs developed in this study including the district-group SPFs are
implementable without Safety Analyst. The statewide SPFs adjusted by district-group
calibration factors can account for variation across districts to some extent.
BENEFITS AND IMPLEMENTATION PROSPECTS
The Virginia statewide and district-group SPFs developed in this study are expected to be
used to identify segments for safety improvement; evaluate the safety conditions of existing and
future segments; and quantify the safety effects of changes in the geometric and/or operational

27
features of segments. With the developed statewide SPFs, VDOT will be able to maximize the
benefits of implementing Safety Analyst for multilane highway and freeway segments. With the
statewide and district-group SPFs, VDOT will also be able to predict crash frequencies for its
safety programs. For example, segments on multilane highways and freeways can be prioritized
for developing safety improvement projects for the Highway Safety Improvement Program using
the predicted crash frequencies.
Recommendation 1 can be implemented by replacing the default SPFs in Safety Analyst
with the statewide SPFs developed in this study (Tables 2 and 3). VDOT’s Information
Technology Division, VDOT’s Transportation Engineering Division (TED), and the Virginia
Center for Transportation Innovation and Research (VCTIR) may need to work together to
implement this recommendation.
Recommendation 2 can be implemented by adopting the developed statewide (Tables 2
and 3) and district-group (Table 4) SPFs in selecting sites for safety improvement programs.
VDOT’s TED and VCTIR may need to work together to implement this recommendation.
VDOT’s districts may well be able to use the SPFs for their safety programs, and VDOT’s TED
and VCTIR can help them use the SPFs in an efficient and correct manner.
ACKNOWLEDGMENTS
The authors thank Stephen Read (VDOT TED), Randy Dittberner (Northern Virginia
TED), Peter Hedrich (Fredericksburg TED), Tracy Turpin (VDOT TED), and John Miller
(VCTIR) for their guidance and support throughout the project and their helpful comments;
Cathy McGhee (VCTIR) for her review of and suggestions for the report; and Linda Evans
(VCTIR) for her editorial assistance.
REFERENCES
American Association of State Highway and Transportation Officials. Developing Agency-
Specified SPF. January 5, 2013a. http://www.safetyanalyst.org/spf_dev_guidelines
/Developing%20SPFs%20with%20State%20or%20Local%20Highway%20Agency%20
Data.pdf. Accessed April 9, 2013.
American Association of State Highway and Transportation Officials. Direction of Travel on
Divided Highways. January 5, 2013b. http://developer.safetyanalyst.org/
aashto/index.php/Direction_of_Travel_on_Divided_Highways. Accessed April 9, 2013.
Akaike, H. A New Look at the Statistical Model Identification. IEEE Transactions on
Automatic Control, Vol. 19, No. 6, 1974, pp. 716-723.
de Boor, C. A Practical Guide to Splines. Springer Verlag, New York. 1978.

28
Diggle, P.J., Heagerty, P., Liang, K., and Zeger, S.L. Analysis of Longitudinal Data. Second
Edition. Oxford University Press, Oxford, U.K., 2002.
Eilers, P.H.C., and Marx, B.D. Flexible Smoothing with B-Splines and Penalties. Statistical
Science, Vol. 11, No. 2, 1996, pp. 89-121.
Exelis Inc. Safety Analyst User’s Manual. American Association of State Highway and
Transportation Officials, Washington, DC, 2013.
Federal Highway Administration. SafetyAnalyst Overview. 2009a.
http://www.safetyanalyst.org/. Accessed February 16, 2010.
Federal Highway Administration. SafetyAnalyst Scope. 2009b.
http://www.safetyanalyst.org/scope.htm. Accessed February 16, 2010.
Federal Highway Administration. Develop Agency SPF. 2009c.
http://www.safetyanalyst.org/spf_dev_guidelines/Developing%20SPFs%20with%20State
%20or%20Local%20Highway%20Agency%20Data.pdf. Accessed January 20, 2014.
Federal Highway Administration. SafetyAnalystTM
: Software Tools for Safety Management of
Specific Highway Sites. FHWA-HRT-10-063. July 2010.
http://www.safetyanalyst.org/pdf/FinalReport_July2010.pdf. Accessed January 20, 2014.
Garber, N.J., and Rivera, G. Safety Performance Functions for Intersections on Highways
Maintained by the Virginia Department of Transportation. VTRC 11-CR1. Virginia
Transportation Research Council, Charlottesville, 2010.
Garber, N.J., Philip, R.H., and Conrad, G. Development of Safety Performance Functions for
Two-Lane Roads Maintained by the Virginia Department of Transportation. VTRC 10-
R25. Virginia Transportation Research Council, Charlottesville, 2010.
Kweon, Y.-J., and Lim, I.K. Appropriate Regression Model Types for Intersections in Safety
Analyst. Journal of Transportation Engineering, Vol. 138, No. 10, 2012, pp. 1250-1258.
Liang, K.Y., and Zeger, S.L. Longitudinal Data Analysis Using Generalized Linear Models.
Biometrika, Vol. 73, No. 1, 1986, pp. 13-22.
Pan, W. Akaike’s Information Criterion in Generalized Estimating Equations. Biometrics, Vol.
57, 2001, pp. 120-125.

29
APPENDIX A
ESTIMATION AND EVALUATION OF A PANEL COUNT DATA MODEL
Generalized Estimating Equation
The GEE of Liang and Zeger (1986) is a method of estimating the parameters of a
generalized linear model such as a negative binomial model on panel data using a preset
correlation structure that would exist in repeated measures of the dependent variable. GEE
estimates of the model parameters are known to be consistent even when the correlation structure
is misspecified (Diggle et al., 2002). Negative binomial models for SPFs were estimated using
GEE by specifying REPEATED statement with TYPE option in PROC GENMOD. Kweon and
Lim (2012) used GEE to estimate eight panel negative binomial models for developing
intersection SPFs.
Four Correlation Structures
The four correlation structures are (1) independent; (2) compound symmetry, also known
as exchangeable; (3) autoregressive; and (4) unstructured correlation structures. All structures
except for the independent structure assume that the annual crash frequencies are correlated over
the 5 years but in different ways, as shown here.
Independent (IN):
10000
01000
00100
00010
00001
Compound Symmetry (CS):
1
1
1
1
1
ρρρρ
ρρρρ
ρρρρ
ρρρρ
ρρρρ
Autoregressive (AR):
1
1
1
1
1
234
23
22
32
432
ρρρρ
ρρρρ
ρρρρ
ρρρρ
ρρρρ
Unstructured (UN):
1
1
1
1
1
54535251
54434241
53433231
52423221
51413121
ρρρρ
ρρρρ
ρρρρ
ρρρρ
ρρρρ
The independent structure assumes no correlation over the 5 years. The negative
binomial regression ignoring a panel data structure (i.e., omitting REPEATED statement in
PROC GENMOD) is identical to the regression with the independent structure in coefficient
estimates yet different in standard error estimates. The compound symmetry structure assumes
an identical correlation between any two different years, whereas the autoregressive structure
assumes that a correlation between two years diminishes as the two years become further away.
Both correlations require an estimation of only one correlation parameter. The unstructured
structure assumes a different correlation for any two different years, which is the most complex
structure, and requires 10 correlation coefficients to be estimated for 5-year data. Further details
are provided by Kweon and Lim (2012).

30
Quasi-likelihood Information Criterion
Akaike’s information criterion (AIC), proposed by Akaike (1974), is one of the most
popular criterion for model performance comparison and is based on likelihoods. However, it is
not applicable to models estimated by GEE because GEE is not based on likelihoods. QIC,
proposed by Pan (2001), is a modified version of AIC suitable for models estimated by GEE. A
model with a smaller QIC value is viewed as performing better than one with a larger QIC value.
Kweon and Lim (2012) used QIC to select the best correlation structure among eight structures
for intersection SPFs.

31
APPENDIX B
NON-PARAMETRIC MODEL AND ESTIMATION RESULTS
Penalized B-Spline Model
A smoothing spline is a piecewise smooth polynomial function with the polynomial
pieces connected at knots, and B-spline is a basis spline proposed by de Boor (1978). The
penalized B-spline employed in this study is a non-iterative B-spline transformation on
explanatory variables and was proposed by Eilers and Marx (1996). A smoothing parameter for
the transformation was determined by the Schwarz-Bayesian criterion, and other parameters for
fitting the spline were set at default values (e.g., cubic spline with 100 evenly spaced knots and 3
evenly spaced exterior knots). Graphical outputs of the penalized B-spline models are useful in
examining how well the SPFs developed in this study are matched with the underlying
relationship represented by the resulting B-spline curves.
Modeling Results and Discussions
A penalized B-spline curve was fit to each of the four subtypes of multilane highway
segments and the five subtypes of freeway segments. The curves predicting the annual crash
frequency per mile are presented in Figures B1 through B3, and their 95th percentile confidence
intervals are also presented. The developed statewide SPFs (Tables 2 and 3) are overlaid on the
figures for comparison. Because the penalized B-spline curves are deemed to represent an
underlying relationship between crash frequency and AADT, the functional form (Eq. 1) of the
SPFs can be assessed by a visual comparison of the developed SPFs against the corresponding
penalized B-spline curves; the confidence intervals add a statistical perspective to the assessment.
It should be noted that a confidence interval should not be confused with a prediction
interval. The confidence interval is used to evaluate the uncertainty of an estimate of an average
crash frequency of all segments carrying a certain AADT, whereas the prediction interval is used
to evaluate the uncertainly of an estimate of an individual crash frequency of a segment carrying
a certain AADT. Because the prediction interval takes into account variability in the conditional
distribution of an actual crash frequency as well as variability in the estimate of the average crash
frequency, it is typically much wider than the confidence interval.
In this study, the estimate of an average crash frequency can be called a state-overall
prediction of an annual crash frequency and an estimate of an individual crash frequency can be
called a segment-specific prediction. The prediction curves (solid lines in the figures) indicate
both state-overall and segment-specific predictions of annual crash frequencies corresponding to
varying AADTs. However, the uncertainties of these two predictions are different. The
confidence intervals (dotted lines in the figures) represent the uncertainty of the state-overall
predictions, whereas the prediction intervals, not shown here, represent the uncertainty of the
segment-specific predictions. For the purpose of assessing the functional forms of the developed
SPFs (Tables 2 and 3) against the penalized B-spline curves, the confidence intervals are
appropriate and the typical 95% confidence level was adopted to construct these intervals. As
32
stated previously, the SPFs were developed using the negative binomial model with the
functional form (Eq. 1) required for Safety Analyst.
As for the multilane highways (Figure B1), the B-spline curves are deviated from the
developed SPFs for high AADTs. For the example of rural undivided segments, the B-spline
curves are considerably higher than the developed SPF for the segments carrying an AADT of
around 30,000. As for the freeway segments outside an interchange area (Figures B2 and B3),
deviations of the developed SPFs from the B-spline curves are also noticeable at high AADTs
but patterns and degrees of deviations are more diverse than those found in the multilane
highways. The SPFs for the rural segments with 4 lanes and urban segments with 6 and 8+ lanes
are generally in line with the B-spline curves. Those for the rural segments with 6 lanes and the
urban segments with 4 lanes appear severely deviated from their corresponding B-spline curves
at medium and/or high AADTs.
Deviations of the B-spline curves from the developed SPFs might indicate that some
segment characteristics not included in the SPFs might enhance or deteriorate safe driving
conditions on the segments, and they are associated with AADTs. For rural undivided segments
of multilane highways (Figure B1a), suppose that horizontal curves with inadequate sight
distances and driveways are concentrated on segments carrying about 30,000 AADT. These
segments would very likely experience more crashes than other segments because such design
features are understood to create less safe conditions than segments without such curves and
driveways.
The SPFs for Safety Analyst are required to adopt the non-decreasing functional form of
Equation 1 (i.e., no decrease in the predicted crash frequency as AADT increases), and the study
data do not include information pertaining to such design features. Thus, the required functional
form along with the lack of the information would result in Figure B1a showing large differences
between the two curves at around 30,000 AADT. Without the information about the design
features associated with less safe conditions, the penalized B-spline model can still capture the
dramatic increase in crash frequencies at around 30,000 AADT whereas the negative binomial
model of an SPF in the required model specifications cannot do so.
The developed SPFs that are not well matched with penalized B-spline curves such as the
SPF for rural undivided segments of multilane highways (Figure B1a) are still useful in
identifying potential segments for safety improvement. For the hypothetical example with
horizontal curves and driveways, a large proportion of rural undivided segments carrying about
30,000 AADT would be identified as potential safety improvement segments if the developed
SPF was used for identification and prioritization (see Figure B1a). When further investigation
of the identified segments, involving collecting more segment characteristics and field visits, was
conducted, it would probably be discovered that horizontal curves and driveways pose unsafe
driving conditions on many of the identified segments, which would then lead to selection of
appropriate countermeasures.

33
Figure B1. Comparison of Functional Forms of Statewide Safety Performance Functions of Multilane Highway Segments in Virginia. AADT = annual
average daily traffic (vehicles per day).
(a) Rural undivided segments (b) Rural divided segments
(c) Urban undivided segments (d) Urban divided segments
0
5
10
15
20
0 10 20 30 40
Nu
mb
er
of
Cra
she
s p
er
Mile
AADT in 1,000
95% Confidence Interval
Penalized B-Spline Model
Negative Binomial Model
0
5
10
15
20
0 10 20 30 40 50 60
Nu
mb
er
of
Cra
she
s p
er
Mile
AADT in 1,000
95% Confidence Interval
Penalized B-Spline Model
Negative Binomial Model
0
20
40
60
80
0 10 20 30 40 50 60 70
Nu
mb
er
of
Cra
she
s p
er
Mile
AADT in 1,000
95% Confidence Interval
Penalized B-Spline Model
Negative Binomial Model
0
10
20
30
40
50
0 20 40 60 80 100
Nu
mb
er
of
Cra
she
s p
er
Mile
AADT in 1,000
95% Confidence Interval
Penalized B-Spline Model
Negative Binomial Model

34
Figure B2. Comparison of Functional Forms of Statewide Safety Performance Functions of Rural Freeways Outside an Interchange Area in Virginia. AADT = annual average daily traffic (vehicles per day).
(a) Rural segments (4 lanes) (b) Rural segments (6 lanes)
0
2
4
6
8
10
12
0 10 20 30 40
Nu
mb
er
of
Cra
she
s p
er
Mile
AADT in 1,000
95% Confidence Interval
Penalized B-Spline Model
Negative Binomial Model
0
5
10
15
20
25
30
0 10 20 30 40 50 60
Nu
mb
er
of
Cra
she
s p
er
Mile
Pe
r Y
ea
r
AADT in 1,000
95% Confidence Interval
Penalized B-Spline Model
Negative Binomial Model

35
Figure B3. Comparison of Functional Forms of Statewide Safety Performance Functions of Urban Freeways Outside an Interchange Area in Virginia.
AADT = annual average daily traffic (vehicles per day).
(a) Urban segments (4 lanes) (b) Urban segments (6 lanes)
(c) Urban segments (8+ lanes)
0
20
40
60
80
0 20 40 60 80
Nu
mb
er
of
Cra
she
s p
er
Mile
Pe
r Y
ea
r
AADT in 1,000
95% Confidence Interval
Penalized B-Spline Model
Negative Binomial Model
0
10
20
30
40
50
60
0 20 40 60 80 100
Nu
mb
er
of
Cra
she
s p
er
Mile
Pe
r Y
ea
r
AADT in 1,000
95% Confidence Interval
Penalized B-Spline Model
Negative Binomial Model
0
20
40
60
80
100
0 20 40 60 80 100
Nu
mb
er
of
Cra
she
s p
er
Mile
Pe
r Y
ea
r
AADT in 1,000
95% Confidence Interval
Penalized B-Spline Model
Negative Binomial Model

36

37
APPENDIX C
SCATTERPLOTS OF MULTILANE HIGHWAYS IN VIRGINIA
Figure C1. Observed Crash Frequency and Safety Performance Functions of Multilane Highways in Virginia. AADT = annual average daily traffic
(vehicles per day).
(a) Rural undivided segments (b) Rural divided segments
(c) Urban undivided segments (d) Urban divided segments