Embed Size (px)
Citation preview

Development of Instruments for
Real-time Water Monitoring
S. Mitra
New Jersey Institute of Technology
Newark, NJ 07102
Acknowledgements: US EPA, NSF, US Army

On-line Real-time Monitoring
Process
Or
Process Stream
Instrument
or sensor
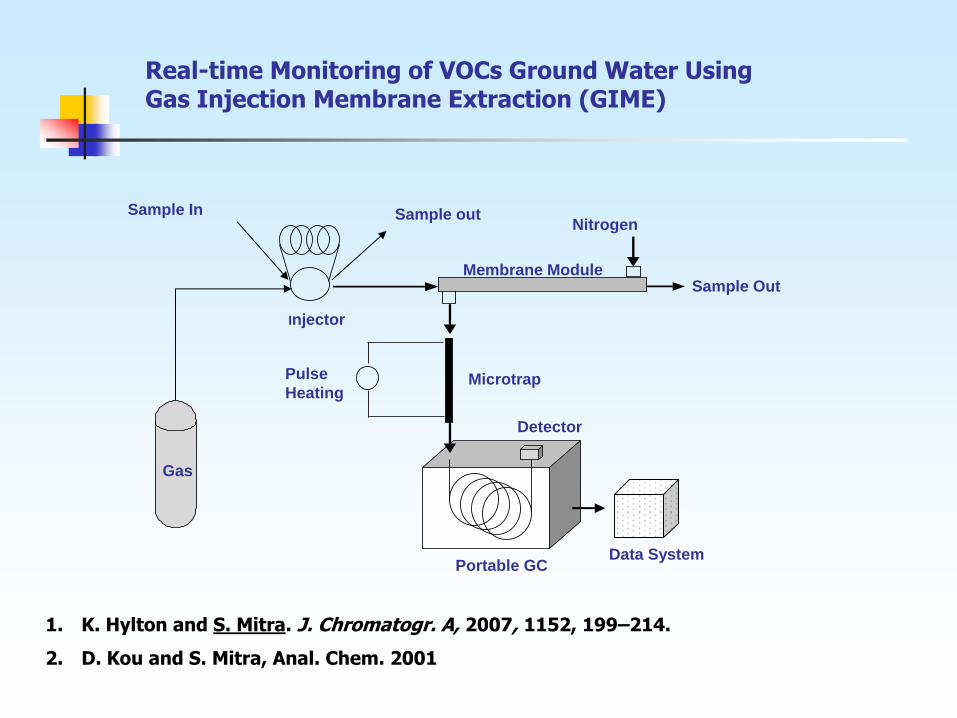
Real-time Monitoring of VOCs Ground Water Using Gas Injection Membrane Extraction (GIME)
Gas
Pulse
Heating
Nitrogen
Injector
Membrane Module
Portable GC
Detector
Microtrap
Sample Out
Sample In
Data System
Sample out
1. K. Hylton and S. Mitra. J. Chromatogr. A, 2007, 1152, 199–214.
2. D. Kou and S. Mitra, Anal. Chem. 2001

Continuous Monitoring by GIME
Compounds MDLs (ug/l) RSD (%)
Benzene 0.1 1.7
Toluene 0.1 2.3
Ethylbenzene 0.9 2.8

Field Testing of Gime-GC System at a Superfund Site
The on-line real-time monitoring system A groundwater treatment facility at the Naval
and Engineering Station in Lakehurst, NJ,
where the field study was conducted.

I1 I4I2 I5I3 I6 I7 I9I8
0 3618 9054 10872 126 144
Time (min)
1
2
3
1. 1,1 Dichloroethylene
2. cis 1,2 Dichloroethylene
3. Trichloroethylene
Typical chromatograms from on-line analysis of water entering the treatment facility. Injections were made at I1, I2 etc.
0.00
0.50
1.00
1.50
2.00
2.50
3.00
0.00 50.00 100.00 150.00 200.00 250.00 300.00 350.00 400.00
Time (min)
Co
ncen
trati
on
(p
pb
)
cis 1,2 Dichloroethylene
0.00
0.20
0.40
0.60
0.80
1.00
1.20
1.40
0.00 50.00 100.00 150.00 200.00 250.00 300.00 350.00 400.00
Time (min)
Co nc en tra tio n (p pb )
Trichloroethylene
Concentration Profiles over a six hour monitoring period
Continuous Monitoring by GIME-GC

Steps in Trace Semi Volatile Measurements
Extraction -LLE, SPE, SPME
Concentration -Evaporative, Membrane
Detection -GC, HPLC, MS

Membrane Extraction
Membrane Feed side Permeate side

Schematic Diagram of ME-LC
Organic
Extractant
Water
Sample
Detector
HPLC mobile phase
HPLC Column
Solvent Exit
Analyte
Laden
Solvent
Sample Exit
Hollow Fiber
Membrane Module
Injection Valve
X. Guo and S. Mitra, Journal of Chromatography A,904 (2000) 189-196.
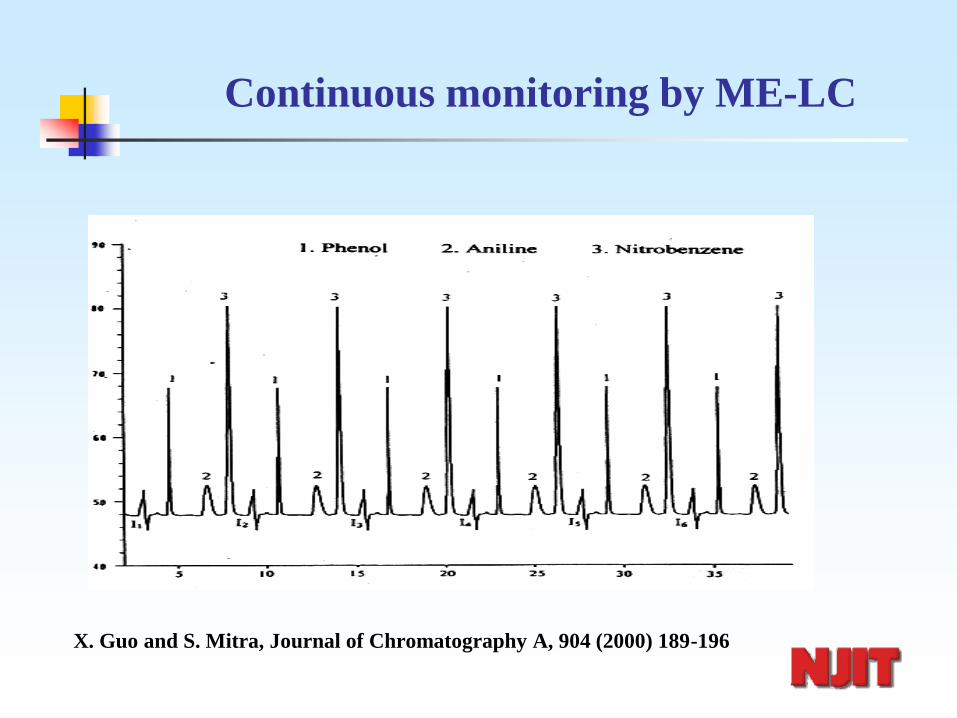
Continuous monitoring by ME-LC
X. Guo and S. Mitra, Journal of Chromatography A, 904 (2000) 189-196

Simultaneous Extraction and Concentration
Analyte
Acceptor (solvent)
Donor
(water)
Membrane
Extract
Solvent
Analyte
Solvent
Donor
D. Kou and S. Mitra, Analytical Chemistry (2003).

Solubility and Solvent Loss
Kow
(Log P)
Hexane BA MIBK
IPA
EE EF EE EF EE EF EE EF
PCP 5.12 68.1 36.3 69.5 101.6 43.7 153.3 26.1 203.4
Atrazine 2.61 6.5 3.5 56.2 82.2 N/A N/A 31.6 246.6
Naphthalene 3.30 46.3 24.6 81.3 119 33.9 119 37.4 292
Water Solubility
9.5 mg/l 8.4 g/l 19 g/l 30.9 g/l
Solvent
Loss (%)
26.7 73.3 88.9 95
Ref: D. Kou and S. Mitra, Analytical Chemistry (Nov, 2003)

Analytical Performance
Compounds MDL (μg/L ) RSD (%)
Atrazine 0.5 4.6
PCP 1.0 7.8
Naphthalene 0.9 6.3

Total Analyitical System
Integrating Extraction and Concentration

Extraction with On-line Membrane
Concentration
membrane concentration
Organic solvent
Water sample
Water sample exit
Inert gas
Gas out
Injection valve HPLC
membrane extraction Extract
Concentrated extract
Wang and Mitra, Journal of Chromatography A, 1068 (2005), 237-242

Wang and Mitra, Journal of Chromatography A, 1068 (2005), 237-242

Total Analytical System
Organic
Extractant Sample Exit
Extraction Module
Detector
HPLC Mobile Phase
HPLC Column
Injection Valve
Water
Sample
Injec. Loop
Overflow
Concentration
Module
N2
N2 Stripping
Flow Analyte
Laden
Solvent
Extraction Concentration Detection
Wang and Mitra, Journal of Chromatography A, 1068 (2005), 237-242

Mass transfer in the TAS
Wang and Mitra, Journal of Chromatography A, 1068 (2005), 237-242
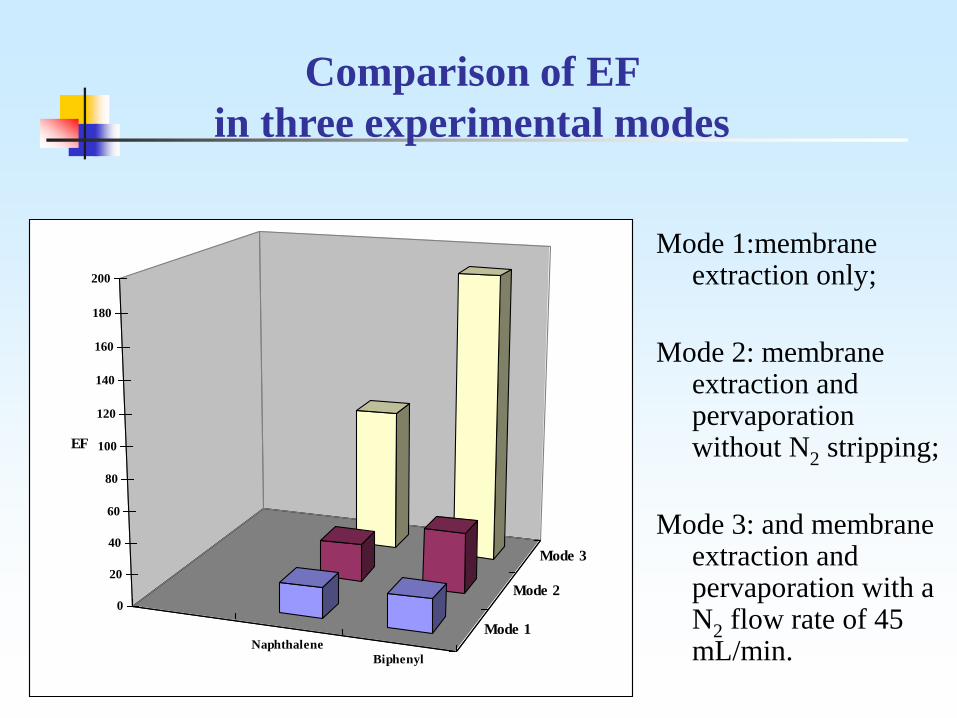
Comparison of EF
in three experimental modes
Mode 1:membrane extraction only;
Mode 2: membrane extraction and pervaporation without N2 stripping;
Mode 3: and membrane extraction and pervaporation with a N2 flow rate of 45 mL/min. Naphthalene
Biphenyl
Mode 1
Mode 2
Mode 3
0
20
40
60
80
100
120
140
160
180
200
EF

Real Time Monitoring of Haloacetic Acids

Continuous SLME-HPLC
Wang, Kou and Mitra.Journal of Chromatography A (2005).

Series of Chromatograms from Continuous
SLME of the Nine HAAs

Lab-on-a-chip, Total Analytical System
Sample
Extraction
Sample
Concentration
Separation/
Processing
Detection

On-Chip SLMME
In Review- Anal. Chem. (2004)