Embed Size (px)
Citation preview

DEVELOPMENT OF GUIDELINES FOR
PG BINDER SELECTION FOR WISCONSIN
WisDOT Highway Research Study 0092-01-01
By
Kitae Nam, Research Assistant Rodrigo Delgadillo, Research Assistant
& Hussain U. Bahia, Associate Professor
University of Wisconsin – Madison Department of Civil and Environmental Engineering 1415 Engineering Drive, Madison, WI 53706-1490
Submitted to
Wisconsin Department of Transportation Division of Transportation Infrastructure Development
Research Coordination Section 4802 Sheboygan Ave., Box 7065, Madison, WI 53707-7910
December 2004

i
DISCLAIMER
This research was funded through the Wisconsin Highway Research Program by
the Wisconsin Department of Transportation and the Federal Highway Administration
under Project # 0092-01-01. The contents of this report reflect the views of the authors
who are responsible for the facts and the accuracy of the data presented herein. The
contents do not necessarily reflect the official views of the Wisconsin Department of
Transportation or the Federal Highway Administration at the time of publication.
This document is disseminated under the sponsorship of the Department of
Transportation in the interest of information exchange. The United States Government
assumes no liability for its contents or use thereof. This report does not constitute a
standard, specification or regulation.
The United States Government does not endorse products or manufacturers.
Trade and manufacturers’ names appear in this report only because they are considered
essential to the object of the document.

ii
ACKNOWLEDGEMENTS
There are many people who contributed to the completion of this project. Some
of the more important contributors include the members of the Wisconsin Highway
Research Program Flexible Pavement Technical Oversight Committee. Their feedback
and support, especially Tom Brokaw and Judie Ryan are gratefully acknowledged.
The authors gratefully acknowledge the support of the Paar Physica USA Product
manager, Mr. Gerd Langenbucher, and Lab Director, Mr. Eric Brown for their support in
providing the development of DSR testing software.
The authors would also like to thank Ms. Jackie Jiran for her support in finishing
the final version of this report and for her detailed review of the document.

iii
TECHNICAL REPORT DOCUMENTATION PAGE
Report No. WHRP 05-08 2. Government Accession No. 3. Recipients Catalog No. 5. Report Date June 2004
4. Title and Subtitle Development of Guidelines for PG Binder Selection for Wisconsin
6. Performing Organization Code 0092-01-03
7. Author(s) H.U. Bahia, Associate Professor, Kitae Nam, Research Assistant, and Rodrigo Delgadillo, Research Assistant
8. Performing Organization Report No. WHRP 03- 10. Work Unit No. (TRAIS)
9. Performing Organization Name and Address University of Wisconsin – Madison Department of Civil and Environmental Engineering 1415 Engineering Drive Madison, WI 53706-2507
11. Contract or Grant No. WisDOT SPR# 0092-01-01
13. Type of Report and Period Covered Final Report, 200-2003
12. Sponsoring Agency Name and Address Wisconsin Department of Transportation Division of Transportation Infrastructure Development Research Coordination Section 4802 Sheboygan Ave., Box 7065, Madison, WI 53707-7910 14. Sponsoring Agency Code
15. Supplementary Notes 16. Abstract:
In 1997, the Wisconsin DOT made the transition to use PG binders in place of the Penetration and Viscosity graded asphalts that had been historically used. The decision at that time to specify the PG 58-28 as the standard grade for use was based on this grade similarity to the asphalts that had been used previously, the wide availability of the material in the region, and the fact that there was little or no difference in cost. Although this binder grade has been widely used, it is well known that the climatic conditions in the state of Wisconsin vary between the north region and south region of Wisconsin. According to the Superpave binder specification (AASHTO MP1) other grades designed for colder climate need to be used. In fact, before the AASHTO MP1 was implemented, more than one penetration grade was already being used in Wisconsin. In the cold regions of Wisconsin the Pen 200-300 grade was used while in the south the grades of Pen 85-100 and 120-150 were used.
Since the implementation of the Superpave binder specification in 1993 a large number of State Highway Agencies (SHAs) have found critical gaps in the PG grading system. Reviewing the published literature indicates that most of these gaps are somewhat related to the use of modified asphalts and to the fact that the existing PG grading system cannot discriminate between modification technologies, some of which are believed not be successful technologies in terms of adding value to the quality of binders.
Last year (2001) the NCHRP report 459 was published, which focused on offering a revised system for testing and evaluation of asphalt binders using a more mechanistic testing system based on direct measurements of damage behavior of binders. This report is offered to address the implementation of the NCHRP 9-10 proposal and to show how it could be implemented on trial basis using the results of testing of a wide selection of asphalts currently used, or marketed, in the State of Wisconsin. The binders include unmodified and modified of several grades (PG 58-28, PG 64-22, PG 64-34, PG 70-22, PG 70-28, and PG 76-28).
The results of testing using the NCHRP9-10 protocols were used to select binders for specific climate, traffic, and pavement conditions. The existing knowledge of PG grading of the binders was used to derive specification limits that would meet specific climate and traffic conditions. No grade shifting was necessary because all testing is done at actual pavement temperatures and because a more mechanistic approach could be used to meet the traffic volume and speed requirements.
The specification limits are tentative and mainly based on ranking of the PG grading system of the binders included. They serve as a starting point for future field validation and revision. This report is intended to describe the logic in deriving the limits and to offer initial specification limits to move us away from the Superpave plus and offer a logical alternative to compliment the existing PG grading system. 17. Key Words Binder Performance Grading, mixing and compaction temperatures, binder rutting, binder fatigue, damage testing, thermal cracking, glass transition, binder specifications.
18. Distribution Statement No restriction. This document is available to the public through the National Technical Information Service, 5285 Port Royal Road Springfield, VA 22161
19. Security Classif. (of this report) Unclassified
20. Security Classif. (of this page) Unclassified
21. No. of Pages: 97
22. Price
iv
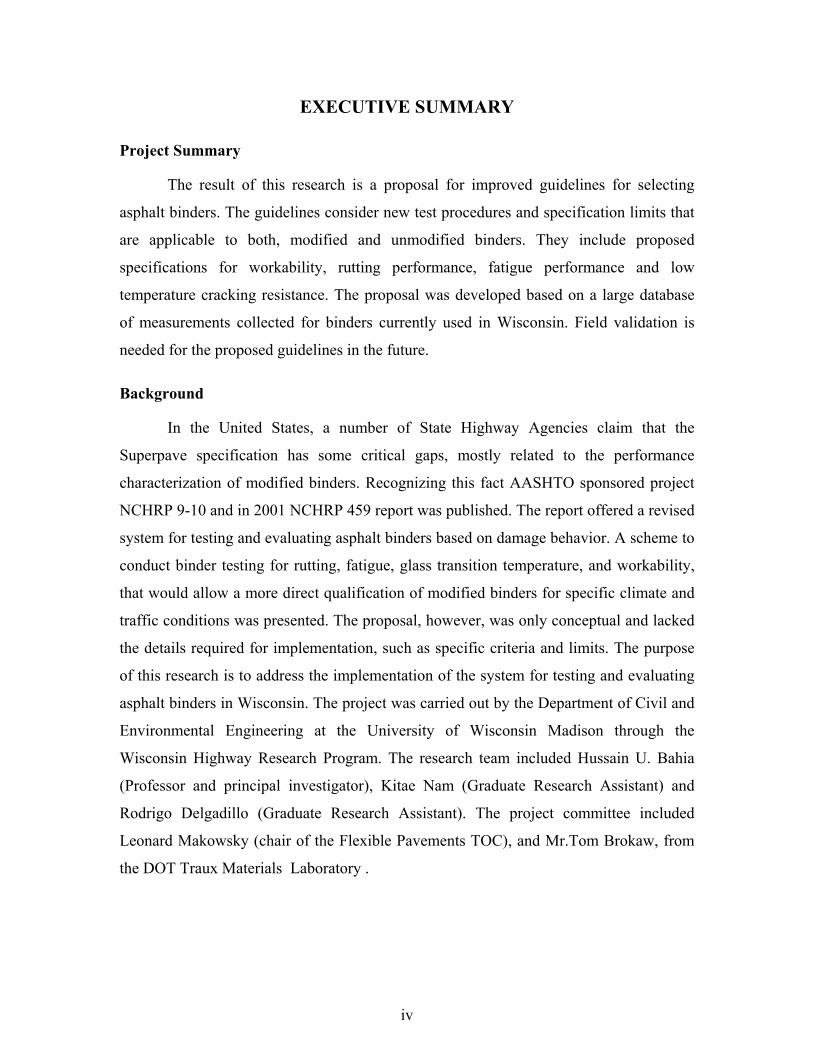
EXECUTIVE SUMMARY
Project Summary
The result of this research is a proposal for improved guidelines for selecting
asphalt binders. The guidelines consider new test procedures and specification limits that
are applicable to both, modified and unmodified binders. They include proposed
specifications for workability, rutting performance, fatigue performance and low
temperature cracking resistance. The proposal was developed based on a large database
of measurements collected for binders currently used in Wisconsin. Field validation is
needed for the proposed guidelines in the future.
Background
In the United States, a number of State Highway Agencies claim that the
Superpave specification has some critical gaps, mostly related to the performance
characterization of modified binders. Recognizing this fact AASHTO sponsored project
NCHRP 9-10 and in 2001 NCHRP 459 report was published. The report offered a revised
system for testing and evaluating asphalt binders based on damage behavior. A scheme to
conduct binder testing for rutting, fatigue, glass transition temperature, and workability,
that would allow a more direct qualification of modified binders for specific climate and
traffic conditions was presented. The proposal, however, was only conceptual and lacked
the details required for implementation, such as specific criteria and limits. The purpose
of this research is to address the implementation of the system for testing and evaluating
asphalt binders in Wisconsin. The project was carried out by the Department of Civil and
Environmental Engineering at the University of Wisconsin Madison through the
Wisconsin Highway Research Program. The research team included Hussain U. Bahia
(Professor and principal investigator), Kitae Nam (Graduate Research Assistant) and
Rodrigo Delgadillo (Graduate Research Assistant). The project committee included
Leonard Makowsky (chair of the Flexible Pavements TOC), and Mr.Tom Brokaw, from
the DOT Traux Materials Laboratory .

v
Process
The study was conducted in three phases. In the first phase, necessary
information as climate, traffic, and types of binders used in Wisconsin were collected.
Also a review of the existing guidelines to select performance-graded (PG) binders for
use in Wisconsin based on pavement temperature conditions, traffic speed, traffic
volume, and pavement structure was conducted. In the second phase, which was a major
part of the project, the laboratory testing was conducted to evaluate the effect of
modification on binders at testing condition that simulate and consider various field
condition, such as pavement and traffic conditions. The testing followed the Superpave
binder testing protocols and their modification as proposed in the NCHRP 9-10 project
report. The binder testing plan included one base asphalt and 18 modified binders. The
testing procedure includes using the DSR for fatigue and rutting evaluation at high and
intermediate temperatures; BBR, DTT, and GTT for the low-temperature cracking
investigation and RV for the workability measurements.
As for the last phase of the project, specification limits that would meet specific
climate and traffic conditions were derived. The limits are proposed as an outset point for
further field validation. The analysis presented in this report includes the comparison of
all tested binders and the development of specifications using the response variables
measured during binder testing. The report is organized in the following chapters:
• Introduction
• Screening Testing and Workability Evaluation
• Fatigue Evaluation
• Rutting Evaluation
• Low-Temperature Analysis
• Summary of Specification Criteria
• Future Study
In each section the various testing procedures, criteria, and equipment that were
used to compare all the tested binders are presented along with the data analysis.

vi
Finding and Conclusions
The results of this project could allow a better characterization of both, modified
and unmodified binders. The proposed testing allows appropriate ranking and selection
of binders based on their performance with respect to fatigue, rutting and low temperature
resistance. It also allows finding the proper conditions for mixing and compaction of
mixtures produced with modified binders, evaluating the presence of particulate
additives, and studying the storage stability of binders. A more detailed explanation of the
findings is provided in the following points:
• For rutting evaluation of binders, traffic speed and traffic volume are considered in
the specification in a more direct way. This allows to change the current procedure
in which those important conditions are taken into account by shifting the high
temperature grade, what is called “grade bumping”. The new proposed binder test
(called creep and recovery) allows to evaluate the elastic recovery of the
deformation which can be significant for modified binders.
• The fatigue evaluation and specifications include the pavement structure, traffic
speed, and traffic volume, as conditions for selecting binders. Also two seasons,
normal season and thaw season, are considered in the specification. The inclusion of
two seasons allows direct evaluation of the influence of the temperature and the loss
of support during the thaw season on the fatigue life of binders.
• The procedure to find the proper mixing compaction temperatures for all modified
and unmodified binders considers shear rate effects. This is major improvement
specially for the very viscous modified binders, where the current procedure
resulted usually in the selection of excessively high working temperatures.
• The results indicate that the Particulate Additive Test (PAT) is a useful method to
evaluate the presence of particulates in modified binders. The PAT test should be
included in future binder specifications used in Wisconsin.
• Recommendations are presented to evaluate the storage stability of binders using a
test called Laboratory Asphalt Stability Test (LAST). This test is complex and
requires a long time. It is, therefore, not recommended to be included in future
vii
specifications. It is, however, recommended that asphalt suppliers perform this test
to evaluate the possible separation of modifier and binder during storage.
• Based on traffic and pavement information gathered a set of binder selection
guidelines were developed. The guidelines include pavement temperatures, traffic
conditions and pavement structure. The results of testing the 19 binders clearly
show that the binders currently used in Wisconsin can fit in these guidelines. The
selection criteria, however, need to be changed to include direct consideration of
these important factors.
Recommendations for Future Action
The results of this research include initial specification limits that could serve as a
base for further field validation. Therefore, the main future action required before the
eventual implementation of these tentative guidelines is field validation. The validation
should be focused on the specifications of binders during actual field service and
workability during construction. For workability, the new mixing and compaction
temperatures should be tried in real projects and the results should be evaluated in terms
of adequate mixing (coating) and proper compaction to obtain the required densities. For
the performance specifications (rutting, fatigue, and low temperature cracking resistance),
field validation should include the selection of projects that cover the widest range
possible of conditions. Samples of binder and mixture should be taken from the project
and tested for the proposed parameters. A follow up of the performance of the projects
for some years should be assured in order to correlate the testing results with the
performance on site.

viii
TABLE OF CONTENTS
DISCLAIMER I
ACKNOWLEDGEMENTS II
TECHNICAL REPORT DOCUMENTATION PAGE III
EXECUTIVE SUMMARY IV
TABLE OF CONTENTS VIII
LIST OF FIGURES X
LIST OF TABLES XI
LIST OF TABLES XI
CHAPTER 1: INTRODUCTION 1 1.1 Background and Problem Statement 1 1.2 Climatic Conditions in Wisconsin 1 1.3 Traffic Information 3 1.4 Review of Binder Selection Guidelines 3
CHAPTER 2: PARTICULATE ADDITIVES, STORAGE STABILITY, AND WORKABILITY 6 2.1 Particulate Additive Test (PAT) 6
Test Results .................................................................................................................................. 7 2.2 Laboratory Asphalt Stability Test (LAST) 8
Test Results .................................................................................................................................. 9 2.3 Workability of Binders 10
Test Results ................................................................................................................................ 11 2.4 Development of Zero Shear Viscosity (ZSV) Guidelines 12 2.5 Summary of Findings for Workability 17
CHAPTER 3: BINDER RUTTING EVALUATION 18 3.1 Background 18 3.2 Problems with the Superpave Rutting Parameter 18
Fully Reversed Load................................................................................................................... 18 Total Energy Dissipated per Loading Cycle............................................................................... 19 Number of Loading Cycles......................................................................................................... 21 Traffic Speed and Volume.......................................................................................................... 21
3.3 A New Binder Parameter for Rutting 22 Cyclic Creep Loading................................................................................................................. 22 Number of Loading Cycles......................................................................................................... 22 Determination of the Viscous Component of the Creep Stiffness Gv ......................................... 24 Traffic Speed and Volume.......................................................................................................... 25
3.4 Testing to Derive Limits for GV 26 Test Information ......................................................................................................................... 26

ix
Summary of Repeated Creep Results ......................................................................................... 26 3.5 Derivation of Specification Criteria 28
Mechanistic Binder Specification Framework............................................................................ 28 Weather and Traffic Information................................................................................................ 28 Deriving Field Conversion Factors............................................................................................. 30
3.6 Proposed Binder Criteria for Rutting 31 3.7 Ranking of Binders 33 3.8 Summary of Findings for Rutting 33
CHAPTER 4: FATIGUE EVALUATION OF BINDERS 35 4.1 Problems with Superpave FATIGUE Parameter 35
Strain Controlled Conditions ...................................................................................................... 35 Dissipated Energy per Loading Cycle (Wi)................................................................................ 36 Numbers of Loading Cycles ....................................................................................................... 36 Pavement Structure..................................................................................................................... 37
4.2 A New Binder Parameter for Fatigue 37 Number of Loading Cycles......................................................................................................... 38 Independence from the Mode of Loading................................................................................... 40 Pavement Structure..................................................................................................................... 41
4.3 Determination of the Number of Cycles to Failure, Np20 41 Fatigue Relationship ................................................................................................................... 42 Energy Input ............................................................................................................................... 42 Testing Temperatures ................................................................................................................. 43 Testing frequencies..................................................................................................................... 44
4.4 Testing to Derive Limits for NP20 44 Test Information ......................................................................................................................... 44 Summary of Binder Fatigue Testing Results .............................................................................. 45
4.5 Computation of Np20 for Each Traffic Speed 48 Fast Traffic Speed....................................................................................................................... 48 Slow Traffic Speed ..................................................................................................................... 49
4.6 Derivation of New Specification Criteria 55 Mechanistic Binder Specification Framework............................................................................ 55 Traffic and Weather Information................................................................................................ 55 Deriving Field Conversion Factors............................................................................................. 56
4.7 Binder Criteria for Fatigue and Ranking of Binders 61 4.8 Proposed Binder Specifications for Fatigue 64 4.9 Summary of Findings for the Binder Fatigue Study 65
CHAPTER 5: LOW-TEMPERATURE CRACKING 66 5.1 Background 66 5.2 Theory and Experimental Plan 66 5.3 Test Results 69 5.4 Construction of Binder Selection Criterion for Low-Temperature Cracking 73
CHAPTER 6: SUMMARY OF FINDINGS AND RECOMMENDED FUTURE WORK 76 6.1 Summary of Findings 76 6.2 Recommended Future Work 78
APPENDIX I: LAST TEST RESULTS 80
APPENDIX II: TEST PLANS FOR FIELD VALIDATION 84

x
LIST OF FIGURES
Figure 1.1 Wisconsin 98% Confidence Interval Map 2
Figure 1.2 PG Binder Selection Criteria (WisDOT 02/2000) 5
Figure 2.1 Estimated Compaction Temperatures Using a HSV of 280 cP 12
Figure 2.2 Estimated Compaction Temperatures Using a ZSV of 6.0 Pas 13
Figure 2.3 Comparison Between HSV=280 cP, ZSV=6000 cP, and ZSV=3000 cP 14
Figure 3.1 Permanent Deformation of the Binder, Fully Reversed Loading 19
Figure 3.2 Recovering Capacity of Binders under Creep Testing 21
Figure 3.3 Loading Pattern and Binder Strain under Repeated Creep Test 23
Figure 3.4 Behavior of Binders of same PG grade Under Repeated Creep Loading 24
Figure 3.5 Gv v/s Allowable ESALs, Original Binder, High Traffic Speed 31
Figure 4.1 G* vs. Loading Cycles for Strain Controlled Testing 37
Figure 4.2 Variation in the DER for Stress Controlled Testing 39
Figure 4.3 Variation in the DER for Strain Controlled Testing 40
Figure 4.4 Fatigue life versus Stress Level Used in Testing 41
Figure 4.5 Amplitude Sweep Test Data Plot for Typical Binder and Np20 vs. Wi 43
Figure 4.6 Np20 versus Allowable ESALs, Average Pavement Structure 61
Figure 5.1 Failure Stress and Strain Data and Master Curves for C5 Binder 67
Figure 5.2 Glass Transition Measurement of C5 Binder 68
Figure 5.3 Estimated Cracking Temperatures Sorted by Criteria 70
Figure 5.4 Comparison between the PG grades 71
Figure 5.5 Linear Relationships between Critical Temperature and PG Grade 74

xi
LIST OF TABLES
Table 2.1 Summary of the PAT tests 8
Table 2.2: The Result of the LAST Tests for C5 Binder 10
Table 2.3 Results of the ZSV Tests 15
Table 3.1 Measured Gv Values at 58oC and 1.0 Second Loading Time 27
Table 3.2 Example of a Mechanistic Binder Specification Framework for Rutting 29
Table 3.3 Traffic Levels and Applicable PG Grades for High Traffic Speed 29
Table 3.4 Proposed Binder Rutting Criteria and Ranking of Binders 32
Table 3.5 Tentative Specifications for Rutting 32
Table 4.1. Results of Fatigue Tests at 6°C and 15°C (part II) 47
Table 4.2 Selected Wi Values for Strong and Weak Structure, Fast Traffic 49
Table 4.3 Wi Values for Slow Traffic 50
Table 4.4 Selected Wi Values for Strong and Weak Structure, Slow Traffic 52
Table 4.5 Estimated Np20 Values for Fast and Slow Traffic (Part I) 53
Table 4.6 Example of a Mechanistic Binder Specification Framework for Fatigue 55
Table 4.7 Np20 Values for Average Pavement Structure 59
Table 4.8 Grouping of Binders and Traffic Levels for Fatigue Field Factors 60
Table 4.9 Np20 Values for Each Binder Group and Temperature 60
Table 4.10 Binder Criterion for Fatigue and Ranking of Binders 63
Table 4.11 Proposed Specifications for Fatigue Performance of Binders 64
Table 5.1 Results of the Low-Temperature Cracking Tests 69
Table 5.2 Summary of Glass Transition Measurements 72
Table 5.3 Applicability of Tested Binders for Low-Temperature Cracking 75

1
CHAPTER 1: INTRODUCTION
1.1 Background and Problem Statement
The Wisconsin Department of Transportation implemented the AASHTO MP1
binder specification for Performance graded (PG) binders in 1997. At that time the DOT
technologists decided implementing the standard by selecting one binder grade (PG 58-
28) as the standard grade for use throughout the state. The decision was based on
similarity to asphalts used previously and the wide availability of the material in the
region. This binder grade had resulted in pavements that performed relatively well for the
past two years.
The PG grading system is designed to allow selecting different grades based on
the extreme temperatures, traffic volume, and traffic speeds. To fully implement
AASHTO MP1 and to make use of the grade system, guidelines for selecting the PG
grade based on local climate, traffic conditions, and pavement structure are needed.
This important advantage of this system was not being used in the system of one
PG grade in Wisconsin. After a few years of successful transition into the PG system, the
DOT developed a more detailed system for selecting the grade based on climate and
pavement conditions.
1.2 Climatic Conditions in Wisconsin
It is well recognized that there is more than one climatic region in Wisconsin that
requires more than the PG58-28 grade. In particular it is know that he low temperature
range varies significantly and required more grades for pavement temperatures lower than
(-28). Figure 1.1, developed by Mr. Gerald Reinke of MTE in Wisconsin, shows three
different climate regions in Wisconsin. These regions are divided by their cold
temperatures.
As can be seen, three PG binders are needed in accordance with the cold
temperatures of the regions. These binders are PG 58-28, PG 58-34, and PG 58-40. As a
standard grade binder, PG 58-28 binder is used southeast areas of Wisconsin, PG 58-34

2
for most of southwest and central areas of the state, and PG 58-40 for the rest of the
regions, mostly northern parts of Wisconsin.
In addition to the cold temperature regions, it appears that there are two hot
temperature regions in this map that accept two PG binders; PG 52-xx and PG 58-xx.
However, since a PG 58 grade would cover most areas of Wisconsin, using a single high
PG grade (PG 58-xx) is expected to reduce complexity of selecting binders.
As discussed earlier, pavement temperature is only one factor in selecting
performance grading. Traffic volume and speed is the second level of selection.
Figure 1.1 Wisconsin 98% Confidence Interval Map Based on Nov 1997 Revision of Pavement Temperature Algorithm

3
1.3 Traffic Information
It is essential to consider traffic condition for binder selection. Thus recent traffic
data and information for Wisconsin have been collected in a form of a map based on
information from the WisDOT Division of Transportation Investment Management, the
U.S. DOT, and the Federal Highway Administration. In this map, the traffic information
is based on data collected by the ATR (Automatic Traffic Recorder) recorded at stations
spread throughout the state of Wisconsin. The data are shown in terms of AADT (Annual
Average Daily Traffic) and is estimated from documents published in 1999 by WisDOT.
The data were sorted into several necessary categories such that it can be effectively used
to select the grade of binder based on traffic information. For example, each county
throughout the state is assigned certain levels of traffic volume that will eventually be
combined with pavement temperature information to specify required binder. Based on
this approach, a county may include several different binder grades due to different levels
of traffic volume.
This is not a completely new concept; WisDOT has published in 2002 a tentative
PG Binder Selection Criteria, as shown in Figure 1.2. The selection guideline was
developed to account for the effects of layer position, traffic speed and traffic volume
based on grade shifting. This research has been intended to revise these criteria. The
revision includes advanced methods of evaluating modified binders and will include
specific procedures for considering such conditions as mentioned earlier just rather than
grade shifting. It is expected that the final results of this research will allow shifting the
criteria towards direct evaluation of traffic speed and volume rather than grade shifting
based on specific guidelines.
1.4 Review of Binder Selection Guidelines
The tentative PG Binder Selection Criteria shown in Figure 1.2 suggests using
more than one PG grade binder such as PG 64-28, PG 64-22, and PG 70-28 according to
traffic conditions and pavement layer. For example, PG 64-28 is recommended for the
areas of increased turning, stopping, parking movements, intersection of highways, or
high traffic volume. Just as this PG binder is recommended for new base layers, so PG

4
64-22 binder is suggested for overlay use. PG 70-28 binder is only for areas of high
traffic (more than 10 million ESALs).
Although different grades of binders rather than one standard binder are
recommended in these criteria, recent research shows that grade shifting could be
misleading because it is requiring testing at artificially high temperatures that pavements
will not experience. For example using a PG 76 grade, tested at 76 C is not the best
procedure because pavement will not experience the 76 C at any time. It is this better to
continue testing at pavement design temperature, 58C for Wisconsin and use other more
scientific methods to account for traffic volume, traffic speed, and pavement structure.
Modification of asphalts, when such a system is used, will focus on improving
resistance to traffic volume or speed rather than on meeting an artificially high
temperature requirement.
In the following sections, the details of the testing methods and the collected data
and analysis are presented to confirm the idea of using standard PG binders in Wisconsin
with a different method for accounting for traffic volume and speed.

5
Figure 1.2 PG Binder Selection Criteria (WisDOT 02/2000)
PG Binder Selection Criteria Wisconsin Department of Transportation
(02/21/2000)
I. Upper Layers: A. Rural Projects: (for ≥ 4 mill ESALs see high traffic volume)
1. New Base: PG 58-28 2. Overlay: PG 58-28
B. Urban Projects & Sections: (area of increased turning, stopping, or parking
movements; waysides, parking lots) 1. New Base: PG 64-28 2. Overlay: PG 64-22
C. Stop Condition Intersections: (i.e. intersection of 2 US highways with
turning movements) 1. New Base: PG 64-28 2. Overlay: PG 64-22
D. High Traffic Volume:
1. Sustained Speed < 55 mph a) ≥ 4 million ESALs: PG 64-28 b) ≥ 10 million ESALs: PG 70-28
2. Sustained Speed > 55 mph a) ≥ 10 million ESALs: PG 64-28
II. Lower Layer: A. PG 58-28: normal B. PG 64-22: if matches upper layer
Notes: Prepared by Wisconsin Department of Transportation, Bureau of Highway Construction, Quality Management Section, Thomas F. Brokaw, Asphalt, Aggregate, & Soils Engineer
1. All ESAL designations are 20 year design life values. 2. Use only 2 different PG grades per project. 3. If you have any questions about these guidelines or their application,
please contact: Thomas F. Brokaw, Asphalt, Aggregate & Soils Engineer Quality Management Section DTID, Bureau of Highway Construction

6
CHAPTER 2: PARTICULATE ADDITIVES, STORAGE STABILITY, AND WORKABILITY
In the NCHRP 9-10 project it was concluded that there is a need for screening
tests that evaluate presence of particulate additives, evaluate storage stability, and to
estimate workability of binders for mixing and compaction. In this project, the type and
amount of additive used in modification was measured using the PAT test. The
Laboratory Storage Stability Test (LAST) was used for measuring the storage stability.
The procedure recommended for estimating the Zero Shear Viscosity using the Rotational
Viscometer was used to estimate the workability. The results were summarized and the
main findings are discussed in the following sections.
2.1 Particulate Additive Test (PAT)
One of the alternatives to using microscopy to determine the nature of the asphalt
additives is separation of the additive from asphalt. With separation, the general type of
the additive and its characteristics can be determined. In a PAT, a diluted solution of the
asphalt binder is passed through a sieve to separate particulate additives from the base
asphalt. Particulate additives can result in potential separation or in interference with test
sample geometry. In the current standard Superpave binder test methods, the particulate
size is limited to 250 µm, selected arbitrarily as one-fourth (1/4) of the minimum testing
sample dimension. The PAT separates material larger than 75µm using a No. 200 (0.075-
mm) mesh. This size was selected because larger-size particulates are commonly
considered part of the mineral aggregates in the asphalt mixture.
In the test, the asphalt binder is heated to 135°C until it becomes soft enough to
pour. Approximately 10 ml of sample is transferred into a 125-ml Erlenmeyer flask.
While hot, the sample is diluted using 100ml of solvent in small portions with continuous
agitation until all lumps disappear and no undissolved sample adheres to the container. A
metal, 50-mm diameter, No. 200 sieve disk is placed in the vacuum filtering apparatus,
and the vacuum filtration is started. The container is washed with small amounts of
solvent to facilitate filtering. Filtration is continued until the filtrate is substantially
colorless. Then suction is applied to remove the remaining distillate. The material

7
retained on the filtering sieve is transferred to a centrifuge tube, and the volume is
measured partially filled with the solvent. The tube is placed in a centrifuge apparatus for
30 min at approximately 3,000 rotations per minute (rpm). At the end of the
centrifugation, the volume of material at the bottom of the tube is measured to the nearest
0.01 ml. Using the final volume of particulates and the initial volume of sample, the
percentage of compacted volume of the particulates retained on a No. 200 sieve by
volume of the asphalt is calculated. The conditions used for the protocol were selected
based on several experiments. The criteria used in interpretation of the PAT results are as
follows:
• The test is conducted by using n-Octane as a solvent to determine the existence of
an additive. If the test indicates that there is less than 2% by volume of material
separated, the binder does not contain any additive. If the test indicates that there is
more than 2%, the test should be repeated with toluene.
• The test is conducted by using toluene as a solvent. If the volume retained is more
than 2%, the binder is not a simple binder due to existence of solid additives that are
not likely to be soluble in asphalt.
Test Results
Table 2.1 gives results collected using the PAT for a selected grades modified
with different additives. As can be seen, the highly modified binders such as B3 and B6
show significant amount of particular additives. These two binders have the high
temperature of PG grade (PG 76-xx). In case of C6 (the binder of the same high PG
grade), however, there is not much additive found after testing unlike B3 and B6.
Although these two binders, B3 and B6, contain significant amount of solid additives
beyond the maximum of the given criteria, the additional tests using Toluene show that
these additives are soluble in Toluene and thus are dispersible in asphalt. None of the
other binders show considerable particulate additives. The results shown indicate that the
PAT test is an acceptable procedure that could be used to detect particulates. It also
indicates that the binders used in Wisconsin do not contain high level of particulates.
Those that contain a significant amount that is not soluble in octane, they are soluble in
toluene and thus are mostly soluble or dispersible in asphalt. Since the effect of solid

8
additives needs to be considered, it is recommended that the PAT test is used as a
screening test in future specifications for asphalts in Wisconsin.
Table 2.1 Summary of the PAT tests
Solvent Binder (Code) PG Grade
n-octane (%) Toluene (%) C5 PG 58-28 0.30 0.00 B3 PG 76-28 39.0 0.00 A3 PG 64-28 0.67 0.00 B2 PG 64-28 1.33 0.00 D1 PG 64-28 1.00 0.00 C4 PG 64-22 0.67 0.00 B5 PG 64-34 1.33 0.00 D2 PG 64-34 1.32 0.00 B8 PG 70-34 2.00 0.00 A1 PG 70-28 1.00 0.00 B4 PG 70-28 1.33 0.00 C2 PG 70-28 0.30 0.00 B6 PG 76-34 43.0 0.00 B7 PG 58-40 2.00 0.00 B9 PG 58-34 1.33 0.00 D4 PG 58-34 1.00 0.00 C6 PG 76-28 0.03 0.00 D5 PG 64-40 1.00 0.00 D6 PG 70-34 1.30 0.00
2.2 Laboratory Asphalt Stability Test (LAST)
The general requirements for a new test to evaluate the storage stability of
modified asphalts were selected based on the review of research done in the past and on
an evaluation of typical storage tanks and conditions used to store such asphalts in the
field. If additives are detected in the binder based on the results of the PAT, it is required
to evaluate the storage stability of these additives using the Laboratory Asphalt Stability
Test (LAST). The values of maximum ratio of separation (Rs) and maximum ratio of
degradation (Rd) are determined to describe the potential for storage instability. If any of
the ratio is more than 120% or less than 80% at the critical separation time (Tsc) or critical
degradation time (Tdc), the binder is not stable and is considered complex.
In this test two steps are required to evaluate the stability under two storage
conditions: static and high agitation.
9
• Static Storage: Sample is kept at isothermal conditions with no thermal gradient and
sampled at 0, 6, 12, and 24 hours.
• High Agitation Storage: Sample is kept at isothermal conditions, with high agitation
speed, and sampled at 0, 6, 12, and 24 hours.
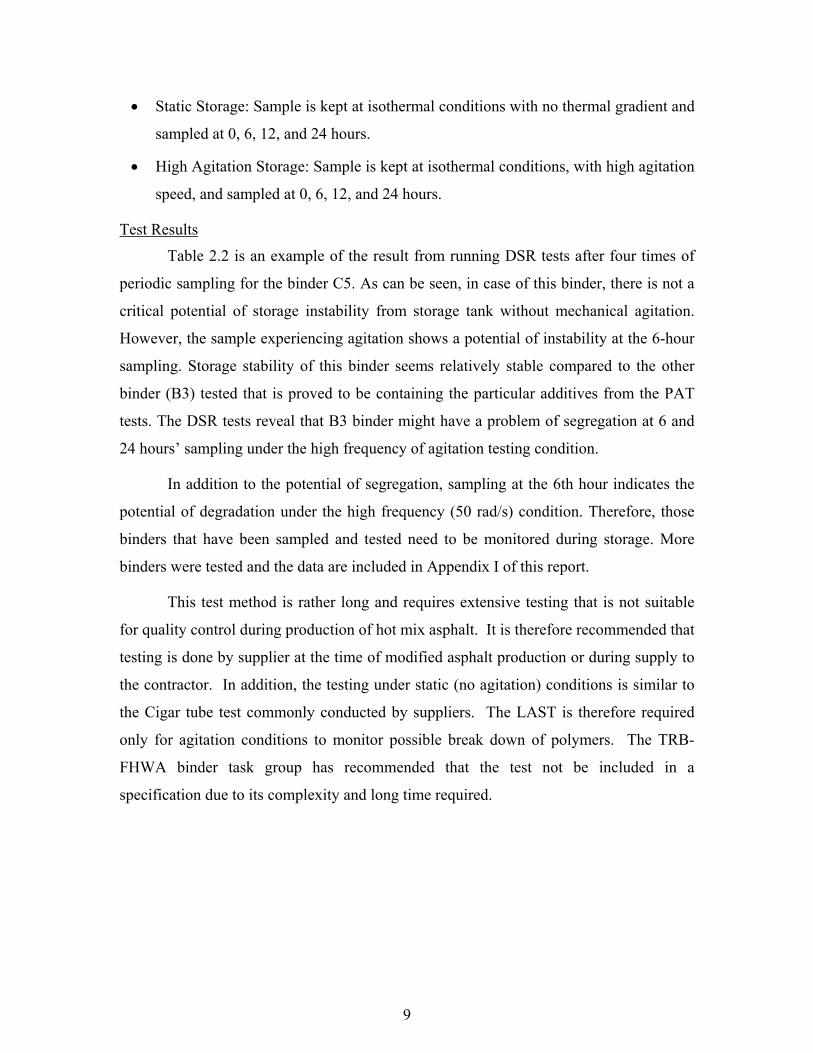
Test Results
Table 2.2 is an example of the result from running DSR tests after four times of
periodic sampling for the binder C5. As can be seen, in case of this binder, there is not a
critical potential of storage instability from storage tank without mechanical agitation.
However, the sample experiencing agitation shows a potential of instability at the 6-hour
sampling. Storage stability of this binder seems relatively stable compared to the other
binder (B3) tested that is proved to be containing the particular additives from the PAT
tests. The DSR tests reveal that B3 binder might have a problem of segregation at 6 and
24 hours’ sampling under the high frequency of agitation testing condition.
In addition to the potential of segregation, sampling at the 6th hour indicates the
potential of degradation under the high frequency (50 rad/s) condition. Therefore, those
binders that have been sampled and tested need to be monitored during storage. More
binders were tested and the data are included in Appendix I of this report.
This test method is rather long and requires extensive testing that is not suitable
for quality control during production of hot mix asphalt. It is therefore recommended that
testing is done by supplier at the time of modified asphalt production or during supply to
the contractor. In addition, the testing under static (no agitation) conditions is similar to
the Cigar tube test commonly conducted by suppliers. The LAST is therefore required
only for agitation conditions to monitor possible break down of polymers. The TRB-
FHWA binder task group has recommended that the test not be included in a
specification due to its complexity and long time required.

10
Table 2.2 The Result of the LAST Tests for C5 Binder
Conditioning Step
External Heat without Agitation
Frequency (rad/s)
5.0 50.0 5.0 50.0
Temperature ©
HT HT IT IT
Time of Sampling (hr)
G* delta G* delta G* delta G* delta
0 (top) 1,200 86.3 10,500 82.1 1,240,000 58.3 12,500,000 35.5 0 (bot) 1,300 85.9 11,200 81.6 1,240,000 57.2 11,200,000 34.9 6 (top) 1,360 86.1 11,800 81.8 1,320,000 57.0 13,300,000 34.3 6 (bot) 1,190 86.4 10,400 82.2 1,200,000 58.7 12,200,000 36.0 12 (top) 1,310 86.2 11,400 81.9 1,370,000 57.2 15,100,000 34.0 12 (bot) 1,190 86.4 10,400 82.2 1,210,000 58.8 12,500,000 35.7 24 (top) 1,160 86.4 10,100 82.2 1,080,000 59.8 10,200,000 37.4 24 (bot) 1,310 86.2 11,400 81.8 1,280,000 56.9 11,500,000 34.0 Time of
Sampling (hr) Rs G* Rs d Rs G* Rs d Rs G* Rs d Rs G* Rs d
0 0.92 1.00 0.94 1.01 1.00 1.02 1.12 1.02 6 1.14 1.00 1.13 1.00 1.10 0.97 1.09 0.95 12 1.10 1.00 1.10 1.00 1.13 0.97 1.21 0.95 24 0.89 1.00 0.89 1.00 0.84 1.05 0.89 1.10
Time of Sampling (hr)
Rd G* Rd d Rd G* Rd d Rd G* Rd d Rd G* Rd d
0 1.04 1.00 1.03 1.00 1.00 0.99 0.95 0.99 6 1.06 1.00 1.06 1.00 1.02 0.99 1.02 0.99 12 1.04 1.00 1.04 1.00 1.04 0.99 1.10 0.98 24 1.03 1.00 1.02 1.00 0.95 1.00 0.87 1.01
2.3 Workability of Binders
The need for reasonable temperatures for mixing and compaction is well
recognized because safety and volatilization of binders are both impacted by high
temperatures. The cost of energy for heating is another adverse impact of high
temperatures. Viscosity is known to increase logarithmically with reduced temperature.
The most commonly used method of plotting a viscosity-temperature profile is according
to the ASTM standard method D2493. In this method the log-log of viscosity is plotted as
a function of log temperature in degrees Kelvin (273+°C). For most asphalts, this
relationship is linear and the Viscosity Temperature Susceptibility (VTS) index can be
calculated as the slope of this relationship. The viscosity-temperature profile can,
however, be considered truly valid only for asphalts whose viscosity is independent of the

11
shear rate, a behavior described as Newtonian flow. For the majority of modified
asphalts, and some high PG grade unmodified asphalts, viscosity is highly dependent on
shear rate. It is believed that this shear dependency is what causes the difficulty of
compaction of mixtures with modified binders.
In the current binder specification, there is no control on the binder’s viscosity at
the mixing and compaction temperatures typically used in the laboratory or in the field.
There is a limit on viscosity at 135 C, which is considered as temperature for handling
(pumping) but not for mixing and compaction. In the mixture design procedure the
current guideline for using the high shear viscosity (6.8 1/s, 20 RPM) of 170 cP for
mixing temperature and 280 cP for the compaction temperature. These requirements were
evaluated in this project together with a new procedure of using low shear viscosity as
discussed in the next section.
Test Results
The rotational viscometer was used to conduct the standard 20 rpm viscosity
testing at three temperatures for each of the binders. The viscosity-temperature plots were
used as described in the previous section to estimate the temperatures at which each
binder achieves 170 cP and 280 cP.
Figure 2.1 shows the estimated compaction temperatures of all the tested binders
using this guideline. Considering the reasonable limit of the compaction temperature of
150C, most of the binders are over this limit. Some of the binders show significantly
unrealistic compaction temperatures which are over 200C.
In the NCHRP 9-10 project the concept of using the low shear viscosity, or zero
shear viscosity (ZSV) was introduced due to the fact that most modified binders show
much higher viscosities at lower shear rates. Low shear viscosity is found to be a better
indicator of conditions during mixing and compaction and thus to insure proper coating
and compaction, a maximum limit should be placed on the binder’s low shear viscosity
rather than the viscosity at 20 rpm.
The Zero Shear Viscosity (ZSV) is determined by using Brookfield Viscometer.
The data from the viscometer are obtained by testing the binder at three temperatures:
105, 135, and 165°C, and at a series of different shear rates for each temperature. The

12
testing is always done at increasing temperatures and shear rates. The shear rates range
from 0.47 1/s to 93 1/s. The data are entered in an Excel spreadsheet and the solver
program is used to arrive at the zero shear viscosity at each of the tested temperatures,
using a fitting program. The log2 of the zero shear viscosities is plotted against the log of
the temperature in degrees Kelvin.
100
120
140
160
180
200
220
240
260
PG 58-28
PG 58-34
PG 58-40
PG 64-22
PG 64-28
PG 64-28
PG 64-28
PG 64-34
PG 64-34
PG 64-40
PG 70-28
PG 70-28
PG 70-28
PG 70-28
PG 76-28
PG 76-28
PG 76-34
Binder PG Grade
Tem
pera
ture
(C)
Mixing Temp. @ HSV of 170 cps, C
Compaction Temp. @ HSV of 280 cps, C
Compaction Temp. Limit
Figure 2.1 Estimated Compaction Temperatures Using a HSV of 280 cP
2.4 Development of Zero Shear Viscosity (ZSV) Guidelines
In the beginning of the study, the research team proposed the temperatures
corresponding to a ZSV of 6.0 Pas and 3.0 Pas for compaction and mixing temperatures,
respectively. However, this temperature selection guide created another disputable issue;
after evaluating this criterion along with several other research institutes, it was
questioned whether the estimated temperatures are applicable to the field mixing and

13
compaction as shown in Figure 2.2. This Figure is the summary of all tested binders’
mixing and compaction temperatures corresponding to a ZSV of 6.0 Pas and 3.0 Pas and
most of the binders in this figure show relatively low compaction temperatures below the
commonly used temperature of 150C. There is only one binder over this limit. Since the
most modified binders require high mixing and compaction temperatures, the
temperatures using this criterion seem to be underestimated.
100
110
120
130
140
150
160
170
180
PG 58-28
PG 58-34
PG 58-40
PG 64-22
PG 64-28
PG 64-28
PG 64-28
PG 64-34
PG 64-34
PG 64-40
PG 70-28
PG 70-28
PG 70-28
PG 70-28
PG 76-28
PG 76-28
PG 76-34
Binder PG Grade
Tem
pera
ture
(C)
Mixing Temp @ ZSV of 3000 cP, C
Compaction Temp @ ZSV of 6000 cP, C
Compaction Temp. Limit
Figure 2.2 Estimated Compaction Temperatures Using a ZSV of 6.0 Pas
In addition, under this criterion of a ZSV of 3.0 Pas coating of aggregates with
some binders has been reported to be difficult. In order to solve this problem, two
methods could be suggested; one is to lower the limit of a ZSV from 6.0 Pas to 3.0 Pas
and the other is to increase the asphalt content. Because increasing the asphalt content
could be a concern, changing the limit of a ZSV has been evaluated. Figure 2.3 compares
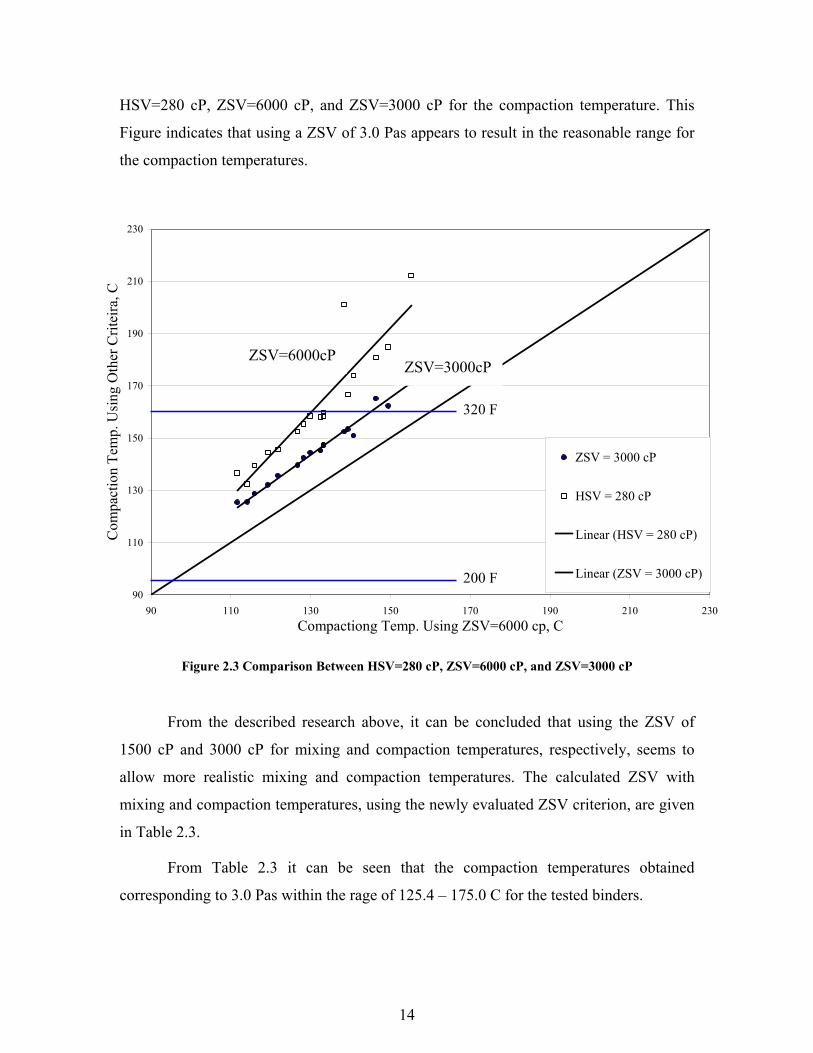
14
HSV=280 cP, ZSV=6000 cP, and ZSV=3000 cP for the compaction temperature. This
Figure indicates that using a ZSV of 3.0 Pas appears to result in the reasonable range for
the compaction temperatures.
90
110
130
150
170
190
210
230
90 110 130 150 170 190 210 230Compactiong Temp. Using ZSV=6000 cp, C
Com
pact
ion
Tem
p. U
sing
Oth
er C
ritei
ra, C
ZSV = 3000 cP
HSV = 280 cP
Linear (HSV = 280 cP)
Linear (ZSV = 3000 cP)
320 F
200 F
Figure 2.3 Comparison Between HSV=280 cP, ZSV=6000 cP, and ZSV=3000 cP
From the described research above, it can be concluded that using the ZSV of
1500 cP and 3000 cP for mixing and compaction temperatures, respectively, seems to
allow more realistic mixing and compaction temperatures. The calculated ZSV with
mixing and compaction temperatures, using the newly evaluated ZSV criterion, are given
in Table 2.3.
From Table 2.3 it can be seen that the compaction temperatures obtained
corresponding to 3.0 Pas within the rage of 125.4 – 175.0 C for the tested binders.
ZSV=3000cPZSV=6000cP

15
Table 2.3 Results of the ZSV Tests
Binder ID PG Grade Testing Temp C
η0= (ZSV)
��= (HSV)
Mix. Tº C ZSV 1500 cP
Comp. Tº C ZSV 3000 cP
Mix. Tº HSV 170 cP
Comp. Tº HSV 280 cP
C5 PG 58-28 165 455 75 138.5 125.6 143.4 132.5 135 1803 243 105 10988 1345
D4 PG 58-34 165 626 98 141.0 125.4 148.9 136.6 135 1800 288 105 9002 1452
B7 PG 58-40 165 700 121 146.5 132.1 156.2 144.5 135 2501 443 105 14821 2601
C4 PG 64-22 165 626 98 143.2 128.7 150.8 139.5 135 2070 348 105 11988 2007
A3 PG 64-28 165 1205 199 158.5 142.4 168.6 155.4 135 3902 652 105 23963 4068
B2 PG 64-28 165 925 167 154.1 139.6 164.5 152.5 135 3936 650 105 23146 4408
D1 PG 64-28 165 843 135 151.2 135.6 158.1 145.6 135 3345 433 105 14996 2458
B5 PG 64-34 165 1418 225 163.3 147.3 172.4 159.7 135 5328 900 105 31752 5955
D2 PG 64-34 165 1320 223 160.8 144.4 172.2 158.4 135 4301 739 105 25727 4289
D5 PG 64-40 165 1530 768 168.3 152.5 223.3 201.2 135 9487 1985 105 39131 7769
B8 PG 70-28 165 1799 297 169.3 153.4 179.7 166.7 135 7500 1292 105 48407 8847
B4 PG 70-28 165 208.9 1190 159.4 145.2 170.1 158.1 135 876.8 4992 105 6400.1 38003
A1 PG 70-28 165 4223 904 197.6 175 237.1 212.2 135 13522 2345 105 11988 2007
C2 PG 70-28 165 1477 223 163.5 147.4 170.2 158.5 135 4954 810 105 33110 8150
C6 PG 76-28 165 2623 582 176.9 162.3 200.3 184.8 135 14390 2319 105
B3 PG 76-28 165 1180 412 162.2 150.9 186.8 174.0 135 11192 2057 105 126810 17852
B6 PG 76-34 165 3150 565 186.7 165.2 193.9 180.8 135 8641 2820 105 41303 28080

16
Figure 2.4 summarizes all estimated mixing and compaction temperatures. It
appears that most binders have the reasonable compaction temperatures that can be
achieved easily in the field without the binders’ experiencing thermal degradation. For
some binders that have high compaction and mixing temperatures, relatively high
temperatures both for mixing and compaction may be necessary in order to get enough
workability before using the binder. It appears that A1, B6, and C6 are binders that could
result in difficult mixing and compaction conditions. It is believed that these high
temperatures are necessary because of their modification type that results in stiffer
binders at high temperatures.
100
110
120
130
140
150
160
170
180
190
200
PG 58-28
PG 58-34
PG 58-40
PG 64-22
PG 64-28
PG 64-28
PG 64-28
PG 64-34
PG 64-34
PG 64-40
PG 70-28
PG 70-28
PG 70-28
PG 70-28
PG 76-28
PG 76-28
PG 76-34
Binder PG Grade
Tem
pera
ture
(C)
Mixing Temp @ ZSV of 1500 cP, C
Compaction Temp @ ZSV of 3000 cP, C
Max. Compaction Temp.
Max. Mixing Temp.
Figure 2.4 Mixing and Compaction Temperatures using ZSV of 3.0 and 1.5 Pas
Although intuitively, as high temperatures of the PG grade increase, both mixing
and compaction temperatures increase as well, the data in Figure 2.4 show that this is not
always the case. The data also show that within the same grade, a certain modifier can

17
significantly affect such temperatures. For example, A1 whose grade is PG 70-28 has
relatively high mixing and compaction temperatures even compared to the same PG
grade binders such as B4 and C2. This binder (A1) shows a 20 - 30°C higher mixing and
compaction temperature compared to the B4 and C2 binders.
2.5 Summary of Findings for Workability
Some of the important observations regarding the viscosity data are as follows:
• As expected, the non-modified binder, C5 (PG 58-28), shows relatively low mixing
and compaction temperatures compared to all other modified binders except D4
(PG 58-34, SB modified).
• It appears that C5 (PG 58-28, non-modified) maintains the lowest zero shear
viscosity at all temperatures while the A1 (PG 70-28, SBS modified) shows the
highest viscosity. The B5 and D2 show a medium level of viscosity values.
• Using the ZSV target value of 6000 cps, the binders could be compacted at
temperatures ranging between 111.6 C for D4 (PG 58-34, SB modified) and 155.1
C for A1 (PG 70-28, SBS modified).
• Within the same PG grades, there appears to be a significant difference in mixing
and compaction temperatures. These differences are believed to be due to using
different modifiers.
• Using the ZSV of 1500 cP and 3000 cP for mixing and compaction temperatures,
respectively, seems to allow a more realistic estimation.

18
CHAPTER 3: BINDER RUTTING EVALUATION
3.1 Background
The findings of the NCHRP report 459 point out why the Superpave system fails
to discriminate between the modification technologies that are successful and those which
do not add value to the quality of binders. With respect to rutting resistance, the use of the
total dissipated energy concept in deriving the G*/sinδ, using cyclic reversible loading
does not allow useful derivation of energy truly dissipated in permanent deformation. The
repeated creep testing using the DSR was proposed in the NCHRP 9-10 project to
measure binder response under cyclic non-reversible loading, which more accurately
represents traffic loading conditions in the field. The test also allows separating energy
dissipated in actual damage in terms of viscous - permanent flow from energy dissipated
in delayed visco-elastic response, or what is called damping. The following sections
include detailed analysis of the problems with applying the G*/sind to modified binders
and the benefit of using the new repeated creep test. The chapter also includes the results
collected for the binders of this study and a proposed grading system that could be used
in a future specifications.
3.2 Problems with the Superpave Rutting Parameter
The main problems with the current Superpave specification parameter for rutting
(G*/sin δ) could be divided in 4 areas: (a) the kind of load used in testing (fully reversed),
(b) the characteristics of the binder rutting parameter (based on total dissipated energy),
(c) the number of cycles for testing (only few cycles of loading are used), and (d) the
grade shifting for traffic speed and volume.
Fully Reversed Load
The fully reversed load applied currently in the DSR binder testing is not
simulating in an appropriate way the mechanism in which rutting occurs in the pavement.
The load that causes rutting in the real pavement is not fully reversed and is believed to
be starting from zero rising to a maximum and returning to zero.

19
More important, fully reverse loading does not allow direct separation of energy
dissipated in viscous flow and energy that is spent temporarily (rather than dissipated) in
delayed elasticity (damping). The permanent deformation of the binder, which is the only
contributor to rutting of asphalt mixtures, is represented by only the viscous component
of the deformation when loaded. Figure 3.1 is prepared to clearly explain this important
concept. In part (a), when the load applied is fully reversed, the permanent deformation is
overcame and erased or included as part of the total strain making it very difficult to
separate from delayed elasticity. In part (b), when one directional load is applied, the
permanent strain can be easily separated from the elastic and delayed elastic strain.
Figure 3.1 Permanent Deformation of the Binder under Unidirectional and Fully Reversed Loading
Total Energy Dissipated per Loading Cycle
The Superpave parameter is intended to control rutting by controlling the total
energy dissipated per cycle (Wi). The formula for the calculation Wi in a constant stress
testing is given by equation 1.
Load
Time
Strain
Time
Viscous (Permanent)
Elastic + Delayed Elastic (Recoverable)
b)
Load
Strain
Time
a)
Time

20
*sin2
0 GWi
δτπ ⋅⋅= ; eq.1
where: Wi = total energy dissipated in cycle i
τ0 = maximum stress applied
G* = complex modulus
δ = phase angle
Higher values of G*/sinδ will result in lower Wi which is expected to result in
less rutting. The relationship between Wi and the permanent deformation of the binder
was validated under the SHRP research program for conventional binders. However, this
relationship does not appear to be appropriate for modified binders. The problem with
this concept is the fact that Wi can be divided into three components: elastic, delayed
elastic and viscoelastic, as shown in equation 2.
Wi = Welastic + Wdelayed elastic + Wviscous eq.2
The part of the energy that contributes to permanent deformation is only the
viscous, which is dissipated and not recoverable. The elastic and delayed elastic
components are both recoverable so they do not contribute to permanent deformation. In
conventional asphalts, the elastic and delayed elastic component is very small and thus
the viscous component is very close to Wi at the high pavement temperatures. This is why
Wi is a relatively good indicator of permanent deformation in conventional binders.
However, modified asphalts are much more elastic or visco-elastic at high pavement
temperatures and thus for modified asphalts Wi is not directly related to the energy
dissipated in viscous flow, which results in permanent deformation. It is essential then to
isolate the viscous component of Wi in order for accurate estimation of the rutting
resistance of a modified binder.
To demonstrate the concept, Figure 3.2 shows the result of a creep test on three
binders. One of them is a conventional binder (oxidized) and the other two are binders
modified with polymers. The Figure shows clearly how the conventional binder has a
very low recovery during the unloading cycle. On the other hand, the modified binders
present a bigger elastic component, with a magnitude greater or similar to the viscous
component for both of the asphalts.

21
Figure 3.2 Recovering Capacity of Conventional and Modified Binders under Creep Testing
Number of Loading Cycles
The G*/sinδ is calculated after testing for only a few loading cycles. The damage
accumulation (permanent deformation) occurs after many cycles of loading. Asphalts that
have similar performance after a few cycles of loading can have very different
accumulated deformation after thousands of cycles because of the memory effects and the
vico-elastic nature of asphalts, particularly modified asphalts. The number of cycles
needed for an accurate characterization of the binder resistance to rutting must be enough
to reach a steady state behavior. This would allow extrapolating the results to the number
of cycles required. In the new repeated creep test a minimum of 50 cycles were found to
be necessary to reach, with a certain security, a nearly steady state.
Traffic Speed and Volume
In the Superpave specification low speed and high volume traffic are taken into
account simply by shifting the grade of the binder in the high pavement temperature.
Since it has been proved that modified binders of the same grade can have very different
Total strain
loading phase,
all binders
Permanent strain
modified binders
Permanent strain
conventional binder

22
sensitivity to loading time and temperature, the grade bumping is not an appropriate way
of taking into account the time of loading (traffic speed and volume). Also, testing at a
different temperature (for example specifying a PG 64 for a high pavement temperature
of 58°C) does not represent the actual behavior at pavement design temperature. There is
therefore a need for determining a specification parameter that considers in a more
rational way the effect of total loading time in permanent deformation.
3.3 A New Binder Parameter for Rutting
During the NCHRP 9-10 research program a new new parameter was selected for
characterizing the ability to resist rutting of binders, called viscous component of the
creep stiffness Gv. This parameter is measured testing the binder under repeated creep
constant load. The test can be easily carried out programming the DSR in the repeated
creep mode. With this new parameter, the problems presented by G*/sinδ are overcome.
Cyclic Creep Loading
In the new repeated creep test a cyclic load in one direction is applied. Figure 3.3
shows the loading pattern applied and the typical behavior of a modified asphalt for three
cycles of loading. The creep test allows isolating the viscous (permanent) deformation
from the elastic and delayed elastic (recoverable). In this way the ability to resist
permanent deformation of the asphalt can be truly characterized.
Number of Loading Cycles
The typical behavior of a binder under cyclic creep testing shows a first stage
were the permanent deformation per cycle varies from one cycle to the other reflecting
the effect of delayed elasticity. However, after around 30 cycles of loading, the rate of
deformation per cycle tends to stabilize reaching a steady state. It is important to reach
this steady state to accurately extrapolate the susceptibility to long term damage of the
binder.
An example of such results is shown in Figure 3.4 During the first cycles of
loading, the asphalt PG 64-28 SBS modified shows a higher rate of permanent
deformation than the PG 64-28 Elvaloy modified. However, when the steady state is
reached, the PG 64-28 SBS modified shows less rate of permanent deformation than the

23
PG 64-28 Elvaloy modified. This indicates that the PG 64-28 SBS modified has better
rutting resistance than the PG 68-28 Elvaloy modified. Also it is seen that both binders
accumulate much less permanent strain compared to the third binder which is SB
modified. It is important to notice that all three binders are of the same PG grade (64-28),
which signifies the failure of the current system to capture the differences between their
rutting performance.
Figure 3.3 Loading Pattern and Binder Strain under Repeated Creep Test
Stress kPa
Time (s)
68 -
Permanent deformation after 3 cycles of creep loading

24
0.00
0.05
0.10
0.15
0.20
0.25
0.30
0.35
0.40
0.45
0.50
0 100 200 300 400 500 600 700 800
Time (seconds)
Acc
umul
ated
Str
ain
(mm
/mm
)PG 64-28 SB modified
PG 64-28 SBS modified
PG 64-28 Elvaloy modified
Figure 3.4 Behavior of Binders of the same PG grade Under Repeated Creep Loading
Determination of the Viscous Component of the Creep Stiffness Gv
When the steady state is reached, then Gv is calculated. The behavior of the
asphalt is modeled using the four element Burger model. Gv is determined by fitting the
Burger Model to the data set from cycles 50 and 51, Based on the results of the testing of
a large number of binders, it was proved that cycles 50 and 51 give a reasonable security
that the steady state is already reached.
The total shear strain versus time is expressed by equation 3.
( ) teGG
t t
3
0/
2
0
1
0321 1)(
ητττγγγγ τ +−+=++= − ; eq.3
where: γ(t) = total shear strain
γ1 = elastic shear strain
γ2 = delayed elastic shear strain
τ0 = constant stress
G1 = elastic component of the complex modulus

25
G2 = delayed elastic component of the complex modulus
η3 = non recoverable steady state viscosity
Gv is defined as the viscosity η3 divided by the loading time (t), as shown by
equation 4.
Gv = η3 / t eq.4
Traffic Speed and Volume
It was determined during the NCHRP 9-10 research that, considering the accuracy
of the rheometers currently used, the most appropriate loading time for the creep testing
was 1 second. Even when the loading times that would correspond to the real traffic
speeds are shorter (0.1 to 0.01 seconds), most of the rheometers are not able to achieving
a true creep test with such short loading times. Thus the value of Gv measured by the
cyclic creep testing correspond to the Gv at 1 second. This value has to be transformed to
the value corresponding to the actual traffic speed. This conversion is carried out by
simply introducing the corresponding time of loading in equation 4. For example, if the
Gv value measured at 1 second loading time is equal to A, the corresponding Gv value for
0.01 seconds would be equal to A divided by 0.01.
The traffic speed accounted by these means represents an important improvement
from the grade bumping currently used in the PG grading system. The multipliers used
for Gv are obtained assuming that the permanent deformation due to one loading cycle of
1 second is equal to the permanent deformation produced by 10 loading cycles of 0.1
second. This is a more rational and scientific method for taking into account longer
loading times resulting from slower moving traffic.
To account for traffic volume a similar approach is used. The addition of more
loading cycles will results in more total loading time. In other words 100 trucks moving
at 60 mph will result in 10 times the loading time of 10 trucks moving at the same speed.
The limits for the Gv can therefore be simply calculated for a specific traffic volume and
changed proportionally to the other traffic volumes. This will be explained in a later
section with the implementation to Wisconsin conditions

26
3.4 Testing to Derive Limits for GV
Test Information
A total of 19 binders were tested during the present project, which varied in PG
grade (from PG 58 to PG 76) and modifier type used (SBS, SB, and Elvaloy modified).
Both original (non-aged) and RTFO (short term aging) aged binders were testes. The
value of Gv was determined for each of the binders. Important information about the
testing is listed below:
• Testing temperature = 58°C (high pavement design temperature in Wisconsin, 98 %
confidence level).
• The DSR sample was prepared according to the AASHTP TP5 standard procedure.
The stress stress-controlled rheometer is programmed to run a repeated creep test of
a total of 100 cycles of 1second loading and 9 seconds unloading.
• Most modified binders are stress sensitive and thus a minimum stress level was
required. Micro mechanics analysis of images of typical mixtures has shown that
stress level in binder under a typical 600 kPa truck tire is not high and could be in
the range of 10 to 50 Pa. To avoid confounding stress non-linearity, a starting stress
of 25 Pa was used.
• Since model fitting is iterative and can converge to give several combinations of the
parameters, it is important that the fitted and measured total accumulated strains at
100 cycles are compared. If the difference is more than 5 %, the fitting procedure
should be continued for more iterations and better match of the total accumulated
strain at 100 cycles.
Summary of Repeated Creep Results
The values measured for Gv at the selected pavement design temperature are
shown in Table 3.1. Most of the binder showed an increment in Gv after the RTFO aging.
However, five of the binders (C6, A1, D5, B6 and C2) showed a lower value of the Gv for
the RTFO aged residue compared with the original binder. This is not surprising, since in
the literature has been pointed out that the RTFO aging can provoke degradation in some
polymers used in binder modification. However these materials can not be considered as
well performing materials so they should not be used for setting specifications up. On the

27
other hand, it is not completely clear that these materials would soften in the real mixing
and construction process. For these reasons, the RTFO aged Gv values for the binders that
softened after the RTFO aging were excluded from the analysis carried out in the
following sections.
Table 3.1 Measured Gv Values at 58oC and 1.0 Second Loading Time
Measured Gv (kPa) Binder ID PG Grade Modification
Type Original RTFO aged
C5 PG 58-28 SBS 13 33 B9 PG 58-34 Elvaloy 73 183 D4 PG 58-34 SB 19 50 B7 PG 58-40 Elvaloy 39 126
AVERAGE PG 58 36 98 C4 PG 64-22 SBS 62 101 D1 PG 64-28 SB 111 281 B2 PG 64-28 Elvaloy 88 444 A3 PG 64-28 SBS 2380 2550 D2 PG 64-34 SB 345 659 B5 PG 64-34 Elvaloy 232 918 D5 PG 64-40 SB 1190 658*
AVERAGE PG 64 630 826 A1 PG 70-28 SBS 3670 1450* C2 PG 70-28 SBS 425 137* B8 PG 70-28 Elvaloy 211 607 B4 PG 70-28 Elvaloy 131 591 D6 PG 70-34 SB 2290 3960
AVERAGE PG 70 1345 1719 B3 PG 76-28 Elvaloy 1220 3880 C6 PG 76-28 SBS 8870 5540* B6 PG 76-34 Elvaloy 652 372*
AVERAGE PG 76 3581 3880 * Values excluded from the analysis
Without considering the binders that softened after primary aging, A3 (PG64-28
SBS modified) and D6 (PG70-34 SB modified) appear to perform the best among the
tested binders, in terms of Gv. It is highly remarkable that the binders that were expected
to perform the best in terms of rutting (PG76-xx) were not necessarily the most
outstanding in terms of performance. Comparing binders of the same high temperature
PG grading, it appears that the values of Gv vary highly depending on the modification
type. For instance, the binders of PG 64-xx have significant variations in the original

28
binder Gv values ranging from 62 kPa to 2380 kPa. This is more than 38 folds of the
lowest value estimated for the same grade. The difference is similar for the RTFO aged
Gv values of the PG64-xx binders. For the PG 70-xx binders, the variation in original
binder Gv ranges form 131 kPa to 2290 kPa, which is a 17 fold difference. It is no wonder
that there are significant concerns about the PG grading system.
Despite the big differences between the Gv values of binders of the same high
temperature PG grade, a trend could be identified. As the high temperature of the PG
grade increases, the average value of Gv increases as well. This trend was used to derive
the field conversions factors, as will be discussed in a later section.
3.5 Derivation of Specification Criteria
Mechanistic Binder Specification Framework
In order to use the binder rutting results in a specification framework, the
application conditions should be clearly defined. For rutting resistance, the framework
should be based on high pavement design temperature, traffic speed and traffic volume,
which is similar to the concept in the current Superpave practice . The effect of traffic
conditions (speed and volume) are, however, considered by changing the limits of the Gv
value rather than by grade shifting on the temperature scale. Table 3.2 depicts such a
framework in which traffic speed and traffic volume are explicitly included in the grading
system. This could be called a mechanistic approach for selecting asphalts since the
critical conditions that affect the mechanics of permanent deformation are considered in
selecting the grade of the asphalt. In the following sections an example of how such a
system can be implemented in Wisconsin is presented.
Weather and Traffic Information
According to the SHRP Superpave weather database most areas of Wisconsin
belong to the PG 58-xx pavement temperature region. For this reason, the research team
decided to stay with one high pavement temperature: 58°C (98% confidence level). This
way, complexity of selecting binders is expected to be reduced.
Six levels of traffic volume are recognized on Wisconsin highways and are used
in the current asphalt mixture design activities. The traffic levels considered are shown in
the first column of Table 3.3, in accordance to the PG Binder Selection Criteria. Two

29
levels of traffic speed were selected. High speed, assumed to be 60 mph (0.01 seconds
loading time), which is 5 miles per hour less than the maximum allowable traffic speed in
Wisconsin. Low speed, assumed to be 15 mph (0.04 seconds loading time), for taking
into account the slow movements of traffic in urban areas.
Table 3.2 Example of a Mechanistic Binder Specification Framework for Rutting Resistance that Includes Pavement Design Temperature and Traffic Conditions without Grade Shifting
Traffic Level (Millions ESALs)
L M H Purpose Test Parameter
AASHTO Method
Testing Rate
Testing Stress
Testing Temp.o
C Criteria
<1.0 1.0-3.0 >3.0 Test on Original Binder
Rutting Resistance Gv TP5 Load/
unload Creep Stress Gv at loading time
Traffic Speed: F 0.01/
0.09 s 25 Pa HT Minimum (c) (d) (e)
Traffic Speed: S 0.1/
0.9 s 25 Pa HT Minimum 2x(c) 2x(d) 2x(e)
Test on RTFO Aged Binder Rutting
Resistance Gv TP5 Load/ unload
Creep Stress Gv at loading time
Traffic Speed: F 0.01/
0.09 s 25 Pa HT Minimum 2x(c) 2x(d) 2x(e)
Traffic Speed: S 0.1/
0.9 s 25 Pa HT Minimum 4x(c) 4x(d) 4x(e)
Note: In the best judgement of NCHRP9-10, the following limits are recommended:
(c) = 20 kPa, (d) = 60 kPa, (e) = 200 kPa
Table 3.3 Traffic Levels and Applicable PG Grades for High Traffic Speed
ESALs Applicable Binder High Speed Average ESALs
0 - 0.3 PG 58 0.3 - 1 PG 58
500,000
1 - 3 PG 64 3 - 10 PG 64
5,000,000
10 - 30 PG 70 20,000,000
30 - PG 76 50,000,000

30
Deriving Field Conversion Factors
A necessary condition for defining new specifications is taking into account the
past experience in the field. The new parameters must be founded on reliable data coming
from the performance of the binders in the field, and not only from theoretical
derivations. That’s why, despite of the fact that the Superpave system has shown critical
gaps, it was assumed that using the PG grading experience in Wisconsin is the most
suitable and realistic way of relating the binders to the field performance. Wisconsin has
been using PG graded binders for at least 7 years with relatively good success evident by
lack of rutting problems. It is therefore reasonable to assume that the relationship
between the PG grade and the level of traffic for which it is used is a good starting point
for determining which traffic level these binders are suitable for. Table 3.3 shows the
applicable binder for each of the traffic levels at standard (high) traffic speed according to
the PG Binder Selection Criteria developed by Wisconsin DOT. The third column of
Table 3.3 shows the average traffic level for each of the PG graded binders. These
average values were considered the hypothetical allowable ESALs for each of the PG
grades at fast moving traffic.
Using the data collected in this project, the Gv values for each set of the high
temperature PG grades were averaged. The average Gv values measured at 1 second
loading time are shown in Table 3.1. The Gv values corresponding to high traffic speed
can be calculated for each of these averages by dividing them by a factor of 0.01. The
relationship between the average allowable ESALs of each PG grade and the average Gv
value at high speed for each PG grade defines the field conversion factors used for
constructing the specification criteria. Figure 3.5 shows the relationship between average
Gv value fro each PG garde and the allowable ESALs for the original and RTFO aged
binders (high traffic speed). The field conversion factors can be represented by the slope
of the trend lines shown in the Figure 3.5. It is important to note that the RTFO aged
binders show a slightly different trend line compared to the unaged. It is recommended
that this difference is maintained in the specification because modified binders vary in
their reaction to short term aging.

31
g
Original BinderGv = 7148(ESAL / 106)
R2 = 0.989
RTFO Aged BinderGv = 7950(ESAL / 106)
R2 = 0.9737
0
50000
100000
150000
200000
250000
300000
350000
400000
450000
0.0 10.0 20.0 30.0 40.0 50.0
Million ESALs
Gv
[kPa
]
Figure 3.5 Gv versus Allowable ESALs, Original Binder, High Traffic Speed (0.01 s loading time)
3.6 Proposed Binder Criteria for Rutting
Using the relationships shown in Figure 3.5, the proposed binder criterion for
rutting was derived by specifying a minimum Gv value for each of the traffic categories
defined in the PG Binder selection criteria. Criteria are defined for high and slow speed.
The Gv values for high speed are obtained by multiplying the average volume of each
traffic range by the corresponding field conversion factor (original of RTFO). For
example, the minimum value of Gv specified for the traffic range from 1 to 3 millions
ESALs is the one calculated using 2 million ESALs. The Gv values for low speed are
obtained from the Gv values for high speed. The speed conversion factor in this case is 4,
which represents the ratio between the loading time for fast traffic (0.01 s) and the
loading time for slow traffic (0.04 s). Table 3.4 shows the calculated minimum values for
each traffic volume and traffic speed. A binder should meet both Gv values, original and
RTFO aged, at the corresponding speed for being suitable for a specific traffic volume.
Table 3.4 was used for constructing the proposed specification for rutting. The
calculated Gv values were rounded before being included in the specification. Table 3.5
shows the proposed specification for the Wisconsin state, which follows the framework

32
presented before in Table 3.2. It provides a farmework for selecting a binder suitable for a
specific traffic speed, traffic volume and high pavement temperature, which is a
mechanistic system.
Table 3.4 Proposed Binder Rutting Criteria and Ranking of Binders
Volume Average Minimum Gv [kPa] Applicable Speed Range
(million ESAL)
Volume (million ESAL)
Original Binder
RTFO Aged
Binder
Binders
0 – 0.3 0.15 1072 1193 C5(PG58), D4(PG58), B7(58) 0.3 – 1 0.65 4646 5168 B9(58), C4(64), D1(64), B2(64), B4(70)
Fast * 1 – 3 2 14296 15900 D2(64), B5(64), B8(70) 3 – 10 6.5 46462 51675 B3(76) 10 – 30 20 142960 159000 > 30 30 214440 238500 A3(64), D6(70) 0 – 0.3 0.15 4289 4770 D2(64), B5(64), B8(70) 0.3 – 1 0.65 18585 20670 B3(PG76)
Slow ** 1 – 3 2 57184 63600 A3(64), D6(70) 3 – 10 6.5 185848 206700 10 – 30 20 571840 636000 > 30 30 857760 954000
Notes: * Gv for fast traffic is obtained dividing the measured value by 0.01 * Gv for slow traffic is obtained dividing the measured value by 0.04
Table 3.5 Tentative Specifications for Rutting
Purpose Testing Testing Testing Traffic Level (Millions ESA Ls) Rate Stress Temperature 0 - 0.3 0.3 - 1 1 - 3 3 -10 10 - 30 > 30
Test on Original Binder
Rutting Resistance
Load / unload
Creep Stress Minimum Gv at loading time (MPa)
Traffic Speed: F*
0.01/ 0.09 s 25 Pa 58o C 1.0 5.0 15.0 50.0 150.0 > 200.0
Traffic Speed: S**
0.04/ 0.36 s 25 Pa 58o C 4.0 20.0 60.0 200.0 600.0 > 800.0
Test on RTFO Aged Binder Rutting
Resistance Load / unload
Creep Stress Minimum Gv at loading time (MPa)
Traffic Speed: F*
0.01/ 0.09 s 25 Pa 58o C 1.25 6.0 18.0 60.0 180.0 > 250.0
Traffic Speed: S**
0.04/ 0.36 s 25 Pa 58o C 5.0 24.0 72.0 240.0 720.0 > 1000.0

33
3.7 Ranking of Binders
Using the criteria proposed the binders tested could be ranked according to their
contribution to rutting resistance. Table 3.4 shows how the tested binders fit into each of
the traffic levels and traffic speeds. It can be seen that the ranking of the binders with
respect to the Gv value has no good correlation with the PG grading. For fast speed and
traffic level between 0.3 – 1.0 million ESALs binder from three different PG grades are
found (PG64, PG70 and PG76). The PG grades suitable for the higher traffic level and
high speed are not PG76-xx, as it was expected; they are PG64-xx and PG70-xx. This is a
clear confirmation that the grade shifting due to traffic speed or traffic volume is not a
correct tool to take into account the time of loading, i.e. traffic conditions.
Only 6 binders showed adequate rutting resistance for slow traffic conditions.
None of the binders studied would be appropriate for being used in traffic levels higher
that 3 million ESALs at slow speeds. This is explained by the fact that the low speed
considered (15 mph) represents an increase in the time of loading of 4 times for each load
repetition. For this reason the Gv value required for slow traffic is 4 times higher than that
required for fast traffic, for the same traffic volume. In the current PG grade shifting it is
assumed that one grade shift is needed to go from high speed to slow speed, which is less
than the factor of 4. The appropriate binders for low speed determined using this
mechanistic approach are expected to be different from the ones that would have been
obtained using the simple PG grade shifting.
3.8 Summary of Findings for Rutting
• Using the total dissipated energy to rank binder according to their resistance to
permanent deformation could be misleading, particularly for modified asphalts. For
conventional asphalts the total energy dissipated measured by G*/sinδ and the
energy dissipated in viscous flow could be similar and thus could be a good
approximation. For binders with high visco-elasticity, the difference between total
energy and energy dissipated in viscous flow could be very large and thus G*/sinδ
cannot rank binder correctly with respect to rutting resistance.
34
• To estimate energy dissipated in viscous flow, a non-reversible cyclic loading is
needed. Such loading is attained by the repeated creep testing in which an asphalt is
allowed to recover and thus physically separate permanently dissipated energy from
delayed elastic stored energy.
• Comparing binders of the same PG grades, it appears that the values of Gv vary
highly depending on the modification type. Because of the significant range in Gv
for these binders, the concerns about the PG grading system not being able to
identify better performing modified asphalts are valid.
• Modified binders can deteriorate after RTFO aging. The proposed guidelines
suggest the checking of the Gv value before and after primary aging. This procedure
allow rejecting materials that soften too much after aging. Although the
consequences of this softening are not known in terms of pavement performance, it
could mean degrading of polymers, which cannot be considered beneficial.
• The criteria proposed is based on field conversion factors derived from a limited
amount of data. The limits are derived based on assumptions and approximations
that may or may not be completely valid. The limits are considered as a starting
point for further evaluation by the State Highway Agencies and the Industry. It is
hoped that a major national study will be initiated to collect enough data to derive
more reliable field conversion factors.
• The criteria proposed allow consideration of traffic speed and volume without grade
bumping. The adjustment factors for these conditions are derived based on field
conversion factors and mechanistic understanding of the parameters used in the
criteria.
• The proposed grading system is expected to allow the agency and the supplier to
determine what the traffic conditions are that this asphalt is suitable for without
artificially changing temperatures of testing. A PG 58 –28 could be of such a high
quality that it would fit high and low traffic volume and fast and slow speed without
the need to harden it and use a PG 64-28 grade. If there is a need for modification,
then that modification will be specifically designed to solve a non-acceptable
behavior such as sensitivity to traffic speed and traffic volume.

35
CHAPTER 4: FATIGUE EVALUATION OF BINDERS
Similar to the previous chapter, the problems with the current fatigue parameter
will be first presented followed by testing results and proposed criteria for controlling
fatigue of binders and selection of grades.
4.1 Problems with Superpave FATIGUE Parameter
The current Superpave specification parameter for fatigue (G*sin δ) has some
problems that can be grouped into the following areas: (a) it is good only for strain
controlled conditions; (b) is based on the energy dissipated per loading cycle; (c) it is
obtained after only a few cycles of loading and (d) it does not consider the type of
pavement structure.
Strain Controlled Conditions
The Superpave parameter G*sinδ is derived from the total energy (Wi) dissipated
per loading cycle under a strain controlled loading. Equation 1 shows the relationship for
Wi under strain controlled conditions.
δγπ sinGWi ⋅⋅⋅= *20 ; eq.1
where: Wi = total energy dissipated in cycle i
γ0 = constant strain applied
G* = complex modulus
δ = phase angle
Fatigue is supposed to be minimized by controlling Wi. Lower values of G*sinδ
would result in lower energy dissipated per loading cycle under strain controlled
conditions. Fatigue is known to be more critical in weak pavements, where the loading is
believed to be strain controlled. However, the limit between weak pavement and strong
pavement is not very clear. I would be much more useful to have a parameter that would
be independent of the mode of loading because it is very difficult to decide what will be
the conditions of the pavement during selecting of the binders. A parameter applicable for

36
all kind of pavement structures would provide a more reliable and simple prediction for
the fatigue life of roads.
Dissipated Energy per Loading Cycle (Wi)
The energy dissipated per loading cycle Wi does not necessarily represents the
tendency of the binder to having a poor fatigue performance. Under cyclic, reversible
loading the energy (Wi) can be dissipated into two components: visco-elastic damping
and irreversible damage. Thus, Wi represents energy that is used by the time dependent
behavior of the material or energy that is dissipated in either viscous flow or in cracking.
During cyclic reversible loading it is very difficult to separate these mechanisms and thus
the simple measure of Wi for a few cycles is not a measure of cracking damage that could
occur due to fatigue. This was proven experimentally by considering the correlation
between G*sinδ and the fatigue life of mixtures, which was proven to be very low. The
solution to this challenge is to consider the change in Wi values because the relative
change due to repeated cycling is a good physical indicator of the initiation of the fatigue
damage and the progression.
Numbers of Loading Cycles
The value of G*sinδ is derived from Wi calculated after testing for only a few
loading cycles. The damage accumulation (fatigue) happens after many cycles of loading.
This fatigue behavior can be shown for example like a decrease in the G* value of the
binder. Two asphalts can have very similar performance after a few cycles of loading but
they can defer highly when thousands of cycles are applied. Figure 4.1 shows the G*
values for some binders as a function of the cycles of loading for strain controlled
conditions. It can be see that all the binders show a steady behavior in terms of G* values
for the first thousand cycles. However there is a certain point when G* starts to decrease.
This is a sign of damage occurring in the binder. It is also shown that binders that had the
same G* value at the beginning of the testing, start to deteriorate at different number of
loading cycles. This means that they have different fatigue lives.

37
Figure 4.1 G* vs. Loading Cycles for Strain Controlled Testing
Pavement Structure
Fatigue behavior in asphalts is highly dependent on the level of load applied to the
binder. Higher strains (or stresses) lead to earlier fatigue damage than lower ones. That is
why fatigue damage is usually more common in weak pavements, where the strain level
is higher. The current parameter G*sinδ does not consider the load applied to the binder
in the characterization of the fatigue behavior. This way, the differences between weak
structures and strong structures are neglected in the current specifications, which is a high
inaccuracy.
4.2 A New Binder Parameter for Fatigue
A new fatigue parameter was proposed in the NCHRP 9-10 research program for
determining the fatigue resistance of binders. The new parameter is obtained after testing
the asphalt in the DSR binder for a large number of cycles until damage is shown in the
sample. The type of loading is the same as applied in the current Superpave fatigue
testing, but the number of cycles is considerably higher. The damage is characterized by a
change in the energy dissipated per loading cycle. The point of failure is obtained from
analyzing the variations in the dissipated energy per loading cycle using a parameter
called dissipated energy ration DER. The proposed fatigue parameter is named Np20 and
0.0E+00
2.0E+06
4.0E+06
6.0E+06
8.0E+06
1.0E+07
1.2E+07
1.4E+07
1.6E+07
100 1000 10000 100000 1000000
Cycles
G* (Pa)

38
its application overcomes the inconveniences presented by the Superpave parameter
G*sinδ.
Number of Loading Cycles
Figure 4.1 shows how binders that have similar characteristics in terms of G* in
the first cycles of loading can present very different fatigue performance after many
cycles of loading. During the NCHRP 9-10 project it was found that the best way to
characterize the point when fatigue damage occurs is shown is by using the concept of
change in the dissipated energy per cycle. The total energy dissipated per loading cycle
(Wi) is defined in equation 2.
δτγπ sin* ⋅⋅⋅= iiiW ; eq.2
where Wi = total energy dissipated in loading cycle i
τi = stress applied
γi= strain applied
δ = phase angle
Equation 3 shows the accumulated dissipated energy after n cycles Wc.
∑=
=n
iic WW
1
; eq.3
These two parameters (Wi and Wc) allow to define another parameter called
Dissipated Energy Ratio (DER), which is determined according to equation 4.
n
c
WW
DER = ; eq.4
where Wn = energy dissipated at cycle n
A binder can be subjected to cyclic loading for a determined number of cycles
without showing fatigue damage. During this stage, the energy dissipated per loading
cycle remains constant. However, if the binder continues to be loaded and unloaded, a
point is reached when it does not dissipate the same amount energy per cycle anymore.
This is a sign of fatigue damage. This behavior is material specific and does not depend
on the loading conditions. This behavior can be clearly shown using the DER. During the

39
first cycles of loading, when Wn remains constant and Wc increases at a constant pace, so
the DER shows a linear trend with 45° slope. When fatigue damage is reached the trend
line followed by the DER depends on the mode of loading. In the strain controlled test the
value of Wn decreases when fatigue damage is reached, so the DER increases. For the
stress controlled test, however, the value of Wn increases when fatigue damage is
reached, so the DER decreases. The variation in the DER versus cycles of loading for a
typical binder under cyclic strain controlled and stress controlled loading are shown in
Figure 4.2 and 4.3 respectively.
Figure 4.2 Variation in the DER for Stress Controlled Testing
The point where the trend line leaves the linear slope corresponds to the point
where the fatigue cracks are initiating in the binder. This point is refereed as crack
initiation point. However, after this point, if the binder is unloaded and enough resting
time is given, it is still capable of recovering. After more cycles of testing the crack
propagation point is reached. When the binder goes beyond this point no more healing is
possible and the fatigue damage is not reversible. Conceptually, the fatigue life of the
Crack propagación
Crack initiation

40
binder is represented by the number of cycles required to undergo the crack initiation
without reaching the crack propagation.
Figure 4.3 Variation in the DER for Strain Controlled Testing
Independence from the Mode of Loading
The fatigue damage point for binders, Np20, was defined as the point (cycle
number n) where the dissipated energy ratio DER deviates 20% from the 45º inclination
straight line. This point was selected because it provides independence of the mode of
loading. If the initial input energy is the same, the Np20 value obtained using stress
controlled or strain controlled test will be the same. The Np20 occurs after the crack
initiation point and usually before the crack propagation point, so it provides a reasonable
criterion for defining the fatigue failure of binders.
Stress controlled was selected as the most suitable test because it provides a more
clear measurement of the Np20 value. It can be seen that both, the crack initiation and
crack propagation are more clearly shown in the stress controlled testing shown in Figure
4.2 than in the strain controlled testing shown in Figure4.3.
Crack propagation
Crack initiation

41
Pavement Structure
Weak pavements deform more under traffic loads than strong pavements. This
generates more energy input over the binder used in the weak pavement. Fatigue life of
binders is highly sensitive to energy input. This fact is clearly shown in Figure 4.4, where
the different fatigue lives shown by the same binder subjected to different stress levels is
presented. This variable was considered in defining the new parameter Np20. If the binder
is going to be used in a weak structure, a high energy input is used in the testing. If the
binder is for a strong structure, a lower energy input is considered for testing.
1.0E+00
1.0E+01
1.0E+02
1.0E+03
1.0E+04
1.0E+05
1.0E+06
1.0E+01 1.0E+02 1.0E+03 1.0E+04 1.0E+05 1.0E+06 1.0E+07
Number of Cycles
Dis
sipa
ted
Ener
gy R
atio
250 pa300 pa1000 pa5000 pa10000 pa20000 pa
Figure 4.4 Fatigue life versus Stress Level Used in Testing
4.3 Determination of the Number of Cycles to Failure, Np20
The determination of the Np20 value depends mainly on two parameter: the energy
input and temperature of testing. It has been proven that the fatigue life relationships vary
with the temperature of the material. For each of the required pavement temperatures, the
binder has to be tested at different energy levels for determining the fatigue relationships.
When the energy concept is used, there is no need to test at different frequencies. The

42
effect of frequency can be included in the energy input, as it will be explained later in this
paper.
Fatigue Relationship
The relationship between the fatigue life of a binder (Np20) and the energy input
(Wi), for a specific pavement temperature, can be approximated by equation 5.
Np20 = K1 ⋅ (1/wi)K2 ; eq.5
When plotted in a log-log graph, the relationship shown by equation 5 is linear.
For determining the parameters K1 and K2 two points are needed. This means that, for a
fixed pavement temperature, the binder has to be tested at two different energy levels in
order to obtain the fatigue relationship. After the parameters are calculated, the fatigue
relationship can be used to calculate the fatigue life at any input energy for the selected
pavement temperature.
Energy Input
The two input energies needed to determine the fatigue relationship are chosen in
order to represent the weak pavement and strong pavement conditions. Since there is not
representative data available of the actual stress or strain that the binder would have in the
actual pavement, some assumptions were made to select the input energies that represent
each of the pavement structures. It was assumed that the binder in the strong pavement is
loaded in the linear range. In the weak pavement, the binder is considered to be loaded in
the non-linear range. For determining the energy needed to take the binder to the linear
and non-linear regions, amplitude sweep testing was done. The amplitude sweep plot data
for a typical binder is shown in Figure 4.5(a). The low strain/stress (strong pavement)
was defined as ½ of the linear limit. The high strain/stress (weak pavement), was picked
up slightly above the linear limit. Figure 4.5 (b) shows how the two energy input levels
are used to construct the relationship between Np20 and the Wi.

43
0.0E+00
1.0E+05
2.0E+05
3.0E+05
4.0E+05
0.00E+00 4.00E-02 8.00E-02 1.20E-01
1b15-5 1b15-6
y = 1E+16x -2.6274
R 2 = 0.9172
1.0E+02
1.0E+03
1.0E+04
1.0E+05
1.0E+06
1.0E+03 1.0E+04 1.0E+05 1.0E+06
b) Wi (Pa)
Np20
a) Strain
Stre
ss (P
a)
Figure 4.5 Amplitude Sweep Test Data Plot for a Typical Binder (a) and Np20 vs. Wi Relationship (b)
Testing Temperatures
Testing of fatigue life of asphalt binders has proved to be dependent on the testing
temperature. Different fatigue relationships can be obtained for the same binder when
different testing temperatures are used. For this reason, the temperature of testing has to
be selected prior to the testing.
The testing temperature is selected as the average of the high and low pavement
design temperatures of the PG grading. In the current AASHTO MP1, the temperature for
checking the fatigue parameter G*·sinδ is chosen as the average plus 4°C. There is no
need to add 4°C to the average temperature in the determination of Np20, so the average
should be used directly. For example for a PG 58-28 grade, the testing is conducted at
15°C for the new parameter, instead of the 19°C used in the current specifications. Since
PG 58-28 is the binder used in the most populated areas of Wisconsin (south east region
of the state), the average temperature of this PG grade was selected (15ºC) for the
purpose of the present work. Besides this temperature, another temperature was also
picked up for taking into account the fatigue that occurs in the pavement during the thaw
season, when the structure under the pavement is its worse condition. The temperature
selected for representing this condition, considering the climatic conditions of Wisconsin,
was 6ºC.
a) b)

44
Testing frequencies
It has been proven that the testing frequency is a factor to consider in the
determination of the fatigue life of asphalt binders and mixtures. In fact, many studies
conducted on asphalt mixtures suggested including the stiffness, which is a function of
the frequency, as a parameter in the fatigue law. For this reason, the testing frequency has
to be known prior to the testing.
The required frequency is related to the traffic speed. For 60 mph the testing
frequency should be 10 Hz. For slow speed (15 mph) the testing frequency should be 2.5
Hz. Using the initial energy concept (Wi), the effect of frequency on fatigue life could be
included in changing Wi so testing at multiple frequencies is not necessary. Equation 1
and equation 6 show the relationships for Wi in a strain controlled and stress controlled
testing respectively.
δτπ
sin/*12
0G
Wi ⋅⋅= ; eq.6
where: Wi = total energy dissipated in cycle i
τ0 = maximum stress applied
G* = complex modulus
δ = phase angle
The values of G* and δ vary with the testing frequency, so the effect of testing
frequency can be included in the value of G* and δ for any of the modes of testing used.
Considering this advantage the testing is done at 10 Hz only. This way the time required
for testing is significantly reduced.
4.4 Testing to Derive Limits for NP20
Test Information
A total of 18 modified asphalts and one base asphalt were tested using oscillatory
shear measurements under stress controlled conditions. The change in properties was
measured using the Dynamic Shear Rheometer (DSR) in accordance with the AASHTO
Standard Procedures (TP5). Each asphalt was tested after aging with the Pressure Aging
Vessel Oven (PAV). G* and Phase Angle (δ) measurements were used to compute the

45
Dissipated Energy Ratio, which in turn was used to compare the results for each binder
under different testing conditions. Some information about the testing is listed below.
• Energy input: two levels of energy input were used. One in the middle of the linear
range and one slightly over the linear limit, as explained earlier.
• Testing temperature was chosen as 15ºC, which corresponds to the average of the
high and low temperature of the PG 58-28, as discussed earlier. An additional
testing temperature was also chosen for the tested binders of 6°C which accounts
for the freeze and thaw effects
• The testing frequency used was 10 Hz, which correspond to the fast traffic speed, as
discussed earlier.
Summary of Binder Fatigue Testing Results
The results of 19 binders tested for fatigue performance are shown in Table 1.1.
The measurements and calculations confirm the high dependency on the stress level of
the binder fatigue life. The stress sensitivity was very similar for the two testing
temperatures. For both, 15ºC and 6ºC, an average decrease in the fatigue life of 15 times
was registered when the stress was changed from the linear to non linear range. However,
for 6ºC the variations were higher. For this temperature the maximum decrease in fatigue
life when moving from strong to weak structure was 108 times (D5) and the minimum
was 2 times (B9). For 15ºC a maximum decrease of 39 (B5) times and a minimum of 5
times (D4) was shown.
From the test results, it is not possible to establish a clear trend in the temperature
susceptibility of the fatigue life of binders. Some binders increase their fatigue life about
2 to 3 times (D6 and B9 for low stress; D5 high stress) when the testing temperature
dropped from 15ºC to 6ºC. Other binders decrease their fatigue life more than 5 times
(A1 for low stress; C5, B8, C4 and A1 for high stress) for the same temperature change.
The Superpave fatigue analysis of binders showed no correlation with the Np20
values. For example, the binders C5 (PG 58-28), B5 (PG 64-34) and D2 (PG 64-34) have
the same average temperature of 15ºC. The three binders should have shown similar
fatigue performances for the 15ºC testing temperature. The results however differ
considerably, showing differences in the fatigue life up to 6 times between the each other.

46
Table 4.1 Results of Fatigue Tests at 6°C and 15°C (part I)
Binder Code PG Grade
Testing Temp.
[ºC]
Stress Level [kPa]
G* [Pa] Phase Angle Wi (Pa) Measured
Np20 K1 K2
B7 PG 58-40 15 183 3,579,750 49.0 22,189 40,056 -2.086 4.66E+13 (Elvaloy) 137 4,481,980 46.3 9,519 234,056 6 430 12,177,900 43.5 32,849 22,906 -3.722 1.48E+21 344 14,117,300 41.1 17,324 247,811
B9 PG 58-34 15 288 6,224,400 49.9 31,888 10,615 -2.468 1.38E+15 (Elvaloy) 200 7,200,010 46.9 12,737 102,213 6 659 24,331,600 40.0 36,008 28,094 -1.422 8.48E+10 527 24,146,300 39.4 22,934 53,362
D4 PG 58-34 15 371 10,979,500 46.5 28,550 23,217 -1.812 2.76E+12 (SB) 253 12,316,500 44.3 11,395 122,655 6 861 37,057,300 36.8 37,666 19,700 -3.817 5.77E+21 689 38,696,100 35.3 22,251 146,915
D5 PG 64-40 15 161 2,131,640 51.9 30,075 4,363 -2.419 2.96E+14 (SB) 97 2,833,290 48.0 7,757 115,665 6 336 7,682,110 46.2 33,338 2,046 -3.651 6.64E+19 202 9,264,690 41.9 9,241 221,330
C5 PG 58-28 15 615 20,454,400 42.2 39,048 12,843 -1.841 3.65E+12
(Non 320 22,049,600 40.0 9,378 177,478 Modified) 6 984 61,116,800 31.1 25,679 82,213 -2.280 9.34E+14 782 61,650,000 30.5 15,828 247,832
B5 PG 64-34 15 322 5,202,160 51.8 49,230 7,294 -2.868 2.09E+17 (Elvaloy) 198 6,645,800 48.0 13,762 282,148 6 630 20,747,400 42.6 40,683 27,518 -2.689 6.79E+16 485 24,318,400 40.4 19,684 193,779
D2 PG 64-34 15 420 11,139,200 46.3 35,981 44,157 -4.169 4.35E+23 (SB) 336 11,736,100 45.0 21,379 386,842 6 840 32,186,400 38.1 42,482 114,939 -1.643 4.63E+12 673 38,383,600 35.4 21,499 351,988
A3 PG 64-28 15 568 16,036,800 45.3 44,954 9,159 -3.036 1.23E+18 (SBS) 435 18,156,900 42.7 22,183 78,209 6 1264 44,836,900 43.3 76,810 16,532 -3.597 6.20E+21 993 50,150,600 41.3 40,803 160,903
B2 PG 64-28 15 570 18,142,200 39.8 36,050 16,052 -3.847 5.45E+21 (Elvaloy) 395 20,151,500 37.3 14,751 499,513 6 1302 52,498,300 31.9 53,585 15,471 -5.074 1.54E+28 1023 58,534,700 29.8 27,927 422,365
D1 PG 64-28 15 733 25,272,600 39.4 42,366 12,592 -2.949 5.59E+17 (SB) 500 27,706,800 37.0 17,050 184,492 6 1490 75,414,100 29.1 44,966 10,890 -4.347 1.84E+24 1185 80,425,300 27.7 25,513 127,946

47
Table 4.1. Results of Fatigue Tests at 6°C and 15°C (part II)
Binder Code PG Grade
Testing Temp.
[ºC]
Stress Level [kPa]
G* [Pa] Phase Angle Wi (Pa) Measured
Np20 K1 K2
D6 PG 70-34 15 289 5,193,520 52.4 40,006 16,836 -2.806 1.38E+17 (SB) 208 6,578,040 48.9 15,582 237,300 6 650 17,503,000 44.8 53,447 10,560 -6.310 7.19E+33 580 18,913,000 43.4 38,390 85,199
B8 PG 70-34 15 336 6,491,070 49.1 41,289 8,805 -2.621 1.10E+16 (Elvaloy) 210 8,006,560 45.3 12,305 210,136 6 620 24,566,800 39.5 31,275 50,767 -5.874 1.29E+31 540 24,651,400 39.1 23,461 274,776
C4 PG 64-22 15 880 37,044,500 36.6 39,182 21,115 -2.804 1.60E+17 (SBS) 609 39,899,600 34.5 16,548 236,745 6 1390 101,987,000 25.8 25,897 132,582 -1.966 6.27E+13 973 114,387,000 26.6 11,651 637,255
C2 PG 70-28 15 563 15,833,400 43.5 43,201 11,307 -3.659 1.04E+21 (SBS) 450 19,121,900 40.5 21,597 142,928 6 1355 52,608,500 33.2 59,964 12,569 -2.784 2.52E+17 996 58,071,200 30.6 27,349 111,818
A1 PG 70-28 15 573 18,360,400 41.0 36,891 4,076 -3.670 2.34E+20 (SBS) 458 19,725,400 39.2 21,113 31,598 6 1141 56,841,100 30.6 36,576 25,538 -4.283 8.94E+23 913 57,905,400 29.4 22,222 215,817
B4 PG 70-28 15 545 15,813,200 41.8 39,302 11,278 -3.935 1.35E+22 (Elvaloy) 436 16,959,900 40.1 22,675 98,204 6 1251 50,962,900 32.6 52,044 7,846 -41.487 3.65E+199 1042 44,256,000 38.8 48,243 182,420
B6 PG 76-34 15 295 5,421,190 49.6 38,413 21,671 -2.276 5.90E+14 (Elvaloy) 236 6,591,480 46.5 19,255 104,370 6 675 23,693,500 39.7 38,593 15,579 -2.843 1.70E+17 540 24,320,400 38.9 23,668 62,545
C6 PG 76-28 15 509 14,148,100 43.4 39,518 4,613 -4.597 6.27E+24 (SBS) 407 17,247,600 41.0 19,813 110,277 6 1097 44,855,800 34.0 47,097 10,050 -4.896 7.61E+26 894 47,040,900 32.3 28,530 116,945
B3 PG 76-28 15 588 16,129,900 42.2 45,202 9,475 -3.772 3.45E+21 (Elvaloy) 452 17,506,400 39.6 23,387 113,804 6 1257 52,291,800 32.4 50,911 29,039 -3.352 1.74E+20 898 57,289,100 30.2 22,273 464,058

48
The measured values of G* and δ shown very little variations with the stress level.
The maximum variations were around 20% for G* and 30% for δ. No trend could be
established, since for some binders the value of G* or δ increased with increasing the
stress level, and for other binder the value of the parameters decrease.
All the binders, except B4 (PG 70-28) for 6ºC, showed reasonable values for the
parameters K1 and K2. These parameters were replaced in equation 5 to calculate the
fatigue lives of the binders for different levels of initial energy, as it will be shown later
in this paper. For all the cases, but the one mentioned, the fatigue lives obtained were
reasonable, within the expected values. Only for B4 at 6ºC the fatigue relationship shown
to be unrealistic, forecasting very high fatigue lives that are not likely to be possible. This
could have been generated by errors in the binder testing. For this reason, the testing
results for B4 at 6ºC were excluded from the analysis carried out in the following
sections.
4.5 Computation of Np20 for Each Traffic Speed
Fast Traffic Speed
The values measured for the binder parameters shown in Table 4.1 were measured
with a frequency of 10 Hz, which corresponds to fast traffic speed. The Np20 values
shown in Table 4.1 are the ones calculated using the high and low input energy of the
corresponding binder. As explained earlier, amplitude sweep testing was carried out to
select the Wi needed to load the binder in the linear range (strong structure) or nor linear
range (weak structure). That’s why each binder has it’s own value of Wi for strong
structure and weak structure, as it is shown in the 7th column of Table 4.1. However, the
energy input is a function of the pavement structure only (when the load is fixed), so a
single value of Wi has to be selected for each of the pavement structures. To estimate a
representative Wi value for each pavement structure, the input energies of all the binders
were averages for the corresponding pavement structure (for each temperature). Table 4.4
shows the average values of the input energy for each combination of parameters.

49
Table 4.2 Selected Wi Values for Strong and Weak Structure, Fast Traffic
Average Wi Values [Pa] Temperature
Strong (Linear Range) Weak (Non Linear Range)
15 ºC 16431 38070
6 ºC 23364 42657
The values shown on Table 4.2 were rounded. Wi values of 25000 Pa and 45000
Pa were used for estimating Np20 at 6°C of the strong structure and the weak structure,
respectively. For 15°C, the Wi values used were 15000 Pa and 40000 Pa for the strong
structure and weak structure, respectively. The estimated Np20 using these four rounded
Wi values are shown on the sixth column of Table 4.5. The Np20 values were calculated
using the relationship shown in equation 6 and the K1 and K2 values presented in Table
4.1. It should be mentioned here that if a better estimation of strain or stress in a
pavement structure could be determined, it could be used to estimate Np20. If these values
are not available, the values suggest here could be used.
Slow Traffic Speed
For slow traffic speed, the Wi values have to be corrected for including the effect
of the lower testing frequency. The lower frequency would result in variations in the G*
and δ values. Equation 5 shows the relationship between Wi, G* and δ for a stress
controlled test. For accounting the variation of Wi due to testing frequency, an estimation
of the variation of the parameter G*/sinδ with respect to frequency is needed. It has been
shown that at the intermediate pavement temperature, the value of G*·sinδ decreases
approximately 7 times, and the G* decreases around 8 times when the frequency of
testing is lowered from 10 hz to 0.1 hz (1% strain). Using this two parameters, the
decrease in G*/sinδ can be estimated in approximately 10 times for the same change in
frequency. This relationship was used to approximate the variations in G*/sinδ when the
frequency is changed from 10 Hz to 2.5 Hz. Considering linear interpolation, the
parameter would decrease approximately 30% when the frequency decreases 4 times.
Table 4.3 shows the values of G*/sinδ for low speed, which correspond to 70% of the
value at high speed. These values were used to calculate the corresponding Wi values for
low speed, shown in the 7th column of Table 4.3.

50
Table 4.3 Wi Values for Slow Traffic (part I)
Binder Code PG Grade Testing
Temp. [ºC]
StressLevel[kPa]
G/sinδ [Pa](60 mph)
G/sinδ [Pa](15 mph)
Wi (15 mph)
B7 PG 58-40 15 183 4743319 3320323 31685 (Elvaloy) 137 6199565 4339696 13587 6 430 17691736 12384215 46904 344 21475774 15033042 24729
B9 PG 58-34 15 288 8137483 5696238 45585 (Elvaloy) 200 9861058 6902741 18204 6 659 37854179 26497925 51487 527 38042753 26629927 32763
D4 PG 58-34 15 371 15136666 10595666 40809 (SB) 253 17635335 12344735 16289 6 861 61864405 43305083 53778 689 66966484 46876538 31814
D5 PG 64-40 15 161 2708845 1896191 42944 (SB) 97 3812653 2668857 11075 6 336 10643819 7450673 47601 202 13873107 9711175 13200
C5 PG 58-28 15 615 30451486 21316040 55742 (Non Modified) 320 34303930 24012751 13397 6 984 118324256 82826979 36724 782 121471888 85030322 22593
B5 PG 64-34 15 322 6619868 4633908 70291 (Elvaloy) 198 8943005 6260103 19674 6 630 30652432 21456703 58111 485 37522369 26265658 28134
D2 PG 64-34 15 420 15407967 10785577 51380 (SB) 336 16597736 11618415 30526 6 840 52164236 36514965 60705 673 66262440 46383708 30676
A3 PG 64-28 15 568 22562158 15793511 64173 (SBS) 435 26774421 18742095 31717 6 1264 65378770 45765139 109672 993 75987404 53191183 58237
B2 PG 64-28 15 570 28343026 19840118 51445 (Elvaloy) 395 33254775 23278343 21056 6 1302 99348744 69544121 76577 1023 117785382 82449767 39875
Table 4.3 Wi Values for Slow Traffic (part II)

51
Binder Code
PG Grade
TestingTemp.
[ºC]
StressLevel [kPa]
G/sinδ [Pa](60 mph)
G/sinδ [Pa] (15 mph)
Wi (15 mph)
D1 PG 64-28 15 733 39817251 27872076 60559 (SB) 500 46039895 32227926 24369 6 1490 155070210 108549147 64251 1185 173021105 121114773 36423
D6 PG 70-34 15 289 6555214 4588650 57180 (SB) 208 8729437 6110606 22242 6 650 24840415 17388291 76332 580 27526984 19268889 54845
B8 PG 70-34 15 336 8587924 6011547 58997 (Elvaloy) 210 11264421 7885095 17570 6 620 38623247 27036273 44666 540 39088245 27361772 33480
C4 PG 64-22 15 880 62133335 43493334 55934 (SBS) 609 70445254 49311678 23628 6 1390 234334821 164034375 37003 973 255472487 178830741 16631
C2 PG 70-28 15 563 23002351 16101646 61732 (SBS) 450 29444028 20610820 30865 6 1355 96079999 67255999 85760 996 114082558 79857790 39025
A1 PG 70-28 15 573 27986576 19590603 52650 (SBS) 458 31210401 21847281 30163 6 1141 111665991 78166193 52323 913 117959895 82571927 31714
B4 PG 70-28 15 545 23725147 16607603 56185 (Elvaloy) 436 26330839 18431587 32400 6 1251 94593543 66215480 -- 1042 70630115 49441081 --
B6 PG 76-34 15 295 7118890 4983223 54862 (Elvaloy) 236 9087211 6361047 27506 6 675 37093420 25965394 55125 540 38729991 27110994 33789
C6 PG 76-28 15 509 20591896 14414327 56465 (SBS) 407 26290346 18403242 28277 6 1097 80217334 56152134 67326 894 88035801 61625061 40743
B3 PG 76-28 15 588 24013387 16809371 64616 (Elvaloy) 452 27464971 19225480 33384 6 1257 97593429 68315400 72659 344 21475774 15033042 24729

52
The Wi values shown in Table 4.3 are different for each of the binders. A single
Wi value has to be selected for each of the pavement structures, as explained earlier.
Following the same procedure used for high speed, the Wi values for slow speed were
estimated from the average value of all the binders at the corresponding pavement
structure and temperature. Table 4.4 shows these average values of the input energy for
each combination of parameters.
Table 4.4 Selected Wi Values for Strong and Weak Structure, Slow Traffic
Estimated Wi Values Temperature
Strong (Linear Range) Weak (Non Linear Range)
15 C 23470 54381
6 C 33358 60945
The values shown on Table 4.4 were rounded. Wi values of 35000 Pa and 60000
Pa were used in estimating Np20 at 6°C for the strong structure and the weak structure,
respectively. For 15°C, the Wi values used were 25000 Pa and 55000 Pa for strong
structure and weak structure, respectively. The estimated Np20 using these four values of
Wi are shown on the last column of Table 4.5. The Np20 values were calculated using the
relationship shown in equation 6 and the K1 and K2 values presented in Table 4.1.
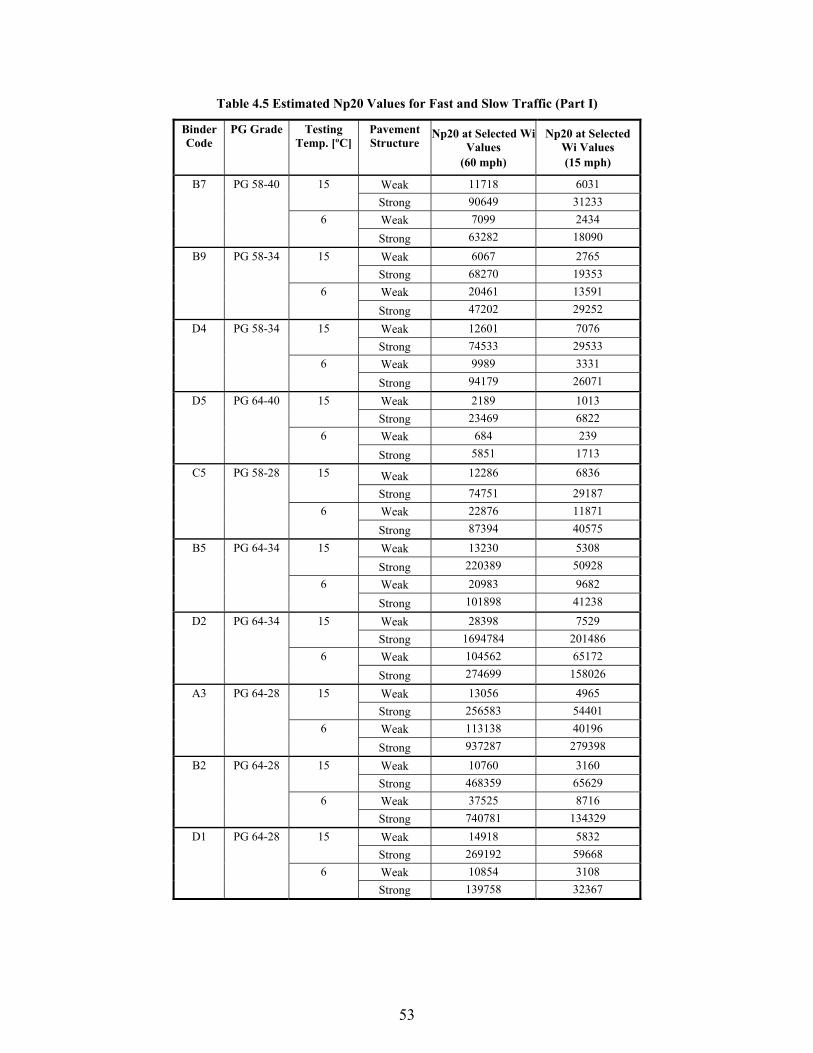
53
Table 4.5 Estimated Np20 Values for Fast and Slow Traffic (Part I)
Binder Code
PG Grade Testing Temp. [ºC]
Pavement Structure
Np20 at Selected Wi Values
(60 mph)
Np20 at Selected Wi Values (15 mph)
B7 PG 58-40 15 Weak 11718 6031 Strong 90649 31233 6 Weak 7099 2434 Strong 63282 18090
B9 PG 58-34 15 Weak 6067 2765 Strong 68270 19353 6 Weak 20461 13591 Strong 47202 29252
D4 PG 58-34 15 Weak 12601 7076 Strong 74533 29533 6 Weak 9989 3331 Strong 94179 26071
D5 PG 64-40 15 Weak 2189 1013 Strong 23469 6822 6 Weak 684 239 Strong 5851 1713
C5 PG 58-28 15 Weak 12286 6836
Strong 74751 29187 6 Weak 22876 11871 Strong 87394 40575
B5 PG 64-34 15 Weak 13230 5308 Strong 220389 50928 6 Weak 20983 9682 Strong 101898 41238
D2 PG 64-34 15 Weak 28398 7529 Strong 1694784 201486 6 Weak 104562 65172 Strong 274699 158026
A3 PG 64-28 15 Weak 13056 4965 Strong 256583 54401 6 Weak 113138 40196 Strong 937287 279398
B2 PG 64-28 15 Weak 10760 3160 Strong 468359 65629 6 Weak 37525 8716 Strong 740781 134329
D1 PG 64-28 15 Weak 14918 5832 Strong 269192 59668 6 Weak 10854 3108 Strong 139758 32367

54
Table 4.5 Estimated Np20 Values for Fast and Slow Traffic (Part II)
Binder Code PG Grade Testing
Temp. [ºC] Pavement Structure
Np20 at Selected Wi Values
(60 mph)
Np20 at Selected Wi Values (15 mph)
D6 PG 70-34 15 Weak 16843 6892 (SB) Strong 264050 62977 6 Weak 31267 5090 Strong 1275960 152679
B8 PG 70-34 15 Weak 9568 4153 (Elvaloy) Strong 125057 32790 6 Weak 5989 1105 Strong 189186 26212
C4 PG 64-22 15 Weak 19926 8159 (SBS) Strong 311808 74439 6 Weak 44753 25424 Strong 142094 73342
C2 PG 70-28 15 Weak 14986 4673 (SBS) Strong 542460 83674 6 Weak 27952 12548 Strong 143580 56269
A1 PG 70-28 15 Weak 3029 941 (SBS) Strong 110779 16996 6 Weak 10511 3066 Strong 130311 30840
B4 PG 70-28 15 Weak 10523 3006 (Elvaloy) Strong 499177 66884 6 Weak -- -- Strong -- --
B6 PG 76-34 15 Weak 19763 9573 (Elvaloy) Strong 184259 57606 6 Weak 10067 4444 Strong 53530 20568
C6 PG 76-28 15 Weak 4363 1009 (SBS) Strong 396388 37861 6 Weak 12561 3071 Strong 223267 42992
B3 PG 76-28 15 Weak 15027 4520 (Elvaloy) Strong 607824 88489 6 Weak 43920 16743 Strong 315076 101988

55
4.6 Derivation of New Specification Criteria
Mechanistic Binder Specification Framework
The mechanistic approach for fatigue resistance should incorporate the following
parameters: traffic speed, traffic volume, pavement structure and temperature. As
discussed earlier, these parameters are essential to characterize the fatigue life of binders.
Table 4.6 depicts a specification framework in which the parameters mentioned are
explicitly included in the grading system. In the following sections an example of how
such a system can be implemented in Wisconsin is presented.
Table 4.6 Example of a Mechanistic Binder Specification Framework for Fatigue Resistance that
Includes Pavement Design Temperature, Traffic Conditions and Pavement Structure
Traffic Level (Millions
ESALs)
L M H Purpose Test
Parameter
AASHTO
Method
Testing
Rate
Testing
Stress
Testing
Temp
ºC
Criteria
<1.0 1.0-
3.0 >3.0
Test on RTFO and PAV Aged Binder
Fatigue
Resistance
Cyclic
stress time
sweep
TP5
Loading
rate
(rad/s)
Stress
amplitude
strong/
weak
Np20
Traffic
Speed: Fast 100
50 kPa /
100 kPa
IT Minim. (g) (h) (i)
Traffic
Speed: Slow 10
50 kPa /
100 kPa IT Minim. (g)/10 (h)/10 (i)/10
Note: In the best judgement of NCHRP9-10, the following limits are recommended:
(g) = 5000, (h) = 15000, (i) = 45000
Traffic and Weather Information
The temperatures selected for testing are 15ºC and 6ºC as discussed earlier. 15ºC
is selected to characterize the cumulated fatigue damage that would occur in the
pavement during the complete spring season. 15ºC is very close to the average spring
temperatures in south east Wisconsin, the most populated area of the state. Spring is a
critical season for fatigue analysis due to the decreasing in the soil bearing capacity after
the thaw season.

56
6ºC is chosen to take into account the fatigue damage induced in the pavement
during the thaw season itself. 6ºC represents approximately the temperatures in the
pavement for the thaw season in south east Wisconsin. Thaw season is important to
consider since bigger stresses are induced in the pavement in this period. The thaw effect
provokes deterioration in the bearing capacity of the structure underneath the asphalt
layers so the deformations are higher under the same traffic loads.
The six levels of traffic volume recognized on Wisconsin highways were used for
deriving the fatigue specifications. The traffic levels considered are shown in the second
column of Table 4.10, in accordance to the Wisconsin PG Binder Selection Criteria.
Two different traffic speeds were considered. High speed equal to 60 mph (10 Hz
testing frequency), which is 5 miles per hour lower than the maximum allowable traffic
speed in Wisconsin. Low speed equal to 15 mph (2.5 Hz testing frequency), for taking
into account the slow movements of traffic in urban areas.
Deriving Field Conversion Factors
The approach used for deriving the field conversion factors for fatigue is different
from the one used for rutting. The current recommendations for the selection of binders
specify the high temperature of the PG grading suitable for each level of traffic. These
specifications are focused mainly in the rutting performance. This was a big advantage
for determining the rutting field factors. It allowed relating traffic volumes with a specific
high temperature PG grade.
However, for the fatigue there is not a direct way to relate the binder performance
with the expected pavement life. A new approach was selected for this distress. The field
correlation factors were obtained considering the fatigue performance only. Specifically,
the relationship between the binder fatigue performance and the expected life of the
binder in service was developed relating the Np20 binder values with the traffic levels. The
worst performing binders were assigned to the lower levels of traffic volume and the best
performing binders were assigned to the higher volumes of traffic. In order to simplify
the derivation of the field conversion factors, only four levels of traffic were used, instead
of the six levels that will be used in the final specifications. The four levels of traffic
considered are shown in column 4 of Table 4.8. This procedure, that could seem

57
arbitrary, has a logical foundation. The binders tested are binders that have been used in
the construction roads in Wisconsin, so they meet the current specifications. What it is
done in the present analysis is reorganizing the binders and assigning them to each traffic
category considering the fatigue performance in terms of NP20. On the other hand, this
was found to be the only available way to relate binder performance to pavement life.
Further field studies are recommended to validate the assumptions presented here and to
obtain more accurate relationships between laboratory and field performance.
When determining the field correlation factor between Np20 and ESALs, it cannot
be assumed that the pavement structure will be strong of weak. Assuming a weak
pavement structure would be too conservative, especially for the high volume roads.
Considering a strong pavement structure would be not very safe for the low volume
roads. There is not a perfect answer for this problem. It was decided that the best
alternative was considering an average pavement structure for the calculation of the field
correlation factors. An average pavement structure means a structure where the binder
would be subjected to an average energy level under the traffic loads. The average energy
level (Wia) was selected as the mean value between the weak (Wiw) and strong (Wis)
energy levels, as shown in equation 7.
2isiw
iaWW
W+
= ; eq.7
The traffic speed assumed for determining the correlation factors is the standard
highway speed, which corresponds to the high speed defined in the present work. The
high traffic speed corresponds to the standard speed to most of the road projects, so it was
assumed to be more representative. Also, deriving the field validation factors from the
high speed is more conservative than using the slow speed. The required NP20 values are
higher when the fast speed is used to derive them. Using the values of Wiw and Wis shown
in Table 4.4, the values for Wia for 6ºC and 15ºC were obtained. The calculated values
were:
• Wia 6ºC = 33010 [Pa]
• Wia 15ºC = 27251 [Pa]

58
The values shown above were rounded to 35000 Pa and 25000 Pa for 6ºC and
15ºC respectively. The corresponding NP20 values were calculated by using the
correlation shown in equation 5 and the K1 and K2 values for each binder shown in Table
4.1. Table 4.7 shows the Np20 values for each of the binders using the average energy
input.
The binders were divided into four groups according to their Np20 values, for each
of the testing temperatures. The four groups are shown in Table 4.8. The fourth column
of Table 4.8 shows the range of Np20 values for each group. The binders with the lower
Np20 values were assigned to the lower levels of traffic. The binders with the higher Np20
values were related to the higher volumes of traffic. The levels of traffic used for this case
were the same previously used for rutting. The four levels of traffic volume considered
here are shown in the fourth column of Table 4.8.
Once the binders were grouped, the average Np20 value was calculated for each
group and for each temperature. The average Np20 value of the group was related to the
corresponding level of traffic volume. Table 4.9 shows the Np20 values for each of the
binder groups and for each of the temperatures.
The correlation between the group Np20 values and the corresponding ESALs
shown to be good for a power relationship. Figure 4.6 shows the plots of the Np20 versus
ESALs. The correlation coefficients are equal to 0.98 and 0.89 for 15ºC and 6ºC
respectively.

59
Table 4.7 Np20 Values for Average Pavement Structure
Binder Code PG Grade (Modification)
Testing Temp. [ºC]
Estimated Np20 at Average Wi
B7 PG 58-40 15 31233 (Elvaloy) 6 18090
B9 PG 58-34 15 19353 (Elvaloy) 6 29252
D4 PG 58-34 15 29533 (SB) 6 26071
D5 PG 64-40 15 6822 (SB) 6 1713
C5 PG 58-28 15 29187 (Non Modified) 6 40575
B5 PG 64-34 15 50928 (Elvaloy) 6 41238
D2 PG 64-34 15 201486 (SB) 6 158026
A3 PG 64-28 15 54401 (SBS) 6 279398
B2 PG 64-28 15 65629 (Elvaloy) 6 134329
D1 PG 64-28 15 59668 (SB) 6 32367
D6 PG 70-34 15 62977 (SB) 6 152679
B8 PG 70-34 15 32790 (Elvaloy) 6 26212
C4 PG 64-22 15 74439 (SBS) 6 73342
C2 PG 70-28 15 83674 (SBS) 6 56269
A1 PG 70-28 15 16996 (SBS) 6 30840
B4 PG 70-28 15 66884 (Elvaloy) 6 --
B6 PG 76-34 15 57606 (Elvaloy) 6 20568
C6 PG 76-28 15 37861 (SBS) 6 42992
B3 PG 76-28 15 88489 (Elvaloy) 6 101988

60
Table 4.8 Grouping of Binders and Traffic Levels for Fatigue Field Conversion Factors
Group Number Binder Grouping 15ºC Binder Grouping 6ºC Range of Values for Np20 Traffic Level
B9 (PG 58-34) B7 (PG 58-40) 1 D5 (PG 64-40) D5 (PG 64-40) 0 – 25,000 500,000 A1 (PG 70-28) B6 (PG 76-34) B7 (PG 58-40) B9 (PG 58-34)
2 D4 (PG 58-34) D4 (PG 58-34) 25,000 – 40,000 5,000,000 C5 (PG 58-28) D1 (PG 64-28) B8 (PG 70-34) B8 (PG 70-34) C6 (PG 76-28) A1 (PG 70-28)
B5 (PG 64-34) 3 A3, B2, D1 (PG 64-28) 40,000 – 70,000 20,000,000 D6 (PG 70-34) B4 (PG 70-28) B6 (PG 76-34)
C5 (PG 58-28) B5 (PG 64-34) C2 (PG 70-28) C6 (PG 76-28)
D2 (PG 64-34)
4 A3, B2 (PG 64-28) + 70,000 50,000,000 C4 (PG 64-22) D6 (PG 70-34)
D2 (PG 64-34) C4 (PG 64-22) C2 (PG 70-28) B3 (PG 76-28)
B3 (PG 76-28)
Table 4.9 Np20 Values for Each Binder Group and Temperature
ESALs Average Binder Ave. Np20 Ave. Np20 [Millions] ESALs Group 15ºC 6ºC
0 - 1 500000 1 14390 13457 1 - 10 5000000 2 32121 28948 10 - 30 20000000 3 59727 45268
30 + 50000000 4 112022 149960

61
Figure 4.6 Np20 versus Allowable ESALs, Average Pavement Structure
The field conversion factors are represented by the slope of the trend lines shown
in the Figure 4.6. It can be seen that there is as slightly different trend for each of the
temperatures. The Np20 values for 6ºC are a little lower than the ones at 15ºC for the low
volume traffic. For the high volume traffic, however, the Np20 is a little bit higher for
6ºC than for 15ºC.
4.7 Binder Criteria for Fatigue and Ranking of Binders
The proposed binder fatigue criteria was derived using the relationships shown in
Figure 4.6. A minimum Np20 value was obtained for each traffic category. The required
Np20 does not depend neither on the pavement structure nor on the traffic speed. Since
Np20 is related to the number of repetitions that the pavement will have to support during
its service life, the Np20 depends on the traffic volume only.
The required Np20 values were obtained by operating the average volume of each
traffic range by the corresponding field conversion factor (15ºC or 6ºC). For example, the
minimum value of Np20 specified for the traffic range from 1 to 3 millions ESALs is the
y = 45.37x0.43
R2 = 0.98
y = 22.79x0.47
R2 = 0.89
1000
10000
100000
1000000
100000 1000000 10000000 100000000
ESAL
Np 2
0
6ºC15ºCPower (15ºC)Power (6ºC)
62
one calculated using 2 million ESALs. Columns 4th and 5th of Table 4.10 show the
specified Np20 values for each level of traffic volume and speed.
Once the required Np20 values are known for a determined level of traffic, the
applicable binders can be obtained for each pavement structure. For each binder, the Np20
at the corresponding pavement structure, pavement temperature and traffic speed has to
be compared with the required Np20, at the selected traffic level. The applicable binders
for each condition are shown in columns 6th to 9th of Table 4.8. For example, lets
determine if B5 (PG 64-34, elvaloy) is suitable for 15ºC, strong structure, slow traffic
speed and 20 million ESALs traffic volume. The Np20 of B5 for 15ºC, strong structure
and slow traffic speed is equal to 50928 (Table 4.5). The minimum Np20 required for 20
million ESALs, 15ºC and slow traffic speed is 62548 (Table 4.10), so B5 does not satisfy
the requirements. It means that according to the proposed criteria, B5 is will not have 20
million ESALs service life (fatigue life) under such pavement conditions and traffic
speed. Column 8 of Table 4.10 (slow speed) shows B5 in the 3 – 10 million ESALs
range. This means that the binder, under the mentioned conditions, can be used for any
traffic volume up to 10 million ESALs without experiencing significant fatigue damage.
The results reflect clearly how the pavement structure affects the performance of
the binders. For each temperature and traffic speed, when one binder is applicable for a
determined traffic volume category for strong structure, then the same binder is
applicable for a traffic volume between 3 and 5 categories lower for weak structure. This
trend can be verified in Table 4.10 for most of the binders by comparing the position in
which they are in column 6 (or 8) respect to the position they are in column 7 (or 9).
The ranking of the binders is similar for both of the temperatures considered. In
both cases, the binders show similar variations in categories with changing from strong to
weak structure. However, for 6ºC and weak structure, it can be observed that more
binders are suitable for higher traffic levels that for 15ºC and weak structure. None of the
binders seem to be adequate for traffic volumes higher than 3 million ESALs for 15ºC
and weak structure. However, for 6ºC and weak structure, it is possible to find some
binders applicable until 30 million ESALs or more (D2).

63
The variations with traffic speed follow the expected trend for both structures and
temperatures. In each case, a binder applicable for a determined traffic category under
fast traffic is applicable for a traffic level 1 to 3 categories lower for low speed. This can
be visualized comparing the position where the binders are in the upper part (fast speed)
respect to the lower part (slow speed) of columns 6 to 9 in Table 4.10.
Table 4.10 Binder Criterion for Fatigue and Ranking of Binders
Minimum Np20 Applicable Binders 15ºC Applicable Binders 6ºC
Speed
Volume
Range
[million
ESAL]
Average
Volume
[million
ESAL] 15 [ºC] 6 [ºC]
Strong
Structure
Weak
Structure
Strong
Structure Weak Structure
0 - 0.3 0.15 7629 6173 D4, B2, B5, B7,
C5, B4, A3, B8
B7, D1, A1, D4,
B6
0.3 - 1.0 0.65 14332 12297 C4, D1, D6, B3,
B6, C2 C6, B9
Fast 1.0 - 3.0 2 23239 20856 D5 D2 C2, B5, C5, D6
(60 mph) 3.0 - 10 6.5 38576 36292 B9, B6 B2, B3, C4
10.0 - 30.0 20 62548 61550 B7, B9, D4, C5 B7, C5, D4
> 30.0 50 92753 94680
B5, A3, D1, B8,
A1, C6, D6, C4,
C2, B4, B6, B3,
B2, D2
B5, A3, D1, B8, A1,
C6, D6, C4, C2, B4,
B3, B2, D2
D2, A3
0 - 0.3 0.15 7629 6173 C4, B6 B5, B2, C5
0.3 - 1.0 0.65 14332 12297 B9, A1 B7 B9, C2, B3
Slow 1.0 – 3.0 2 23239 20856 D4, C5, B7, B8,
C6
B9, D4, B8, B6, D1,
A1 C4
(15 mph) 3.0 - 10 6.5 38576 36292 B5, A3, D1, B6 C6, B5, C5, C2 A3
10.0 - 30.0 20 62548 61550 D6, C4, C2, B4,
B3, B2 C4 D2
> 30.0 50 92753 94680 D2 B3, D6, A3, B2, D2
NOTE: The table presents only the maximum traffic volume that the binders can resist for the different conditions. The binders are applicable for any traffic level lower or equal to the one presented in the table for the corresponding pavement conditions and traffic speed.

64
A general trend can be observed with respect of the hardness of the asphalt and
the fatigue performance according to the proposed criteria. It seems that the softer
asphalts have lower fatigue life than the harder ones. This is clearly evidenced for strong
structure, 15ºC and fast speed. In this case, all the binders that are not applicable for the
highest traffic category are the softer binders of the tested universe (PG 58-40, PG 58-34,
PG 64-40, PG 58-28). This is tendency is contrary to the Superpave criteria, where it is
assumed that softer asphalts would have better fatigue performance than harder asphalts,
for a given testing temperature.
4.8 Proposed Binder Specifications for Fatigue
The proposed specification criteria for fatigue was derived from Table 4.10. The
calculated Np20 values were rounded before being included in the specification. Table
4.11 shows the proposed specification for the Wisconsin state, which follows the
framework presented before in Table 4.6. It provides a framework for selecting a binder
suitable for a specific traffic speed, traffic volume, pavement structure and pavement
temperature.
Table 4.11 Proposed Specifications for Fatigue Performance of Binders
Input Energy Testing Traffic Level (Millions ESALs) Binder Requirements for
Fatigue Resistance Temperature 0 - 0.3 0.3 - 1 1 - 3 3 -10 10 - 30 > 30
Test on RTFO and PAV Aged Binder
Traffic Speed [mph] Strong
[Pa]
Weak
[Pa] [ºC] Minimum Np20
15000 40000 15 7500 15000 25000 40000 65000 9500060
25000 45000 6 6000 12000 20000 35000 60000 95000
25000 55000 15 7500 15000 25000 40000 65000 9500015
35000 60000 6 6000 12000 20000 35000 60000 95000
It should be mentioned again that the testing is always carried out at 10 Hz,
independently of the traffic speed of the projected road. Only the input energy is changed
for including the speed effect, as explained earlier.

65
4.9 Summary of Findings for the Binder Fatigue Study
• The results obtained for the ranking of binders according to the proposed criteria are
reasonable. The binders show better performance for strong structure than for weak
structure. This was expected since in strong structures the failures are often due to
rutting instead of fatigue (or low temperature cracking). Also, the binders show
better results when the traffic is fast than when the traffic is slow.
• Considering the traffic speed by changing the input energy only is a very
convenient approach. Since all the testing is done at high frequency (10 Hz), the
time of testing is reduced considerably.
• The fatigue resistance of binders, as measured by the Np20 values, shows a great disparity in fatigue
performance for binders of the same PG grade. This is another proof that the PG grade is not a good
indicator of binder contribution for fatigue resistance in asphalt mixtures. The binder fatigue results
show a significant effect of temperature and pavement structure for these binders.
• The proposed limits are derived based on assumptions and approximations that may
or may not be completely valid. The assumption that for the strong structure the
binder perform in the linear range and for weak structure in the non linear range
might not be very accurate. If a better approximation of the real stress (strain) in the
pavement is known, it should be used for determining the initial input energy.
• The proposed criteria and limits are considered as a starting point for further
evaluation by the State Highway Agencies and the Industry. Research is carried out
currently in order to validate the field conversion factors assumed in this work.

66
CHAPTER 5: LOW-TEMPERATURE CRACKING
5.1 Background
Transverse cracking is a common failure that is observed as cracks that are nearly
straight across the pavement, perpendicular to the direction of traffic. These cracks are
mainly caused by stresses produced by temperature excursion (thermal stresses). The
stress is believed to be produced by a single low-temperature excursion which, when
causes the thermal shrinkage stresses to exceed the tensile strength of the pavement
material, a crack will appear.
In this study, the failure properties and related thermal properties of the binders
included in this study (commonly used in the state of Wisconsin) were determined by
using laboratory testing. Based on these properties, the thermal cracking temperatures
were estimated. The direct tension tests (DTT) were conducted in order to measure
strength and strain tolerance of the binders. The bending beam rheometer (BBR) was
used to acquire the rheological property of the binders as recommended by the Superpave
system. In addition to these tests, the glass transition tests (GTT) were also conducted to
evaluate the thermal coefficients of contraction and the glass transition temperature. The
GTT test is a testing system for measuring the thermo-volumetric properties of asphalt
binders allowing measuring change in volume with temperature. The ultimate purpose of
this study is to establish the PG binder selection guidelines to enhance contribution of
binders to resistance of cracking in the field.
5.2 Theory and Experimental Plan
The failure properties of the binders were measured using the latest direct tension test procedure as
specified in the AASHTO TP3-98 and the follow up procedure explained in MP1a. The procedure was
however expanded to include three strain rates at each of the three temperatures. Figure 5.1 presents an
example of the data generated for the failure properties. The data represent failure stress and failure strain
that are shifted along the loading time scale to produce failure master curves. The shifting is done with the
time-temperature shift factors estimated from the bending beam rheometer. These master curves are
necessary to estimate the critical cracking temperature based on the stress at failure and the strain at failure.
This approach, which is compatible with the recommendations of the Binder Expert Task Group,
was also extended such that the analysis includes the strain at failure criterion, which is not considered in

67
AASHTO MP1a. The approach also considers the effect of cooling rates and solves the problem of
matching the rate of cooling in the development of stress build-up to that in estimating strength or strain at
failure. In the analysis procedure, the thermo-volumetric properties of binders including the glass-transition
temperature are needed. Instead of making assumptions about these properties, as is recommended in
AASHTO MP1a, the glass transition testing device was used to measure these properties and incorporate
them in the analysis.
Figure 5.1 Failure Stress and Strain Data and Master Curves for C5 Binder
The dilatometric glass-transition temperature (Tg) was measured using a testing
procedure employed originally in the SHRP A-002A project. The Tg measurements
include the change in volume as a function of temperature between +40 and -76°C.
Figure 5.2 shows an example of the glass-transition measurements conducted in this
project and the curve fitting , which was used to estimate the parameters.
A computer program was developed to better control the glass-transition device,
to fit the data, and to calculate the parameters. In the program, the following model is
0.0
1.0
2.0
3.0
4.0
5.0
1E-04 1E-03 1E-02 1E-01 1E+00 1E+01 1E+02
Reduced Time at Failure (seconds)
σ fT 0
/T (M
Pa)
0.0
3.0
6.0
9.0
12.0
15.0
ε f (%
)
-12 C-18 C-24 C-30 CStress Fit-12 C-18 C-24 C-30 CStrain Fit
C5 PG 58-28 (R) T0 (C) = 0σfT0 /T = s0/{1+[(log(ξf+s1)-s2)/s3]
2}s0 = s1 = s2 = s3 = R2 =
3.0171 2.038E+00 0.2993 0.1184 0.8012εf = e0 [1+(ξf/e1)e2 ]e3
e0 = e1 = e2 = e3 = R2 =0.1200 2.422E-01 0.189 4.0140 0.8818

68
used to estimate αl, the coefficient of contraction above the glass-transition temperature;
the glass-transition temperature, Tg, and αg, the coefficient below Tg:
[ ]{ }RTTRTTcv gglggv /)(exp1ln)()( −+⋅−+−+= ααα
Here, v is the specific volume change, cv is a constant, and R is a regression
constant related to the rate of the volume change at and near the glass-transition
temperature, Tg. This model was used during the SHRP program for the same purpose.
As shown in Figure 5.2, the system collects the data from two samples simultaneously,
and the data from both replicates are used to fit the model. The starting temperature is
40°C, and the minimum temperature is -76°C. The data generated are used to quantify the
effects of modifiers on the thermal behavior of asphalt binders.
Figure 5.2 Glass Transition Measurement of C5 Binder
The low-temperature failure properties are represented by critical cracking
temperatures. These are based on the concept that cracking will occur when thermal
-70,000
-60,000
-50,000
-40,000
-30,000
-20,000
-10,000
0
-80 -60 -40 -20 0 20 40
Temperature (C)
Spec
ific
Volu
me
Cha
nge
(1e-
6ml/g
)
Cell 0
Cell 1
AverageFit
C5 PG 58-28 Tv0 (C) = 40v=cv+ag(T-Tg)+R(al-ag)ln{1+exp[(T-Tg)/R]}cv = Tg(C) = R = ag(10-6/C) = al(10-6/C) = R2 =
-40392 -31.15 8.204 376.1 567.7 0.9998
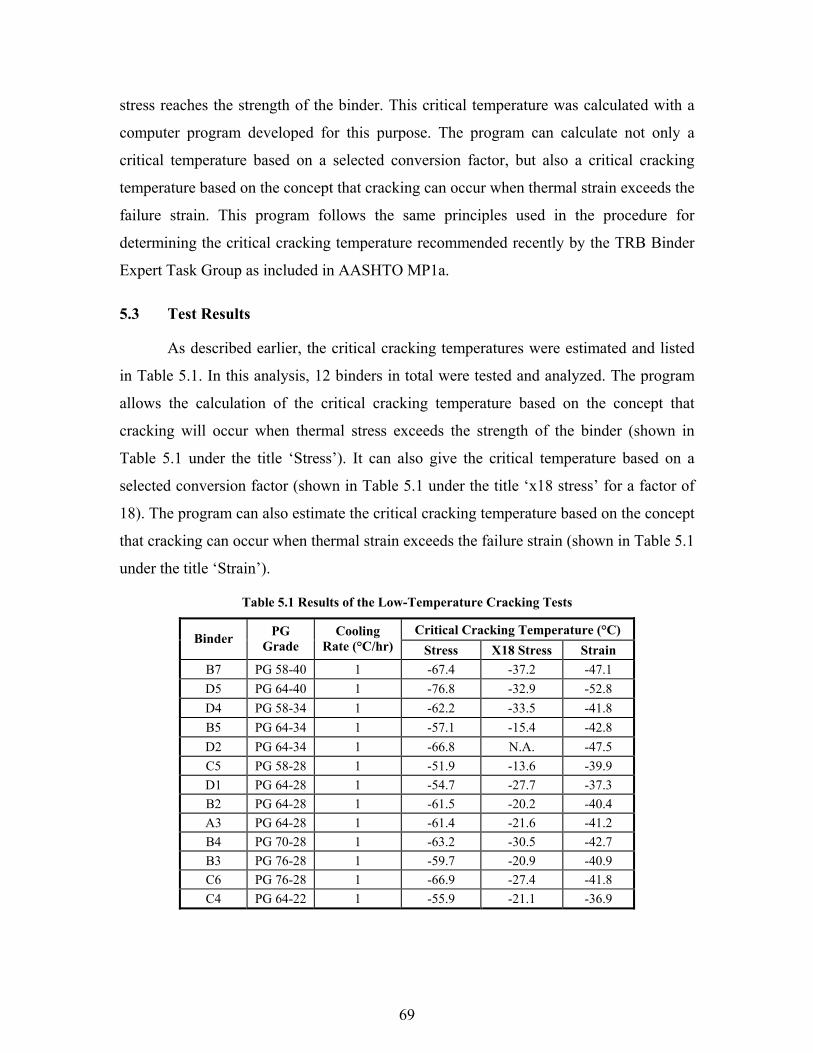
69
stress reaches the strength of the binder. This critical temperature was calculated with a
computer program developed for this purpose. The program can calculate not only a
critical temperature based on a selected conversion factor, but also a critical cracking
temperature based on the concept that cracking can occur when thermal strain exceeds the
failure strain. This program follows the same principles used in the procedure for
determining the critical cracking temperature recommended recently by the TRB Binder
Expert Task Group as included in AASHTO MP1a.
5.3 Test Results
As described earlier, the critical cracking temperatures were estimated and listed
in Table 5.1. In this analysis, 12 binders in total were tested and analyzed. The program
allows the calculation of the critical cracking temperature based on the concept that
cracking will occur when thermal stress exceeds the strength of the binder (shown in
Table 5.1 under the title ‘Stress’). It can also give the critical temperature based on a
selected conversion factor (shown in Table 5.1 under the title ‘x18 stress’ for a factor of
18). The program can also estimate the critical cracking temperature based on the concept
that cracking can occur when thermal strain exceeds the failure strain (shown in Table 5.1
under the title ‘Strain’).
Table 5.1 Results of the Low-Temperature Cracking Tests
Critical Cracking Temperature (°C) Binder PG Grade
Cooling Rate (°C/hr) Stress X18 Stress Strain
B7 PG 58-40 1 -67.4 -37.2 -47.1 D5 PG 64-40 1 -76.8 -32.9 -52.8 D4 PG 58-34 1 -62.2 -33.5 -41.8 B5 PG 64-34 1 -57.1 -15.4 -42.8 D2 PG 64-34 1 -66.8 N.A. -47.5 C5 PG 58-28 1 -51.9 -13.6 -39.9 D1 PG 64-28 1 -54.7 -27.7 -37.3 B2 PG 64-28 1 -61.5 -20.2 -40.4 A3 PG 64-28 1 -61.4 -21.6 -41.2 B4 PG 70-28 1 -63.2 -30.5 -42.7 B3 PG 76-28 1 -59.7 -20.9 -40.9 C6 PG 76-28 1 -66.9 -27.4 -41.8 C4 PG 64-22 1 -55.9 -21.1 -36.9

70
-90.0
-80.0
-70.0
-60.0
-50.0
-40.0
-30.0
-20.0
-10.0
0.0PG 58-
40PG 64-
40PG 58-
34PG 64-
34PG 64-
34PG 58-
28PG 64-
28PG 64-
28PG 64-
28PG 70-
28PG 76-
28PG 76-
28PG 64-
22
B7 D5 D4 B5 D2 C5 D1 B2 A3 B4 B3 C6 C4
Binder
Cra
ckin
g Te
mpe
ratu
reStress
X18 Stress
Strain
Figure 5.3 Estimated Cracking Temperatures Sorted by Criteria
Figure 5.3 illustrates the estimated cracking temperature sorted by each criterion
based on the results shown in Table 5.1. From this Figure, it can be clearly seen that the
cracking temperatures are highly dependent on the criterion used. The conversion factor
can have an important effect that is not directly proportional to the value of the factor
used and the strain criterion can give a different ranking for the binders of the same PG
grade.
Table 5.1 and Figure 5.3 show that the B7 and D5 binders have better resistance
to low-temperature cracking compared to the other modified binders and unmodified
binder. Despite having the same low PG grade, all the tested binders of the PG xx-28
show variations in the estimated cracking temperatures; 15°C, 17°C, and 5°C for Stress,
x18 stress, and Strain criteria, respectively. The unmodified binder, C5, shows the highest
cracking temperatures in Stress and x18 stress criteria while another binder, C4, turns to
be the lowest resistance to the cracking temperature under Strain criteria.

71
-80
-70
-60
-50
-40
-30
-20
-10
0PG 58-28 PG xx-40 PG xx-34 PG xx-28 PG xx-22
Binder PG Grade
Cra
ckin
g Te
mpe
ratu
re (C
)Stress
x18 Stress
Strain
Figure 5.4 Comparison between the PG grades
The average cracking temperatures of the binders for each low PG grade are
compared in Figure 5.4. The first binder is one of the PG 58-28 that is most commonly
used and the rest are the averages of each PG grade. This Figure indicates that there is a
significant effect of the grade on the critical cracking temperature; that is, the binders of
the lowest PG grade show the lowest cracking temperatures while the highest cracking
temperatures are observed from the binders of the high PG grade. And this clear
distinction between the PG grades could allow constructing the linear relation between
the grade and the cracking temperature, which is used to establish the binder selection
criteria for low-temperature cracking.
In addition to the estimation of the low cracking temperatures, the effect of
modification on binder properties was evaluated in terms of the glass transition behavior.
These results are generated to be used in estimating the critical cracking temperatures.
Table 5.2 shows the glass transition properties of all the tested binders. The range in the
glass transition temperatures is between a low value of -55.8°C for D5 (PG 64-40 with
SB modifier) and a high value of -21.3 °C for D4 (PG 58-34 with SB modifier).

72
Table 5.2 Summary of Glass Transition Measurements
Binder PG Grade Tg (°C) ag(10-6/°C) al(10-6/°C)
C5 PG 58-28 -45.8 125.8 599.3 B3 PG 76-28 -24.0 427.5 574.4 A3 PG 64-28 -31.2 376.1 567.7 B2 PG 64-28 -42.4 234.7 504.4 D1 PG 64-28 -29.5 291.8 550.4 C4 PG 64-22 -27.2 345.8 527.6 B5 PG 64-34 -46.9 399.8 568.6 D2 PG 64-34 -32.4 316.1 577.5 B8 PG 70-34 -37.1 273.5 551.8 A1 PG 70-28 -25.6 329.5 596.4 B4 PG 70-28 -28.2 348.4 535.4 C2 PG 70-28 -26.7 424.1 531.7 B6 PG 76-34 -34.6 281.2 473.2 B7 PG 58-40 -53.9 258.8 574.5 B9 PG 58-34 -42.4 411.0 604.8 D4 PG 58-34 -21.3 389.5 548.7 C6 PG 76-28 -28.7 369.8 577.3 D5 PG 64-40 -55.8 326.1 566.1
As expected, two binders of the PG xx-40 grade show the lowest level in Tg,
while on average the binders of the PG xx-28 have the high Tg values. Intuitively, the
binders between these two grades show the medium level of Tg values.
However, such Tg values within the same PG grade reveal the significant
difference of one binder to the other. For example, Tg values for the binders of the PG
xx-28 vary ranging from –24°C to – 45.8°C. For the binders of PG xx-34, the difference
in Tg is even greater than that of PG xx-28 binders, ranging from –21.3°C to –46.9°C.
Therefore, it can be said that the glass transition temperatures are highly dependent on
their modifier type and its grade. However, the great variation in the Tg values exists
even within the same grade.
Table 5.2 also shows the coefficients of thermal contractions above and below the
glass transition. It is observed that there is a significant difference in the coefficients of
contraction between each binder. The coefficients below the Tg range from 125.8 10-6/°C
for C5 to 427.5 10-6/°C for B3 while the coefficients above the Tg have less variation
ranging from 473.2 10-6/°C for B6 to 604.8 10-6/°C for B9.

73
5.4 Construction of Binder Selection Criterion for Low-Temperature Cracking
As described earlier, the binder selection criterion for low-temperature cracking is
derived from the relation between the estimated cracking temperatures and the PG grades.
Figure 5.5 shows the linear relationship between these variables, the estimated cracking
temperatures and the PG grades. Each point shown in the Figure is the average value of
the cracking temperatures from the binders of the same low PG grade. Because we
consider three different criteria of cracking, there are three linear relationships
accordingly as shown in Figure 5.5. Among these three categories of thermal cracking,
the conversion factor of ‘x 18 stress’ has been ruled out due to its relatively low
correlation compared to the other criteria. Thus, two relationships have been selected as
the low-temperature cracking criteria as follows:
1.07 x A + 36.0 < Low PG grade temperature of the region for ‘Stress’ analysis
1.38 x B + 28.0 < Low PG grade temperature of the region for ‘Strain’ analysis
Here, A denotes the estimated critical cracking temperature under the ‘Stress’
criterion from the tested binder while B is the estimated critical cracking temperature
under the ‘Strain’ criterion. For example, the binder ‘C5’ has the estimated critical
cracking temperatures of -51.9 and -39.9C for the ‘Stress’ and ‘Strain’ criteria,
respectively. If these values are used as input for the low-temperature cracking
temperature criteria described above, the temperatures of -15.5 and -27.1C are estimated
for these two criteria. The decision for the use of this binder then can be made based on
these temperatures. Since the highest low PG grade temperature is -28C, this binder is not
adequate to be used in the areas of Wisconsin. Using the same procedure, every tested
binder is analyzed to see whether it is useful for a certain climate condition. Table 5.3
shows each binder’s usable performance based on its critical cracking temperatures.

74
y = 1.07x + 35.64R2 = 0.90
y = 1.38x + 28.35R2 = 0.98
y = 1.11x - 2.18R2 = 0.80
-45
-40
-35
-30
-25
-20
-15
-10-80.0-70.0-60.0-50.0-40.0-30.0-20.0-10.00.0
Thermal Cracking Temperature (C)
PG G
rade
Tem
peat
ures
Stress
x18 Stress
Strain
Linear (Stress)
Linear (Strain)
Linear (x18 Stress)
Figure 5.5 Linear Relationships between Critical Temperature and PG Grade
In Table 5.3, the ‘x’ denotes that the binder is applicable for the region of interest;
meanwhile, the ‘blank’ means that the binder is not appropriate to be used. The ‘?’ shows
that the binder is questionable for use because either of critical cracking temperatures for
‘Stress’ and ‘Strain’ criteria does not meet the minimum required temperature for the
area. From Table 5.3, it can be seen that some binders are applicable to the areas of
interest according to their PG grade while the rest do not meet the requirement for the
assigned regions based on their PG grade such as B7, D4, B5, C5, and D1. It also appears
that D5 performs best among the selected binders. Meanwhile, C5 and D1 show the least
performance.

75
Table 5.3 Applicability of Tested Binders for Low-Temperature Cracking
Estimated Cracking Temperature (C) Region of PG grade
Binder PG Grade
Stress Strain PG 58-28 PG 58-34 PG 52-40
B7 PG 58-40 -36.1 -37.0 xa x D5 PG 64-40 -46.2 -44.9 x x x D4 PG 58-34 -30.6 -29.7 x B5 PG 64-34 -25.1 -31.1 ?b D2 PG 64-34 -35.5 -37.6 x x C5 PG 58-28 -19.5 -27.1 D1 PG 64-28 -22.5 -23.5 B2 PG 64-28 -29.8 -27.8 x A3 PG 64-28 -29.7 -28.9 x B4 PG 70-28 -31.6 -30.9 x B3 PG 76-28 -27.9 -28.4 x C6 PG 76-28 -35.6 -29.7 x ? C4 PG 64-22 -23.8 -22.9
ax denotes applicable
b? denotes questionable

76
CHAPTER 6: SUMMARY OF FINDINGS AND RECOMMENDED FUTURE WORK
6.1 Summary of Findings
The following findings are sorted by test type.
a) The results of the PAT test indicate that the test is an acceptable procedure that could be used
to detect particulates in asphalts. They also indicate that the binders used in Wisconsin do not
contain high level of particulates. Those that contain a significant amount that is not soluble in
octane, they are soluble in toluene and thus are mostly soluble or dispersible in asphalt. Since the
effect of solid additives needs to be considered, it is recommended that the PAT test is used as a
screening test in future specifications for asphalts in Wisconsin.
b) The results of the LAST test indicates that this test is useful in studying the effects of storage
stability with or without agitation. The test is however very time consuming and requires a long
testing time. It is recommended that this test should be conducted by the suppliers of modified
binders on samples delivered to the HMA production facility and reported to the highway agency.
Since storage stability is a property of the binder and modifier, the results are not likely to change
unless the modifier or binder source is changed. The test can also be used for conflict resolution
when binders do not perform as expected.
c) Regarding the results of binder rutting, the following points represent the summary of
findings for this part of the study
• For binders with high visco-elasticity, the difference between total energy and energy
dissipated in viscous flow could be very large and thus G*/sinδ cannot rank binder
correctly with respect to rutting resistance.
• To estimate energy dissipated in viscous flow, a non-reversible cyclic loading is needed.
Such loading is attained by the repeated creep testing in which an asphalt is allowed to
recover and thus physically separate permanently dissipated energy from delayed elastic
stored energy. The parameter Gv is proposed to evaluate the viscous component of the
creep stiffness.

77
• It is observed that the values of Gv vary highly depending on the modification type.
Because of the significant range in Gv for these binders, the concerns about the PG grading
system not being able to identify better performing modified asphalts are valid.
• Modified binders can deteriorate after RTFO aging. The proposed guidelines suggest the
checking of the Gv value before and after primary aging. This procedure allows rejecting
materials that soften too much after aging. Although the consequences of this softening are
not known in terms of pavement performance, it could mean degrading of polymers, which
cannot be considered beneficial.
• The criteria proposed allow consideration of traffic speed and volume without grade
bumping. The adjustment factors for these conditions are derived based on field conversion
factors and mechanistic understanding of the parameters used in the criteria.
• The criteria proposed for binder rutting are based on field conversion factors derived from a
limited amount of data. The limits are derived based on assumptions and approximations
that may or may not be completely valid. The limits are considered as a starting point for
further evaluation by the Wisconsin DOT and the Industry. It is hoped that a major field
study will be initiated to collect enough data to derive more reliable field conversion
factors.
d) Regarding the results of binder fatigue the following points give a summary of the findings
for this part of the study:
• The fatigue resistance of binders, as measured by the Np20 values, shows a great
disparity for binders of the same PG grade. This points out that the current PG grade
testing is not a good indicator of binder contribution for fatigue resistance in asphalt
mixtures. The results show that there are significant effects of temperature and
pavement structure on the fatigue performance of binders.
• Considering the traffic speed by changing the input energy only is a very
convenient approach. Since all the testing is done at high frequency (10 Hz), the
time of testing is reduced considerably.
• The ranking of binders according to the proposed criteria agrees with trends
reported for fatigue testing of asphalt mixtures as the binders show better
performance for strong structure than for weak structure. Also, the binders show

78
better fatigue resistance when the testing frequency, which represents traffic speed,
fast than when the traffic is slow.
• The proposed limits are derived based on assumptions and approximations that may
or may not be completely valid. The assumption that the for the strong structure the
binder perform in he linear range and for weak structure in the non linear range
might not be very accurate. If a better approximation of the real stress (strain) in the
pavement is known, it should be used for determining the initial input energy.
e) Regarding the results of binder low temperature cracking, the following points give a
summary of the findings for this part of the study:
• Building on the concept of estimating critical cracking temperatures from strength and
thermal stress, as included in the AASHTO MP1a procedure, the binders in this study were
tested to estimate 2 critical cracking temperatures based on strength and strain tolerance.
The results show that these two temperatures are not the same for binders of the same
grade. It is proposed that such a procedure could give better evaluation of the contribution
of modified binders to thermal cracking of pavements.
• In this project the glass transition temperature (Tg) of binders were measured and they are
found to follow a logical trend with PG low temperature grading. Lower PG grade binders
show lower Tg. The Tg testing are necessary for better estimation of coefficients of
thermal contraction which are used in estimating cracking temperatures.
• The results indicate that using the AASHTO MP1a procedure could result in misleading
ranking of the binders. The critical cracking temperature based on the strain at failure gives
better relationship to the low temperature grading. Since no field data is available yet to
verify which procedure is better, new models for field conversion factors are introduced to
estimate critical cracking temperatures.
• The need for the TG measurements, although clear in modeling, should be validated by a
field study. The direct tension measurements collected clearly indicate that for modified
binders, the PG grading is not sufficient for comparing effects of modifiers.
6.2 Recommended Future Work
This research project was intended to deliver a revision of the current PG binder
selection guidelines used in Wisconsin. The revision includes advanced methods of
evaluating modified binders and specific procedures for considering traffic speed, traffic

79
volume, and pavement structure in the selection of binders other than grade shifting. The
revised guidelines were based on an extensive library of performance-related properties
of binders commonly used in Wisconsin. The ultimate goal of this research was to
establish initial specification limits that could serve as a base for further field validation.
Therefore, these tentative guidelines need field validation to ensure that they can be
successfully implemented and the asphalt producers can in fact deliver the recommended
grades at realistic cost. The field validation is also required to ensure that the required
testing and evaluations are truly performance-related. The focus of the field validation
research should be on the selection of experimental pavement sections in various regions
of the state to validate the guidelines and establish a database that will allow the
continuous revision and adjustment of the binder selection guideline by the WisDOT. The
tentative plans for the field validation are presented in Appendix II.
The eventual implementation of the proposed guidelines involves new
requirements for accepting binders. Therefore contractors, asphalt suppliers and DOT
staff need to be informed and eventually trained in the new testing procedures. A training
program should start with some demonstrations for the test in the University of
Wisconsin Madison or at the DOT central laboratory. This could be done by University
staff or by DOT staff after training by the researchers who participated in development of
testing systems.

80
APPENDIX I: LAST TEST RESULTS

81
Summary of Result for LAST Test
24 Hours Sampling Time, External Heat WITHOUT Agitation (Part I)
Frequency
(rad/s) 5.0 50.0 5.0 50.0
Temperature (ºC)
HT HT IT IT
A1 Rs G* Rs d Rs G* Rs d Rs G* Rs d Rs G* Rs d 1.02 1.00 1.02 1.00 1.01 0.99 1.00 0.99 Rd G* Rd d Rd G* Rd d Rd G* Rd d Rd G* Rd d 1.01 0.97 0.98 0.98 1.01 1.04 1.08 1.02
B2 Rs G* Rs d Rs G* Rs d Rs G* Rs d Rs G* Rs d 1.13 0.99 1.11 0.99 1.16 0.98 1.13 0.98 Rd G* Rd d Rd G* Rd d Rd G* Rd d Rd G* Rd d 1.05 0.97 0.99 0.98 0.99 1.01 1.00 1.02
B5 Rs G* Rs d Rs G* Rs d Rs G* Rs d Rs G* Rs d 1.08 0.99 1.07 0.99 1.08 0.99 1.08 1.00 Rd G* Rd d Rd G* Rd d Rd G* Rd d Rd G* Rd d 0.95 1.01 0.96 1.01 0.95 1.00 0.94 1.00
B6 Rs G* Rs d Rs G* Rs d Rs G* Rs d Rs G* Rs d 1.02 1.01 1.02 1.00 1.06 0.99 1.05 0.99 Rd G* Rd d Rd G* Rd d Rd G* Rd d Rd G* Rd d 0.87 1.02 0.91 1.04 1.01 1.01 1.00 1.00
B7 Rs G* Rs d Rs G* Rs d Rs G* Rs d Rs G* Rs d 0.94 1.03 0.99 1.02 0.98 1.01 0.98 1.00 Rd G* Rd d Rd G* Rd d Rd G* Rd d Rd G* Rd d 0.82 1.04 0.87 1.03 0.92 1.01 0.93 1.01
B8 Rs G* Rs d Rs G* Rs d Rs G* Rs d Rs G* Rs d 1.04 1.00 1.05 1.00 1.05 1.00 1.04 1.00 Rd G* Rd d Rd G* Rd d Rd G* Rd d Rd G* Rd d 0.86 1.05 0.92 1.04 0.95 1.00 0.95 1.00
B9 Rs G* Rs d Rs G* Rs d Rs G* Rs d Rs G* Rs d 1.23 0.96 1.15 0.97 1.17 0.98 1.14 0.98 Rd G* Rd d Rd G* Rd d Rd G* Rd d Rd G* Rd d 0.98 1.04 1.04 1.02 1.05 0.99 1.02 0.99

82
Summary of Result for LAST Test 24 Hours Sampling Time, External Heat WITHOUT Agitation (Part II)
Frequency
(rad/s) 5.0 50.0 5.0 50.0
Temperature (ºC)
HT HT IT IT
C2 Rs G* Rs d Rs G* Rs d Rs G* Rs d Rs G* Rs d 1.01 1.01 1.02 1.00 1.02 1.00 1.03 1.01 Rd G* Rd d Rd G* Rd d Rd G* Rd d Rd G* Rd d 0.98 0.99 0.97 0.99 0.89 1.00 0.90 1.01
C5 Rs G* Rs d Rs G* Rs d Rs G* Rs d Rs G* Rs d 0.89 1.00 0.89 1.00 0.84 1.05 0.89 1.10 Rd G* Rd d Rd G* Rd d Rd G* Rd d Rd G* Rd d 1.03 1.00 1.02 1.00 0.95 1.00 0.87 1.01
C6 Rs G* Rs d Rs G* Rs d Rs G* Rs d Rs G* Rs d 0.94 0.95 0.91 0.99 1.00 1.01 1.03 1.02 Rd G* Rd d Rd G* Rd d Rd G* Rd d Rd G* Rd d 1.06 0.91 0.98 0.96 0.78 1.00 0.80 1.01
D2 Rs G* Rs d Rs G* Rs d Rs G* Rs d Rs G* Rs d 1.10 0.99 1.08 0.99 1.07 0.99 1.05 0.99 Rd G* Rd d Rd G* Rd d Rd G* Rd d Rd G* Rd d 1.03 0.99 1.02 0.99 1.00 1.00 1.00 1.00
D4 Rs G* Rs d Rs G* Rs d Rs G* Rs d Rs G* Rs d 0.98 1.00 0.99 1.00 0.94 1.00 0.95 1.00 Rd G* Rd d Rd G* Rd d Rd G* Rd d Rd G* Rd d 1.32 0.98 1.26 0.98 1.34 0.97 1.25 0.97
D5 Rs G* Rs d Rs G* Rs d Rs G* Rs d Rs G* Rs d 0.65 0.73 0.43 0.77 0.09 1.01 0.10 1.14 Rd G* Rd d Rd G* Rd d Rd G* Rd d Rd G* Rd d 1.16 0.99 1.24 1.01 2.80 1.06 2.90 1.07
D6 Rs G* Rs d Rs G* Rs d Rs G* Rs d Rs G* Rs d 0.97 1.03 0.99 1.01 0.33 0.85 0.10 0.87 Rd G* Rd d Rd G* Rd d Rd G* Rd d Rd G* Rd d 1.09 0.92 0.99 0.95 0.64 0.97 0.58 0.98

83
Summary of Result for LAST Test 24 Hours Sampling Time, External Heat WITH Agitation
Frequency
(rad/s) 5.0 50.0 5.0 50.0
Temperature (ºC)
HT HT IT IT
A1 Rs G* Rs d Rs G* Rs d Rs G* Rs d Rs G* Rs d 1.00 1.05 1.04 1.02 1.08 1.00 1.08 1.00 Rd G* Rd d Rd G* Rd d Rd G* Rd d Rd G* Rd d 1.20 0.98 1.12 0.95 1.18 1.05 1.26 1.02
A3 Rs G* Rs d Rs G* Rs d Rs G* Rs d Rs G* Rs d 1.03 0.99 1.02 1.00 1.03 1.00 1.01 0.99 Rd G* Rd d Rd G* Rd d Rd G* Rd d Rd G* Rd d 1.11 1.01 1.13 1.00 1.15 1.00 1.13 0.99
B2 Rs G* Rs d Rs G* Rs d Rs G* Rs d Rs G* Rs d 1.05 0.99 1.03 1.00 1.00 1.00 1.01 1.00 Rd G* Rd d Rd G* Rd d Rd G* Rd d Rd G* Rd d 1.28 0.98 1.23 0.98 1.24 0.98 1.18 0.98
B3 Rs G* Rs d Rs G* Rs d Rs G* Rs d Rs G* Rs d 1.31 0.95 1.23 0.97 1.24 0.97 1.17 0.97 Rd G* Rd d Rd G* Rd d Rd G* Rd d Rd G* Rd d 0.58 1.08 0.64 1.06 0.70 1.07 0.77 1.07
B7 Rs G* Rs d Rs G* Rs d Rs G* Rs d Rs G* Rs d 1.03 0.99 1.03 1.00 1.04 1.00 1.03 0.99 Rd G* Rd d Rd G* Rd d Rd G* Rd d Rd G* Rd d 1.27 0.95 1.19 0.97 1.16 0.99 1.15 0.99
B8 Rs G* Rs d Rs G* Rs d Rs G* Rs d Rs G* Rs d 0.98 1.00 0.98 1.00 0.99 1.00 0.99 1.00 Rd G* Rd d Rd G* Rd d Rd G* Rd d Rd G* Rd d 1.28 0.95 1.21 0.97 1.21 0.99 1.19 0.99
B9 Rs G* Rs d Rs G* Rs d Rs G* Rs d Rs G* Rs d 1.03 0.99 1.02 1.00 1.03 1.00 1.03 1.00 Rd G* Rd d Rd G* Rd d Rd G* Rd d Rd G* Rd d 1.11 0.99 1.10 0.99 1.11 0.99 1.08 0.99
D1 Rs G* Rs d Rs G* Rs d Rs G* Rs d Rs G* Rs d 0.96 1.00 0.96 1.00 0.95 1.00 0.98 1.01 Rd G* Rd d Rd G* Rd d Rd G* Rd d Rd G* Rd d 0.93 1.01 0.95 1.01 1.01 1.02 1.02 1.01
D2 Rs G* Rs d Rs G* Rs d Rs G* Rs d Rs G* Rs d 1.03 1.00 1.03 1.00 1.01 1.00 1.00 1.00 Rd G* Rd d Rd G* Rd d Rd G* Rd d Rd G* Rd d 0.98 1.00 0.98 1.00 0.98 1.00 0.98 1.00
D5 Rs G* Rs d Rs G* Rs d Rs G* Rs d Rs G* Rs d 1.05 0.99 1.04 0.99 1.06 1.01 1.08 1.01 Rd G* Rd d Rd G* Rd d Rd G* Rd d Rd G* Rd d 1.05 0.97 1.02 0.97 1.00 0.43 1.14 1.11

84
APPENDIX II: TEST PLANS FOR FIELD VALIDATION
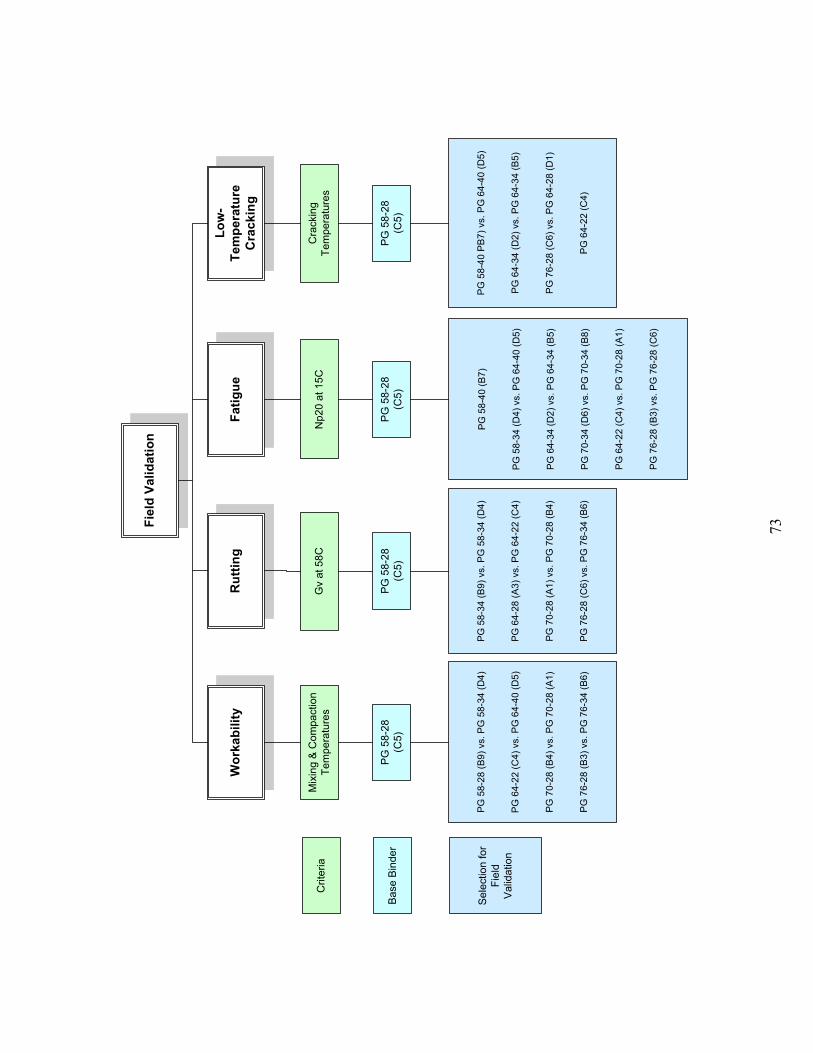
73
Crit
eria
Base
Bin
der
Sele
ctio
n fo
rFi
eld
Valid
atio
n
Mix
ing
& C
ompa
ctio
nTe
mpe
ratu
res
PG 5
8-28
(C5)
Cra
ckin
gTe
mpe
ratu
res
Np2
0 at
15C
PG
58-
40 P
B7) v
s. P
G 6
4-40
(D5)
PG
64-
34 (D
2) v
s. P
G 6
4-34
(B5)
PG
76-
28 (C
6) v
s. P
G 6
4-28
(D1)
PG
64-
22 (C
4)
PG 5
8-40
(B7)
PG
58-
34 (D
4) v
s. P
G 6
4-40
(D5)
PG
64-
34 (D
2) v
s. P
G 6
4-34
(B5)
PG
70-
34 (D
6) v
s. P
G 7
0-34
(B8)
PG
64-
22 (C
4) v
s. P
G 7
0-28
(A1)
PG
76-
28 (B
3) v
s. P
G 7
6-28
(C6)
PG 5
8-34
(B9)
vs.
PG
58-
34 (D
4)
PG 6
4-28
(A3)
vs.
PG
64-
22 (C
4)
PG
70-
28 (A
1) v
s. P
G 7
0-28
(B4)
PG 7
6-28
(C6)
vs.
PG
76-
34 (B
6)
PG 5
8-28
(B9)
vs.
PG
58-
34 (D
4)
PG
64-
22 (C
4) v
s. P
G 6
4-40
(D5)
PG
70-
28 (B
4) v
s. P
G 7
0-28
(A1)
PG
76-
28 (B
3) v
s. P
G 7
6-34
(B6)
PG 5
8-28
(C5)
PG 5
8-28
(C5)
PG 5
8-28
(C5)
Gv
at 5
8C
Wor
kabi
lity
Rut
ting
Fatig
ueLo
w-
Tem
pera
ture
Cra
ckin
g
Fiel
d Va
lidat
ion