Embed Size (px)
Citation preview
FINAL REPORT
SELECTION AND EVALUATION OF PERFORMANCE-GRADED ASPHALT BINDERS FOR VIRGINIA
B. D. Prowell Senior Research Scientist
(The opinions, findings, and conclusions expressed in this report are those of the author and not necessarily those of
the sponsoring agency.)
Virginia Transportation Research Council (A Cooperative Organization Sponsored Jointly by the
Virginia Department of Transportation and the University of Virginia)
Charlottesville, Virginia
June 1999 VTRC 99-R21

ii
Copyright 1999 by the Virginia Department of Transportation.

iii
ABSTRACT This study recommended and evaluated performance-graded (PG) binders for use in hot-mix asphalt in Virginia. Ten conventional viscosity-graded asphalt cements, representing the asphalt typically available in Virginia, were graded under the PG system to develop a cross-reference with the new system. Based on the past performance of the viscosity-graded asphalt and the PG binder testing, PG 64-22 binder was selected as the base grade of asphalt for Virginia.
Laboratory studies were performed with the Georgia loaded-wheel tester and asphalt pavement analyzer to evaluate the use of increasing the high-temperature binder grade for heavy or slow-moving traffic. Based on the success of these studies and field trial sections, two new mix types, SM-2D and SM-2E, both 50-blow Marshall mixes with PG 70-22 and PG 76-22 binder, respectively, were developed. A lower laboratory compaction effort will increase the asphalt content for durability, and the stiffer binder will prevent rutting. A large database of field rut depth data was developed for Virginia Department of Transportation surface mixes with the asphalt pavement analyzer. The data were used to estimate maximum rut depth criteria for quality assurance and evaluation of future asphalt mix designs, binders, and stabilizers.

FINAL REPORT
SELECTION AND EVALUATION OF PERFORMANCE-GRADED ASPHALT BINDERS FOR VIRGINIA
B. D. Prowell
Senior Research Scientist
INTRODUCTION
Background The goals of the asphalt research included in the Strategic Highway Research Program (SHRP) were originally outlined in TRB Special Report 202: America’s Highways: Accelerating the Search for Innovation. The objective of the research program was:
To improve pavement performance through a research program that will provide increased understanding of the chemical and physical properties of asphalt cements and asphalt concretes. The research results would be used to develop specifications, tests, . . . needed to achieve and control the pavement performance desired (Transportation Research Board, 1984).
Based on this document, the development of a performance-based asphalt cement specification was to take precedence over all other asphalt-related research in the SHRP program. The program was modified when the term asphalt cement was changed to asphalt binder in an effort to develop a specification that would not differentiate between modified and unmodified asphalt cements (Kennedy et al., 1990).
Performance-Graded Binder Specification: Overview of Selection Process The product of the SHRP asphalt research program was a materials selection, testing, and evaluation design system called Superpave. The Superpave binder specification is performance based, resulting in the classification of performance-graded (PG) binders. It delineates engineering properties of the binder that are believed to be related to the expected performance of the pavement. Thus, a designer can anticipate the performance of the pavement. This represents a significant improvement over the viscosity grading system (AASHTO M 226; American Association of State Highway and Transportation Officials [AASHTO], 1997) previously used for binders in Virginia since viscosity cannot clearly be related to pavement performance. In addition, the Superpave binder specification factors in the climatic conditions associated with the job to be done.
The maximum 7-day pavement temperature, minimum pavement temperature, reliability, loading time (based on traffic speed, i.e., fast transient, slow transient, and standing), and traffic

2
volume are used in the Superpave binder specification to select the binder grade appropriate for the job to be performed.
The 7-day maximum and minimum pavement temperature for the region may be calculated using the Superpave weather database. The database includes 5,313 weather stations from across the United States (Staff, 1993). Pavement temperatures are calculated from the air temperatures measured at the weather stations using models developed during SHRP. These data can then be used to calculate the high and low pavement design temperatures based on the concept of reliability. Reliability is the chance that the pavement temperatures will not exceed the design temperatures in a given year. Reliability is calculated using normal probability from the mean and standard deviation of the historical data. PG binder grades were established in 6 °C increments, e.g., 58, 64, 70, and 76 on the high-temperature side and -16, -22, -28, and -34 on the low-temperature side. The PG binder grade that exceeds the design temperatures is chosen to provide the specified level of reliability. For example, based on the 1993 weather database, the 98% reliability design temperatures for Richmond, Virginia, are 59 °C (high temperature) and -20 °C (low temperature). Therefore, the base grade PG binder to meet the climatic conditions in Richmond would be a PG 64-22. Based on the climatic data incorporated in the Superpave program, and a 98% reliability, Virginia would require five grades of binder for fast transient traffic as shown in Figure 1 (Heritage Research Group, 1993). These base grades are modified based on traffic speed and volume.
The specification for Superpave volumetric mix design, AASHTO MP-2, includes recommendations for increasing the high-temperature binder grade based on traffic speed and volume (AASHTO, 1998). This is generally referred to as binder bumping. The specification recommends increasing one high-temperature binder grade when traffic speeds are between 20

3
Figure 1. SHRP Asphalt Binder Grade at 98% Reliability and 70 km/h; e.g., use a PG 70-22 binder instead of a PG 64-22 binder. A two-grade bump is recommended for traffic speeds less than 20 km/h. An increase is also recommended for high traffic volumes. The design traffic volume for a Superpave mix design is calculated as the cumulative application of equivalent single-axle loads over an assumed 20-year design life. Increasing one high-temperature grade is recommended for traffic levels ranging from 1 x 10⁷ to 3 x 10⁷ equivalent single-axle loads. It is specified for traffic in excess of 3 x 10⁷ equivalent single-axle loads. The high-temperature bumps are cumulative.
Concerns with the Superpave Binder Specification Historically, Virginia’s pavements primarily suffer from rutting (permanent deformation) and fatigue cracking. Thermal cracking is not a prevalent problem. The incidence of thermal cracking is primarily controlled by the properties of the binder used in the mix. Fatigue and rutting are affected to a larger extent by the aggregate grading and properties of the mix. The prevention of thermal cracking tended to drive the development of the PG binder specification. Since the prevention of thermal cracking was the primary goal of the PG binder specification, it was felt that the binder grades recommended by Superpave might be too soft for use in Virginia, leading to flushing and rutting. Another area of concern is related to the number of grades that could be supplied in Virginia at a competitive price. Including all the base grades and potential modifications based on traffic speed, traffic volume, and the use of recycled asphalt pavement, up to 27 grades of binder could be required for Virginia. Prior to Superpave, asphalt binder producers primarily supplied two viscosity-graded binders to Virginia: AC-20 and AC-30. The producers also supplied limited quantities of a third grade: AC-10. The production and storage capabilities of the asphalt binder producers were geared toward supplying three or four grades of asphalt binder. Dramatically increasing the number of specified grades would require asphalt binder producers to increase their storage and production capacities or ship binders long distances. Either option would significantly increase the cost of liquid asphalt. Further, Virginia’s hot-mix asphalt contractors typically have only one or two tanks for storing binder at the plant site. Limited on-site tankage also hinders the use of multiple binder grades.
4
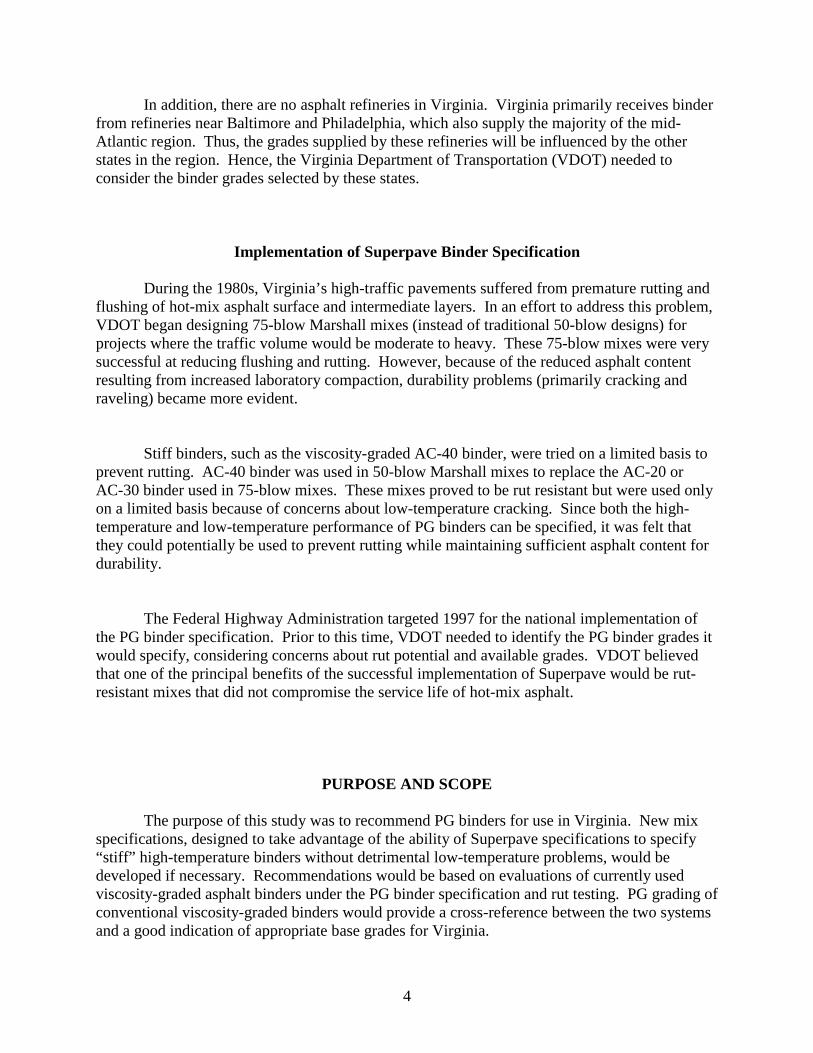
In addition, there are no asphalt refineries in Virginia. Virginia primarily receives binder from refineries near Baltimore and Philadelphia, which also supply the majority of the mid-Atlantic region. Thus, the grades supplied by these refineries will be influenced by the other states in the region. Hence, the Virginia Department of Transportation (VDOT) needed to consider the binder grades selected by these states.
Implementation of Superpave Binder Specification During the 1980s, Virginia’s high-traffic pavements suffered from premature rutting and flushing of hot-mix asphalt surface and intermediate layers. In an effort to address this problem, VDOT began designing 75-blow Marshall mixes (instead of traditional 50-blow designs) for projects where the traffic volume would be moderate to heavy. These 75-blow mixes were very successful at reducing flushing and rutting. However, because of the reduced asphalt content resulting from increased laboratory compaction, durability problems (primarily cracking and raveling) became more evident.
Stiff binders, such as the viscosity-graded AC-40 binder, were tried on a limited basis to prevent rutting. AC-40 binder was used in 50-blow Marshall mixes to replace the AC-20 or AC-30 binder used in 75-blow mixes. These mixes proved to be rut resistant but were used only on a limited basis because of concerns about low-temperature cracking. Since both the high-temperature and low-temperature performance of PG binders can be specified, it was felt that they could potentially be used to prevent rutting while maintaining sufficient asphalt content for durability.
The Federal Highway Administration targeted 1997 for the national implementation of the PG binder specification. Prior to this time, VDOT needed to identify the PG binder grades it would specify, considering concerns about rut potential and available grades. VDOT believed that one of the principal benefits of the successful implementation of Superpave would be rut-resistant mixes that did not compromise the service life of hot-mix asphalt.
PURPOSE AND SCOPE
The purpose of this study was to recommend PG binders for use in Virginia. New mix specifications, designed to take advantage of the ability of Superpave specifications to specify “stiff” high-temperature binders without detrimental low-temperature problems, would be developed if necessary. Recommendations would be based on evaluations of currently used viscosity-graded asphalt binders under the PG binder specification and rut testing. PG grading of conventional viscosity-graded binders would provide a cross-reference between the two systems and a good indication of appropriate base grades for Virginia.

5
METHODOLOGY
General In late 1993, 10 samples of viscosity-graded asphalt cements from the five leading asphalt suppliers in Virginia were sent to the National Center for Asphalt Technology for performance grading under the PG binder specification. The cements were AC-20 and AC-30, which were commonly used in Virginia. Neither VTRC nor VDOT was equipped to do PG binder testing at this time. Based on their performance history and availability, these samples were used to establish the base grade for PG binders throughout Virginia. Testing with the Georgia loaded-wheel tester and later the asphalt pavement analyzer (APA) was performed to develop two new Marshall mix types aimed at providing rut resistance without sacrificing durability.
Test Methods
PG Binder Specification Tests
PG binder testing was conducted in accordance with AASHTO MP-1, which includes tests performed on unaged or original, short-term aged, and long-term aged asphalt binder. Short-term aging reflects the loss of volatiles and oxidation that occurs during construction and is simulated with the rolling thin film oven test (AASHTO T 240). Long-term aging reflects the oxidation that occurs in the pavement after 5 to 10 years of service life and is simulated with the pressure aging vessel test (AASHTO PP1). The early tests were conducted at the National Center for Asphalt Technology. Later tests were performed at the Virginia Transportation Research Council’s Superpave binder lab, which became operational in 1996. This lab currently provides acceptance testing for VDOT. Characterization of the original binder includes flash point temperature, rotational viscosity, and dynamic shear tests. Flash point temperature testing (AASHTO T48) is included to ensure safety during mixing. Rotational viscosity testing (ASTM D 4402) is included to ensure that the binder can be pumped at the asphalt plant (American Society of Testing and Materials [ASTM], 1998). Dynamic shear testing (AASHTO TP-4) is used to characterize the high-temperature properties of the binder. These properties include the complex shear modulus (G*) and the phase angle (δ). G* is an indicator of the stiffness or resistance of the asphalt binder to deformation under load. G*/sin δ defines the resistance to shear deformation of the asphalt binder in the linear-viscoelastic region. A minimum stiffness (G*/sin δ = 1.0 kPa) is specified for the original binder to guard against mix tenderness.
Characterization of the short-term aging, i.e., of the residue from the rolling thin film oven test, includes analysis of mass loss on heating and dynamic shear tests. Mass loss on heating (AASHTO T 240) is used to control the amount of volatiles or pollution released during

6
heating. A minimum stiffness (G*/sin δ = 2.2 kPa) is specified for the residue to ensure adequate resistance to permanent deformation. Characterization of the long-term aging, i.e., of the residue from the pressure aging vessel test, includes the results of dynamic shear tests and bending beam rheometer tests. A maximum stiffness (G*sinδ = 5000 kPa) is specified for the residue of the pressure aging vessel test to help prevent fatigue cracking. The bending beam rheometer test (AASHTO TP1) is used to measure the low-temperature cracking properties of the binder. A creep load applied to the sample beam simulates thermal stresses that gradually build up in the pavement when the temperature drops. The worst case scenario is a rapidly moving cold front where stresses may accumulate over a
2-hour period. Since the SHRP researchers did not want to run the bending beam rheometer test for 2 hours, they made use of time-temperature supposition such that the test may be run at the design temperature +10 °C for 240 seconds instead of at the design temperature for 2 hours (Asphalt Institute, 1994). A maximum creep stiffness (S) of 300 MPa and a minimum creep rate of 0.300 at the design low-temperature +10 °C are specified to prevent low-temperature cracking. The creep rate is generally referred to as the m value.
Georgia Loaded-Wheel/APA Mixture Tests
Initial testing was done by the Virginia Transportation Research Council using a Model LW-II Georgia loaded-wheel tester manufactured by Pavtec Engineering and Technology. Testing was conducted using Georgia Test Method GTD-115 (Georgia Department of Transportation, 1997). Beam specimens, 75 mm x 125 mm x 300 mm, were compacted with a kneading action in a rolling wheel compaction machine using a polycarbonate compaction pad. The target air voids were 7%. The beams were tested at 38 °C. A 445-Newton vertical load was applied with a moving wheel for 8,000 cycles (16,000 passes). A rubber hose inflated to 689 kPa transferred the wheel load to the specimen. The Georgia DOT allowed no more than 8 mm of downward deformation (rutting) after 8,000 cycles. Rut depth is measured by comparing pre-test and post-test profiles. Readings are taken with a digimatic caliper to the nearest 0.01 mm at three locations along the beam’s longitudinal axis. The locations are at the center of the beam and ±63.5 mm from the centerline. Early work indicated that this procedure did not seem to differentiate the performance of Virginia’s mixes.
Lai recommended a proposed Georgia DOT test method for mixes containing polymer-
modified asphalt. In the proposed procedure, the test temperature was increased to 49 °C, the vertical load was increased to 533 N, and the hose inflation pressure was increased to 830 kPa. This test temperature correlates well with the predicted pavement temperatures for surface mixes in Virginia. The average (50% reliability) 7-day high pavement temperature at a depth of 20 mm based on data from 104 weather stations throughout Virginia is 51.8 °C with a standard deviation of 1.25 °C (Federal Highway Administration, 1998). The 95% confidence limit for the average 7-day high pavement temperature would be 53.9 °C. Unfortunately, the model LWT-II could maintain a temperature of only 49 °C. Therefore, the test temperature was increased from 38 °C to 49 °C. Trials with the increased temperature, vertical load, and hose pressure indicated that the Georgia tester could distinguish between binder grade and asphalt content. Unfortunately, the Model LW-II tester had difficulty maintaining the 49 °C temperature. The reciprocating carriage also developed significant wear.
In the spring of 1997, VDOT purchased a pair of asphalt pavement analyzers and
vibratory compactors. One set of units was stationed at VTRC. The APA is an improved version of the Georgia tester. It offers testing over a wider range of temperatures (5 to 71 °C) and allows specimens to be tested dry or under water. The steel specimen-confining frames on

7
the Georgia device were replaced with polycarbonate molds. These molds have a modulus similar to that of hot-mix asphalt and are designed to reduce boundary effects. VTRC used the same test configuration (49 °C, 533 N, and 830 kPa) as used with the Georgia device.
The sample mass for both devices was determined as follows to produce 7% target air voids:
5.281293.0 ××= mmGmassSample where Gmm is the theoretical maximum specific gravity and 2812.5 is the sample volume in cubic centimeters.
Field-produced samples were heated in an oven to a compaction temperature appropriate for the binder grade in covered buckets. Laboratory-mixed samples were short-term oven aged for 2 hours at 135 °C in accordance with AASHTO PP2-95 and then placed in an oven set at the appropriate compaction temperature for 30 minutes. Samples for the APA were compacted using a vibratory compactor designed to compact to a specified height.
RESULTS
Performance Grading and Establishment of Base Grade
The results of the performance grading are reported in Table 1. Both the AC-20 and AC-30 samples graded as or very close to the grading for PG 64-22.
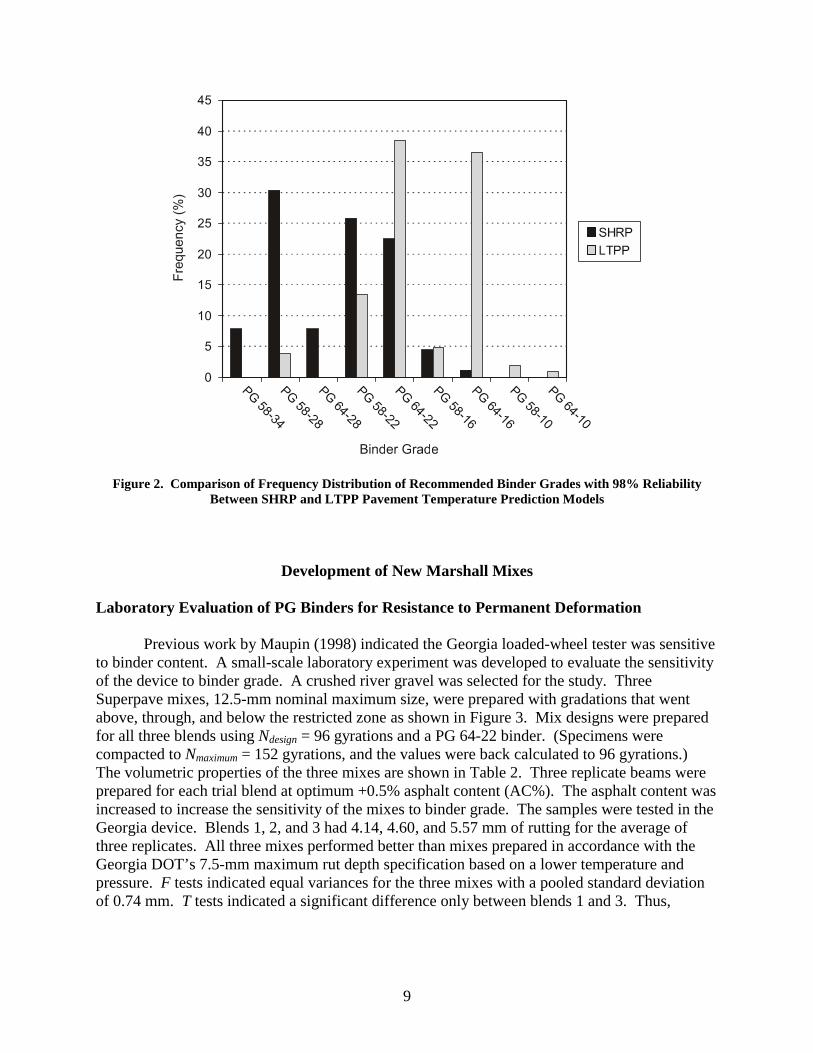
A survey of VDOT’s district materials engineers indicated that Virginia did not have a low-temperature cracking problem. Since the existing binders used in Virginia graded as -22 binders and since a low-temperature cracking problem was not observed, it was decided that -22 should be used as the base low-temperature grade for Virginia, even though this went against the original SHRP recommendations (Huber, 1994). This judgment proved correct when the low-temperature pavement prediction models were revised based on data collected during the Long Term Pavement Performance (LTPP) project (Mohseni & Symons, 1998). The original SHRP database included 89 weather stations for Virginia (Huber, 1994). The revised database includes 104 stations (Mohseni & Symons, 1998). A comparison of the distribution of PG binders at the 98% confidence level with the SHRP and LTPP models is shown in Figure 2. According to the LTPP model, only 3.8% of Virginia’s weather stations require a –28 grade binder.
The PG 64-22 binder was chosen as the base binder for Virginia even where a PG 58-22 binder would have sufficed. VDOT was not comfortable using a 58 high-temperature grade where it was recommended and a PG 64-22 binder was readily available. The PG 58-22 grade is close to an AC-10 grade under the viscosity grading system, normally used in colder regions. Additional data presented later support VDOT’s selection of 64 for the high-temperature grade.

8
As indicated in Figure 2, a PG 64-22 binder equals or exceeds the 98% reliability for 82.7% of Virginia’s weather stations based on the LTPP model. The PG 58-22 binder provides 98% reliability for another 13.5% of Virginia’s weather stations. The majority of the PG 64-22 binder used in Virginia also grades as a PG 58-22 binder. The requirements for a PG 64-22 binder equal or exceed those for a PG 58-22 binder with the exception of the fatigue test, G*Sinδ. G*Sinδ is tested at 22 °C for a PG 58-22 binder as compared to 25 °C for a PG 64-22 binder.
Table 1. Performance Grading of Typical Viscosity-Graded Asphalt Cements Used in Virginia
Asphalt Producer
Viscosity Grade
PG Grade
DSR1 Original AC G*/Sinδδδδ (kPa) @ 64 °°°°C
DSR RTFO Residue G*/Sinδδδδ (kPa) @ 64 °°°°C
DSR PAV Residue G*Sinδδδδ (kPa) @ 10 °°°°C2
BBR PAV Residue S (MPa) @ -12 °°°°C
BPM
Shell Wood River, Ill.
AC-20 PG 64-22 1.023 2.566 6273 163.5 0
Chevron Philadelphia, Pa.
AC-20 PG 64-22 1.143 3.268 3694 121.5 0
Koch Cibro, N.Y.
AC-20 PG 58-22 0.983 2.822 3157 85.5 0
Citgo Paulsboro, N.J.
AC-20 PG 64-22 1.246 2.675 7033 200.5 0
Sun Dumfries, Va.
AC-20 PG 64-22 1.128 2.914 4117 112.5 0
Shell Wood River, Ill.
AC-30 PG 64-16 1.670 4.610 6800 212.5 0
Chevron Philadelphia, Pa.
AC-30 PG 64-16 1.560 4.990 4940 163.0 0
Koch Cibro, N.Y.
AC-30 PG 64-22 1.710 5.400 4970 117.5 0
Citgo Paulsboro, N.J.
AC-30 PG 64-22 1.660 4.900 6020 153.5 0
Sun Dumfries, Va.
AC-30 PG 64-22 1.720 4.710 5230 143.5 0
1Dynamic shear rheometer (DSR); bending beam rheometer (BBR). 2All binders met the specification (<5000 kPa) at temperatures lower than 25 °C, the appropriate test temperature for a PG 64-22 binder.
9
Figure 2. Comparison of Frequency Distribution of Recommended Binder Grades with 98% Reliability Between SHRP and LTPP Pavement Temperature Prediction Models
Development of New Marshall Mixes
Laboratory Evaluation of PG Binders for Resistance to Permanent Deformation
Previous work by Maupin (1998) indicated the Georgia loaded-wheel tester was sensitive to binder content. A small-scale laboratory experiment was developed to evaluate the sensitivity of the device to binder grade. A crushed river gravel was selected for the study. Three Superpave mixes, 12.5-mm nominal maximum size, were prepared with gradations that went above, through, and below the restricted zone as shown in Figure 3. Mix designs were prepared for all three blends using Ndesign = 96 gyrations and a PG 64-22 binder. (Specimens were compacted to Nmaximum = 152 gyrations, and the values were back calculated to 96 gyrations.) The volumetric properties of the three mixes are shown in Table 2. Three replicate beams were prepared for each trial blend at optimum +0.5% asphalt content (AC%). The asphalt content was increased to increase the sensitivity of the mixes to binder grade. The samples were tested in the Georgia device. Blends 1, 2, and 3 had 4.14, 4.60, and 5.57 mm of rutting for the average of three replicates. All three mixes performed better than mixes prepared in accordance with the Georgia DOT’s 7.5-mm maximum rut depth specification based on a lower temperature and pressure. F tests indicated equal variances for the three mixes with a pooled standard deviation of 0.74 mm. T tests indicated a significant difference only between blends 1 and 3. Thus,

10
Figure 3. Superpave Gradations (12.5-mm Nominal Maximum Sieve Size) for Sensitivity Analysis
blend 3 (coarse) was chosen for the binder grade experiment as being the most rut susceptible and, therefore, the most sensitive to binder grade. Three replicate beams were prepared with PG 58-28, PG 64-22, PG 70-22, PG 76-22, and PG 82-22 binders at the design +0.5 AC%. The results shown in Figure 4 indicate that the

11
Figure 4. Georgia Loaded-Wheel Tester Average Rut Depth Versus Binder Grade for Blend 3
Georgia loaded-wheel tester is sensitive to binder grade. Three methods of modification were used to produce three PG 76-22 binders: air-blowing (AB), chemical gelling referred to commercially as Multigrade, and the use of a styrene-butadiene polymer. Interestingly, although all three binders met the specifications for a PG 76-22 binder, they produced distinctly different rut depths. The PG 82-22 binder was also produced with a styrene-butadiene polymer. This experiment was repeated in the APA with a granite aggregate. The gradation and volumetric properties for the mix design used in the experiment are also shown in Figure 3 and Table 2, respectively. The design specimens were compacted to Ndesign = 96 gyrations for a design life of 3 to 10 million equivalent single-axle loads. (Specimens were compacted to Nmaximum = 152 gyrations, and the values were back calculated to 96 gyrations.) The specimens were produced at the design asphalt content to determine if the APA would still differentiate without the additional asphalt increasing the likelihood of rutting. Based on the results shown in Figure 5, the APA also appears to be sensitive to binder grade.
Table 2. Volumetric Properties of 12.5-mm Nominal Maximum Sieve Size Superpave Mixes for Sensitivity Analysis
Mix
AC%
VMA%
VFA% % Gmm @
Nmax Fine/Effective
AC% GLWT Blend 1 5.5 15.2 73.8 97.3 1.3 GLWT Blend 2 5.5 14.2 71.9 97.4 1.2 GLWT Blend 3 6.2 15.4 74.0 97.8 1.0 APA Blend 5.0 14.1 71.6 97.8 1.1
GLWT = Georgia loaded-wheel tester.

12
Figure 5. Average Rut Depth Versus Binder Grade for APA Blend F tests were performed to compare the variability of the three replicate beams for each
binder grade. The PG 82-22 binder was not included in the analysis for the Georgia device. The F test indicated no significant difference between the variabilities for the device. The F test did indicate a significant difference between the PG 76-22 binder and the remaining grades for the APA. The pooled standard deviations for the Georgia device and the APA (not including the
PG 76-22 specimens) were 0.65 and 1.11, respectively. It is possible that the increased variability seen with the APA was due to the different aggregate structure. Both the Georgia loaded-wheel tester and the APA test three replicate beams at the same time. The vertical load is applied to each replicate through an individually calibrated pneumatic cylinder. The right cylinder on VTRC’s APA seems to produce a consistently larger rut depth even though the load was properly calibrated. The average rut depth for the left, center, and right cylinders was 2.75, 2.77, and 4.12 mm, respectively. This variability could hinder using the APA to develop specifications. Development of Mixes In 1996, based on the results from the Georgia loaded-wheel tester, which indicated that binder stiffness could be used to improve rut resistance at the same asphalt content, it was suggested that new mixes be developed to replace the 75-blow Marshall mix then used in high-traffic areas. VDOT’s 1994 specifications included two 75-blow surface mixes: SM-2B, which used an AC-20 binder, and SM-2C, which used an AC-30 binder. The 75-blow Marshall mixes were becoming increasingly unpopular because of their poor durability. Specifications for

13
SM-2A, a 50-blow Marshall mix produced with an AC-20 binder, formed the basis of the proposed mixes. The 50-blow Marshall laboratory compaction effort would increase the design asphalt content to improve durability, and a PG binder that exceeded the high-temperature climatic requirements by one or two grades would prevent rutting. The special provision for stabilized and modified mixes already reflected this concept. A cooperative VDOT/industry intersection committee developed the special provision in 1994. Under the provision, a rut-resistant mix would be produced by using a stabilizing agent such as a fiber- or polymer-modified binder with a 50-blow Marshall mix. A modified asphalt is specified by adding an (M) designation to the SM-2A mix designation. Adding an (S) designation to the SM-2A mix designation specifies a stabilizing agent, thus forming either an SM-2A (M) or SM-2A (S). The specification was somewhat difficult in a competitive bid system since it required VDOT to specify a particular stabilizer or modifier. However, these modified asphalts generally graded as PG 76-22 binders under AASHTO MP-1. This would allow VDOT to specify a 50-blow Marshall mix with a generic PG 76-22 binder. A PG 70-22 binder was included for less extreme traffic loading conditions. Because of the need for modification, a PG 76-22 binder often costs 100% more than a PG 64-22 binder. A PG 70-22 binder is generally available as an unmodified binder in Virginia at a cost increase of 10% or less. These concepts fit well with the recommendations specified in AASHTO MP-2 for bumping high-temperature binder grades for slow or standing traffic as well as extreme traffic volumes.
Two test sections were placed in early 1996 to evaluate this concept. A 50-blow Marshall mix using a PG 70-22 binder was placed by Mega Contractors on the westbound lanes of I-64 just west of Richmond. Lee Hy Paving Corporation placed a second section on the southbound lanes of I-95 just north of Ashland. This section used a 50-blow Marshall mix with an AC-30 binder that graded slightly less than a PG 70-22 binder. Samples of both mixes and a sample of SM-2C produced by Mega Contractors were taken for evaluation in the Georgia loaded-wheel tester. Asphalt contents and gradations for the three mixes are shown in Table 3. Mega’s SM-2A mix with a PG 70-22 binder was produced at the high end of the job-mix formula asphalt content (which would tend to increase rutting). The SM-2C mix was produced at the low end of the job-mix formula asphalt content (which would tend to decrease rutting). The Georgia device results are shown in Table 4. Based on the results, all three mixes showed less rutting than the 8 mm maximum rut depth specified by the Georgia DOT, even at the higher temperature, load, and pressure. Statistically, there is no significant difference between Mega’s SM-2A mix with a PG 70-22 binder and Mega’s SM-2C mix at the 95% confidence limit. Further, there does not seem to be a practical difference between average rut depths with the
SM-2A mix with a PG 70-22 binder and with the SM-2C mix described in Table 4. More important, neither section rutted that summer, nor since. Based on work completed with the Georgia loaded-wheel tester and trial field sections, VTRC, VDOT, and the Virginia Asphalt Association cooperatively developed specifications for two new mix types: SM-2D and SM-2E. The mixes were based on VDOT’s existing

14
specifications for the SM-2A mix (a 50-blow Marshall mix) with either a one (D) or two (E) grade bump in the grade of the high-temperature binder. Design asphalt content was chosen at
Table 3. Asphalt Content and Gradation for SM-2A Trial Sections
Percent Passing
Sieve Size, mm
Mega SM-2A With PG 70-22
Mega SM-2C With PG 70-22
Lee Hy SM-2A With AC-30
12.5 99 98 98 9.5 93 89 89 4.75 77 64 66 2.36 60 48 45 1.18 44 36 30 0.600 29 25 21 0.300 16 15 12 0.150 10 9 8 0.075 7.9 6.6 6.3 AC% 6.12 5.07 6.00
Table 4. GLWT Results for SM-2A Trial Sections
Mega SM-2A With PG 70-22
Mega SM-2C With PG 70-22
Lee-Hy SM-2A With AC-30
Sample No.
Rut Depth, mm
VTM, %
Rut Depth, mm
VTM, %
Rut Depth, mm
VTM, %
1 4.34 7.8 3.37 9.1 3.17 7.8 2 2.04 7.8 3.51 9.6 2.68 7.4 3 2.30 8.1 0.95 8.1 NA NA Average 2.89 7.9 2.61 8.9 2.93 7.6 4.5% air voids. The SM-2 gradation specifications allow the mix to be designed as either a 9.5- or 12.5-mm nominal maximum size mix. These mixes typically follow the maximum density line, are on the coarse side, and pass through the restricted zone. The SM-2A mix uses a PG 64-22 binder; the SM-2D, a PG 70-22; and the SM-2E, a PG 76-22. These mixes are identical in gradation, materials, and volumetric properties. Mix selection guidelines, based on seven traffic loading conditions, were jointly developed by VDOT, VTRC, and the Virginia Asphalt Association to aid field personnel in selecting the proper mix for the proper application. The guidelines are included in Appendix A.
Evaluation of Field Mixes with the APA
Both the Georgia loaded-wheel tester and its improved counterpart, the APA, demonstrated their sensitivity to parameters that would induce rutting in laboratory tests. Since the SM-2D and SM-2E mixes were tested on only a limited number of materials, and since the APA seemed to be sensitive to rut resistance, VTRC recommended that field-produced samples of SM-2D and SM-2E mixes be monitored in the APA until such point when widespread confidence in their rut resistance was developed. Through 1998, 187 mix samples representing 13 mix types were tested in the APA. By this time, field personnel were comfortable with the

15
performance of the new mixes. Based on this confidence, the database was analyzed to develop maximum rut depth criteria for Virginia. These criteria would be used to test the performance of future asphalt technology, such as Superpave mix designs, new asphalt modifiers, and stabilizers.
The results for each sample are reported as the average of three beams. Several mix
types have sufficient samples to develop confidence limits that could be used as screening criteria. Frequency distribution plots for the SM-2 series of mixes are shown in Figure 6. The plot indicates the data follow a normal distribution with a slight skew toward greater rut depths. PG 70-22 binder seems to provide a significant reduction in rut depth compared to PG 64-22
Figure 6. Frequency Distribution of Average APA Rut Depths for Marshall Design Surface Mix Data binder. PG 76-22 binder seems to provide only a limited reduction in rut depth compared to
PG 70-22 binder. Unlike the data from WesTrack pavement samples, within a given mix type, the standard deviation appears to be relatively constant (Williams & Prowell, 1999). There is a slight trend (R2 = 0.19) toward increasing standard deviation with increasing rut depth. However, the range of rut depth reported is significantly less than the WesTrack data. Summary data and proposed criteria are reported in Table 5.
Table 5. APA Summary Data and Proposed Criteria for Marshall-Designed Surface Mixes
Based on Statistical Analysis
Data SM-2A SM-2D SM-2E Mean rut depth, mm 4.47 3.16 1.80 Standard deviation, mm 1.29 1.25 0.86 Number of samples 33 34 9 95% upper confidence limit, mm 7.00 5.61 3.50 Proposed maximum rut depth, mm 7.0 5.5 3.5

16
The proposed criteria are based on the 95% confidence limit of a normal distribution. For data sets larger than 30 samples (1 sample being the average of three replicate beams), the sample standard deviation can be used to estimate the true sample standard deviation of the population. Then, assuming the population of mixes tested are all rut resistant, the maximum rut depth representing rut-resistant material can be calculated such that an error will be produced only 1 in 20 times using the 95% confidence level for the normal distribution (Walpole & Myers, 1985). However, for sample sets smaller than 30 samples, the assumption that the sample standard deviation can be substituted for the true standard deviation of the population is statistically invalid. In this case, the maximum rut depth should be calculated using the small- sample confidence limit based on Student’s t distribution (Walpole & Myers, 1985). The results in Table 5 for the SM-2E samples are based on the normal distribution even though fewer than 30 samples were tested.
One sample was removed from the SM-2E data set. This sample had an average rut
depth of 5.24 mm. VDOT’s specifications require that when more than 20% recycled asphalt pavement is used in a surface mix, a PG binder one full grade softer should be used, e.g., a
PG 70-28 instead of a PG 76-22. This particular mix fell into this category. There is concern that in some instances decreasing PG grade with medium percentages of recycled asphalt pavement may lead to premature rutting. To date, this mix has not rutted in the field. The criterion for the SM-2E mixes was also calculated using the small-sample confidence limit. A value of 3.59 mm was determined.
Two samples, an SM-2A and SM-2D, tested in the APA have rutted in the field. The
proposed criteria based on the samples tested through 1998 would have identified the SM-2A sample (8.28-mm average APA rut depth), which rutted severely in the field. It would not have identified the SM-2D sample (4.20 mm average APA rut depth) that developed ruts
2.5 to 6.4 mm in the field in a 3-month period. The rut depths on this section have not increased significantly since 1997. Two other samples, one SM-2A and one SM-2D sample, did not meet the proposed criteria. These pavements have not rutted in the field to date, but they have been under traffic for only a short time.
Future samples may be evaluated with the proposed criteria with only a 2.5% chance that
rut-resistant material will not meet the criteria. It should be noted that the field performance of the mixes assumes that the correct mix is selected for the field traffic loading as recommended in the guidelines. Failure to follow the guidelines, for example, as would occur if one placed an SM-2A mix at an intersection on a high-volume primary or heavily trafficked interstate with a high percentage of trucks, may result in rutting in the field even though the mix meets the appropriate criteria when tested in the APA.
17
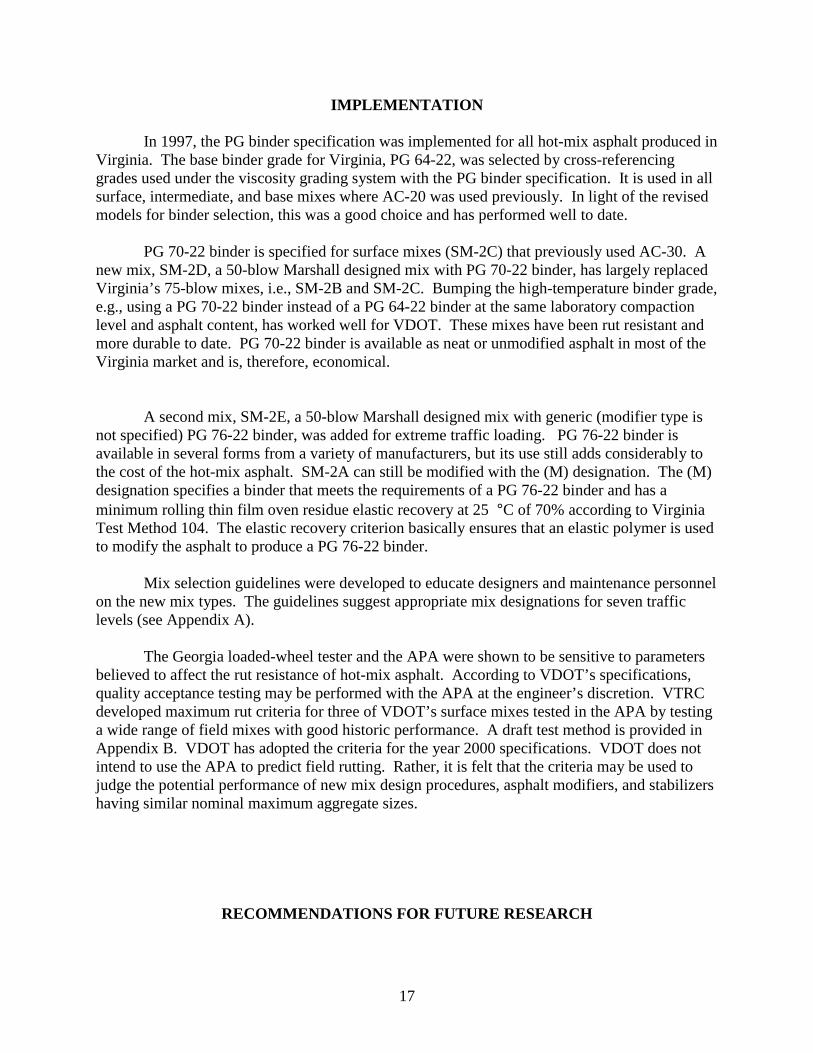
IMPLEMENTATION In 1997, the PG binder specification was implemented for all hot-mix asphalt produced in Virginia. The base binder grade for Virginia, PG 64-22, was selected by cross-referencing grades used under the viscosity grading system with the PG binder specification. It is used in all surface, intermediate, and base mixes where AC-20 was used previously. In light of the revised models for binder selection, this was a good choice and has performed well to date. PG 70-22 binder is specified for surface mixes (SM-2C) that previously used AC-30. A new mix, SM-2D, a 50-blow Marshall designed mix with PG 70-22 binder, has largely replaced Virginia’s 75-blow mixes, i.e., SM-2B and SM-2C. Bumping the high-temperature binder grade, e.g., using a PG 70-22 binder instead of a PG 64-22 binder at the same laboratory compaction level and asphalt content, has worked well for VDOT. These mixes have been rut resistant and more durable to date. PG 70-22 binder is available as neat or unmodified asphalt in most of the Virginia market and is, therefore, economical.
A second mix, SM-2E, a 50-blow Marshall designed mix with generic (modifier type is
not specified) PG 76-22 binder, was added for extreme traffic loading. PG 76-22 binder is available in several forms from a variety of manufacturers, but its use still adds considerably to the cost of the hot-mix asphalt. SM-2A can still be modified with the (M) designation. The (M) designation specifies a binder that meets the requirements of a PG 76-22 binder and has a minimum rolling thin film oven residue elastic recovery at 25 °C of 70% according to Virginia Test Method 104. The elastic recovery criterion basically ensures that an elastic polymer is used to modify the asphalt to produce a PG 76-22 binder.
Mix selection guidelines were developed to educate designers and maintenance personnel
on the new mix types. The guidelines suggest appropriate mix designations for seven traffic levels (see Appendix A).
The Georgia loaded-wheel tester and the APA were shown to be sensitive to parameters believed to affect the rut resistance of hot-mix asphalt. According to VDOT’s specifications, quality acceptance testing may be performed with the APA at the engineer’s discretion. VTRC developed maximum rut criteria for three of VDOT’s surface mixes tested in the APA by testing a wide range of field mixes with good historic performance. A draft test method is provided in Appendix B. VDOT has adopted the criteria for the year 2000 specifications. VDOT does not intend to use the APA to predict field rutting. Rather, it is felt that the criteria may be used to judge the potential performance of new mix design procedures, asphalt modifiers, and stabilizers having similar nominal maximum aggregate sizes.
RECOMMENDATIONS FOR FUTURE RESEARCH

18
• Work needs to be completed to evaluate the PG 76-22 binder produced in accordance with various modifications. Test sections were placed in 1995 on I-66 for this purpose. National Cooperative Highway Research Program Project 9-10 will also address this issue.
• Current recommendations for changing binder grades when using recycled asphalt pavement
need to be verified. • Current Superpave specifications increase laboratory compaction level and high-temperature
binder grade with increasing traffic levels. Based on VDOT’s success with binder bumping in Marshall designs while maintaining a given compaction level, this concept should be investigated for Superpave.
ACKNOWLEDGMENTS
The author appreciates the help and advice of Richard Schreck, Bill Maupin, Jr., Chuck Hughes, and Bob Horan during the research and review of this work. The author greatly appreciates the efforts of Donnie Dodds and his exceptional binder testing and Mike Dudley and Shane Davis for their work with the asphalt pavement analyzer. Without their hard work testing and collecting data, there would be nothing to report!
REFERENCES American Society of Testing and Materials. (1998). Annual Book of Standards. (Vol. 04.03).
Philadelphia: Author. American Association of State Highway and Transportation Officials. (1997). Standard
Specifications for Transportation Materials and Methods of Sampling and Testing, 18th ed. Washington, DC: Author.
American Association of State Highway and Transportation Officials. (1998). AASHTO
Provisional Standards. Washington, DC: Author. Asphalt Institute. (1994). Superpave Performance Graded Asphalt Binder Specification and
Testing. Superpave Series No. 1 (SP-1). Lexington, KY: Author. Federal Highway Administration. (1998). LTPPBIND, Version 2.0. Washington, DC: Author.
Georgia Department of Transportation. (1997). Method of Test for Determining Rutting
Susceptibility Using the Asphalt Pavement Analyzer. GDT-115. Forest Park: Author.

19
Heritage Research Group. (1993). SHRP Asphalt Binder Specifications. Indianapolis, IN:
Author. Huber, G.A. (1994). Weather Data base for the SUPERPAVE Mix Design System. SHRP-A-
648A. Washington, DC: Strategic Highway Research Program, National Research Council.
Kennedy, T.W., Cominsky, R. J., Harrigan, E. T., & Leahy, R. B. (1990). The SHRP Asphalt
Research Program: 1990 Strategic Planning Document. SHRP-A/UWP-90-007. Washington, DC: Strategic Highway Research Program, National Research Council.
Maupin, G. W., Jr. (1998). Comparison of Several Asphalt Design Methods. VTRC No. 98-
R15. Charlottesville: Virginia Transportation Research Council. Mohseni, A., & Symons, M. Improved AC Pavement Temperature Models from LTPP Seasonal
Data. Preprint. 1998 Annual Meeting of Transportation Research Board, Washington, DC.
Staff. (1993, Fall). SHRP Binder Grading System Based on Pavement Design Temperatures.
Asphalt Technology News, Vol. 5, No. 2, pp. 1-8. Transportation Research Board. (1984). America’s Highways: Accelerating the Search for
Innovation. Special Report No. 202. Washington, DC: Author. Walpole, R. E., & Myers, R. H. (1985). Probability and Statistics for Engineers and Scientists.
New York: Macmillan Publishing Company. Williams, R. C., & Prowell, B. D. Comparison of Laboratory Wheel Tracking Results to
WesTrack Performance. Preprint. 1999 Annual Meeting of the Transportation Research Board, Washington, DC.

APPENDIX AGUIDELINES FOR USE OF ASPHALT CONCRETE MIXES
OCTOBER 19, 1996
ASPHALT MIXES. The attached guidelines for use of asphalt concrete mixes are based on current use of existing mixes and expected use of new mixes. Surface and intermediate mixes are not intended to be used to solve problems associated with structural deficiencies in the pavement structure. An evaluation should be made in situations of severe pavement distress and early failure to determine structural deficiencies. We recognize that funds may not be available to provide the most desirable solution; however, decisions should be made with the best information available and with a knowledge of the expected performance. ENGINEERING AND COST ANALYSIS. District materials and maintenance personnel should use the performance of existing mixes to determine if these guidelines are applicable to their regions. Virginia has minimized problems with rutting and skid resistance, but our pavement surfaces are not lasting as long as they should. Careful consideration for use of the existing mixes and proper use of the new mixes is expected to provide longer service life for our pavements. The selection of individual mixes should be based on an engineering and cost evaluation of each site for repair and rehabilitation where possible. Life cycle cost analysis of the strategy and mix type to be used is important in justifying the proper use of available funds. MIX DESIGNATION. The mix types are represented by surface (SM), intermediate (IM), and base (BM) types, which are commonly referred to as dense-graded mixes. The stone matrix asphalt (SMA) is a gap-graded mix that is available for use with a separate special provision. An SMA is recommended for placements of 2,000 tons or more and only in heavy traffic conditions due to cost and special considerations in design, production, and placement of the mix in either its surface or intermediate form. The current list of mix types appears long due to the introduction of new mix types as well as the retention of the current mixes that have performed well in some areas of the state. The new mixes should outperform the existing mixes in certain applications in many areas of the state. PLACEMENT. Generally, the larger the maximum size aggregate in the mix, the greater load-carrying capacity the mix should have. Also, the larger the maximum size aggregate in the mix, the more difficult the mix is to place smoothly and the greater potential for raveling if exposed to traffic. Normal application rates for each mix is a part of this guide; however, each area should determine the application rates for each mix based on experience. The minimum and maximum application rates for each placement (lift) of asphalt material are given based on nominal maximum aggregate size in Section 315.05(c) as amended. The nominal maximum size aggregate for each mix shall be the largest sieve size on which aggregate can be retained as indicated in the design range shown in Section 211.03. PERFORMANCE-GRADED ASPHALT. The change to performance grade (PG) asphalt cement material is a national move with which Virginia will comply. The first number of a PG grading indicates the high temperature stiffness of the asphalt; the higher the number, the stiffer the material. The lower number indicates the low-temperature properties of the material. We have decided that a low temperature rating of -22 will be effective in all applications in Virginia. A PG 64-22 is roughly equivalent to a viscosity grading of AC-20, and a PG 70-22 is slightly stiffer that an AC-30. A PG 76-22 will be significantly stiffer than an AC-30. The stiffer the asphalt mix, the more costly it will be due to the cost of the asphalt cement material and possibly the greater difficulty in the handling and placement of the mix. CAUTION: The use of the stiffer asphalt mixes [Mix types C, D, E, (M) and (S)] will be more difficult to place in cool weather (spring, fall, and at night) and after long hauls. Higher-than-normal mix and placement temperatures are recommended. MARSHALL DESIGN. The 50- and 75-blow Marshall design parameter has been retained due to the good performance of the 75-blow mixes in some areas. A 75-blow mix increases the compactive effort for the mix design procedure and attempts to simulate heavier traffic loading than a 50-blow design. The result is less asphalt in the mix, which in some cases has resulted in a less than desirable pavement life. An alternative choice to the 75-blow
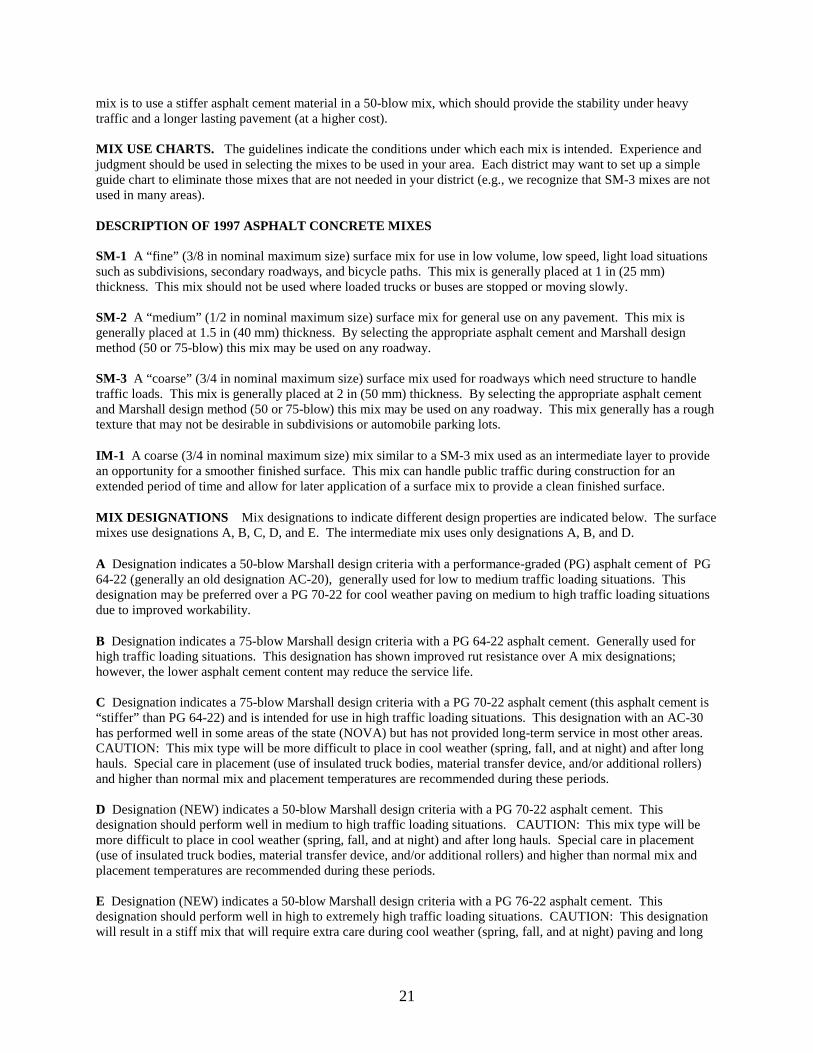
21
mix is to use a stiffer asphalt cement material in a 50-blow mix, which should provide the stability under heavy traffic and a longer lasting pavement (at a higher cost). MIX USE CHARTS. The guidelines indicate the conditions under which each mix is intended. Experience and judgment should be used in selecting the mixes to be used in your area. Each district may want to set up a simple guide chart to eliminate those mixes that are not needed in your district (e.g., we recognize that SM-3 mixes are not used in many areas). DESCRIPTION OF 1997 ASPHALT CONCRETE MIXES SM-1 A “fine” (3/8 in nominal maximum size) surface mix for use in low volume, low speed, light load situations such as subdivisions, secondary roadways, and bicycle paths. This mix is generally placed at 1 in (25 mm) thickness. This mix should not be used where loaded trucks or buses are stopped or moving slowly. SM-2 A “medium” (1/2 in nominal maximum size) surface mix for general use on any pavement. This mix is generally placed at 1.5 in (40 mm) thickness. By selecting the appropriate asphalt cement and Marshall design method (50 or 75-blow) this mix may be used on any roadway. SM-3 A “coarse” (3/4 in nominal maximum size) surface mix used for roadways which need structure to handle traffic loads. This mix is generally placed at 2 in (50 mm) thickness. By selecting the appropriate asphalt cement and Marshall design method (50 or 75-blow) this mix may be used on any roadway. This mix generally has a rough texture that may not be desirable in subdivisions or automobile parking lots.
IM-1 A coarse (3/4 in nominal maximum size) mix similar to a SM-3 mix used as an intermediate layer to provide an opportunity for a smoother finished surface. This mix can handle public traffic during construction for an extended period of time and allow for later application of a surface mix to provide a clean finished surface.
MIX DESIGNATIONS Mix designations to indicate different design properties are indicated below. The surface mixes use designations A, B, C, D, and E. The intermediate mix uses only designations A, B, and D.
A Designation indicates a 50-blow Marshall design criteria with a performance-graded (PG) asphalt cement of PG 64-22 (generally an old designation AC-20), generally used for low to medium traffic loading situations. This designation may be preferred over a PG 70-22 for cool weather paving on medium to high traffic loading situations due to improved workability.
B Designation indicates a 75-blow Marshall design criteria with a PG 64-22 asphalt cement. Generally used for high traffic loading situations. This designation has shown improved rut resistance over A mix designations; however, the lower asphalt cement content may reduce the service life. C Designation indicates a 75-blow Marshall design criteria with a PG 70-22 asphalt cement (this asphalt cement is “stiffer” than PG 64-22) and is intended for use in high traffic loading situations. This designation with an AC-30 has performed well in some areas of the state (NOVA) but has not provided long-term service in most other areas. CAUTION: This mix type will be more difficult to place in cool weather (spring, fall, and at night) and after long hauls. Special care in placement (use of insulated truck bodies, material transfer device, and/or additional rollers) and higher than normal mix and placement temperatures are recommended during these periods. D Designation (NEW) indicates a 50-blow Marshall design criteria with a PG 70-22 asphalt cement. This designation should perform well in medium to high traffic loading situations. CAUTION: This mix type will be more difficult to place in cool weather (spring, fall, and at night) and after long hauls. Special care in placement (use of insulated truck bodies, material transfer device, and/or additional rollers) and higher than normal mix and placement temperatures are recommended during these periods. E Designation (NEW) indicates a 50-blow Marshall design criteria with a PG 76-22 asphalt cement. This designation should perform well in high to extremely high traffic loading situations. CAUTION: This designation will result in a stiff mix that will require extra care during cool weather (spring, fall, and at night) paving and long

22
haul situations. Special care in placement (use of insulated truck bodies, material transfer device, and/or additional rollers) and higher than normal mix and placement temperatures are recommended during these periods.
BM-1 A base mix using suitable local material. A 3/4 in nominal maximum size mix placed at 1.5 in (40 mm) or more thickness. This mix has generally been restricted to use on the Eastern Shore.
BM-2 A base mix for general use on any roadway. A 1 in nominal maximum size mix generally placed at 2.5 in (60 mm) or more thickness. This base does not require an intermediate course to provide for a smooth finished surface. Public traffic should not be permitted on this material for extended periods of time without restrictions.
BM-3 A base mix for use on heavy (thick) new pavements. A 1.5 in nominal maximum size mix generally placed at 3 in (75 mm) or more. This base needs an intermediate course to ensure a smooth finished surface. Public traffic should not be permitted on this material for any extended period of time. Modified (M) Designation indicates a polymer-modified PG 76-22 asphalt cement. This modification has improved elastic properties and should be used in extreme traffic loading situations or in cases of expected reflection cracking. A higher cost can be justified by significantly improved performance over other mixes. CAUTION: This designation will result in a stiff mix that will require extra care during cool weather (spring, fall, and at night) paving and long haul situations. Special care in placement (use of insulated truck bodies, material transfer device, and/or additional rollers) and higher than normal mix and placement temperatures are recommended during these periods.
Stabilized (S) Designation indicates the incorporation of an approved stabilizing additive from the Department’s approved list in the Materials Division Manual of Instructions. This designation should be used in extreme traffic loading situations where other mixes are expected to rut, push or shove. This designation does not provide improved resistance to reflective cracking over normal mix designations. CAUTION: This designation will result in a stiff mix that will require extra care during cool weather (spring, fall and at night) paving and long haul situations. Special care in placement (use of insulated truck bodies, material transfer device, and/or additional rollers) and higher than normal mix and placement temperatures are recommended during these periods.
Stone Matrix Asphalt (SMA) Designation is a special mix using a gap-graded aggregate, asphalt cement of specified PG grading, mineral filler, and fibers. This mix should be used for heavy to extremely heavy traffic situations where an expected higher cost can be justified with improved performance over other mixes.
23
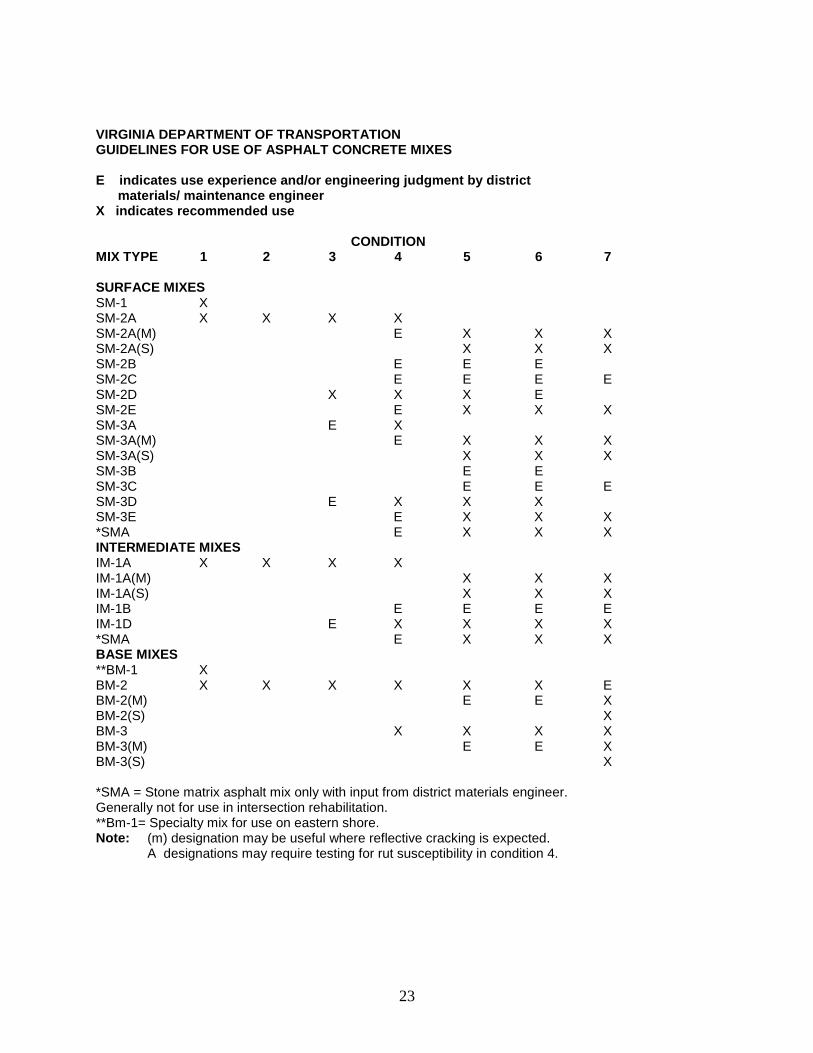
VIRGINIA DEPARTMENT OF TRANSPORTATION GUIDELINES FOR USE OF ASPHALT CONCRETE MIXES E indicates use experience and/or engineering judgment by district materials/ maintenance engineer X indicates recommended use CONDITION MIX TYPE 1 2 3 4 5 6 7 SURFACE MIXES SM-1 X SM-2A X X X X SM-2A(M) E X X X SM-2A(S) X X X SM-2B E E E SM-2C E E E E SM-2D X X X E SM-2E E X X X SM-3A E X SM-3A(M) E X X X SM-3A(S) X X X SM-3B E E SM-3C E E E SM-3D E X X X SM-3E E X X X *SMA E X X X INTERMEDIATE MIXES IM-1A X X X X IM-1A(M) X X X IM-1A(S) X X X IM-1B E E E E IM-1D E X X X X *SMA E X X X BASE MIXES **BM-1 X BM-2 X X X X X X E BM-2(M) E E X BM-2(S) X BM-3 X X X X BM-3(M) E E X BM-3(S) X *SMA = Stone matrix asphalt mix only with input from district materials engineer. Generally not for use in intersection rehabilitation. **Bm-1= Specialty mix for use on eastern shore. Note: (m) designation may be useful where reflective cracking is expected. A designations may require testing for rut susceptibility in condition 4.

24
VIRGINIA DEPARTMENT OF TRANSPORTATION GUIDELINES FOR USE OF ASPHALT CONCRETE MIXES
Note: Traffic loading involves a judgment on average daily traffic, truck %, and truck type or weight. CONDITION
1 SUBDIVISION, RESIDENTIAL, LOW-VOLUME SECONDARY AND URBAN VERY LOW TRAFFIC LOADING (TRUCK % AND/OR VOLUME) 2 AUTOMOBILE PARKING LOTS, REST AREAS, AND COMMUTER LOTS 3 *SECONDARY, URBAN AND PRIMARY ROUTES WITH LOW TRAFFIC LOADING (0% TO 10% TRUCKS AND LOW VOLUME) AVERAGE GRADES WITH NORMAL TRAFFIC SPEED 4 *SECONDARY, PRIMARY, URBAN AND INTERSTATE WITH MEDIUM TRAFFIC LOADING, NORMAL GRADES AND SPEEDS (10% TO 20% TRUCKS AND/OR MEDIUM VOLUME) HEAVY SECONDARY, MODERATE PRIMARY ROUTES, LOW-VOLUME INTERSTATE 5 *SECONDARY, PRIMARY, URBAN AND INTERSTATES WITH HEAVY TRAFFIC LOADING OR MODERATE TO SLOW SPEED (OVER 20% TRUCKS AND/OR HIGH VOLUME) URBAN , QUARRY AND INDUSTRIAL ROUTES 6 SECONDARY, PRIMARY, URBAN AND INTERSTATES WITH EXTREME TRAFFIC LOADING OR HEAVY LOADS WITH LOW
SPEEDS
(OVER 20% TRUCKS, ANY VOLUME) HEAVY SECONDARY, URBAN OR PRIMARY, AVERAGE INTERSTATE, COAL ROADS 7 EXTREME LOADINGS, LOW SPEED, EXISTING SITE WITH POOR MIX PERFORMANCE, WITHOUT STRUCTURAL DEFICIENCY (SURFACE MIXES ONLY)
TRUCK CLIMBING LANES, HEAVY INTERSTATE SUBJECT TO SLOW TRAFFIC, INTERSECTIONS WITH HEAVY TRUCKS, TRUCK PARKING AREAS HEAVY URBAN TRAFFIC WITH BUSES *Low-speed bus and truck traffic may warrant a higher condition.

25
VIRGINIA DEPARTMENT OF TRANSPORTATION GUIDELINES FOR ASPHALT CONCRETE APPLICATION RATES Depth per Lift Normal Recommended
Mix Type Aggregate Size Min-Max Application Rate * SM-1 3/8 inch 1-1.25 inches 1.25 inches-135 lb/sy SM-2 A,B,C,D,E 1/2 inch 1.25-2 inches 1.5 inches-165 lb/sy SM-3 A,B,C,D,E 3/4 inch 2-2.5 inches*** 2 inches-220 lb/sy IM-1 A,B,D 3/4 inch 2-2.5 inches*** 2 inches-220 lb/sy BM-1 3/4 inch 2-3 inches ** BM-2 1 inch 2.5-4 inches ** BM-3 1.5 inches 3-6 inches**** **
*Application rate is based on 110 pounds per square yard per inch of thickness. **Application rate for BM mixes should be determined from the actual specific gravity of the mixture as called for by VDOT’s Materials Division or by region as indicated in the chart “Density of Base Asphalt Mixes for Approximate Quantity Calculations." ***Depth per lift for shoulders can be a maximum of 3 inches. ****Low density may result when placing a 6-inch lift. The maximum thickness may be reduced if the mixture cannot be adequately placed in a single lift and compacted to required uniform density and smoothness.

26
VIRGINIA DEPARTMENT OF TRANSPORTATION DENSITY OF BASE ASPHALT MIXES FOR APPROXIMATE QUANTITY CALCULATIONS
DISTRICT AREAS-BASE MIX lb/SY/In
Bristol Abingdon-Marion-Wytheville-Galax 115 Bluefield-Big Stone Gap-Woodway-Bristol 112 Salem Buchanan-Roanoke-Salem-Radford-Martinsville 114 Lynchburg
Lynchburg Danville South Boston
113 110 111
Richmond 110 Suffolk 110 Fredericksburg 110 Culpeper
Charlottesville Culpeper-Flint Hill
118 113
Staunton 112 NOVA Arlington-Fairfax 122 The weights of the asphalt mixtures are based on 95% of theoretical maximum density. Note: To be used only if specific rates are not provided in the Pavement Design Report by VDOT’s Materials Division.

APPENDIX B

31
Virginia Test Method
for
Method of Test for Determining Rutting Susceptibility Using the Asphalt Pavement Analyzer
Designation: VTM-110
1. Scope
1.1 This method describes a procedure to test the rutting susceptibility of asphalt-aggregate mixtures using the Asphalt Pavement Analyzer (APA).
2. Significance and Use
2.1 This method is used for the laboratory evaluation of the rutting susceptibility of hot-mix asphalt. Both laboratory and field produced mix can be tested and compared to pre-determined criteria. The allowable rut depth criterion is based on expected traffic loading and mix type.
3. Apparatus
3.1 Asphalt Pavement Analyzer (APA) – A thermostatically controlled device designed to test the rutting susceptibility of hot mix asphalt by applying repetitive linear loads to compacted test specimens through pressurized hoses.
3.1.1 The APA shall be thermostatically controlled to maintain the test temperature and
conditioning chamber at any set point between 30o and 60o C within 1oC (86° and 140° F within 1.8 °F).
3.1.2 The APA shall be capable of independently applying loads up to 533 N (120 lb) to the three wheels. The loads shall be calibrated to the desired test load by an external force transducer.
3.1.3 The pressure in the test hoses shall be adjustable and capable of maintaining pressure up to 830 kPa (120 psi).
3.1.4 The APA shall be capable of testing three beam specimens or six cylindrical specimens simultaneously.
3.1.5 The APA shall have a programmable master cycle counter which can be preset to the desired number of cycles for a test. The APA shall be capable of automatically stopping the test at the completion of the programmed number of cycles.
3.1.6 The hoses shall be Gates 77B Paint Spray and Chemical ¾ in (19.0 mm), 750 psi (5.17 MPa), W.P. GL 07148. The hoses should be replaced when any of the outer rubber casing has worn through and threads are exposed. Follow the APA manufacturer’s instructions for the technique on replacing hoses.
3.2 Balance, 12,000 gram capacity, accurate to 0.1 gram. 3.3 Mixing utensils (bowls, spoon, spatula). 3.4 Ovens for heating aggregate and asphalt cement. 3.5 Compaction device and molds.
4. Calibration
4.1 Temperature calibration of the APA and specimen preheating oven – the APA and pre-heating ovens must be calibrated with a NIST traceable thermometer (an ASTM 65 C calibrated thermometer is recommended) and a metal thermometer well to avoid rapid heat loss when checking the temperature.
32
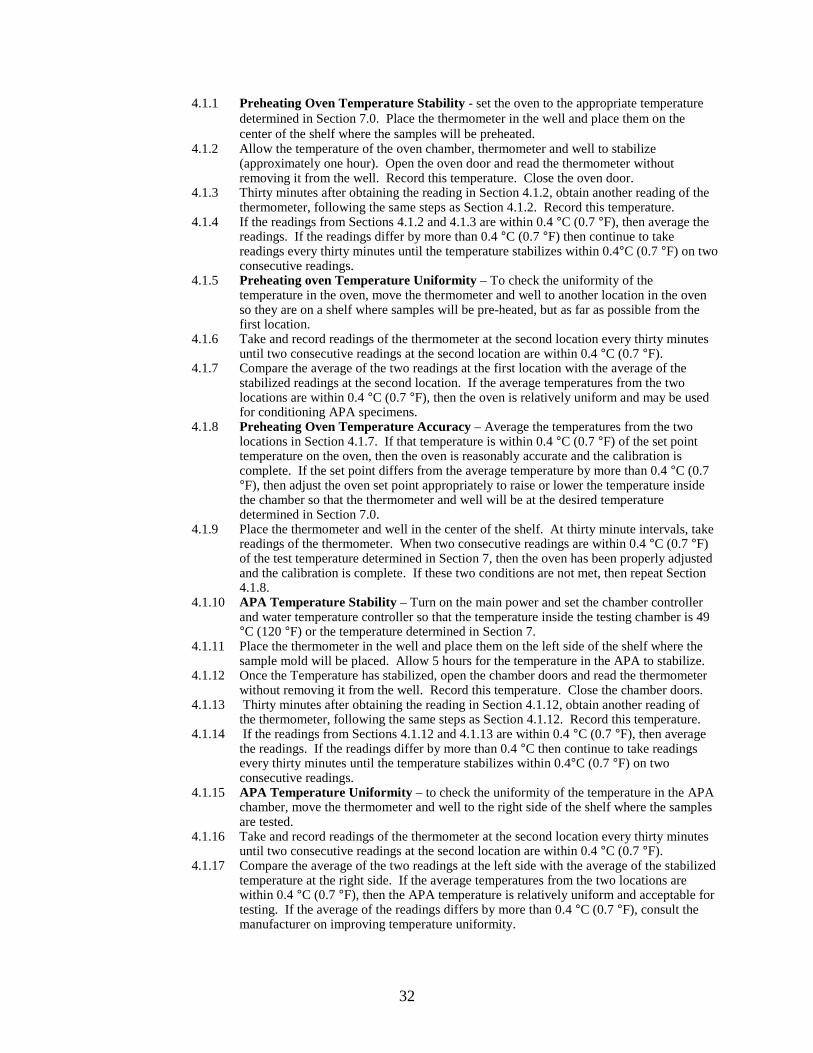
4.1.1 Preheating Oven Temperature Stability - set the oven to the appropriate temperature determined in Section 7.0. Place the thermometer in the well and place them on the center of the shelf where the samples will be preheated.
4.1.2 Allow the temperature of the oven chamber, thermometer and well to stabilize (approximately one hour). Open the oven door and read the thermometer without removing it from the well. Record this temperature. Close the oven door.
4.1.3 Thirty minutes after obtaining the reading in Section 4.1.2, obtain another reading of the thermometer, following the same steps as Section 4.1.2. Record this temperature.
4.1.4 If the readings from Sections 4.1.2 and 4.1.3 are within 0.4 °C (0.7 °F), then average the readings. If the readings differ by more than 0.4 °C (0.7 °F) then continue to take readings every thirty minutes until the temperature stabilizes within 0.4°C (0.7 °F) on two consecutive readings.
4.1.5 Preheating oven Temperature Uniformity – To check the uniformity of the temperature in the oven, move the thermometer and well to another location in the oven so they are on a shelf where samples will be pre-heated, but as far as possible from the first location.
4.1.6 Take and record readings of the thermometer at the second location every thirty minutes until two consecutive readings at the second location are within 0.4 °C (0.7 °F).
4.1.7 Compare the average of the two readings at the first location with the average of the stabilized readings at the second location. If the average temperatures from the two locations are within 0.4 °C (0.7 °F), then the oven is relatively uniform and may be used for conditioning APA specimens.
4.1.8 Preheating Oven Temperature Accuracy – Average the temperatures from the two locations in Section 4.1.7. If that temperature is within 0.4 °C (0.7 °F) of the set point temperature on the oven, then the oven is reasonably accurate and the calibration is complete. If the set point differs from the average temperature by more than 0.4 °C (0.7 °F), then adjust the oven set point appropriately to raise or lower the temperature inside the chamber so that the thermometer and well will be at the desired temperature determined in Section 7.0.
4.1.9 Place the thermometer and well in the center of the shelf. At thirty minute intervals, take readings of the thermometer. When two consecutive readings are within 0.4 °C (0.7 °F) of the test temperature determined in Section 7, then the oven has been properly adjusted and the calibration is complete. If these two conditions are not met, then repeat Section 4.1.8.
4.1.10 APA Temperature Stability – Turn on the main power and set the chamber controller and water temperature controller so that the temperature inside the testing chamber is 49 °C (120 °F) or the temperature determined in Section 7.
4.1.11 Place the thermometer in the well and place them on the left side of the shelf where the sample mold will be placed. Allow 5 hours for the temperature in the APA to stabilize.
4.1.12 Once the Temperature has stabilized, open the chamber doors and read the thermometer without removing it from the well. Record this temperature. Close the chamber doors.
4.1.13 Thirty minutes after obtaining the reading in Section 4.1.12, obtain another reading of the thermometer, following the same steps as Section 4.1.12. Record this temperature.
4.1.14 If the readings from Sections 4.1.12 and 4.1.13 are within 0.4 °C (0.7 °F), then average the readings. If the readings differ by more than 0.4 °C then continue to take readings every thirty minutes until the temperature stabilizes within 0.4°C (0.7 °F) on two consecutive readings.
4.1.15 APA Temperature Uniformity – to check the uniformity of the temperature in the APA chamber, move the thermometer and well to the right side of the shelf where the samples are tested.
4.1.16 Take and record readings of the thermometer at the second location every thirty minutes until two consecutive readings at the second location are within 0.4 °C (0.7 °F).
4.1.17 Compare the average of the two readings at the left side with the average of the stabilized temperature at the right side. If the average temperatures from the two locations are within 0.4 °C (0.7 °F), then the APA temperature is relatively uniform and acceptable for testing. If the average of the readings differs by more than 0.4 °C (0.7 °F), consult the manufacturer on improving temperature uniformity.

33
4.1.18 APA Temperature Accuracy – Average two temperatures from the two locations determined in Sections 4.1.14 and 4.1.16 are within 0.4 °C (0.7 °F) of 49.0 °C (120 °F) or the temperature determined in Section 7.0, then the APA temperature calibration is complete. If the set point differs from the average temperature by more than 0.4 °C (0.7 °F), then adjust the APA chamber and water set point appropriately to raise or lower the temperature inside the chamber so that the thermometer and well will be at 49 °C (120 °F) or the desired temperature determined in Section 7.0.
4.1.19 Place the thermometer and well in the center of the shelf. At thirty minute intervals, take readings of the thermometer. When two consecutive readings are within 0.4 °C (0.7 °F) of 49 °C (120 °F) or the test temperature determined in Section 7, then the APA has been properly adjusted and the calibration is complete. If these two conditions are not met, then repeat Section 4.1.18
4.2 APA Wheel Load Calibration – The APA Wheel Loads will be checked with the calibrated load
cell provided with the APA. The loads will be checked and adjusted one at a time while the other wheels are in the down position and bearing on a dummy sample or wooden block of approximately the same height as the test sample. Calibration of the wheel loads should be accomplished with the APA at room temperature.
4.2.1 Remove the hose rack from the APA. Jog the wheel carriage until the wheels are over
the center of the sample tray when the wheels are in the down position. Raise and lower the wheels 20 times to heat the cylinders.
4.2.2 Adjust the bar on top of the load cell until the total height of the load cell – load bar assembly is 105 mm (4.1 in).
4.2.3 Position the load cell under one of the wheels. Place wooden blocks or dummy samples under the other two wheels.
4.2.4 Zero the load cell. 4.2.5 Lower all wheels by turning the cylinder switch to CAL. 4.2.6 If the load cell is not centered left to right beneath the wheel, raise the wheel and adjust
the position of the load cell. When the wheel is centered left to right, it should be centered front to back by unlocking the sample tray and SLOWLY moving front to back until the wheel rests in the indentation on the load cell bar.
4.2.7 Adjust the pressure in the wheel cylinder to obtain 533 ± 4.5 N (120 ± 1 lb). Allow three minutes for the load cell reading to stabilize between adjustments. Record the pressure and the load.
4.2.8 With the wheel on the load cell remaining in the down position, raise and lower the other wheels one time. Allow three minutes for the load cell to stabilize. Record the pressure and load.
4.2.9 With the other wheels remaining in the down position, raise and lower the wheel over the load cell one time. Allow three minutes for the load cell to stabilize. Record the pressure and load.
4.2.10 Repeat Sections 4.2.3 through 4.2.9 for each wheel/cylinder. 4.2.11 Return the load cell to the first wheel and repeat Sections 4.2.3 through 4.2.9. 4.2.12 Place the load cell under the second wheel and repeat Sections 4.2.3 through 4.2.9 4.2.13 Place the load cell under the third wheel and repeat Sections 4.2.3 through 4.2.9 4.2.14 The current cylinder pressures will be used to set the wheel loads to 533 ± 4.5 N (120 ±
1 lb). 5.0 Preparation of Test Specimens
5.1 Number of test specimens – One test will either be three 75 mm x 125 mm x 300 mm ( 3 in x 5 in x 12 in) beam specimens or six cylindrical 150 mm diameter x 75 mm (6 in diameter x 3 in) specimens.

34
5.2 Field-Compacted Specimens
5.2.1 Roadway core specimens shall be 150 mm (6 in) diameter with all surfaces of the perimeter perpendicular to the surface of the core within 5 mm. Cores shall be trimmed with a wet masonry saw to a height of 75 ± 3 mm (3.0 ± 0.1 in). The cores shall have a snug fit in the APA mold or be shimmed with Plaster-of-Paris.
5.2.2 Roadway beam specimens shall be 75 mm x 125 mm x 300 mm (3 in x 5 in x 12 in) with a wet masonry saw. All surfaces of the perimeter perpendicular to the surface of the core within 5 mm (0.2 in). The beams shall have a snug fit in the APA mold or be shimmed with Plaster-of-Paris.
5.3 Plant-Produced Mixtures
5.3.1 Samples of plant produced mixtures shall be obtained in accordance with AASHTO T 169. Mixture samples shall be reduced to the appropriate test size recommended in Section 12.0, placed in a covered metal container and heated to the appropriate compaction temperature recommended in Section 211.03 (d) 6 of the specifications.
5.3.2 Samples shall be compacted according to Section 5.5
5.4 Laboratory-Prepared Mixtures
5.4.1 Mixture proportions are batched in accordance to the desired Job Mix Formula. Required batch sizes are determined in accordance with Section 13.
5.4.2 The asphalt binder and aggregate shall be heated to the temperature specified in Section 211.03 (d) 6 of the specifications.
5.4.3 Dry mix aggregates and hydrated lime (when lime is used) first, then add the optimum or other specified percentage of asphalt cement. Mix the material until all aggregates are thoroughly coated.
5.4.4 Test samples shall be short term oven aged in accordance with AASHTO PP2-99 at the appropriate compaction temperature recommended in Section 211.03 (d) 6 of the specifications.
5.4.5 Samples shall be compacted according to Section 5.5
5.5 Laboratory Compaction of Specimens
5.5.1 One of several devices may be used to compact specimens in the laboratory. Details regarding the procedures for compacting specimens in each device should be referenced to the equipment manufacturer’s instructions.
Note: Recent studies have shown that samples compacted with different laboratory compaction devices may have significantly different results. Virginia’s existing criterion is based on beam specimens. New criteria would need to be developed for cylindrical specimens
5.5.2 Laboratory prepared specimens shall be compacted to contain 8.0 � 0.5% air voids. 5.5.3 Compacted specimens should be left at room temperature (approximately 25oC [77 °F])
to allow the entire specimen to cool for a minimum of 3 hours.
METHOD A - Vibrating Compaction
5.5.4 Apparatus - Asphalt Vibratory Compactor, Model AVC II. Note: prior to compacting samples the compaction head on the AVC II needs to be calibrated to produce a sample height of 3 in (75 mm) following the manufacturer’s instructions. Be sure to include both the base plate and the silicone coated cardboard specimen disk when calibrating the height.
5.5.5 The following specimen compaction procedures can be used for compacting beam specimens.

35
5.5.6 Temperature of the loose mixture at the starting of the compaction should be within ± 5 °C (± 9 °F) of the specified compaction temperature for the mixture. Place the specimen mold on top of a counter adjacent to the compaction machine. Insert a preheated base plate into the mold. Remove loose HMA from the oven and pour the entire batch into the mold. Level the mixture, rod the mixture 20 times around the perimeter and 20 times evenly dispersed across the center of the sample. Form the sample into a slight mound. Place a silicone coated, cardboard specimen disk on top of the sample.
5.5.7 Transfer the specimen mold to the supporting base of the machine and fit it in the recessed area.
5.5.8 Set the control unit CYCLE TIME to 30 seconds (More time may be necessary to compact harsh mixtures). Turn MODE switch to AUTO, VIBRATING switch to AUTO, and pull up (disable) the EMERGENCY STOP.
5.5.9 Press both green palm buttons simultaneously (you do not need to hold down the palm buttons once the vibrators start). This will cause the vibrating assembly to move downward automatically and when it gets down to a certain position, the vibrating actions will be activated automatically. Under the static compression force and the vibrating actions, the compaction head will move downward to consolidate and compact the loose asphalt mixture confined in the specimen mold for 30 seconds. For most dense-graded HMA, compaction will be achieved in less than 10 seconds after the vibration is activated. At this point, the bottom surface of the vibrating assembly base plate will be in contact with the top surface of the specimen mold and the compaction head is “bottomed out.” When this occurs, turn the vibratory control from “auto” to “off.” This will help level the specimen. After the compaction time is completed, the vibrating compaction assembly will automatically retract. This completes the compaction operations. If at the end of the vibrating time the bottom surface of the vibrating assembly base plate is not in contact with the top surface of the specimen mold, this implies that the specimen has not been compacted to the specified density. Rotate the mold 180° and re-compact.
5.5.10 Lift the specimen mold from the compaction position, move forward and slide the edges of the specimen mold under the restraining brackets and position the specimen mold in the recessed area at the extruding support base.
5.5.11 On the control unit, turn the MODE switch to EJECT. Press and hold down both green palm buttons to raise the extrusion cylinder head to extrude the specimen out of the mold. Remove the compacted specimen with the base plate together from the rigid bottom of the mold and place them on a firm counter top. Press the OPEN button on the control unit to retract the extrusion cylinder head. Then remove the specimen mold from the extrusion supporting base.
5.5.12 Compacted specimens should be left at room temperature (approximately 25oC) to allow the entire specimen to cool for a minimum of 3 hours. After this time, the base plate should be heated with a propane torch or heat gun to facilitate removal.
METHOD B - Superpave Gyratory Compaction
5.5.13 Apparatus (see AASHTO TP4)
5.5.14 Compaction of cylindrical specimens with the Superpave Gyratory Compactor can be accomplished in several ways. Specimens can be compacted directly to the specified height of 75 mm, or specimens can be compacted to the number of gyrations at which the target air void content of 8.0 �1.0% has been estimated.
5.515 Remove the mold and base plate from the oven set at the compaction temperature. Place a paper disc in the bottom of the mold assembly.
5.5.16 Check the temperature of the loose mixture and verify it is within the limits of Section 211.03 (d) 6 of the specifications. Transfer the mixture to the mold with care to avoid segregation of the mixture. Place a paper disk on the top of the mixture.
5.5.17 Place the mold and mixture in the Superpave Gyratory Compactor and begin compaction as described in the compactor’s operation manual.

36
5.5.18 When the compaction procedure is completed, remove the mold and compacted specimen from the compactor. Extrude the specimen from the mold with care to avoid distorting the specimen until it is cooled.
6.0 Determining Air Void Contents
6.1 Determine the bulk specific gravity of the test specimens in accordance with AASHTO T 166
(ASTM D 2726). 6.2 Determine the maximum specific gravity of the test mixture in accordance with AASHTO T 209
(ASTM D 2041). 6.3 Determine the air voids contents of the test specimens in accordance with AASHTO T 269
(ASTM D 3203). 7.0 Selecting The Test Temperature
7.1 The test temperature should be representative of the environment in which the paving mixture will be utilized. The standard test temperature for Virginia is 120 °F (49 °C). The LTPPBind software, available from FHWA, can be used to determine a precise temperature for a specific project location.
7.2 LTPPBind software version 2.0 7.2.1 Select the depth to surface of layer at 0 mm (0 in) for surface mixtures. For evaluating
other layers in the pavement structure, select the depth in millimeters to the top of the layer. The LTPPBind software will determine the high pavement design temperature 20 mm (0.8 in) below the input depth as used in binder grade selection and mixture performance modeling.
7.2.2 Use the map to select the project location. The high temperature for the nearest weather station will be displayed. For projects with low traffic loads (i.e. < 10 million ESAL’s) the temperature corresponding to 50 percent reliability should be used; for projects with high traffic loads, the temperature corresponding to 98 percent reliability should be used.
8.0 Specimen Preheating
8.1 Place the specimens in the molds. 8.2 Specimens shall be preheated in the temperature calibrated APA test chamber or a separate
calibrated oven for a minimum of 4 hours. Specimens should not be held at elevated temperatures for more than 24 hours prior to testing
9.0 Rut Test Procedure
9.1 Set the hose pressure gage reading to 830+/- 35 kPa (120 +/- 5 psi). Set the load cylinder pressure reading for each wheel to achieve a load o533 ± 4.5 N (120 ± 1 lb).
9.2 Stabilize the testing chamber temperature at 49 °C (120 °F) unless otherwise specified. 9.3 Secure the preheated, molded specimens in the APA. The preheated APA chamber should not be
opened more than 6 minutes while the test specimens are secured in the machine. Close the chamber doors and allow 10 minutes for the temperature to restabilize prior to starting the test.
9.4 Apply 10 cycles to seat the specimens before the initial measurements. Make adjustments to the hose pressure as needed during the 10 cycles.
9.5 Open the chamber doors, unlock and pull out the sample holding tray. 9.6 Place the rut depth measurement template over the specimen. Make sure that the rut depth
measurement template is properly seated and firmly rests on top of the testing mold without rocking.
9.7 Zero the digital measuring gauge so that the display shows 0.00 mm with the gauge completely extended. The display should also have a bar below the “inc.” position. Take initial readings for beams at each of the three center locations on the template. (For cylindrical specimens, the four outside locations are used). Measurements shall be determined by placing the digital measuring

37
gauge in the template slots and sliding the gauge slowly across the each slot. Record the smallest measurement for each location to the nearest 0.01 mm.
9.8 Repeat steps 9.6 and 9.7 for each beam or set of cylinders in the testing position. All measurements shall be completed within six minutes.
9.9 Push the sample holding tray in and secure. Close the chamber doors and allow 10 minutes for the temperature to equalize.
9.10 Set the PRESET COUNTER to 8000 cycles. 9.11 Start the test. When the test reaches the number of cycles set on the counter, the APA will stop
and the load wheels will automatically retract. 9.12 Repeat steps 9.6 through 9.8 at the completion of the test. 10.0 Calculations
10.1 The rut depth at each location is determined by subtracting the measurement after 8000 cycles from the initial measurement.
10.2 Determine the average rut depth at each interval for each test position. For beam specimens, use only the three center measurements for calculating the average rut depth. For cylindrical specimens, use the average of all four measurements to calculate the average rut depth.
10.3 Calculate the average rut depth from the three test positions. Also, calculate the standard deviation for the three test positions (three beams or pairs of cores).
10.4 Outlier evaluation – If the standard deviation of the set is greater than or equal to 2.00 mm, then the position with the rut depth farthest from the average may be discarded. The testing procedure, device calibration, and test specimens should be investigated to determine possible causes for the excessive variation.
10.3 The APA rut depth for the mixture is the average of three beam specimens or six cylindrical specimens.
11.0 Report 11.1 The test report shall include the following information: 11.1.1 The laboratory name, technician name, and date of test. 11.1.2 The mixture type and description. 11.1.3 Specimen type. 11.1.4 Average air void content of the test specimens. 11.1.5 The test temperature. 11.1.6 The average rut depths to the nearest 0.1 mm at 8000 cycles. 12.0 NONMANDATORY INFORMATION Calculation of Specimen Masses 12.1 Beam Specimens 12.1.1 Volume of specimen = 75 mm x 125 mm x 300 mm = 2812.5 cm3. 12.1.2 Total mass of beam specimen, g = Gmm @ Opt. A.C. x 0.94 x 2812.5 cm3 12.2 Cylindrical Specimens 12.2.1 Volume of Specimen = (1/4π x (150 mm)2 x 75 mm)/1000 = 1325.4 cm3 12.2.2 Total mass of cylindrical specimen, g = Gmm @ Opt. A.C. x 0.94 x 1325.4 cm3 Note: Experience indicates the specimen weights should target a density two percent lower than the desired density.
12.3 Passing Rut Depth Criteria
Traffic ESALs Mix Type Proposed Maximum Rut Depth, mm < 3 million SM 9.5-A, SM 12.5-A, SM-2A 7.0 3 – 10 million SM 9.5-D, SM-12.-D, SM-2D 5.5 > 10 million SM 9.5-E, SM-12.5E, SM-2E 3.5

38
Note: The criteria in Section 12.3 were developed from a large data base of good performing surface mixes from Virginia. The beam specimens were compacted to 8% air voids. The beams were tested at 49 °C (120 °F), with a 533 N (120 lb) vertical wheel load and 830 kPa (120 psi) hose pressure.